

Abstract
Adolescent internalizing symptoms (e.g. depressive affect) have increased over the past decade in the US, particularly among girls. The reasons for these increases are unclear. We hypothesize that increasing exposure to politicized events has contributed to these trends in adolescent internalizing symptoms, and that effects may be differential by political beliefs and sociodemographic characteristics. We analyzed nationally-representative data from 2005 to 2018 Monitoring the Future annual cross-sectional samples of 12th-grade students (N = 86,138). We examined self-reported political beliefs, sex, and parental education as predictors of four internalizing symptom scales over time, including depressive affect. From 2005 to 2018, 19.8% of students identified as liberal and 18.1% identified as conservative, with little change over time. Depressive affect (DA) scores increased for all adolescents after 2010, but increases were most pronounced for female liberal adolescents (b for interaction = 0.17, 95% CI: 0.01, 0.32), and scores were highest overall for female liberal adolescents with low parental education (Mean DA 2010: 2.02, SD 0.81/2018: 2.75, SD 0.92). Findings were consistent across multiple internalizing symptoms outcomes. Trends in adolescent internalizing symptoms diverged by political beliefs, sex, and parental education over time, with female liberal adolescents experiencing the largest increases in depressive symptoms, especially in the context of demographic risk factors including parental education. These findings indicate a growing mental health disparity between adolescents who identify with certain political beliefs. It is therefore possible that the ideological lenses through which adolescents view the political climate differentially affect their mental wellbeing.
Keywords: Adolescents, Mental health, Depression, Political beliefs, Epidemiology
1. Introduction
Adolescent mental health in the United States has demonstrated unprecedented changes over the past decade, with consistent evidence of increasing psychiatric symptoms (Burstein, Agostino, & Greenfield, 2019; Centers for Disease Prevention and Control, 2015; Curtin, Warner, & Hedegaard, 2016; Kalb et al., 2019; Keyes, Gary, O’Malley, Hamilton, & Schulenberg, 2019; Miron, Yu, Wilf-Miron, & Kohane, 2019; Mojtabai, Olfson, & Han, 2016; Twenge, Cooper, Joiner, Duffy, & Binau, 2019). At the same time, adult mental health has remained relatively stable among most demographic groups (Brody, Pratt, & Hughes, 2018). Declines in adolescent mental health have been observed across multiple large-scale studies using several measures of psychiatric wellbeing. These studies indicate significant increases in self-reported internalizing symptoms (Centers for Disease Prevention and Control, 2015; Keyes et al., 2019; Mojtabai et al., 2016; Twenge et al., 2019) (thoughts, feelings, and behaviors that are related to both mood and anxiety disorders (Achenbach & McConaughy, 1992; Levesque and Levesque, 2011) and suicidality (Stickley & Koyanagi, 2016; Stravynski & Boyer, 2001; Valois, Zullig, Huebner, & Drane, 2004)), as well as major depressive episodes (Mojtabai et al., 2016; Twenge et al., 2019) and suicidal ideation and behavior (Centers for Disease Prevention and Control, 2015), among adolescents beginning in approximately 2010. Internalizing symptoms also include depressive affect, self-esteem, self-derogation, and loneliness, among other indicators along dimensions of mood dysregulation. Increases have been more pronounced for girls than for boys (Keyes et al., 2019; Mojtabai et al., 2016), and associations have also been observed in clinical diagnoses and hospitalization for mental health such as suicide-related hospitalizations and deaths (Burstein et al., 2019; Curtin et al., 2016; Kalb et al., 2019; Miron et al., 2019). Taken together, these findings indicate that mental health conditions among adolescents are increasing, prompting the need to identify underlying drivers.
Increases in internalizing symptoms among adolescents are likely due to multiple causes, including a growing prevalence or impact of existing risk factors and the emergence of new risk factors. A range of these factors, including substance use, online bullying, digital media use, economic distress, or political beliefs (Keyes et al., 2019; Mojtabai et al., 2016; Ozmen, Brelsford, & Danieu, 2018; Twenge et al., 2016, 2019), might be influencing worsening trends in adolescent mental health. Recent studies have focused on digital engagement and social media (Augner & Hacker, 2012; Twenge & Campbell, 2019), but research into adolescent wellbeing and depression has not convincingly demonstrated that digital technology use is driving these observed trends (Kreski et al., 2020; Odgers, 2018; Orben & Przybylski, 2019). For example, to test the strength of the association between digital technology use and well-being, Orben and Przybylski conducted specification curve analyses on three large data sources, reporting that although digital media use had a nominal negative association with well-being, adjusted estimates were minor compared to other factors like bullying (Orben & Przybylski, 2019). Technology use alone also cannot explain the apparent gender differences in internalizing symptoms over time as social media use among boys and girls is neither a strong nor consistent risk factor of depressive affect for either group (Kreski et al., 2020). Similarly, substance use has markedly declined among adolescents and failed to predict current mental health declines (Keyes et al., 2019; Mojtabai et al., 2016). These findings highlight the need for further research into the changing landscape of risk factors for adolescent mental health problems.
Adolescents in the 2010’s endured a series of significant political events that may have influenced their mental health. The first Black president, Democrat Barack Obama, was elected to office in 2008, during which time the Great Recession crippled the US economy (Mukunda, 2018), widened income inequality (Kochhar & Fry, 2014), and exacerbated the student debt crisis (Stiglitz, 2013). The following year, Republicans took control of the Congress and then, in 2014, of the Senate. Just two years later, Republican Donald Trump was elected to office, appointing a conservative supreme court and deeply polarizing the nation through erratic leadership (Abeshouse, 2019). Throughout this period, war, climate change (O’brien, Selboe, & Hayward, 2018), school shootings (Witt, 2019), structural racism (Worland, 2020), police violence against Black people (Obasogie, 2020), pervasive sexism and sexual assault (Morrison-Beedy & Grove, 2018), and rampant socioeconomic inequality (Kochhar & Cilluffo, 2018) became unavoidable features of political discourse. In response, youth movements promoting direct action and political change emerged in the face of inaction by policymakers to address critical issues (Fisher & Nasrin, 2021; Haenschen & Tedesco, 2020). Liberal adolescents may have therefore experienced alienation within a growing conservative political climate such that their mental health suffered in comparison to that of their conservative peers whose hegemonic views were flourishing. This is particularly true for less privileged groups of liberals, including girls and low SES individuals, for whom both heightened awareness and experience of conservative actions to restrict their rights may have compounded emotional distress.
One cause of increases in internalizing symptoms that has not been examined empirically is adolescents’ political beliefs. Among adults, political beliefs are associated with psychological wellbeing, with conservatives faring better than liberals (Ozmen et al., 2018; Napier & Jost, 2008; Taylor, 2008). While a full spectrum of Left to Right political affiliations and beliefs exists in the US, traditional popular discourse tends to focus on a binary between liberalism and conservatism. Liberalism in the US signals support of equal opportunity, free but semi-regulated markets, civil liberties, and social justice. Conservatism in the US signals support of individual liberty, right-wing social and religious values, and unregulated free markets. System Justification Theory (SJT) provides a clear social psychological framework through which to interpret the relationship between political beliefs and mental health (Jost and Hunyady, 2003, 2005; Jost et al., 2003, 2004). In accordance with SJT, conservatives report endorsing the existing political and social structure in the US (Napier & Jost, 2008; Taylor, 2008; Jost, Nosek, & Gosling, 2008; Weir, 2019), which may improve mental health for advantaged groups by encouraging self-aggrandizement and ignorance of the systemic oppression of others, thereby minimizing the negative impact of current events on one’s exceptional worldview (Jost et al., 2008). Among disadvantaged groups, such as those with low socioeconomic status (SES), for whom dissonance between an idealized worldview (e.g. meritocracy, justice) and experienced social degradation may be more pronounced, conservatism has not been similarly associated with improved mental health (Jost & Hunyady, 2005). Instead, support of the status quo among low SES individuals has been shown to reinforce negative self-perceptions (Jost et al., 2004; Jost & Hunyady, 2003) by encouraging individuals to normalize and accept inequality as a personal failure (Jost et al., 2003). Liberalism frequently signals a relatively greater awareness of social disparities (Jost et al., 2008) that may be damaging to mental wellbeing, especially among less privileged groups who are the targets of societal neglect; however, it is unknown if these same relationships exist for adolescents. If adolescent political beliefs operate through similar pathways to those in adults, declining trends in adolescent mental health may differ by political belief and social subgroups.
Although too young to participate in many civic processes, adolescents are able to express their political views by identifying with political beliefs that represent their feelings about social and political issues. Historically, research has indicated that adolescent political beliefs are primarily informed by parental preferences (Jennings, Stoker, & Bowers, 2009; Lyons, 2017), however, other factors including current events and access to news media impact the extent of intergenerational transmission (Dinas, 2014; Ojeda & Hatemi, 2015; Wray-Lake, 2019). Ultimately, these labels represent more than just political values, encompassing both ideological preferences and lived experiences (Lyons, 2017; Sapiro, 2004). For adolescents first asserting their independence, political beliefs may serve also as a proxy for social identity while capturing the influence of formative experiences and interactions, including those related to gender and SES (Rosenthal, Jones, & Rosenthal, 2003; Sapiro, 2004).
Adolescents who grew up during the digital technology age are more attuned to political events than prior generations (Bakker & De Vreese, 2011), likely due to ubiquitous and rapid access to online news sources (Anderson & Jiang, 2018; Roberts, 2018; Taneja, Wu, & Edgerly, 2018). Major historical events are more impactful during adolescence than at other points during the lifecourse (Schuman & Corning, 2000; Schuman & Scott, 1989), and today’s adolescents might be more affected by reporting of current events than past generations due to their persistent and elevated exposure to media coverage (Anderson & Jiang, 2018; Robb, 2017; Roberts, 2018; Taneja et al., 2018; Van Aelst et al., 2017). Their responses may also be exacerbated by mood fluctuations typical of adolescence (Bailen, Green, & Thompson, 2019; Maciejewski, Lier, Branje, Meeus, & Koot, 2015). The political lenses through which adolescents process heightened exposure to news events may therefore play a crucial role in augmenting subsequent psychological effects.
In light of the above-mentioned patterns, we hypothesize that political beliefs may contribute to downward trends in adolescent mental health. To test this hypothesis, we examine whether adolescent mental health differs by political beliefs, with the expectation that endorsing liberal beliefs will evince greater deterioration over time relative to those identifying with conservative beliefs. We further hypothesize that the influence of political beliefs on mental health also varies by social position, including sex and parental education, such that trends over time will be worse for liberals, females, and those with lower parental education. To assess the relationship between political beliefs and adolescent internalizing symptoms in the US over time, we use cross-sectional publicly-available data from a nationally representative survey of adolescents, Monitoring the Future (MTF) (National Institute on Drug Abuse, 2020; Monitoring the Future, 2021), from 2005 to 2018, the time period during which internalizing symptoms began to rapidly worsen among adolescents. Our analyses include a total eligible sample size of 86,138 12th-grade students. To date, no known research has explored recent trends in adolescent internalizing symptoms by political beliefs. Studying these patterns will provide valuable insight into the drivers of these trends on a national scale and whether these trends are uniform for adolescent subgroups.
2. Methods
2.1. Data source
MTF includes ongoing annual cross-sectional surveys of school-attending adolescents from the contiguous United States (Miech et al., 2019; National Institute on Drug Abuse, 2020). Our analyses include 12th-grade students from a sample of approximately 130 public and private high schools selected annually from 2005 to 2018. Schools may participate in the study for up to two years and are selected using a multistage random sampling procedure. School replacement rates average above 90% and replacement schools are matched on size, geographic area, and urbanicity in order to maintain sample consistency. On average, 120 12th-grade students are randomly selected from each school. Other sources have discussed MTF sampling methodology in more detail (Miech et al., 2019). Of note, MTF public-use data are de-identified and do not provide information on sample clustering. The average 12th-grade student response rate during the 2005 to 2018 time period was 82%, with the overwhelming majority of non-response due to absenteeism which may be attributable to factors such as illness or field trips, rather than refusal to participate, and is unlikely to bias results given time-invariant rates (Miech et al., 2019). Students are administered self-report questionnaires during the school day. All 12th-grade students are asked to fill out the same core questionnaire and are randomized to one of six sub-questionnaires in order to provide subsample information on a wide range of topics.
Our analyses were restricted to 12th-grade students who received the sub-questionnaire forms 2, 5, or 6, each of which included at least one of four internalizing symptoms scales. Sample sizes varied by the inclusion of internalizing symptom items on sub-questionnaire forms, with form 5 including all outcomes, form 6 including all outcomes except loneliness, and form 2 including only self-esteem and self-derogation. Our sample was further restricted to students with non-missing data for political beliefs and sex. We also excluded those with missing data for two or more component questions for every internalizing symptom. This methodology for handling missingness is consistent with prior research using the same data source (Keyes et al., 2019) and Appendix Table A1 further illustrates homogeneity between the restricted and unrestricted sample on substantive variables. We incorporated sample weights to correct for any unequal selection probabilities. Our total eligible sample size was N = 86,138, which we further stratified by internalizing symptom outcomes (Depressive affect: 33,684; Self-esteem: 85,817; Self-derogation: 84,924; Loneliness: 28,931).
2.2. Measures
Political Beliefs.
Political beliefs were measured in response to the item “How would you describe your political beliefs?” Responses were collapsed into 5 categories: “None of the above, or don’t know” (36.6%), “Conservative” (18.1%) (including “Conservative” (13.0%) and “Very conservative” (5.1%)), “Liberal” (19.8%) (including “Liberal” (14.8%) and “Very liberal” (5.0%)), “Moderate” (23.9%), and “Radical” (1.7%).
Internalizing Symptoms.
Four internalizing symptoms scales include depressive affect, self-esteem, self-derogation, and loneliness. Each symptom scale comprises multiple component questions for which students respond on a scale of 1 (Disagree) to 5 (Agree) (Schulenberg & Zarrett, 2006). Full questions are provided in Appendix Table A2. Question responses were averaged together for each internalizing symptom in order to generate mean response scores per symptom. A missing response for one component question per internalizing symptom scale was imputed with the respondent’s average score for that symptom (N = 361). Individuals were excluded from analysis who were missing data for two or more component questions for every internalizing symptom scale (N = 5254).
Covariates.
Analyses were stratified by factors that have been demonstrated to moderate time trends in mental health symptoms, including binary sex (Keyes et al., 2019) and parental education as a marker of socioeconomic status among youth (Bornstein & Bradley, 2014; Devenish, Hooley, & Mellor, 2017). Regression analyses were adjusted for race/-ethnicity, geographic region (northeast: 17.0%, north central: 24.0%, south: 36.4%, west: 22.7%), urbanicity measured as metropolitan statistical area (large: 30.2%, medium: 48.3%, small: 21.5%), and grade point average (GPA) (≥B: 72.0%, missing: 1.1%) given documented associations with both political affiliation and mental health symptoms (Franklin, Yin, McConnell, & Fruin, 2020; Pew Research Center, 2018; Weinberger et al., 2018). Race and ethnicity were conceptualized as sociodemographic effect modifiers, however, their narrow operationalization and small stratified sample sizes constrained inclusion in inferential analyses. We categorized year for regression analyses (2005–2008: 30.6%, 2009–2013: 36.5%, 2014–2018: 33.0%). Sensitivity analyses also adjusted for religiosity and social media use which may impact both adolescent mental health (Fruehwirth, Iyer, & Zhang, 2019; Kreski et al., 2020; Twenge & Campbell, 2019), religiosity offering a salutary sense of purpose and community, and political beliefs (Moeller, Shehata, & Kruikemeier, 2018; Ozmen et al., 2018). Religiosity was categorized as a binary response to the question“How important is religion to your life?” (less religious: 36.19%, missing:23.07%). Social media use was binarized in response to how often a student had visited social networking sites (daily: 16.14%, missing: 77.24%) (Kreski et al., 2020).
2.3. Statistical analysis
Analyses first focused on descriptive statistics among all political belief groups and we plotted yearly response percentages to political belief categories over time. Primary figures highlight liberal and conservative groups because they are most prevalent in the US. Appendix figures and tables include all other belief groups except radicals given their sample size limitations. Estimates of rates and means across time were smoothed using locally estimated scatterplot smoothing (LOESS) regression. We stratified our sample by political beliefs, sex, and parental education and plotted mean yearly internalizing symptoms scores over time. We also explored outcomes for conservatives and liberals further stratified by race/ethnicity. Individuals with missing information on covariates were excluded from descriptive analyses that included those variables. Descriptive figures feature US presidential party affiliation and election years to help contextualize our findings within a broader political timeline.
We next constructed and ran estimated linear regression models for each internalizing symptom outcome. Informed by divergent trends in descriptive analyses, we assessed additive interaction using three-way interaction terms for political belief and year categories with both sex and parental education, including all lower order interaction terms in the model. We plotted predicted internalizing symptom scores by political belief, parental education, sex, and year category subgroups. All models were adjusted for confounding variables. Individuals with missing data on any covariate were excluded from regression analyses for a total sample size of 70,919 (Depressive affect: 27,599; Self-esteem: 70,799; Self-derogation: 69,975; Loneliness: 23,844). Both unstandardized (b) and standardized (β) regression coefficients are reported to ease effect size comparisons. Standardized regression coefficients were calculated by dividing the unstandardized coefficient by a ratio of the standard deviation (SD) of the outcome to that of the predictor (Wicklin, 2021).
Sensitivity analyses.
We tested the robustness of our findings in two ways. First, we sought to quantify the potential for uncontrolled confounding in our primary analyses by calculating E-values. An E-value is defined as the minimum strength of association, measured on the risk ratio scale, that an uncontrolled confounder would need to have with both the predictor and outcome beyond existing confounder control to nullify a finding (VanderWeele & Ding, 2017). We calculated E-values for salient main effects in our primary regression models using the R EValue package (Mathur, Ding, Riddell, & VanderWeele, 2018) which approximates risk ratios for adjusted linear regression models in part by auto-binarizing continuous outcomes.
Second, we additionally adjusted for potential confounders in two analyses: first for religiosity and second for both religiosity and social media use. Due to restrictions on religion-related data collection, both analyses excluded respondents from the “west” region for an initial sample size of 56,696 (Depressive affect: 22,006; Self-esteem: 56,599; Self-derogation: 55,941; Loneliness: 19,058). Further, information on social media use was only available from 2008 to 2017 on form two, which queried self-esteem and self-derogation as previously described, limiting the second analysis to 12,668 students (Self-esteem: 12,653; Self-derogation: 12,621).
All analyses were completed using SAS Studio version 3.8 and R Studio version 1.4.
3. Results
3.1. Descriptive time trends
At the time of survey administration, 57% of respondents were aged 18 or older. As shown in Table 1, the demographic distribution of the 2005 to 2018 sample of 12th-grade students skewed slightly more female (51.7%), White (59.9%), and toward those with a parent with a college degree(50.4%). Most respondents reported being unsure about their political beliefs (36.6%), followed by reports of moderate (23.9%), liberal (19.8%), conservative (18.1%), and radical (1.7%). Female adolescents were more likely to be liberal (22.0%) than male adolescents (17.5%) and male adolescents were more likely to be conservative (21.1%) than female adolescents (15.3%). Within both parental education groups, respondents were more likely to identify as liberal than conservative. The percentage of students who identified as liberal or conservative remained relatively stable between 2005 and 2018, during which time students who identified as unsure increased by 8.6% (Appendix Figure A1).
Table 1.
Political belief frequencies and relative frequencies by sex, race/ethnicity, and parental education among 12th-graders from 2005 to 2018.
| Totala | Political Beliefs | |||||||||||
|---|---|---|---|---|---|---|---|---|---|---|---|---|
| Conservative | Liberal | Moderate | Radical | Unsurec | ||||||||
| Sex | N = 86,138b | 15,348 | (18.1) | 17,999 | (19.8) | 20,675 | (23.9) | 1434 | (1.7) | 30,682 | (36.6) | |
| Female | 44,534 | (51.7) | 6645 | (15.3) | 10,308 | (22.0) | 10,234 | (22.9) | 394 | (0.9) | 16,953 | (39.0) |
| Male | 41,604 | (48.3) | 8703 | (21.1) | 7691 | (17.5) | 10,441 | (24.9) | 1040 | (2.5) | 13,729 | (33.9) |
| Race/ethnicity d | ||||||||||||
| Black | 9513 | (11.0) | 1241 | (13.2) | 1620 | (16.1) | 2327 | (24.4) | 167 | (1.8) | 4158 | (44.4) |
| Female | 5248 | (55.4) | 591 | (11.4) | 889 | (16.3) | 1267 | (23.9) | 56 | (1.0) | 2445 | (47.4) |
| Male | 4265 | (44.6) | 650 | (15.5) | 731 | (15.9) | 1060 | (24.9) | 111 | (3.0) | 1713 | (40.7) |
| White | 51,248 | (59.9) | 11,312 | (22.4) | 10,175 | (18.7) | 12,667 | (24.6) | 783 | (1.5) | 16,311 | (32.8) |
| Female | 25,826 | (50.4) | 4747 | (18.9) | 5767 | (21.1) | 6167 | (23.7) | 181 | (0.7) | 8964 | (35.7) |
| Male | 25,422 | (49.6) | 6565 | (26.0) | 4408 | (16.3) | 6500 | (25.4) | 602 | (2.3) | 7347 | (30.0) |
| Hispanic | 13,118 | (15.3) | 1289 | (9.8) | 3201 | (23.4) | 2739 | (21.1) | 230 | (1.8) | 5659 | (43.9) |
| Female | 6968 | (53.1) | 626 | (9.0) | 1841 | (25.4) | 1353 | (19.8) | 76 | (1.2) | 3072 | (44.7) |
| Male | 6150 | (46.9) | 663 | (10.8) | 1360 | (21.2) | 1386 | (22.6) | 154 | (2.5) | 2587 | (42.9) |
| Parental Education e | ||||||||||||
| ≥ College degree f | 44,884 | (50.4) | 9451 | (21.6) | 10,448 | (22.0) | 11,442 | (25.4) | 709 | (1.6) | 12,834 | (29.4) |
| Female | 22,447 | (50.0) | 4001 | (18.5) | 5900 | (24.9) | 5445 | (24.4) | 183 | (0.8) | 6918 | (31.4) |
| Male | 22,437 | (50.0) | 5450 | (24.6) | 4548 | (19.1) | 5997 | (26.4) | 526 | (2.4) | 5916 | (27.5) |
| < College degree | 38,501 | (46.2) | 5630 | (14.9) | 7233 | (18.0) | 8833 | (22.9) | 655 | (1.7) | 16,150 | (42.5) |
| Female | 20,896 | (54.0) | 2545 | (12.4) | 4260 | (19.6) | 4615 | (21.8) | 195 | (0.9) | 9281 | (45.3) |
| Male | 17,605 | (46.0) | 3085 | (17.8) | 2973 | (16.2) | 4218 | (24.1) | 460 | (2.7) | 6869 | (39.2) |
Total relative frequencies are column percentages. Political belief relative frequencies are row percentages. Full analytic sample includes respondents with complete information on political beliefs and sex.
Frequencies of unweighted sample. Relative frequencies of weighted sample.
N reported is unweighted. Weighted N = 86,143.
Unsure category represents a “none of the above, or don’t know” response.
13.8% missing race/ethnicity response.
3.3% missing/unknown parental education response.
Respondent reported that at least one parent completed college.
Appendix Table A.3 includes average internalizing symptoms scores from 2005 to 2018 by political beliefs, overall and stratified by sex and parental education. For our total analytic sample,Cronbach’s alpha was 0.74 for depressive affect, 0.85 for self-esteem, 0.87 for self-derogation, and 0.74 for loneliness. Conservatives reported lower average depressive affect, self-derogation, and loneliness scores and higher self-esteem scores than all other groups.
When analyzed by year, trends in internalizing symptoms remained relatively stable from 2005 to 2010 after which they worsened through 2018. Liberals reported higher depressive affect scores than conservatives over time and trends further diverged by sex as shown in Fig. 1 and Appendix Figure A.2.1. Across all four internalizing symptoms, female liberals reported worse internalizing symptom scores over the study period than all other groups. From 2010 onward, male conservatives generally reported better scores than all other groups. The disparities in these trends also grew over time. For example, Fig. 1 shows that the average depressive affect score for female liberals increased from 1.92 (SD = 0.89) in 2010 to 2.65 (SD = 0.88) in 2018, a change of 0.73 points, or more than three-quarters of an SD. Conversely, depressive affect scores for male conservatives increased from 1.75 (SD = 0.72) in 2010 to 2.17 (SD = 0.87) in 2018, a change of only 0.42 points. Trends for respondents reporting moderate and unsure political beliefs can be found in Appendix Figure A.2.2.
Fig. 1.
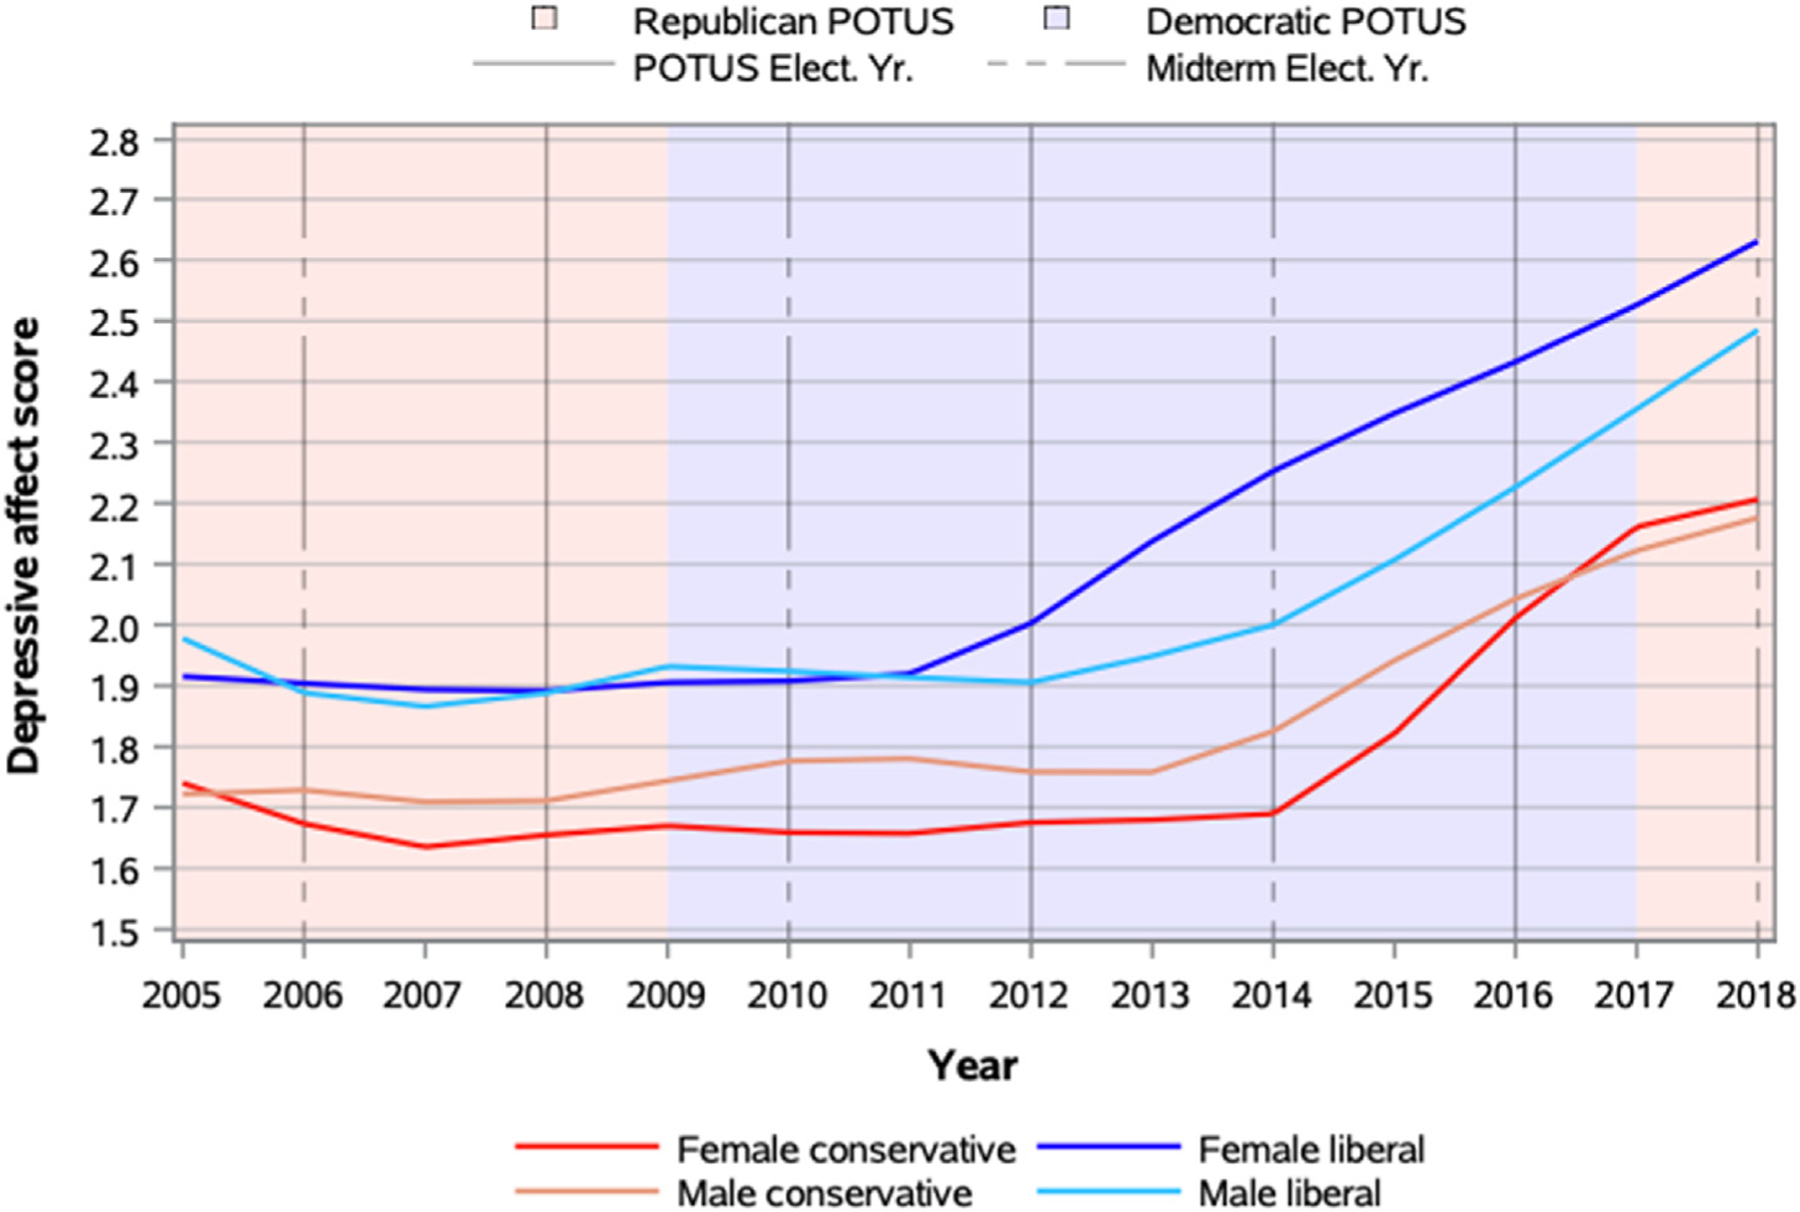
Mean main effects of political beliefs on depressive affect by sex: Conservative and liberal 12th-graders from 2005 to 2018. POTUS = President of the United States. Depressive affect scores averaged across annual cross-sectional weighted samples of 12th-graders from 2005 to 2018. LOESS regression parameters plotted.
When stratified by parental education, trends in internalizing symptoms by political belief categories and sex also diverged over the study period. As shown in Fig. 2, liberals reported higher average depressive affect scores than conservatives across parental education subgroups. Depressive affect among conservatives diverged by parental education status with those adolescents with a parent with a college degree reporting lower average depressive affect scores over time. Among liberals, female adolescents without a parent with a college degree reported the highest average depressive affect scores, increasing from 2.02 (SD = 0.81) in 2010 to 2.75 (SD = 0.92) in 2018. Appendix Figure A.3.1 shows similar trends in other internalizing symptoms for conservatives and liberals. Trends for respondents reporting moderate and unsure political beliefs can be found in Appendix Figure A.3.2.
Fig. 2.
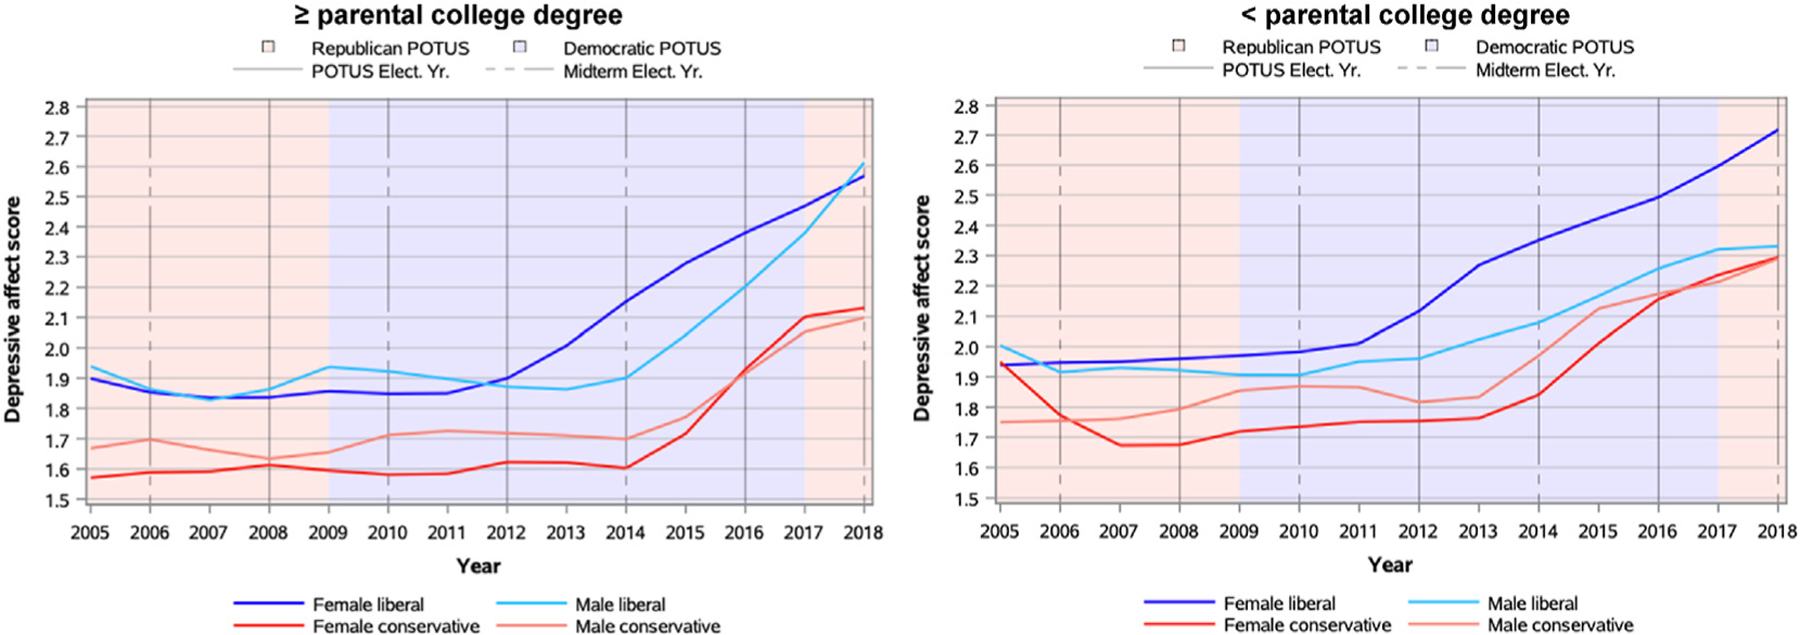
Mean main effects of political beliefs on depressive affect by sex and parental education: Conservative and liberal 12th-graders from 2005 to 2018. POTUS = President of the United States. Depressive affect scores averaged for annual cross-sectional weighted samples of 12th-graders from 2005 to 2018. LOESS regression parameters plotted.
Appendix Figure A.4 illustrates patterns in internalizing symptoms for conservatives and liberals stratified by race/ethnicity in addition to sex and parental education. Overall, trends for White students, the sample majority, reflected those described above for the aggregate sample, with the exception of male liberals without a parent with a college degree whose scores converged with those of female liberals. Although trends were more heterogenous for Black and Hispanic students, female liberals generally reported worse internalizing symptoms over time. Black female liberals without a parent with a college degree reported sharp increases in depressive affect and self-derogation from approximately 2014 onward, with the worst mean scores of all groups in 2018, however sample sizes were less than 20. Similarly, Black female conservatives with a parent with a college degree reported increases in both depressive affect and self-derogation that exceeded those of liberals in 2018.
3.2. Linear regression results
As anticipated by the descriptive findings, linear regression predicted mean internalizing symptom scores diverged by political beliefs, sex, parental education, and year category, when additionally controlling for geographic region, urbanicity, race/ethnicity, and GPA. Fig. 3 visualizes predicted mean depressive affect scores for liberals and conservatives by sex over time within each parental education category. Graphs for self-esteem, self-derogation, and loneliness can be found in Appendix Figure A.5.1. Regression models predicted worse depressive affect scores for female liberals compared to all other groups from 2009 onward, with the gap widening between female liberals and male liberals and conservatives during the 2014 to 2018 period. Alternatively, there appears to be a slight convergence in depressive affect scores between female and male conservatives from 2009 onward.
Fig. 3.
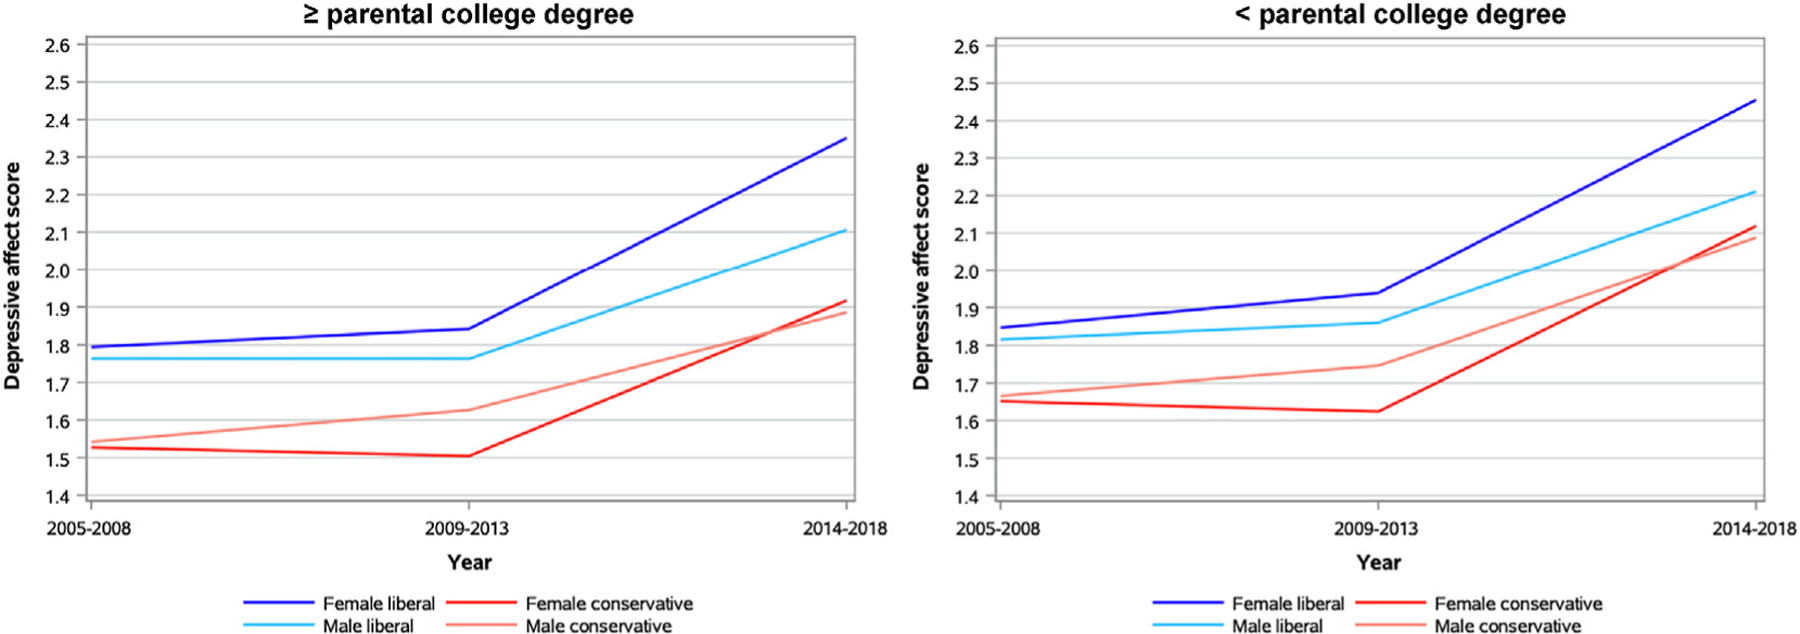
Linear regression predicted mean main effects of political beliefs on depressive affect by sex and parental education: Conservative and liberal 12th-graders from 2005 to 2018. Linear regression predictions graphed. All models were adjusted for geographic region, urbanicity, race/ethnicity, and GPA.
Appendix Table A.4 lists all linear regression coefficients. Models demonstrated that internalizing symptom outcomes were significantly worse during the 2014–2018 time period compared to the 2005–2008 time period for all outcomes save loneliness. Depressive affect increased by 0.34 points (95% CI: 0.26,0.43) from 2005 to 2008 to 2014–2018, a change of 0.19 SD for every 1 SD increase in year category. The main effect for political beliefs indicated that depressive affect was significantly worse for liberals than conservatives (b = 0.22, 95% CI: 0.12,0.32, β = 0.10).Similarly, depressive affect was predicted to be significantly worse for those without a parent with a college degree compared to those with a parent with a college degree (b = 0.12, 95% CI: 0.04, 0.21, β = 0.07).
E-values are located in Appendix Table A.5. An unmeasured confounder would have needed to be associated with both political beliefs (liberal compared to conservative) and depressive affect (high compared to low) by a risk ratio of at least 1.85 in order to explain away the finding that depressive affect is 0.22 points higher for liberals than conservatives on average, when controlling for geographic region, urbanicity, race/ethnicity, and GPA. For depressive affect, the majority of E-values corresponding to the main effects of moderator variables exceeded 1.5 and ranged from 1.14 (sex) to 2.25 (year category: 2014–2018 compared to 2005–2008). The risk ratio for high depressive affect comparing the aforementioned year categories was 1.45, meaning that an unmeasured confounder would have needed to be even more strongly associated with high depressive affect than time period was in order to potentially negate the effect of political beliefs.
Table 2 highlights interaction term coefficients included in each model for liberals and conservatives. The added effect of the three-way-interaction between political beliefs, year, and sex indicated that depressive affect increased most precipitously (b = 0.17, 95% CI: 0.01, 0.32, β = 0.04) for female liberals during the 2014–2018 period. Effects of the interaction between political beliefs, year, and parental education were not consistent for socio-temporal groups across internalizing symptoms.
Table 2.
Internalizing symptoms linear regression interaction term unstandardized and standardized coefficients for liberals and conservatives.
| Depressive affect | Self-esteem | Self-derogation | Loneliness | |||||
|---|---|---|---|---|---|---|---|---|
| b (95% CI) | β | b (95% CI) | β | b (95% CI) | β | b (95% CI) | β | |
| Year*Belief | ||||||||
| 2009–2013*Liberal | −0.09 (−0.22, 0.05) | −0.02 | 0.00 (−0.08, 0.07) | 0.00 | 0.06 (−0.03, 0.16) | 0.02 | 0.15 (−0.03, 0.33) | 0.03 |
| 2014–2018*Liberal | 0.00 (−0.13, 0.13) | 0.00 | −0.10 (−0.18, −0.02) | −0.03 | 0.23 (0.13, 0.33) | 0.05 | 0.26 (0.07, 0.45) | 0.06 |
| Sex*Belief | ||||||||
| Female*Liberal | 0.05 (−0.08, 0.17) | 0.02 | −0.10 (−0.17, −0.03) | −0.04 | 0.08 (0.00, 0.16) | 0.02 | 0.15 (−0.01, 0.31) | 0.04 |
| Year*Sex | ||||||||
| 2009–2013*Female | −0.11 (−0.23, 0.01) | −0.04 | −0.01 (−0.08, 0.06) | −0.01 | −0.01 (−0.09, 0.08) | 0.00 | 0.08 (−0.07, 0.24) | 0.03 |
| 2014–2018*Female | 0.05 (−0.07, 0.16) | 0.02 | −0.10 (−0.17, −0.03) | −0.04 | 0.09 (0.001, 0.17) | 0.03 | 0.22 (0.06, 0.38) | 0.07 |
| Belief*Parental Education | ||||||||
| Liberal*<College degree | −0.07 (−0.19, 0.05) | −0.02 | 0.06 (−0.01, 0.13) | 0.02 | −0.06 (−0.14, 0.03) | −0.01 | −0.01 (−0.17, 0.15) | 0.00 |
| Year*Parental Education | ||||||||
| 2009–2013*<College degree | 0.00 (−0.13, 0.12) | 0.00 | −0.02 (−0.09, 0.05) | −0.01 | 0.07 (−0.02, 0.15) | 0.02 | 0.16 (0.00, 0.31) | 0.05 |
| 2014–2018*<College degree | 0.08 (−0.03, 0.19) | 0.04 | −0.11 (−0.18, −0.03) | −0.04 | 0.11 (0.02, 0.19) | 0.04 | 0.10 (−0.06, 0.26) | 0.03 |
| Year*Sex*Belief | ||||||||
| 2009–2013*Female*Liberal | 0.16 (−0.01, 0.32) | 0.03 | 0.01 (−0.09, 0.11) | 0.00 | 0.04 (−0.08, 0.15) | 0.01 | −0.01 (−0.23, 0.21) | 0.00 |
| 2014–2018*Female*Liberal | 0.17 (0.01, 0.32) | 0.04 | −0.01 (−0.11, 0.09) | 0.00 | 0.06 (−0.06, 0.18) | 0.01 | −0.06 (−0.28, 0.17) | −0.01 |
| Year*Belief*Parental Education | ||||||||
| 2009–2013*Liberal*<College degree | 0.05 (−0.12, 0.22) | 0.01 | −0.01 (−0.11, 0.08) | 0.00 | −0.03 (−0.14, 0.09) | 0.00 | −0.15 (−0.38, 0.07) | −0.02 |
| 2014–2018*Liberal*<College degree | −0.03 (−0.18, 0.13) | −0.01 | 0.09 (−0.02, 0.19) | 0.02 | −0.10 (−0.22, 0.02) | −0.02 | −0.10 (−0.33, 0.13) | −0.02 |
b = unstandardized regression coefficient, β = standardized regression coefficient.
References: Year (2005–2008), Belief (conservative), Sex (male), Parental education (≥college degree).
All linear regression models were adjusted for geographic region, urbanicity, race/ethnicity, and GPA. See Appendix Table A.4 for a complete list of model coefficients.
Predicted depressive affect scores for conservative and liberal respondents without a parent with a college degree followed similar trends to those of respondents with a parent with a college degree as shown in Fig. 3. Predicted depressive affect scores were highest for female liberals without a parent with a college degree and lowest for male conservatives with a parent with a college degree during the 2014 to 2018 time period. When comparing conservatives and liberals by sex across parental education categories, predicted depressive affect scores were worse for those without a parent with a college degree than those with a parent with a college degree. These trends held for all other internalizing symptoms as shown in Appendix Figure A.5.1. Trends for respondents reporting moderate and unsure political beliefs can be found in Appendix Figure A.5.2.
Results for sensitivity analyses can be found in Appendix Tables A.6 and A.7. When additionally adjusted for religiosity, models predicted better internalizing symptom scores across all political belief, year, sex, and parental education subgroups. Overall time trends in internalizing symptoms remained the same for all groups with the exception of male liberals whose predicted symptom scores moved closer to those of conservatives. Findings were similar for self-esteem and self-derogation in regressions additionally adjusted for frequency of social media use despite further sample size limitations.
4. Discussion
Among >85,000 US adolescents from 2005 to 2018, recent trends in internalizing symptoms among 12th-grade students diverged by political beliefs such that, while internalizing symptom scores worsened over time for all adolescents, they deteriorated most quickly for female liberal adolescents. Beginning in approximately 2010 and continuing through 2018, female liberal adolescents reported the largest changes in depressive affect, self-esteem, self-derogation, and loneliness. Male conservative adolescents reported the smallest corresponding changes. Further, female liberal adolescents without a parent with a college degree reported the worst internalizing symptom scores over the study period compared to all other subgroups. Internalizing symptoms scores were also worse for conservative adolescents without a parent with a college degree compared to those with a parent with a college degree. These trends were consistent across all four internalizing symptom scales and confirmed by regression analyses.
Our findings build upon prior research into worsening trends in adolescent mental health over the past decade (Burstein et al., 2019; Centers for Disease Prevention and Control, 2015; Curtin et al., 2016; Kalb et al., 2019; Keyes et al., 2019; Miron et al., 2019; Mojtabai et al., 2016; Twenge et al., 2019), adding that time trends in internalizing symptoms markedly differ by political beliefs across axes of sex and parental education. Our research highlights the growing mental health burden faced by millions of adolescents, independent of political beliefs or demographic characteristics. These results emphasize the need to explore alternative causes for declines in adolescent mental health and that factors such as amount of screen time are insufficient as sole explanatory variables for worsening internalizing symptom trends (Kreski et al., 2020; Orben & Przybylski, 2019). Variation in internalizing symptoms by political belief, sex, and parental education subgroups instead suggests that a heterogenous factor such as screen content (e.g. political and world news) might be an etiologically relevant exposure for adolescents that warrants further investigation.
There are several mechanisms worth considering. The pervasive spread and consumption of digital news content over the past decade (Anderson & Jiang, 2018; Roberts, 2018; Taneja et al., 2018) has likely contributed to a heightened awareness of the political landscape (Bakker & De Vreese, 2011) during a period of continued political unrest (Mukunda, 2018; Kochhar & Fry, 2014, Stiglitz, 2013; O’brien et al., 2018; Witt, 2019; Worland, 2020; Obasogie, 2020; Kochhar & Cilluffo, 2018; Parlapiano, 2015), which, in turn, could be driving worsening internalizing symptoms trends for all adolescents, who are more sensitive than adults to political upheavals (Schuman & Corning, 2000; Schuman & Scott, 1989). Increasing political polarization and reinforcing news consumption spirals may also magnify the effects of political beliefs on mental health (Dahlgren, Shehata, & Strömbäck, 2019; Kim, 2017;Mitchell, Gottfried, Kiley, & Matsa, 2014; Slater, 2007; Weir, 2019). Further, we detected variation in time trends by social and political subgroups, most notably affecting female liberal adolescents without a parent with a college degree. Because individuals perceive and experience the world differently across demographic groups (Jost et al., 2003; Napier & Jost, 2008; Taylor, 2008; Weir, 2019), these divergences in mental health could be partially explained by differences in political ideology, i.e. encapsulations of worldview (Lyons, 2017; Rosenthal et al., 2003; Sapiro, 2004), which provide a framework for understanding events that selective news consumption may then reinforce. There is also potential for overlap in how politicized events impact adolescents. Broad-reaching phenomena, such as worsening climate change or school shootings may impact mental health for all adolescents, while social injustices like sexism, which gained media attention through the #MeToo movement, may be felt most acutely by those personally affected.
We found that conservative 12th-grade students consistently reported fewer internalizing symptoms than those with other political beliefs, suggesting that, in agreement with SJT, common aspects of a conservative identity are equally as protective for adolescent mental health as for adult mental health (Napier & Jost, 2008; Taylor, 2008). Among the most socially privileged group, male adolescents with highly educated parents, conservative ideology may work as a psychological buffer by harmonizing an idealized worldview with the bleak external realities experienced by many (Jost et al., 2008). This group presumably benefits from the American cultural myth of an equal playing field in which exceptional social positions are thought to be earned through hard-work and talent rather than inherited through codified privilege (Turner, 1960). Among underprivileged groups, such as those without a parental college degree, especially Black female adolescents, conservatism alone was not protective for mental health. This pattern is consistent with other evidence indicating that adherence to conservative ideology may be less beneficial for disadvantaged individuals who are potentially less inclined to interpret their own experiences of inequality as systemic in nature versus resulting from personal inadequacy (Jost et al., 2003; Jost & Hunyady, 2005). Socially underprivileged liberals reported the worst internalizing symptom scores over time, likely indicating that the experiences and beliefs that inform a liberal political identity are ultimately less protective against poor mental health than those that inform a conservative political identity. This may be due to an emphasis on the awareness of social inequity (Jost et al., 2008) within an increasingly politically conservative climate, with compounding effects for those with intersecting minoritized identities who acutely experience societal maltreatment and are therefore more likely to acknowledge it. We also found that trends for adolescents with unsure and moderate political beliefs tended to fall between those for liberals and conservatives who exhibited the clearest disparate patterns in internalizing symptoms. Together, our findings demonstrate that the relationships between adolescent political beliefs and mental health mirror those of adults, potentially indicating that political beliefs are meaningful components of adolescent identity that significantly impact psychiatric outcomes.
Worse internalizing symptoms scores among female liberal adolescents may be due to a confluence of factors, including increased online bullying and harassment. Girls have not only experienced greater declines in mental health than boys (Keyes et al., 2019; Mojtabai et al., 2016), but also heightened levels of sexual harassment, both on and off-line, which have been directly linked to poor mental health outcomes (Bauman, Toomey, & Walker, 2013; Brown et al., 2016). The growing digital social sphere has led to an increase in the prevalence of online bullying where women are the most frequent victims (Kessel Schneider, O’ Donnell, & Smith, 2015; Mojtabai et al., 2016). It is possible that female liberal adolescents are more inclined to post online about controversial topics, such as feminism, that could make them unique targets for online bullying (Jackson, 2018; Lewis, Rowe, & Wiper, 2017). Alternatively, disparities in internalizing symptoms for female liberal adolescents may be due to a joint awareness (via liberalism) and experience (via sexism) of injustice which is further exacerbated by societal disenfranchisement for lower SES groups.
Research into the construct of adolescent political identity, the political content adolescents consume, and subsequent effects on their mental health is recommended, especially during the highly politicized COVID-19 pandemic. Attention should also be paid to those who report that they are unsure of their beliefs as the increasing prevalence of this majority group over time may signal growing disinterest among adolescents to identify with entrenched political systems, rather than political apathy (Farthing, 2010; Flanagan, 2009). Future analyses should examine effects by race and ethnicity to understand vulnerabilities among oppressed groups, especially Black adolescent girls who are at a heightened risk of experiencing psychiatric crises (Ivey-Stephenson et al., 2020), and how they may further differ for individuals by contextual effects such as being ideologically isolated or excluded from one’s community.
This study is limited in the following ways. First, outcome data were self-reported and thus susceptible to bias. Trends, however, were consistent with research into non-self-report data on adolescent suicide-related hospitalizations and deaths (Burstein et al., 2019; Curtin et al., 2016; Kalb et al., 2019; Miron et al., 2019). Second, data were cross-sectional. Future longitudinal analyses of the effect of political beliefs on adolescent mental health could help establish causality. Third, restrictions on publicly-available data inhibited our ability to account for a clustered study design in our analyses, however large sample sizes increased the accuracy of our estimates. Fourth, we could not sufficiently analyze effects by race and ethnicity given small sample sizes and data-specific coding limitations. Fifth, the measure of political beliefs was limited in that it measured identification with a label rather than substantive political values. Psychometric development of political affiliation and belief measures among adolescents is an important area for future research given our findings. Finally, despite prudent confounder control and consonant findings across sensitivity analyses, data were unavailable for all potential confounders such as traumatic personal experiences that may have partially explained differential effects.
5. Conclusions
In conclusion, we found that worsening time trends in adolescent internalizing symptoms from approximately 2010 onward diverged by political beliefs and were most severe for female liberal adolescents without a parent with a college degree. Our study utilized data that spanned over a decade and included a large, nationally representative sample of US adolescents. We found trends to be consistent across internalizing symptoms, and linear regression models confirmed the results of our descriptive analyses. Taken together, political beliefs are likely one of many important factors influencing recent trends in adolescent internalizing symptoms that warrant further investigation.
Funding
This work was funded by the National Institute on Drug Abuse (R01-DA048853). The Funder/Sponsor had no role in the conception, design, or execution of the study.
Appendix
Appendix Table A.1.
Comparison of relative frequencies in restricted and unrestricted samples by political beliefs, sex, race/ethnicity, and parental education among 12th-graders from 2005 to 2018
| Restricted Samplea | Unrestricted Sampleb | ||
|---|---|---|---|
| Political Beliefs | |||
| Conservative | 18.11 | 17.11 | |
| Liberal | 19.80 | 18.64 | |
| Moderate | 23.86 | 22.46 | |
| Radical | 1.67 | 1.65 | |
| Unsure | 36.57 | 35.12 | |
| Missing | – | 5.01 | |
| Sex | |||
| Female | 51.66 | 47.67 | |
| Male | 48.34 | 45.73 | |
| Missing | – | 6.60 | |
| Race/ethnicity | |||
| Black | 11.03 | 11.68 | |
| White | 59.90 | 55.74 | |
| Hispanic | 15.32 | 15.45 | |
| Missing | 13.76 | 17.12 | |
| Parental Education | |||
| ≥ College degree | 50.43 | 47.44 | |
| < College degree | 46.25 | 45.33 | |
| Missing/Unknown | 3.32 | 7.24 |
Analytic sample (N = 86,138): Restricted to forms 2, 5, and 6 and those with non-missing data for political beliefs, sex, and all but one component item of any specific internalizing symptom.
Full sample (N = 99,657): Restricted to forms 2, 5, and 6 which included internalizing symptoms outcomes.
Appendix Table A.2.
Internalizing symptom scale component questions
|
Prompt: How much do you agree or disagree with each of the following statements? Response options: 1 (Disagree) - 5 (Agree) |
| Depressive Affect |
| Life often seems meaningless. |
| The future often seems hopeless. |
| I enjoy life as much as anyone. (reverse coded) |
| It feels good to be alive. (reverse coded) |
| Self-esteem |
| I take a positive attitude toward myself. |
| I feel I am a person of worth, on an equal plane with others. |
| I am able to do things as well as most other people. |
| On the whole. I’m satisfied with myself. |
| Self-derogation |
| I feel I do not have much to be proud of. |
| Sometimes I think I am no good at all. |
| I feel that I can’t do anything right. |
| I feel that my life is not very useful. |
| Loneliness |
| A lot of times I feel lonely. |
| I often feel left out of things. |
| I often wish I had more good friends. |
Appendix Table A.3.
Mean internalizing symptom scores by political beliefs, sex, and parental education among 12th-graders from 2005 to 2018
| Internalizing Symptoms | |||||||||
|---|---|---|---|---|---|---|---|---|---|
| Depressive Affect | Self-esteem | Self-derogation | Loneliness | ||||||
| Political Beliefs | |||||||||
| Conservative | 1.85 | (0.82) | 4.15 | (0.86) | 1.93 | (0.99) | 2.59 | (1.1) | |
| Liberal | 2.13 | (0.91) | 3.99 | (0.87) | 2.19 | (1.03) | 2.86 | (1.1) | |
| Moderate | 1.98 | (0.85) | 4.09 | (0.81) | 2.06 | (0.99) | 2.73 | (1.09) | |
| Radical | 2.43 | (1.1) | 3.86 | (1.08) | 2.42 | (1.18) | 2.84 | (1.12) | |
| Unsure | 2.07 | (0.92) | 3.98 | (0.9) | 2.20 | (1.1) | 2.79 | (1.15) | |
| F | 125.37 | <.0001 | 149.17 | <.0001 | 244.18 | <.0001 | 44.20 | <.0001 | |
| Sex | |||||||||
| Female | 2.03 | (0.9) | 4.01 | (0.87) | 2.16 | (1.06) | 2.87 | (1.13) | |
| Conservative | 1.81 | (0.83) | 4.14 | (0.86) | 1.93 | (0.99) | 2.67 | (1.12) | |
| Liberal | 2.19 | (0.92) | 3.93 | (0.87) | 2.25 | (1.05) | 2.98 | (1.1) | |
| Moderate | 1.95 | (0.84) | 4.07 | (0.81) | 2.08 | (1) | 2.82 | (1.1) | |
| Radical | 2.22 | (1.04) | 3.83 | (1.15) | 2.47 | (1.19) | 3.08 | (1.22) | |
| Unsure | 2.07 | (0.93) | 3.96 | (0.89) | 2.24 | (1.11) | 2.90 | (1.14) | |
| F | 81.95 | <.0001 | 88.37 | <.0001 | 140.35 | <.0001 | 28.02 | <.0001 | |
| Male | 2.02 | (0.88) | 4.07 | (0.88) | 2.08 | (1.03) | 2.64 | (1.1) | |
| Conservative | 1.89 | (0.82) | 4.15 | (0.87) | 1.93 | (0.98) | 2.53 | (1.08) | |
| Liberal | 2.06 | (0.88) | 4.06 | (0.87) | 2.12 | (1.01) | 2.70 | (1.08) | |
| Moderate | 2.00 | (0.86) | 4.11 | (0.81) | 2.03 | (0.98) | 2.65 | (1.07) | |
| Radical | 2.50 | (1.11) | 3.88 | (1.05) | 2.40 | (1.17) | 2.75 | (1.07) | |
| Unsure | 2.07 | (0.9) | 4.00 | (0.92) | 2.16 | (1.08) | 2.66 | (1.14) | |
| F | 59.00 | <.0001 | 64.67 | <.0001 | 100.59 | <.0001 | 10.49 | <.0001 | |
| Parental Education | |||||||||
| ≥ College degree | 1.97 | (0.87) | 4.09 | (0.83) | 2.05 | (1) | 2.72 | (1.1) | |
| Conservative | 1.78 | (0.78) | 4.22 | (0.78) | 1.85 | (0.93) | 2.55 | (1.09) | |
| Liberal | 2.08 | (0.88) | 4.02 | (0.84) | 2.15 | (1) | 2.85 | (1.07) | |
| Moderate | 1.93 | (0.83) | 4.13 | (0.78) | 2.00 | (0.95) | 2.71 | (1.07) | |
| Radical | 2.40 | (1.09) | 3.90 | (1.05) | 2.41 | (1.16) | 2.91 | (1.13) | |
| Unsure | 2.02 | (0.9) | 4.01 | (0.87) | 2.14 | (1.05) | 2.75 | (1.12) | |
| F | 83.79 | <.0001 | 114.75 | <.0001 | 173.47 | <.0001 | 32.46 | <.0001 | |
| < College degree | 2.08 | (0.92) | 4.00 | (0.91) | 2.18 | (1.09) | 2.78 | (1.14) | |
| Conservative | 1.95 | (0.88) | 4.06 | (0.96) | 2.04 | (1.06) | 2.65 | (1.12) | |
| Liberal | 2.19 | (0.93) | 3.95 | (0.91) | 2.24 | (1.07) | 2.88 | (1.14) | |
| Moderate | 2.02 | (0.87) | 4.06 | (0.84) | 2.12 | (1.04) | 2.75 | (1.1) | |
| Radical | 2.40 | (1.09) | 3.85 | (1.09) | 2.39 | (1.18) | 2.72 | (1.1) | |
| Unsure | 2.09 | (0.93) | 3.97 | (0.91) | 2.23 | (1.12) | 2.82 | (1.17) | |
| F | 0.00 | <.0001 | 30.72 | <.0001 | 53.88 | <.0001 | 13.26 | <.0001 | |
Internalized symptom (IS) scores averaged across annual cross-sectional weighted samples of 12th-graders from 2005 to 2018. Standard deviations in parenthesis. F-statistics followed by p-values. IS scores are the mean ordinal scale response (1–5) to a set of items. A higher score indicates a greater endorsement of the IS. Sample sizes per IS exclude respondents with missing data for sex and political beliefs.
Appendix Table A.4.
Internalizing symptoms linear regression unstandardized and standardized coefficients
| Depressive affect | Self-esteem | Self-derogation | Loneliness | |||||
|---|---|---|---|---|---|---|---|---|
| b (95% CI) | β | b (95% CI) | β | b (95% CI) | β | b (95% CI) | β | |
| Intercept | 1.54 (1.47, 1.61) | – | 4.34 (4.30, 4.38) | – | 1.73 (1.68, 1.78) | – | 2.48 (2.39, 2.58) | – |
| Year | Reference: 2005 – 2008 | |||||||
| 2009–2013 | 0.08 (−0.01, 0.18) | 0.04 | −0.02 (−0.08, 0.03) | −0.01 | −0.01 (−0.08, 0.05) | −0.01 | −0.12 (−0.24, 0.00) | −0.05 |
| 2014–2018 | 0.34 (0.26, 0.43) | 0.19 | −0.12 (−0.17, −0.06) | −0.06 | 0.10 (0.03, 0.16) | 0.04 | 0.06 (−0.07, 0.18) | 0.02 |
| Sex | Reference: male | |||||||
| Female | −0.01 (−0.10, 0.07) | −0.01 | −0.02 (−0.07, 0.03) | −0.01 | 0.02 (−0.04, 0.08) | 0.01 | 0.07 (−0.04, 0.18) | 0.03 |
| Political Belief | Reference: conservative | |||||||
| Liberal | 0.22 (0.12, 0.32) | 0.10 | −0.09 (−0.15, −0.03) | −0.07 | 0.12 (0.05, 0.18) | 0.04 | 0.07 (−0.06, 0.20) | 0.03 |
| Moderate | 0.11 (0.01, 0.20) | 0.05 | −0.07 (−0.13, −0.02) | −0.04 | 0.06 (0.003, 0.12) | 0.03 | 0.01 (−0.10, 0.13) | 0.01 |
| Radical | 0.67 (0.45, 0.89) | 0.10 | −0.28 (−0.41, −0.15) | −0.04 | 0.35 (0.20, 0.50) | 0.04 | 0.10 (−0.20, 0.40) | 0.01 |
| Unsure | 0.22 (0.12, 0.31) | 0.12 | −0.16 (−0.21, −0.10) | −0.09 | 0.17 (0.10, 0.23) | 0.08 | 0.08 (−0.04, 0.20) | 0.04 |
| Parental Education | Reference: ≥ college degree | |||||||
| < College degree | 0.12 (0.04, 0.21) | 0.07 | −0.12 (−0.17, −0.07) | −0.07 | 0.11 (0.05, 0.17) | 0.05 | 0.02 (−0.10, 0.13) | 0.01 |
| Race/ethnicity | Reference: white | |||||||
| Black | −0.10 (−0.14, −0.07) | −0.04 | 0.19 (0.17, 0.21) | 0.07 | −0.16 (−0.18, −0.14) | −0.05 | −0.07 (−0.11, −0.02) | −0.02 |
| Hispanic | 0.01 (−0.02, 0.04) | 0.00 | 0.06 (0.04, 0.08) | 0.03 | 0.00 (−0.02, 0.02) | 0.00 | −0.03 (−0.07, 0.01) | −0.01 |
| Region | Reference: south | |||||||
| North Central | 0.03 (0.00, 0.06) | 0.01 | −0.04 (−0.06, −0.03) | −0.02 | 0.03 (0.01, 0.05) | 0.01 | 0.00 (−0.04, 0.03) | 0.00 |
| Northeast | 0.04 (0.01, 0.07) | 0.02 | −0.05 (−0.07, −0.03) | −0.02 | 0.00 (−0.02, 0.02) | 0.00 | −0.04 (−0.08, 0.01) | −0.01 |
| West | −0.01 (−0.03, 0.02) | 0.00 | 0.02 (0.00, 0.04) | 0.01 | −0.02 (−0.04, 0.00) | −0.01 | −0.05 (−0.09, −0.01) | −0.02 |
| Metro Area | Reference: medium | |||||||
| Large | 0.04 (0.01, 0.06) | 0.02 | −0.01 (−0.02, 0.01) | 0.00 | 0.00 (−0.02, 0.02) | 0.00 | −0.03 (−0.06, 0.01) | −0.01 |
| Small | 0.03 (0.01, 0.06) | 0.02 | −0.02 (−0.04, 0.00) | −0.01 | 0.03 (0.01, 0.05) | 0.01 | 0.02 (−0.01, 0.06) | 0.01 |
| GPA | Reference: B or higher | |||||||
| B- or lower | 0.25 (0.23, 0.27) | 0.13 | −0.23 (−0.25, −0.22) | −0.12 | 0.36 (0.34, 0.38) | 0.15 | 0.15 (0.12, 0.18) | 0.06 |
| Year*Belief | ||||||||
| 2009–2013*Liberal | −0.09 (−0.22, 0.05) | −0.02 | 0.00 (−0.08, 0.07) | 0.00 | 0.06 (−0.03, 0.16) | 0.02 | 0.15 (−0.03, 0.33) | 0.03 |
| 2014–2018*Liberal | 0.00 (−0.13, 0.13) | 0.00 | −0.10 (−0.18, −0.02) | −0.03 | 0.23 (0.13, 0.33) | 0.05 | 0.26 (0.07, 0.45) | 0.06 |
| 2009–2013*Moderate | −0.09 (−0.22, 0.04) | −0.03 | 0.03 (−0.05, 0.10) | 0.01 | 0.03 (−0.06, 0.12) | 0.01 | 0.16 (0.00, 0.32) | 0.04 |
| 2014–2018*Moderate | 0.13 (0.01, 0.25) | 0.04 | −0.03 (−0.11, 0.04) | −0.01 | 0.15 (0.06, 0.24) | 0.04 | 0.22 (0.06, 0.39) | 0.05 |
| 2009–2013*Radical | 0.00 (−0.32, 0.32) | 0.00 | 0.03 (−0.15, 0.21) | 0.00 | 0.22 (0.00, 0.44) | 0.02 | 0.29 (−0.12, 0.69) | 0.02 |
| 2014–2018*Radical | −0.05 (−0.34, 0.25) | 0.00 | −0.18 (−0.38, 0.02) | −0.01 | 0.26 (0.02, 0.49) | 0.02 | 0.34 (−0.11, 0.79) | 0.02 |
| 2009–2013*Unsure | −0.13 (−0.25, 0.00) | −0.05 | 0.03 (−0.04, 0.10) | 0.01 | 0.01 (−0.08, 0.10) | 0.00 | 0.08 (−0.08, 0.24) | 0.03 |
| 2014–2018*Unsure | 0.01 (−0.10, 0.13) | 0.01 | −0.05 (−0.13, 0.02) | −0.02 | 0.09 (0.00, 0.18) | 0.03 | 0.05 (−0.12, 0.22) | 0.01 |
| Sex*Belief | ||||||||
| Female*Liberal | 0.05 (−0.08, 0.17) | 0.02 | −0.10 (−0.17, −0.03) | −0.04 | 0.08 (0.00, 0.16) | 0.02 | 0.15 (−0.01, 0.31) | 0.04 |
| Female*Moderate | 0.04 (−0.07, 0.16) | 0.02 | −0.05 (−0.11, 0.02) | −0.02 | 0.05 (−0.03, 0.13) | 0.01 | 0.10 (−0.05, 0.24) | 0.03 |
| Female*Radical | −0.05 (−0.40, 0.30) | 0.00 | −0.12 (−0.32, 0.08) | −0.01 | 0.20 (−0.04, 0.43) | 0.01 | 0.63 (0.14, 1.11) | 0.03 |
| Female*Unsure | 0.02 (−0.09, 0.13) | 0.01 | −0.04 (−0.11, 0.02) | −0.02 | 0.07 (−0.01, 0.14) | 0.03 | 0.12 (−0.02, 0.27) | 0.04 |
| Year*Sex | ||||||||
| 2009–2013*Female | −0.11 (−0.23, 0.01) | −0.04 | −0.01 (−0.08, 0.06) | −0.01 | −0.01 (−0.09, 0.08) | 0.00 | 0.08 (−0.07, 0.24) | 0.03 |
| 2014–2018*Female | 0.05 (−0.07, 0.16) | 0.02 | −0.10 (−0.17, −0.03) | −0.04 | 0.09 (0.001, 0.17) | 0.03 | 0.22 (0.06, 0.38) | 0.07 |
| Belief*Parental Education | ||||||||
| Liberal*<College degree | −0.07 (−0.19, 0.05) | −0.02 | 0.06 (−0.01, 0.13) | 0.02 | −0.06 (−0.14, 0.03) | −0.01 | −0.01 (−0.17, 0.15) | 0.00 |
| Moderate*<College degree | −0.03 (−0.15, 0.09) | −0.01 | 0.08 (0.01, 0.14) | 0.03 | −0.05 (−0.13, 0.03) | −0.01 | 0.06 (−0.09, 0.21) | 0.02 |
| Radical*<College degree | −0.01 (−0.30, 0.28) | 0.00 | 0.08 (−0.09, 0.25) | 0.01 | 0.03 (−0.18, 0.23) | 0.00 | 0.02 (−0.38, 0.43) | 0.00 |
| Unsure*< College degree | −0.09 (−0.20, 0.02) | −0.04 | 0.11 (0.04, 0.17) | 0.05 | −0.08 (−0.16, −0.01) | −0.03 | −0.06 (−0.20, 0.09) | −0.02 |
| Year*Parental Education | ||||||||
| 2009–2013*<College degree | 0.00 (−0.13, 0.12) | 0.00 | −0.02 (−0.09, 0.05) | −0.01 | 0.07 (−0.02, 0.15) | 0.02 | 0.16 (0.00, 0.31) | 0.05 |
| 2014–2018*<College degree | 0.08 (−0.03, 0.19) | 0.04 | −0.11 (−0.18, −0.03) | −0.04 | 0.11 (0.02, 0.19) | 0.04 | 0.10 (−0.06, 0.26) | 0.03 |
| Year*Sex*Belief | ||||||||
| 2009–2013*Female*Liberal | 0.16 (−0.01, 0.32) | 0.03 | 0.01 (−0.09, 0.11) | 0.00 | 0.04 (−0.08, 0.15) | 0.01 | −0.01 (−0.23, 0.21) | 0.00 |
| 2014–2018*Female*Liberal | 0.17 (0.01, 0.32) | 0.04 | −0.01 (−0.11, 0.09) | 0.00 | 0.06 (−0.06, 0.18) | 0.01 | −0.06 (−0.28, 0.17) | −0.01 |
| 2009–2013*Female*Moderate | 0.07 (−0.09, 0.24) | 0.02 | 0.02 (−0.07, 0.11) | 0.01 | −0.02 (−0.13, 0.09) | 0.00 | −0.10 (−0.30, 0.11) | −0.02 |
| 2014–2018*Female*Moderate | −0.12 (−0.27, 0.04) | −0.03 | 0.05 (−0.04, 0.15) | 0.01 | 0.00 (−0.12, 0.11) | 0.00 | −0.13 (−0.34, 0.08) | −0.02 |
| 2009–2013*Female*Radical | −0.65 (−1.19, −0.11) | −0.02 | 0.25 (−0.04, 0.53) | 0.01 | −0.35 (−0.69, −0.01) | −0.01 | −0.61 (−1.27, 0.05) | −0.02 |
| 2014–2018*Female*Radical | −0.17 (−0.61, 0.28) | −0.01 | 0.30 (0.01, 0.59) | 0.01 | −0.03 (−0.37, 0.32) | 0.00 | −0.46 (−1.15, 0.24) | −0.01 |
| 2009–2013*Female*Unsure | 0.11 (−0.04, 0.26) | 0.03 | 0.01 (−0.07, 0.10) | 0.00 | 0.00 (−0.10, 0.11) | 0.00 | −0.05 (−0.24, 0.14) | −0.01 |
| 2014–2018*Female*Unsure | −0.02 (−0.16, 0.12) | −0.01 | 0.06 (−0.03, 0.15) | 0.02 | 0.03 (−0.07, 0.14) | 0.01 | −0.06 (−0.26, 0.14) | −0.01 |
| Year*Belief*Parental Education | ||||||||
| 2009–2013*Liberal*<College degree | 0.05 (−0.12, 0.22) | 0.01 | −0.01 (−0.11, 0.08) | 0.00 | −0.03 (−0.14, 0.09) | 0.00 | −0.15 (−0.38, 0.07) | −0.02 |
| 2014–2018*Liberal*<College degree | −0.03 (−0.18, 0.13) | −0.01 | 0.09 (−0.02, 0.19) | 0.02 | −0.10 (−0.22, 0.02) | −0.02 | −0.10 (−0.33, 0.13) | −0.02 |
| 2009–2013*Moderate*<College degree | 0.06 (−0.11, 0.22) | 0.01 | −0.01 (−0.10, 0.08) | 0.00 | −0.03 (−0.14, 0.08) | −0.01 | −0.18 (−0.39, 0.02) | −0.03 |
| 2014–2018*Moderate*<College degree | −0.13 (−0.28, 0.03) | −0.03 | 0.06 (−0.03, 0.16) | 0.01 | −0.06 (−0.18, 0.06) | −0.01 | −0.23 (−0.45, −0.02) | −0.04 |
| 2009–2013*Radical*<College degree | −0.02 (−0.45, 0.40) | 0.00 | 0.10 (−0.14, 0.34) | 0.01 | −0.37 (−0.66, −0.08) | −0.02 | −0.59 (−1.15, −0.03) | −0.03 |
| 2014–2018*Radical*<College degree | −0.33 (−0.73, 0.06) | −0.02 | −0.06 (−0.32, 0.20) | 0.00 | −0.36 (−0.68, −0.04) | −0.02 | −0.47 (−1.09, 0.16) | −0.02 |
| 2009–2013*Unsure*<College degree | 0.06 (−0.09, 0.21) | 0.02 | −0.02 (−0.11, 0.06) | −0.01 | −0.04 (−0.14, 0.07) | −0.01 | −0.06 (−0.26, 0.13) | −0.02 |
| 2014–2018*Unsure*<College degree | −0.10 (−0.24, 0.04) | −0.03 | 0.09 (0.00, 0.18) | 0.03 | −0.06 (−0.17, 0.05) | −0.01 | 0.06 (−0.14, 0.26) | 0.01 |
b = unstandardized regression coefficient, β = standardized regression coefficient.
All models adjusted for geographic region, urbanicity, race/ethnicity, and GPA.
Appendix Table A.5.
Internalizing symptoms linear regression unstandardized coefficients and E-values for selected predictor and moderator main effect contrasts.
| Depressive affect | Self-esteem | Self-derogation | Loneliness | |||||
|---|---|---|---|---|---|---|---|---|
| b (95% CI) | E-value | b (95% CI) | E-value | b (95% CI) | E-value | b (95% CI) | E-value | |
| Year | Reference: 2005 – 2008 | |||||||
| 2014–2018 | 0.34 (0.26, 0.43) | 2.25 | −0.12 (−0.17, −0.06) | 1.53 | 0.10 (0.03, 0.16) | 1.41 | 0.06 (−0.07, 0.18) | 1.27 |
| Sex | Reference: male | |||||||
| Female | −0.01 (−0.10, 0.07) | 1.14 | −0.02 (−0.07, 0.03) | 1.16 | 0.02 (−0.04, 0.08) | 1.16 | 0.07 (−0.04, 0.18) | 1.31 |
| Political Belief | Reference: conservative | |||||||
| Liberal | 0.22 (0.12, 0.32) | 1.85 | −0.09 (−0.15, −0.03) | 1.43 | 0.12 (0.05, 0.18) | 1.46 | 0.07 (−0.06, 0.20) | 1.32 |
| Parental Education | Reference: ≥ college degree | |||||||
| < College degree | 0.12 (0.04, 0.21) | 1.54 | −0.12 (−0.17, −0.07) | 1.54 | 0.11 (0.05, 0.17) | 1.43 | 0.02 (−0.10, 0.13) | 1.13 |
All regression models adjusted for geographic region, urbanicity, race/ethnicity, and GPA.
Each continuous internalizing symptom outcome was auto-binarized as high versus low within the R EValue package in order to calculate baseline risk ratios for indicator variables and outcomes. The lowest E-value possible is 1. The higher the E-value, the stronger uncontrolled for confounding would need to be to nullify an observed result. Note on interpretation: An E-value of 1.85 for depressive affect may be interpreted as follows – An unmeasured confounder would need to be associated with both political beliefs (liberal compared to conservative) and depressive affect (high compared to low) by a risk ratio of 1.85 in order to explain away the finding that depressive affect is0.22 points higher for liberals than conservatives on average, when controlling for geographic region, urbanicity, race/ethnicity, and GPA.
Appendix Table A.6.
Internalizing symptoms linear regression unstandardized and standardized coefficients for models additionally adjusted for religiosity.
| Depressive affect | Self-esteem | Self-derogation | Loneliness | |||||
|---|---|---|---|---|---|---|---|---|
| b (95% CI) | β | b (95% CI) | β | b (95% CI) | β | b (95% CI) | β | |
| Intercept | 1.49 (1.41, 1.56) | – | 4.38 (4.33, 4.42) | – | 1.69 (1.64, 1.75) | – | 2.46 (2.36, 2.56) | – |
| Year | Reference: 2005 – 2008 | |||||||
| 2009–2013 | 0.07 (−0.04, 0.17) | 0.03 | −0.01 (−0.07, 0.05) | 0.00 | −0.05 (−0.12, 0.02) | −0.02 | −0.13 (−0.27, 0.00) | −0.06 |
| 2014–2018 | 0.29 (0.20, 0.38) | 0.16 | −0.09 (−0.15, −0.03) | −0.05 | 0.07 (0.00, 0.14) | 0.03 | 0.09 (−0.05, 0.22) | 0.04 |
| Sex | Reference: male | |||||||
| Female | −0.02 (−0.11, 0.08) | −0.01 | −0.01 (−0.06, 0.05) | −0.01 | 0.01 (−0.06, 0.08) | 0.01 | 0.13 (0.00, 0.25) | 0.06 |
| Political Belief | Reference: conservative | |||||||
| Liberal | 0.11 (0.00, 0.22) | 0.05 | −0.02 (−0.09, 0.04) | −0.01 | 0.04 (−0.04, 0.12) | 0.01 | 0.05 (−0.09, 0.20) | 0.02 |
| Moderate | 0.05 (−0.05, 0.16) | 0.02 | −0.03 (−0.09, 0.03) | −0.01 | 0.02 (−0.05, 0.09) | 0.01 | 0.00 (−0.13, 0.12) | 0.00 |
| Radical | 0.70 (0.46, 0.94) | 0.10 | −0.22 (−0.36, −0.07) | −0.03 | 0.27 (0.10, 0.44) | 0.03 | 0.16 (−0.19, 0.51) | 0.02 |
| Unsure | 0.17 (0.07, 0.27) | 0.09 | −0.13 (−0.19, −0.07) | −0.07 | 0.14 (0.07, 0.21) | 0.07 | 0.08 (−0.06, 0.21) | 0.03 |
| Parental Education | Reference: ≥ college degree | |||||||
| < College degree | 0.11 (0.02, 0.21) | 0.06 | −0.11 (−0.17, −0.06) | −0.06 | 0.09 (0.03, 0.16) | 0.05 | −0.02 (−0.15, 0.10) | −0.01 |
| Race/ethnicity | Reference: white | |||||||
| Black | −0.02 (−0.06, 0.01) | −0.01 | 0.14 (0.12, 0.16) | 0.06 | −0.10 (−0.13, −0.08) | −0.03 | −0.03 (−0.07, 0.02) | −0.01 |
| Hispanic | 0.07 (0.03, 0.10) | 0.03 | 0.03 (0.01, 0.06) | 0.01 | 0.03 (0.00, 0.06) | 0.01 | −0.03 (−0.08, 0.02) | −0.01 |
| Region | Reference: south | |||||||
| North Central | 0.01 (−0.02, 0.03) | 0.00 | −0.03 (−0.05, −0.01) | −0.02 | 0.02 (0.004, 0.04) | 0.01 | −0.01 (−0.05, 0.02) | −0.01 |
| Northeast | −0.02 (−0.05, 0.01) | −0.01 | 0.005 (−0.02, 0.01) | 0.00 | −0.04 (−0.06, | −0.02 | −0.06 (−0.11, | −0.02 |
| Metro Area | Reference: medium | −0.02) | −0.02) | |||||
| Large | 0.02 (−0.01, 0.04) | 0.01 | 0.01 (−0.01, 0.02) | 0.00 | −0.02 (−0.04, 0.00) | −0.01 | −0.04 (−0.08, 0.00) | −0.02 |
| Small | 0.04 (0.01, 0.07) | 0.02 | −0.02 (−0.04, −0.01) | −0.01 | 0.03 (0.01, 0.05) | 0.01 | 0.02 (−0.02, 0.06) | 0.01 |
| GPA | Reference: B or higher | |||||||
| B- or lower | 0.23 (0.20, 0.25) | 0.11 | −0.21 (−0.23, −0.20) | −0.11 | 0.34 (0.32, 0.36) | 0.14 | 0.14 (0.10, 0.18) | 0.05 |
| Religiosity | Reference: more religious | |||||||
| Less religious | 0.29 (0.26, 0.31) | 0.16 | −0.20 (−0.22, −0.19) | −0.12 | 0.20 (0.18, 0.21) | 0.09 | 0.12 (0.09, 0.15) | 0.05 |
| Year*Belief | ||||||||
| 2009–2013*Liberal | −0.05 (−0.20, 0.11) | −0.01 | −0.01 (−0.10, 0.08) | 0.00 | 0.09 (−0.02, 0.20) | 0.02 | 0.06 (−0.14, 0.26) | 0.01 |
| 2014–2018*Liberal | 0.05 (−0.09, 0.20) | 0.02 | −0.10 (−0.20, −0.01) | −0.03 | 0.24 (0.13, 0.35) | 0.05 | 0.21 (0.00, 0.43) | 0.04 |
| 2009–2013*Moderate | −0.06 (−0.21, 0.08) | −0.02 | 0.01 (−0.07, 0.09) | 0.00 | 0.08 (−0.02, 0.17) | 0.02 | 0.15 (−0.03, 0.33) | 0.04 |
| 2014–2018*Moderate | 0.08 (−0.05, 0.22) | 0.03 | −0.04 (−0.13, 0.04) | −0.01 | 0.17 (0.07, 0.27) | 0.04 | 0.17 (−0.01, 0.36) | 0.04 |
| 2009–2013*Radical | −0.16 (−0.51, 0.20) | −0.01 | 0.02 (−0.18, 0.22) | 0.00 | 0.25 (0.01, 0.50) | 0.02 | 0.20 (−0.25, 0.66) | 0.01 |
| 2014–2018*Radical | −0.16 (−0.49, 0.16) | −0.01 | −0.26 (−0.48, −0.04) | −0.02 | 0.42 (0.16, 0.69) | 0.03 | 0.18 (−0.34, 0.70) | 0.01 |
| 2009–2013*Unsure | −0.14 (−0.28, 0.00) | −0.05 | 0.04 (−0.04, 0.12) | 0.02 | 0.00 (−0.10, 0.09) | 0.00 | 0.07 (−0.11, 0.24) | 0.02 |
| 2014–2018*Unsure | 0.04 (−0.09, 0.17) | 0.02 | −0.06 (−0.14, 0.02) | −0.02 | 0.08 (−0.02, 0.18) | 0.02 | 0.003 (−0.19, 0.18) | 0.00 |
| Sex*Belief | ||||||||
| Female*Liberal | 0.08 (−0.06, 0.21) | 0.03 | −0.11 (−0.19, −0.03) | −0.04 | 0.09 (0.00, 0.18) | 0.03 | 0.07 (−0.11, 0.25) | 0.02 |
| Female*Moderate | 0.07 (−0.06, 0.20) | 0.02 | −0.06 (−0.13, 0.02) | −0.02 | 0.05 (−0.03, 0.14) | 0.02 | 0.04 (−0.12, 0.20) | 0.01 |
| Female*Radical | −0.18 (−0.57, 0.21) | −0.01 | −0.18 (−0.40, 0.04) | −0.01 | 0.23 (−0.03, 0.49) | 0.01 | 0.48 (−0.03, 0.99) | 0.02 |
| Female*Unsure | 0.02 (−0.10, 0.14) | 0.01 | −0.05 (−0.12, 0.02) | −0.02 | 0.07 (−0.01, 0.16) | 0.03 | 0.07 (−0.08, 0.23) | 0.03 |
| Year*Sex | ||||||||
| 2009–2013*Female | −0.05 (−0.19, 0.08) | −0.02 | −0.05 (−0.13, 0.02) | −0.02 | 0.06 (−0.03, 0.15) | 0.02 | 0.08 (−0.09, 0.25) | 0.03 |
| 2014–2018*Female | 0.11 (−0.01, 0.24) | 0.05 | −0.13 (−0.21, −0.05) | −0.06 | 0.12 (0.02, 0.21) | 0.04 | 0.16 (−0.02, 0.34) | 0.05 |
| Belief*Parental Education | ||||||||
| Liberal*<College degree | −0.03 (−0.17, 0.11) | −0.01 | 0.03 (−0.05, 0.11) | 0.01 | −0.01 (−0.10, 0.09) | 0.00 | −0.02 (−0.20, 0.17) | 0.00 |
| Moderate*<College degree | −0.02 (−0.15, 0.11) | −0.01 | 0.07 (0.00, 0.14) | 0.03 | −0.03 (−0.11, 0.06) | −0.01 | 0.09 (−0.07, 0.25) | 0.03 |
| Radical*<College degree | −0.11 (−0.43, 0.21) | −0.01 | 0.09 (−0.09, 0.28) | 0.01 | 0.06 (−0.17, 0.28) | 0.00 | −0.02 (−0.47, 0.43) | 0.00 |
| Unsure*< College degree | −0.10 (−0.23, 0.02) | −0.05 | 0.11 (0.04, 0.18) | 0.05 | −0.09 (−0.18, −0.01) | −0.04 | −0.04 (−0.20, 0.12) | −0.01 |
| Year*Parental Education | ||||||||
| 2009–2013*<College degree | −0.02 (−0.15, 0.12) | −0.01 | −0.01 (−0.09, 0.07) | 0.00 | 0.06 (−0.03, 0.16) | 0.02 | 0.21 (0.04, 0.39) | 0.07 |
| 2014–2018*<College degree | 0.09 (−0.04, 0.21) | 0.04 | −0.12 (−0.20, −0.04) | −0.05 | 0.11 (0.01, 0.20) | 0.04 | 0.05 (−0.13, 0.23) | 0.02 |
| Year*Sex*Belief | ||||||||
| 2009–2013*Female*Liberal | 0.10 (−0.09, 0.29) | 0.02 | 0.05 (−0.06, 0.16) | 0.01 | 0.00 (−0.13, 0.13) | 0.00 | 0.11 (−0.14, 0.36) | 0.02 |
| 2014–2018*Female*Liberal | 0.05 (−0.12, 0.23) | 0.01 | 0.03 (−0.08, 0.14) | 0.01 | 0.02 (−0.11, 0.16) | 0.00 | 0.01 (−0.25, 0.26) | 0.00 |
| 2009–2013*Female*Moderate | 0.02 (−0.15, 0.20) | 0.01 | 0.05 (−0.05, 0.15) | 0.01 | −0.08 (−0.20, 0.04) | −0.02 | −0.07 (−0.29, 0.16) | −0.01 |
| 2014–2018*Female*Moderate | −0.11 (−0.27, 0.06) | −0.03 | 0.05 (−0.06, 0.15) | 0.01 | 0.00 (−0.12, 0.13) | 0.00 | −0.05 (−0.28, 0.19) | −0.01 |
| 2009–2013*Female*Radical | −0.41 (−1.01, 0.20) | −0.01 | 0.35 (0.03, 0.67) | 0.01 | −0.42 (−0.81, −0.04) | −0.01 | −0.57 (−1.33, 0.18) | −0.02 |
| 2014–2018*Female*Radical | −0.10 (−0.60, 0.41) | 0.00 | 0.38 (0.06, 0.70) | 0.02 | −0.18 (−0.57, 0.20) | −0.01 | −0.34 (−1.14, 0.47) | −0.01 |
| 2009–2013*Female*Unsure | 0.08 (−0.09, 0.24) | 0.02 | 0.04 (−0.06, 0.13) | 0.01 | −0.05 (−0.16, 0.07) | −0.01 | −0.04 (−0.26, 0.17) | −0.01 |
| 2014–2018*Female*Unsure | −0.06 (−0.22, 0.09) | −0.02 | 0.08 (−0.02, 0.17) | 0.02 | 0.03 (−0.09, 0.15) | 0.01 | 0.02 (−0.20, 0.24) | 0.00 |
| Year*Belief*Parental Education | ||||||||
| 2009–2013*Liberal*<College degree | 0.00 (−0.19, 0.19) | 0.00 | 0.00 (−0.11, 0.11) | 0.00 | −0.08 (−0.22, 0.05) | −0.01 | −0.19 (−0.44, 0.06) | −0.03 |
| 2014–2018*Liberal*<College degree | −0.09 (−0.26, 0.09) | −0.02 | 0.10 (−0.02, 0.21) | 0.02 | −0.10 (−0.24, 0.03) | −0.02 | −0.02 (−0.28, 0.23) | 0.00 |
| 2009–2013*Moderate*<College degree | 0.05 (−0.13, 0.23) | 0.01 | −0.01 (−0.11, 0.10) | 0.00 | −0.05 (−0.17, 0.08) | −0.01 | −0.24 (−0.47, −0.01) | −0.04 |
| 2014–2018*Moderate*<College degree | −0.10 (−0.27, 0.07) | −0.02 | 0.09 (−0.02, 0.20) | 0.02 | −0.09 (−0.22, 0.04) | −0.02 | −0.18 (−0.42, 0.06) | −0.03 |
| 2009–2013*Radical*<College degree | 0.22 (−0.25, 0.69) | 0.01 | 0.07 (−0.20, 0.34) | 0.00 | −0.36 (−0.68, | −0.02 | −0.37 (−1.02, 0.28) | −0.01 |
| 2014–2018*Radical*<College degree | −0.22 (−0.65, 0.22) | −0.01 | 0.00 (−0.29, 0.30) | 0.00 | −0.04) −0.42 (−0.78, | −0.02 | −0.28 (−0.98, 0.42) | −0.01 |
| 2009–2013*Unsure*<College degree | 0.08 (−0.09, 0.25) | 0.02 | −0.03 (−0.13, 0.06) | −0.01 | −0.07) −0.01 (−0.13, 0.11) | 0.00 | −0.11 (−0.32, 0.11) | −0.03 |
| 2014–2018*Unsure*<College degree | −0.13 (−0.29, 0.03) | −0.04 | 0.11 (0.01, 0.21) | 0.03 | −0.06 (−0.18, 0.06) | −0.02 | 0.10 (−0.12, 0.33) | 0.02 |
b = unstandardized regression coefficient, β = standardized regression coefficient.
All models adjusted for geographic region, urbanicity, race/ethnicity, GPA, and religiosity.
Appendix Table A.7.
Internalizing symptoms linear regression unstandardized and standardized coefficients for models additionally adjusted for religiosity and social media use.
| Self-esteem | Self-derogation | |||
|---|---|---|---|---|
| b (95% CI) | β | b (95% CI) | β | |
| Intercept | 4.41 (4.33, 4.49) | – | 1.60 (1.51, 1.70) | – |
| Year | Reference: 2008 – 2012 | |||
| 2013–2017 | −0.12 (−0.23, −0.01) | −0.07 | 0.07 (−0.05, 0.20) | 0.03 |
| Sex | Reference: male | |||
| Female | −0.10 (−0.2, 0.00) | −0.05 | 0.12 (0, 0.23) | 0.05 |
| Political Belief | Reference: conservative | |||
| Liberal | −0.11 (−0.22, 0.00) | −0.05 | 0.23 (0.09, 0.36) | 0.08 |
| Moderate | −0.04 (−0.14, 0.07) | −0.02 | 0.10 (−0.02, 0.22) | 0.04 |
| Radical | −0.09 (−0.35, 0.16) | −0.01 | 0.59 (0.28, 0.89) | 0.07 |
| Unsure | −0.06 (−0.16, 0.04) | −0.03 | 0.13 (0.02, 0.25) | 0.06 |
| Parental Education | Reference: > college degree | |||
| < College degree | −0.10 (−0.20, 0.00) | −0.05 | 0.25 (0.13, 0.37) | 0.12 |
| Race | Reference: white | |||
| Black | 0.05 (0.01, 0.10) | 0.02 | −0.06 (−0.11, 0.00) | −0.02 |
| Hispanic | 0.04 (−0.01, 0.09) | 0.01 | 0.02 (−0.04, 0.08) | 0.01 |
| Region | Reference: south | |||
| North Central | −0.04 (−0.08, 0.00) | −0.02 | 0.04 (−0.01, 0.08) | 0.02 |
| Northeast | 0.01 (−0.04, 0.05) | 0.00 | −0.04 (−0.09, 0.01) | −0.01 |
| Metro Area | Reference: medium | |||
| Large | 0.00 (−0.03, 0.04) | 0.00 | 0.00 (−0.04, 0.05) | 0.00 |
| Small | −0.03 (−0.07, 0.01) | −0.01 | 0.02 (−0.03, 0.07) | 0.01 |
| GPA | Reference: B or higher | |||
| B- or lower | −0.18 (−0.22, −0.14) | −0.08 | 0.35 (0.31, 0.39) | 0.14 |
| Religiosity | Reference: more religious | |||
| Less religious | −0.20 (−0.24, −0.17) | −0.11 | 0.18 (0.15, 0.22) | 0.08 |
| Social Media | Reference: daily use | |||
| Non-daily use | −0.09 (−0.13, −0.06) | −0.05 | 0.04 (0, 0.08) | 0.02 |
| Year*Belief | ||||
| 2013–2017*Liberal | 0.04 (−0.13, 0.22) | 0.01 | 0.18 (−0.02, 0.39) | 0.05 |
| 2013–2017*Moderate | −0.02 (−0.17, 0.13) | −0.01 | 0.14 (−0.04, 0.32) | 0.04 |
| 2013–2017*Radical | −0.19 (−0.62, 0.23) | −0.02 | 0.68 (0.17, 1.18) | 0.05 |
| 2013–2017*Unsure | −0.12 (−0.27, 0.02) | −0.05 | 0.11 (−0.06, 0.29) | 0.04 |
| Sex*Belief | ||||
| Female*Liberal | 0.1 (−0.04, 0.24) | 0.03 | −0.06 (−0.23, 0.1) | −0.02 |
| Female*Moderate | 0.02 (−0.11, 0.15) | 0.01 | −0.03 (−0.18, 0.13) | −0.01 |
| Female*Radical | 0.08 (−0.27, 0.43) | 0.01 | 0.10 (−0.31, 0.52) | 0.01 |
| Female*Unsure | 0.00 (−0.12, 0.12) | 0.00 | 0.03 (−0.12, 0.17) | 0.01 |
| Year*Sex | ||||
| 2013–2017*Female | 0.05 (−0.09, 0.19) | 0.02 | 0.12 (−0.05, 0.28) | 0.05 |
| Belief*Parental Education | ||||
| Liberal*<College degree | 0.01 (−0.13, 0.15) | 0.00 | −0.26 (−0.43, −0.10) | −0.06 |
| Moderate*<College degree | 0.07 (−0.06, 0.20) | 0.02 | −0.19 (−0.34, −0.04) | −0.06 |
| Radical*<College degree | −0.02 (−0.34, 0.31) | 0.00 | −0.45 (−0.83, −0.07) | −0.04 |
| Unsure*< College degree | 0.04 (−0.08, 0.17) | 0.02 | −0.19 (−0.34, −0.04) | −0.07 |
| Year*Parental Education | ||||
| 2013–2017*<College degree | −0.14 (−0.29, 0.00) | −0.06 | 0.07 (−0.10, 0.24) | 0.03 |
| Year*Sex*Belief | ||||
| 2013–2017*Female*Liberal | 0.13 (−0.08, 0.34) | 0.02 | 0.03 (−0.21, 0.28) | 0.01 |
| 2013–2017*Female*Moderate | 0.07 (−0.12, 0.27) | 0.02 | −0.03 (−0.25, 0.19) | −0.01 |
| 2013–2017*Female*Radical | 0.29 (−0.25, 0.82) | 0.02 | −0.37 (−1.04, 0.30) | −0.02 |
| 2013–2017*Female*Unsure | 0.19 (0.01, 0.37) | 0.06 | 0.05 (−0.16, 0.25) | 0.01 |
| Year*Belief*Parental Education | ||||
| 2013–2017*Liberal*<College degree | −0.27 (−0.47, −0.06) | −0.06 | 0.02 (−0.23, 0.26) | 0.00 |
| 2013–2017*Moderate*<College degree | −0.08 (−0.27, 0.11) | −0.02 | −0.08 (−0.30, 0.15) | −0.02 |
| 2013–2017*Radical*<College degree | −0.73 (−1.30, −0.16) | −0.04 | −0.32 (−0.95, 0.32) | −0.02 |
| 2013–2017*Unsure*<College degree | −0.08 (−0.25, 0.10) | −0.03 | −0.08 (−0.3, 0.13) | −0.02 |
b = unstandardized regression coefficient, β = standardized regression coefficient.
All models adjusted for geographic region, urbanicity, race/ethnicity, GPA, religiosity, and social media use.
Appendix Fig. A.1.
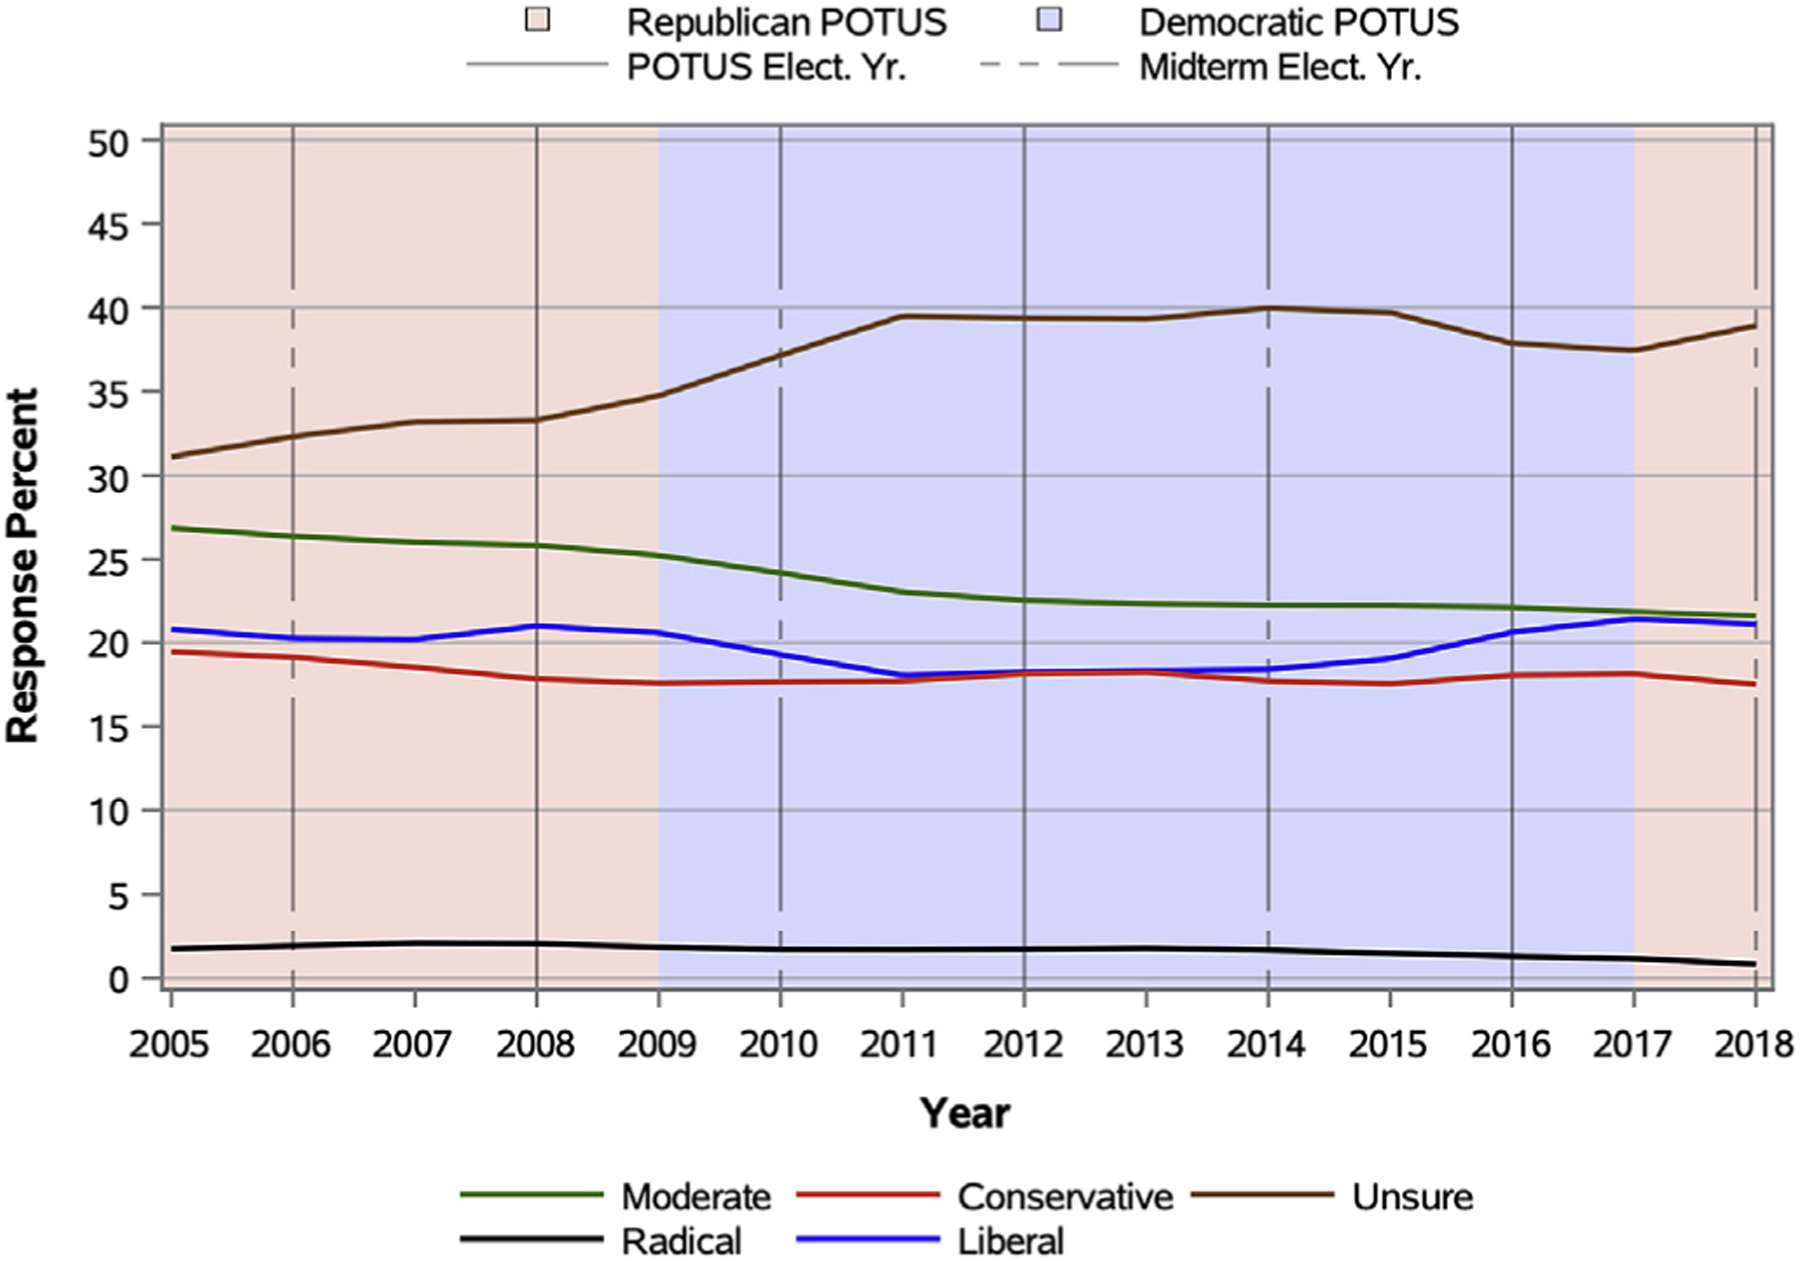
Relative frequencies of political beliefs among 12th-graders from 2005 to 2018. POTUS = President of the United States. Relative frequency of responses to “How would you describe your political beliefs?” in weighted sample of 12th-graders from 2005 to 2018. Sample excluded respondents with missing data for internalizing symptoms and sex. LOESS regression parameters plotted.
Appendix Fig. A.2.1.
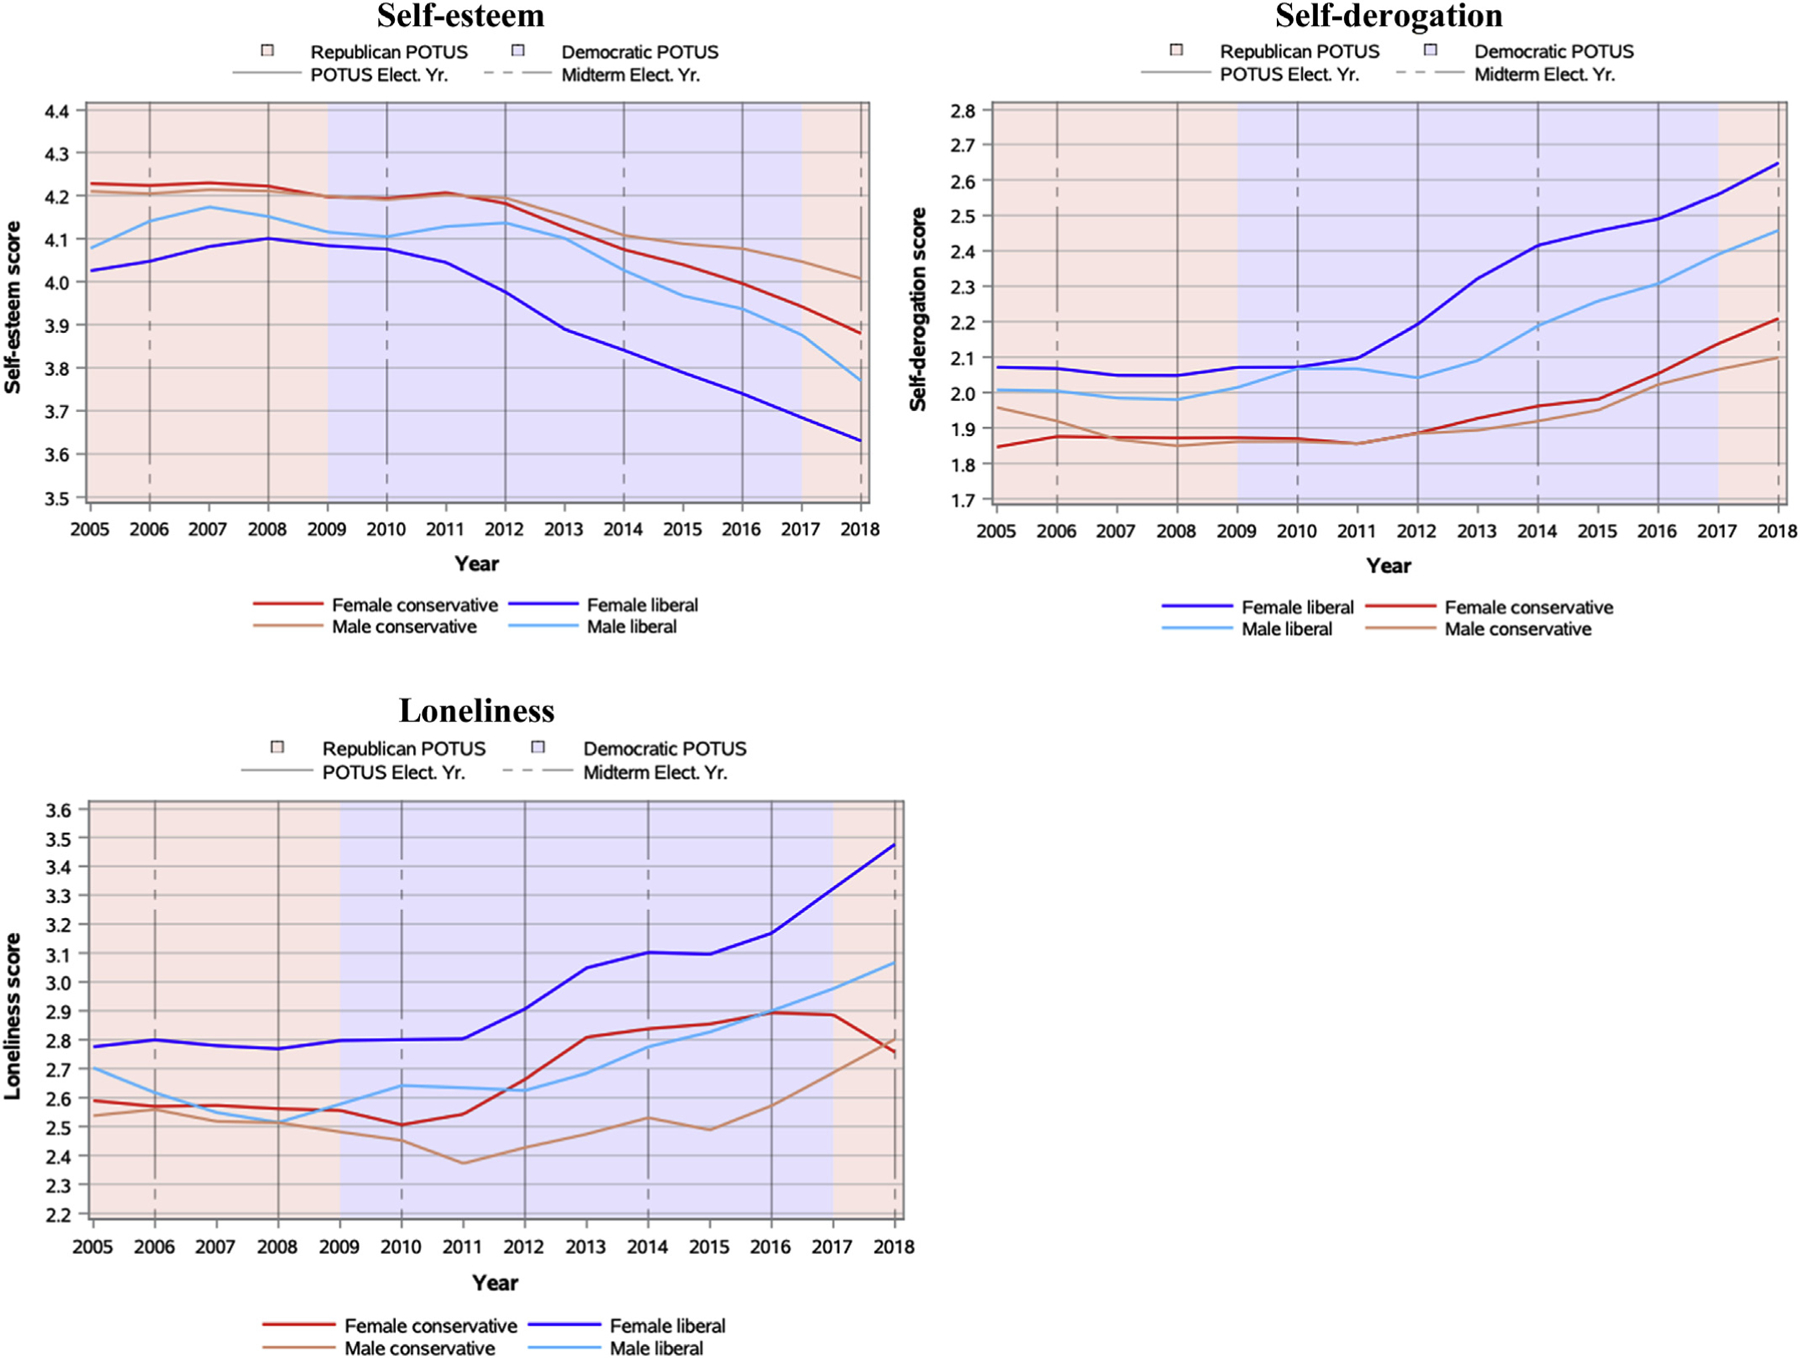
Mean main effects of political beliefs on self-esteem, self-derogation, and loneliness by sex: Conservative and liberal 12th-graders from 2005 to 2018.
Appendix Fig. A.2.2.
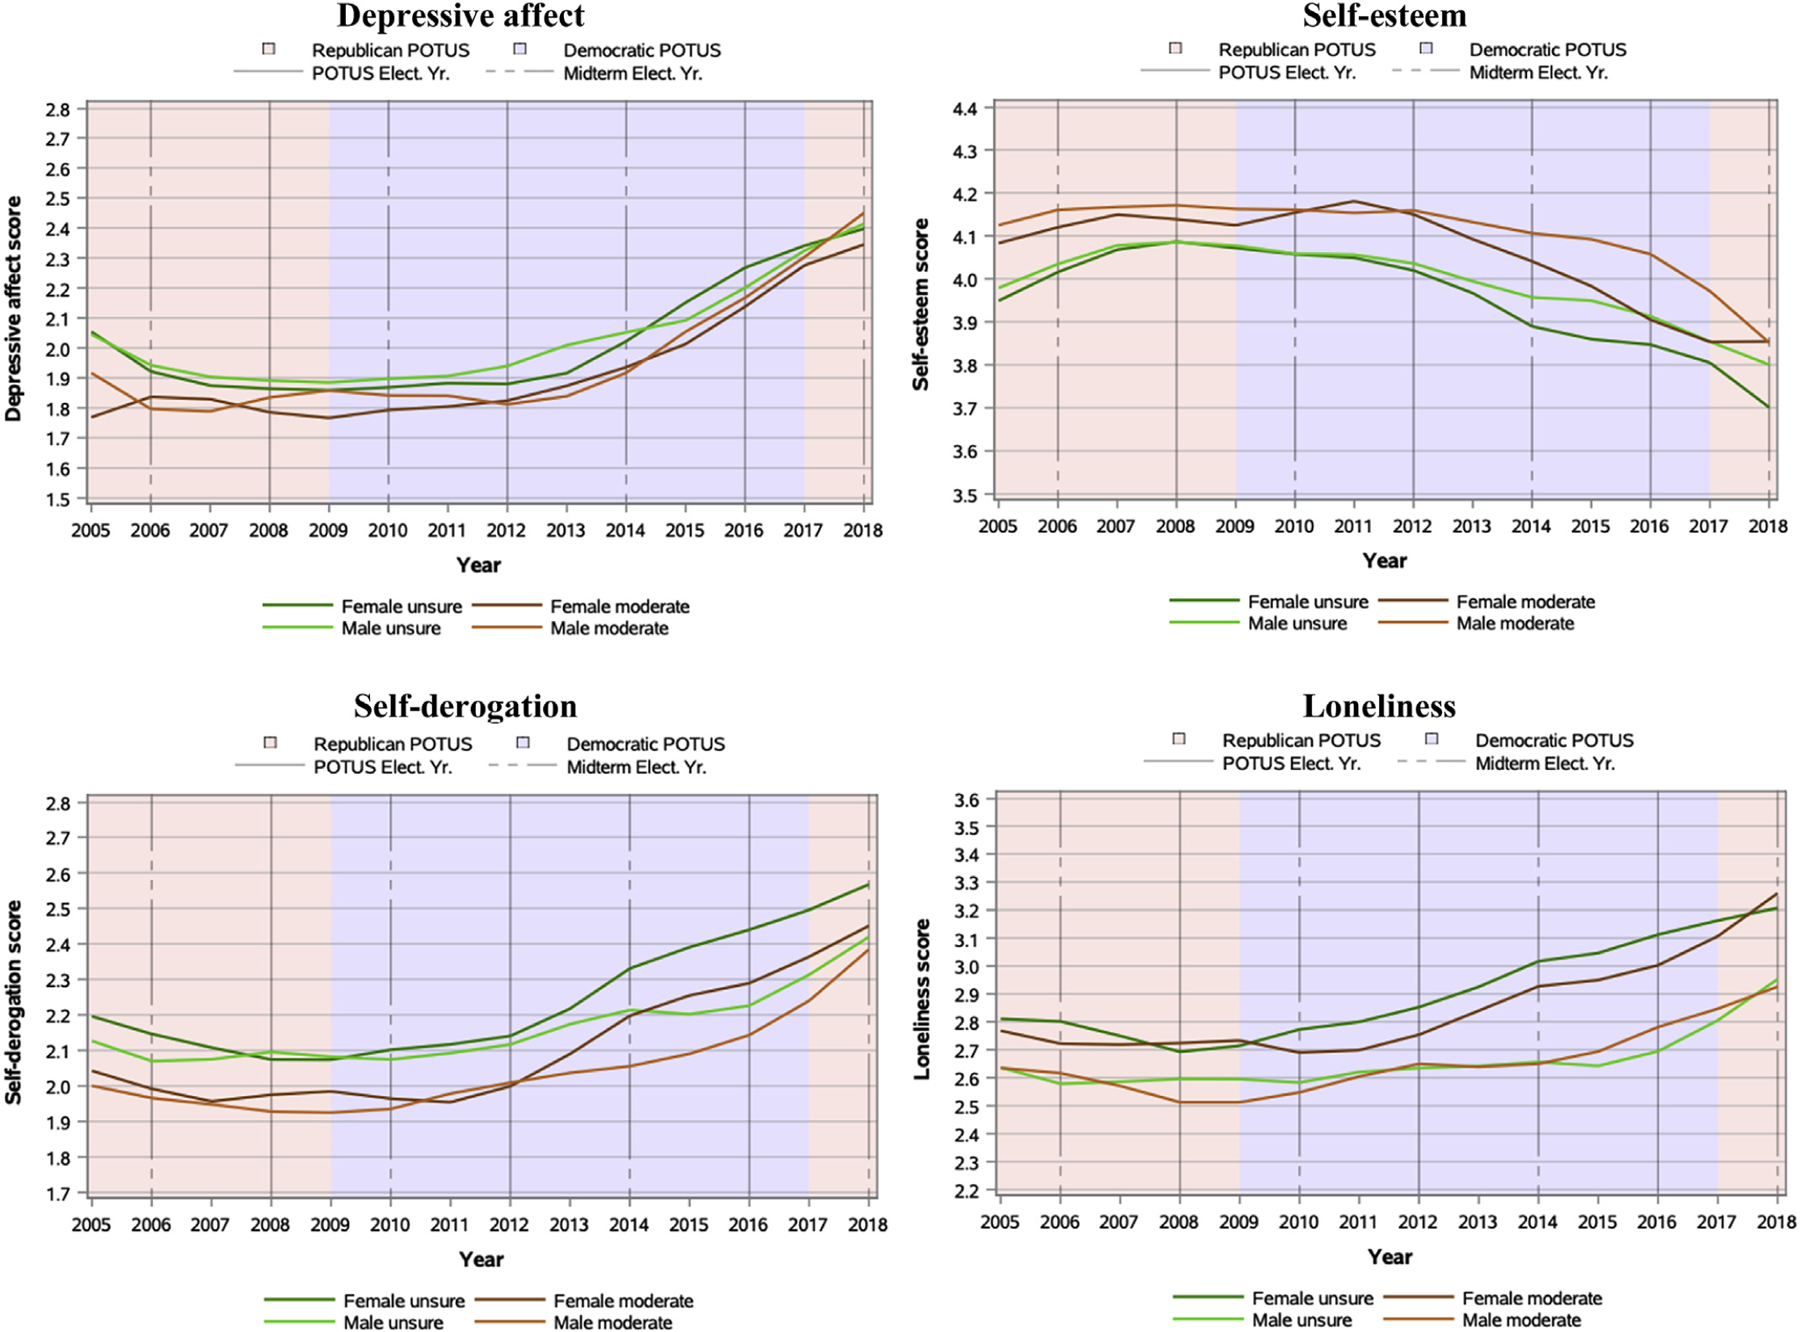
Mean main effects of political beliefs on internalizing symptoms by sex: Moderate and unsure 12th-graders from 2005 to 2018.
Appendix Fig. A.3.1.
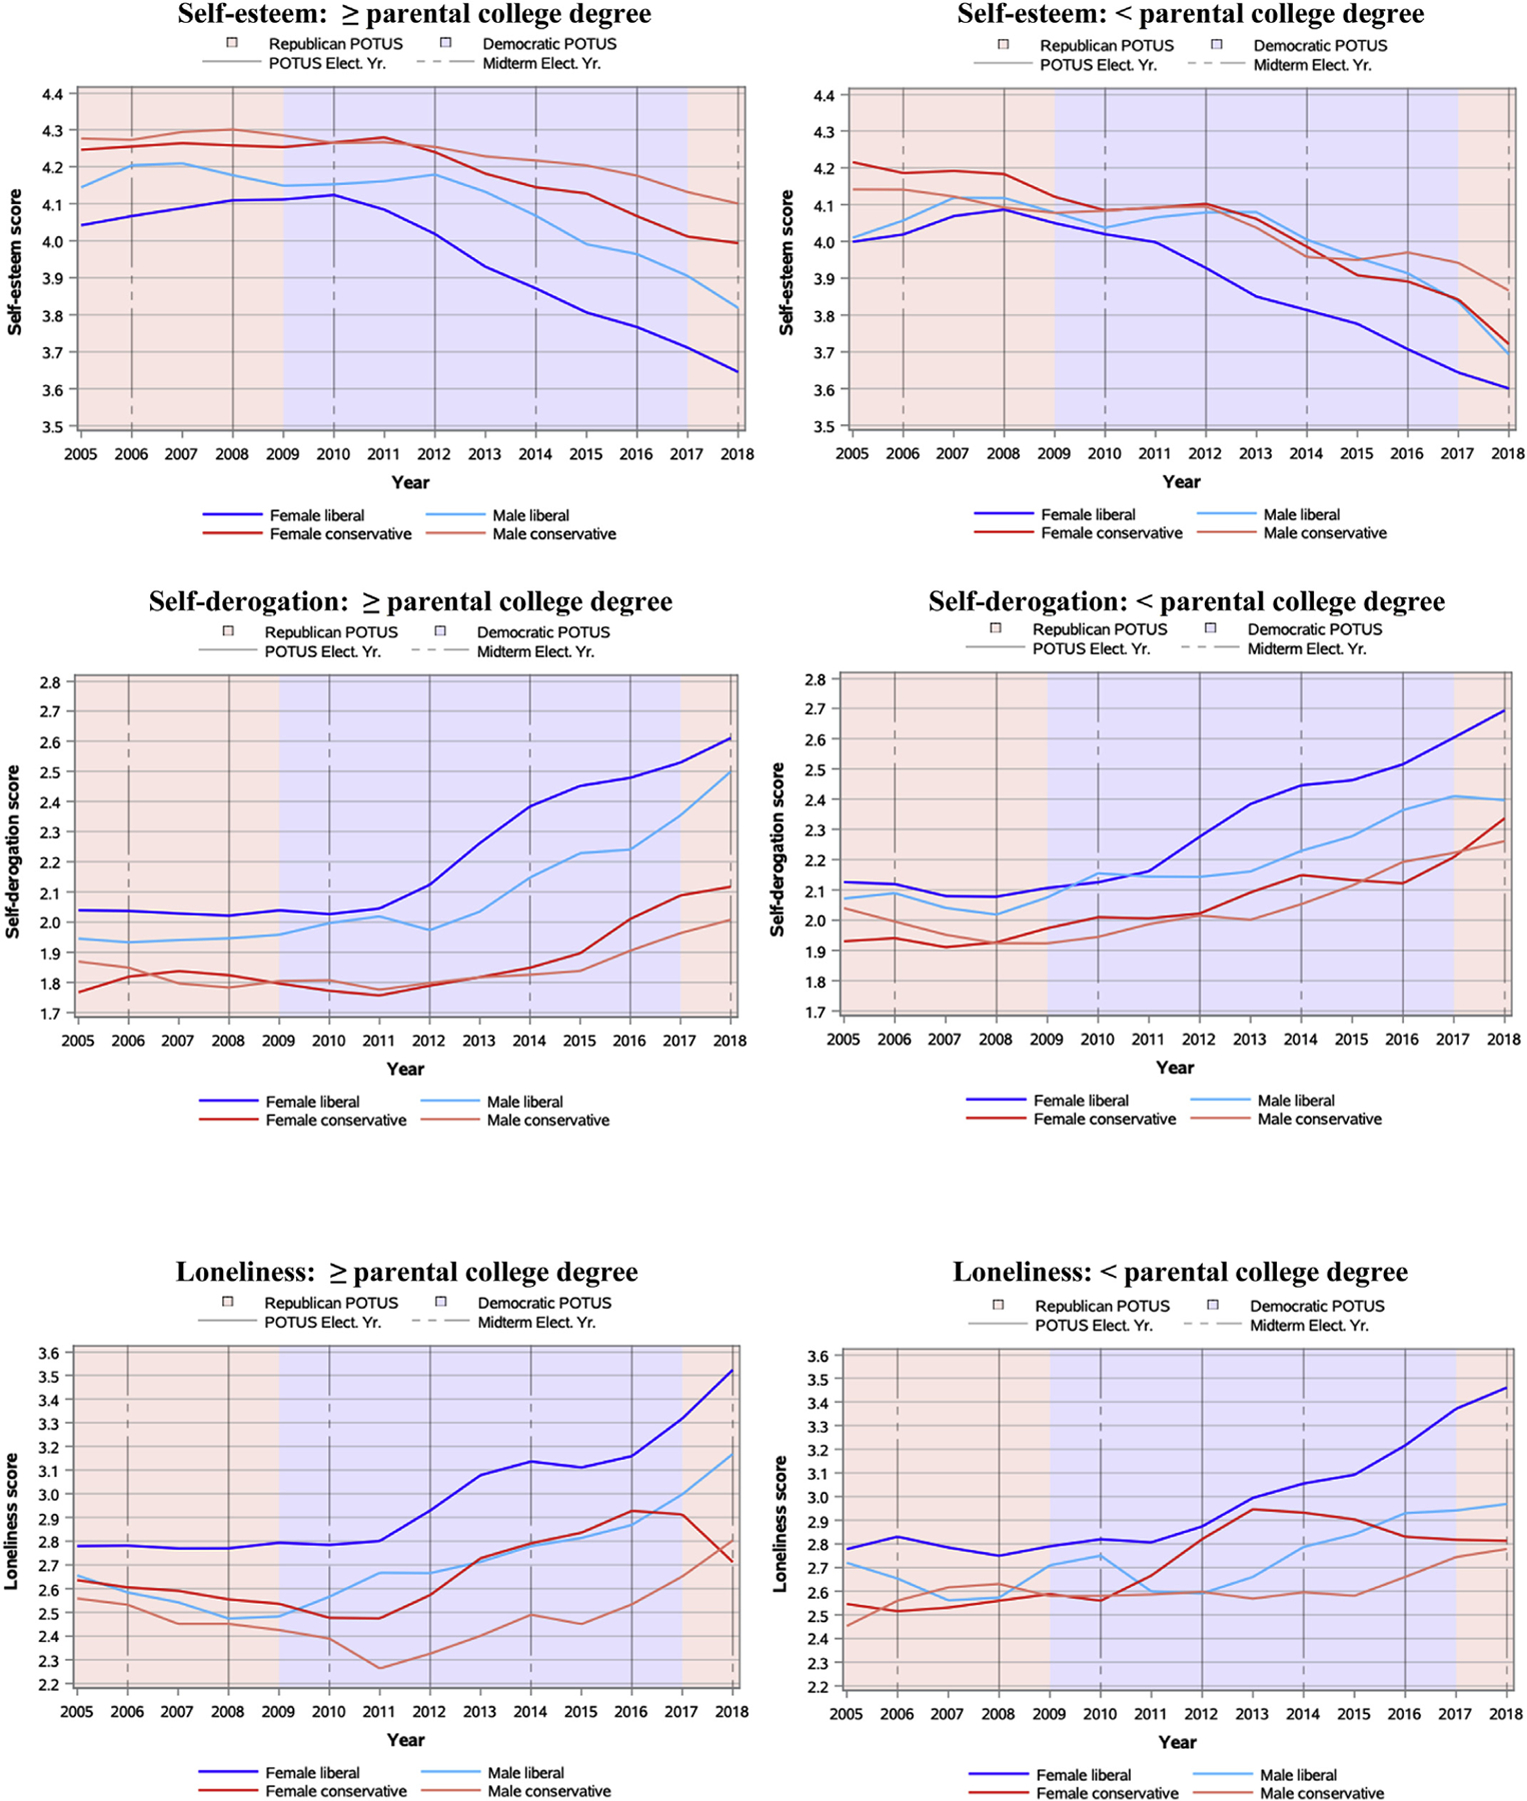
Mean main effects of political beliefs on self-esteem, self-derogation, and loneliness by sex and parental education: Liberal and conservative 12th-graders from 2005 to 2018.
Appendix Fig. A.3.2.
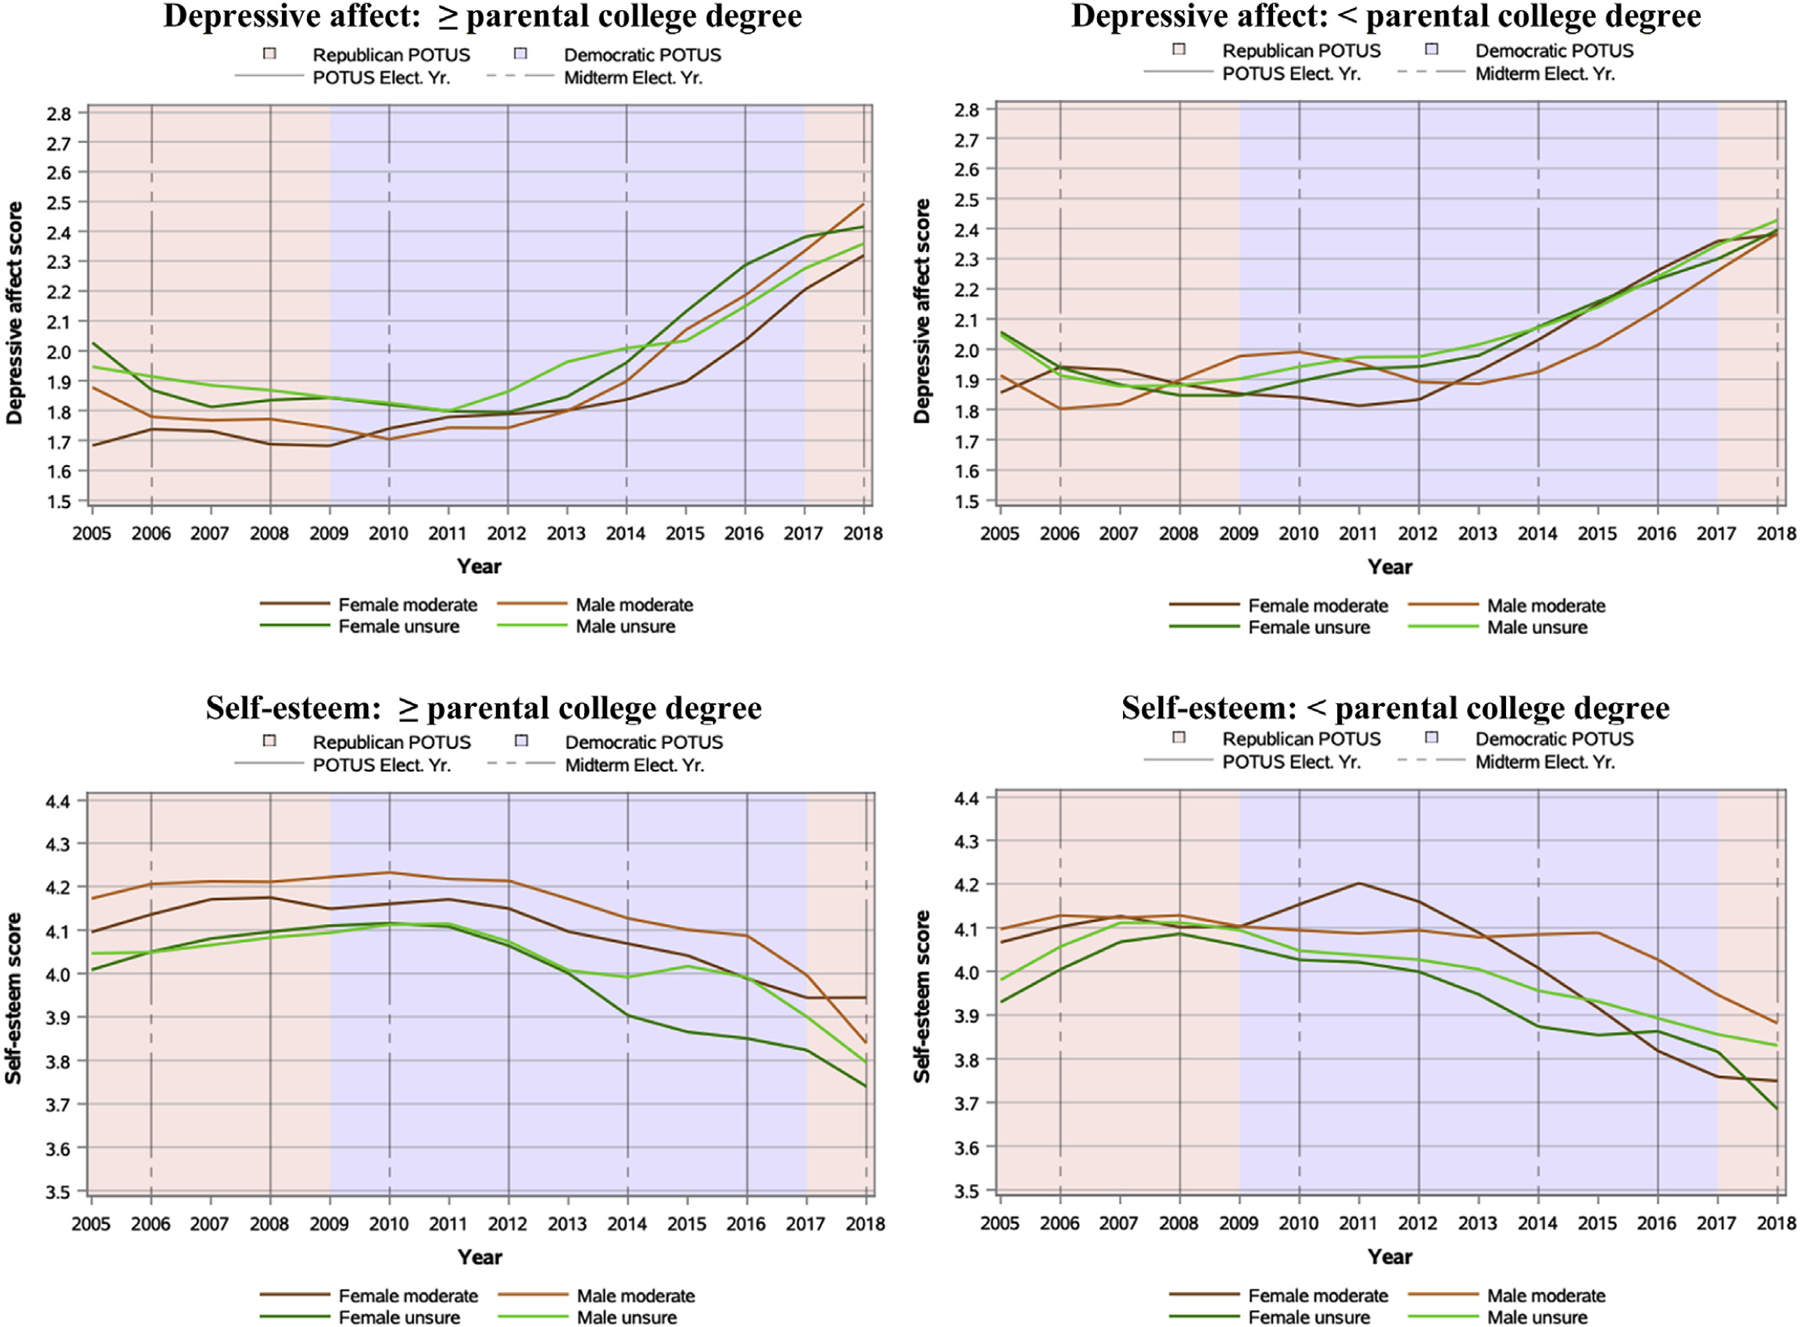
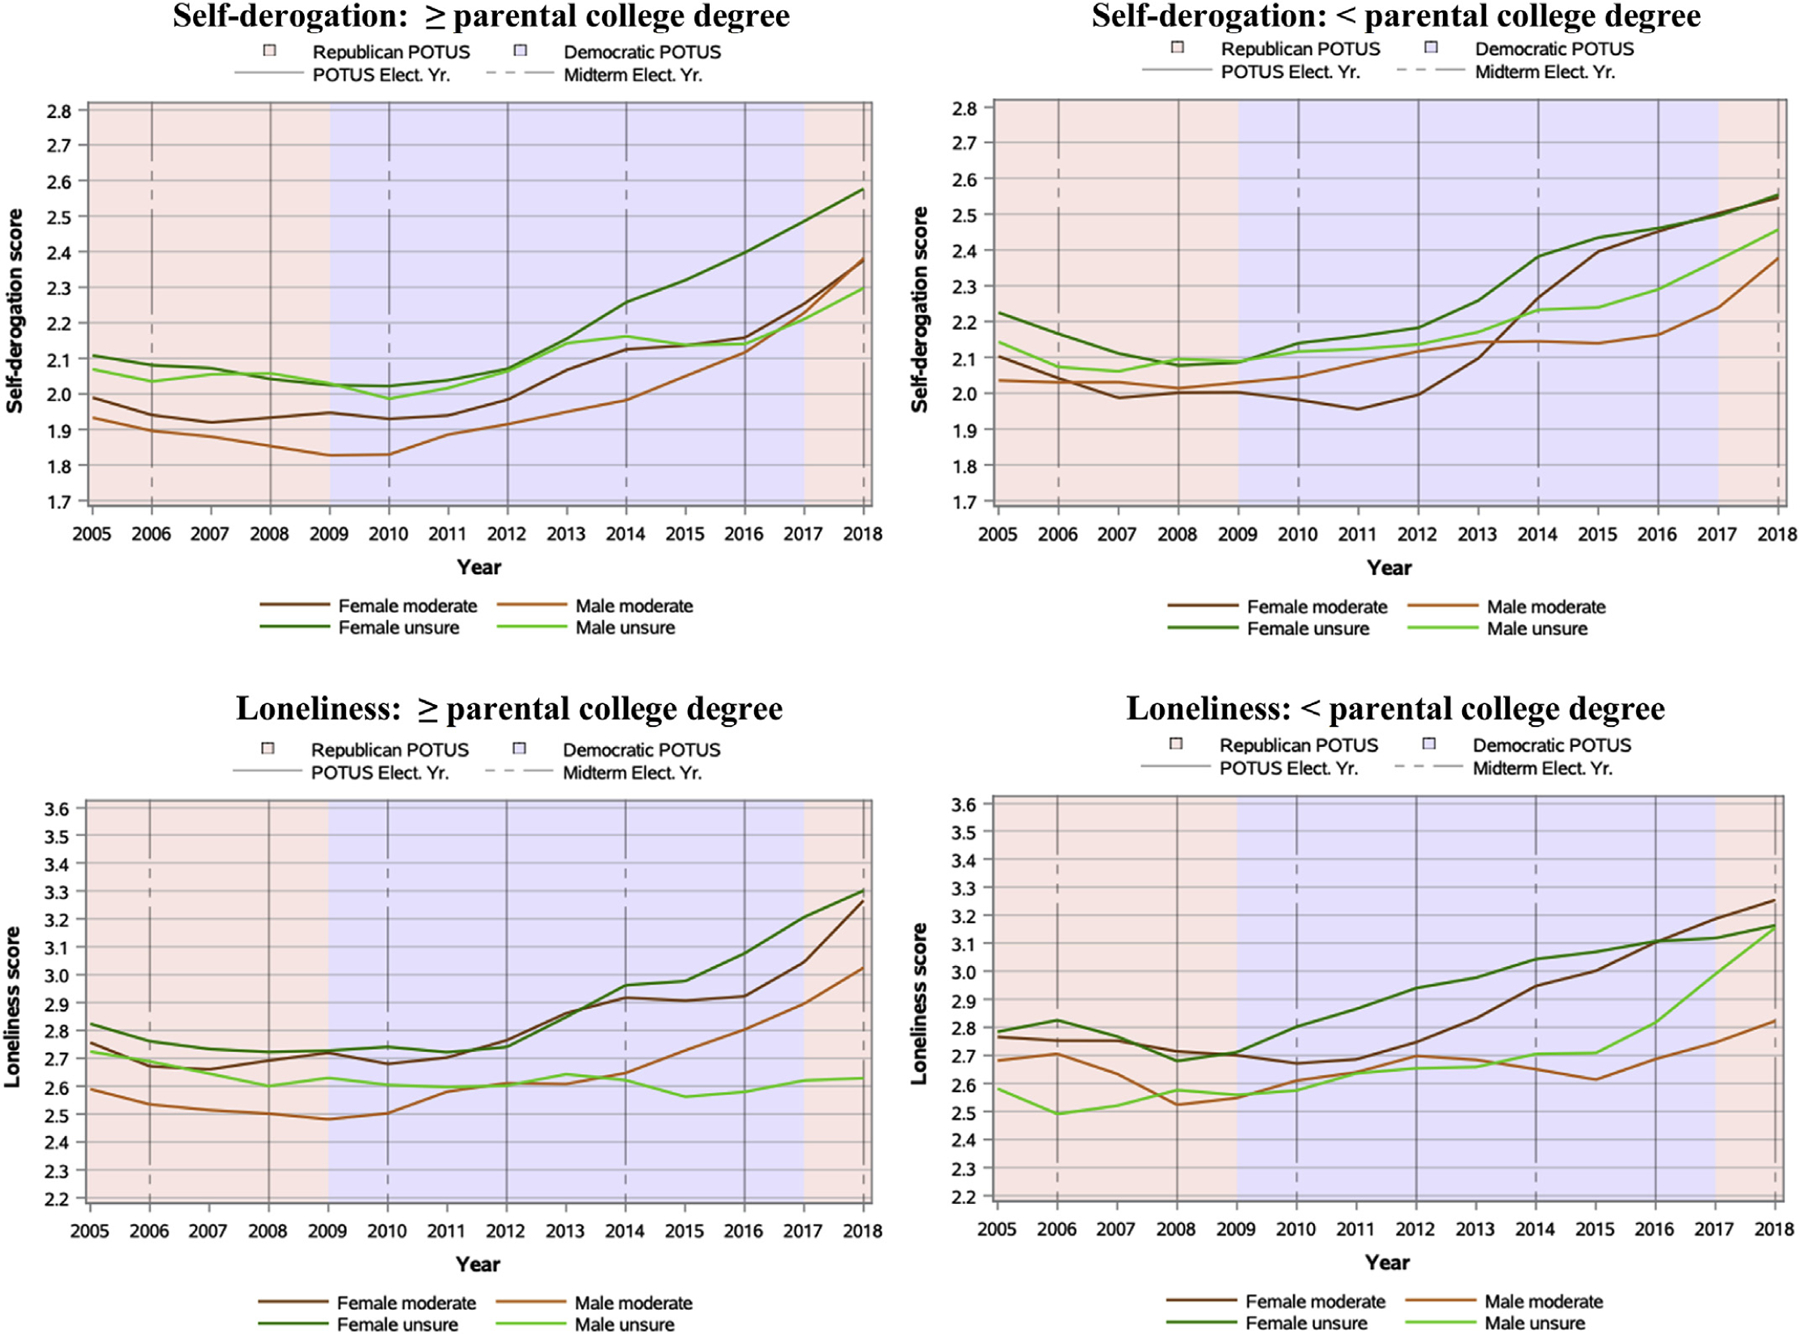
Mean main effects of political beliefs on internalizing symptoms by sex and parental education: Moderate and unsure 12th-graders from 2005 to 2018.
Appendix Fig. A.4.
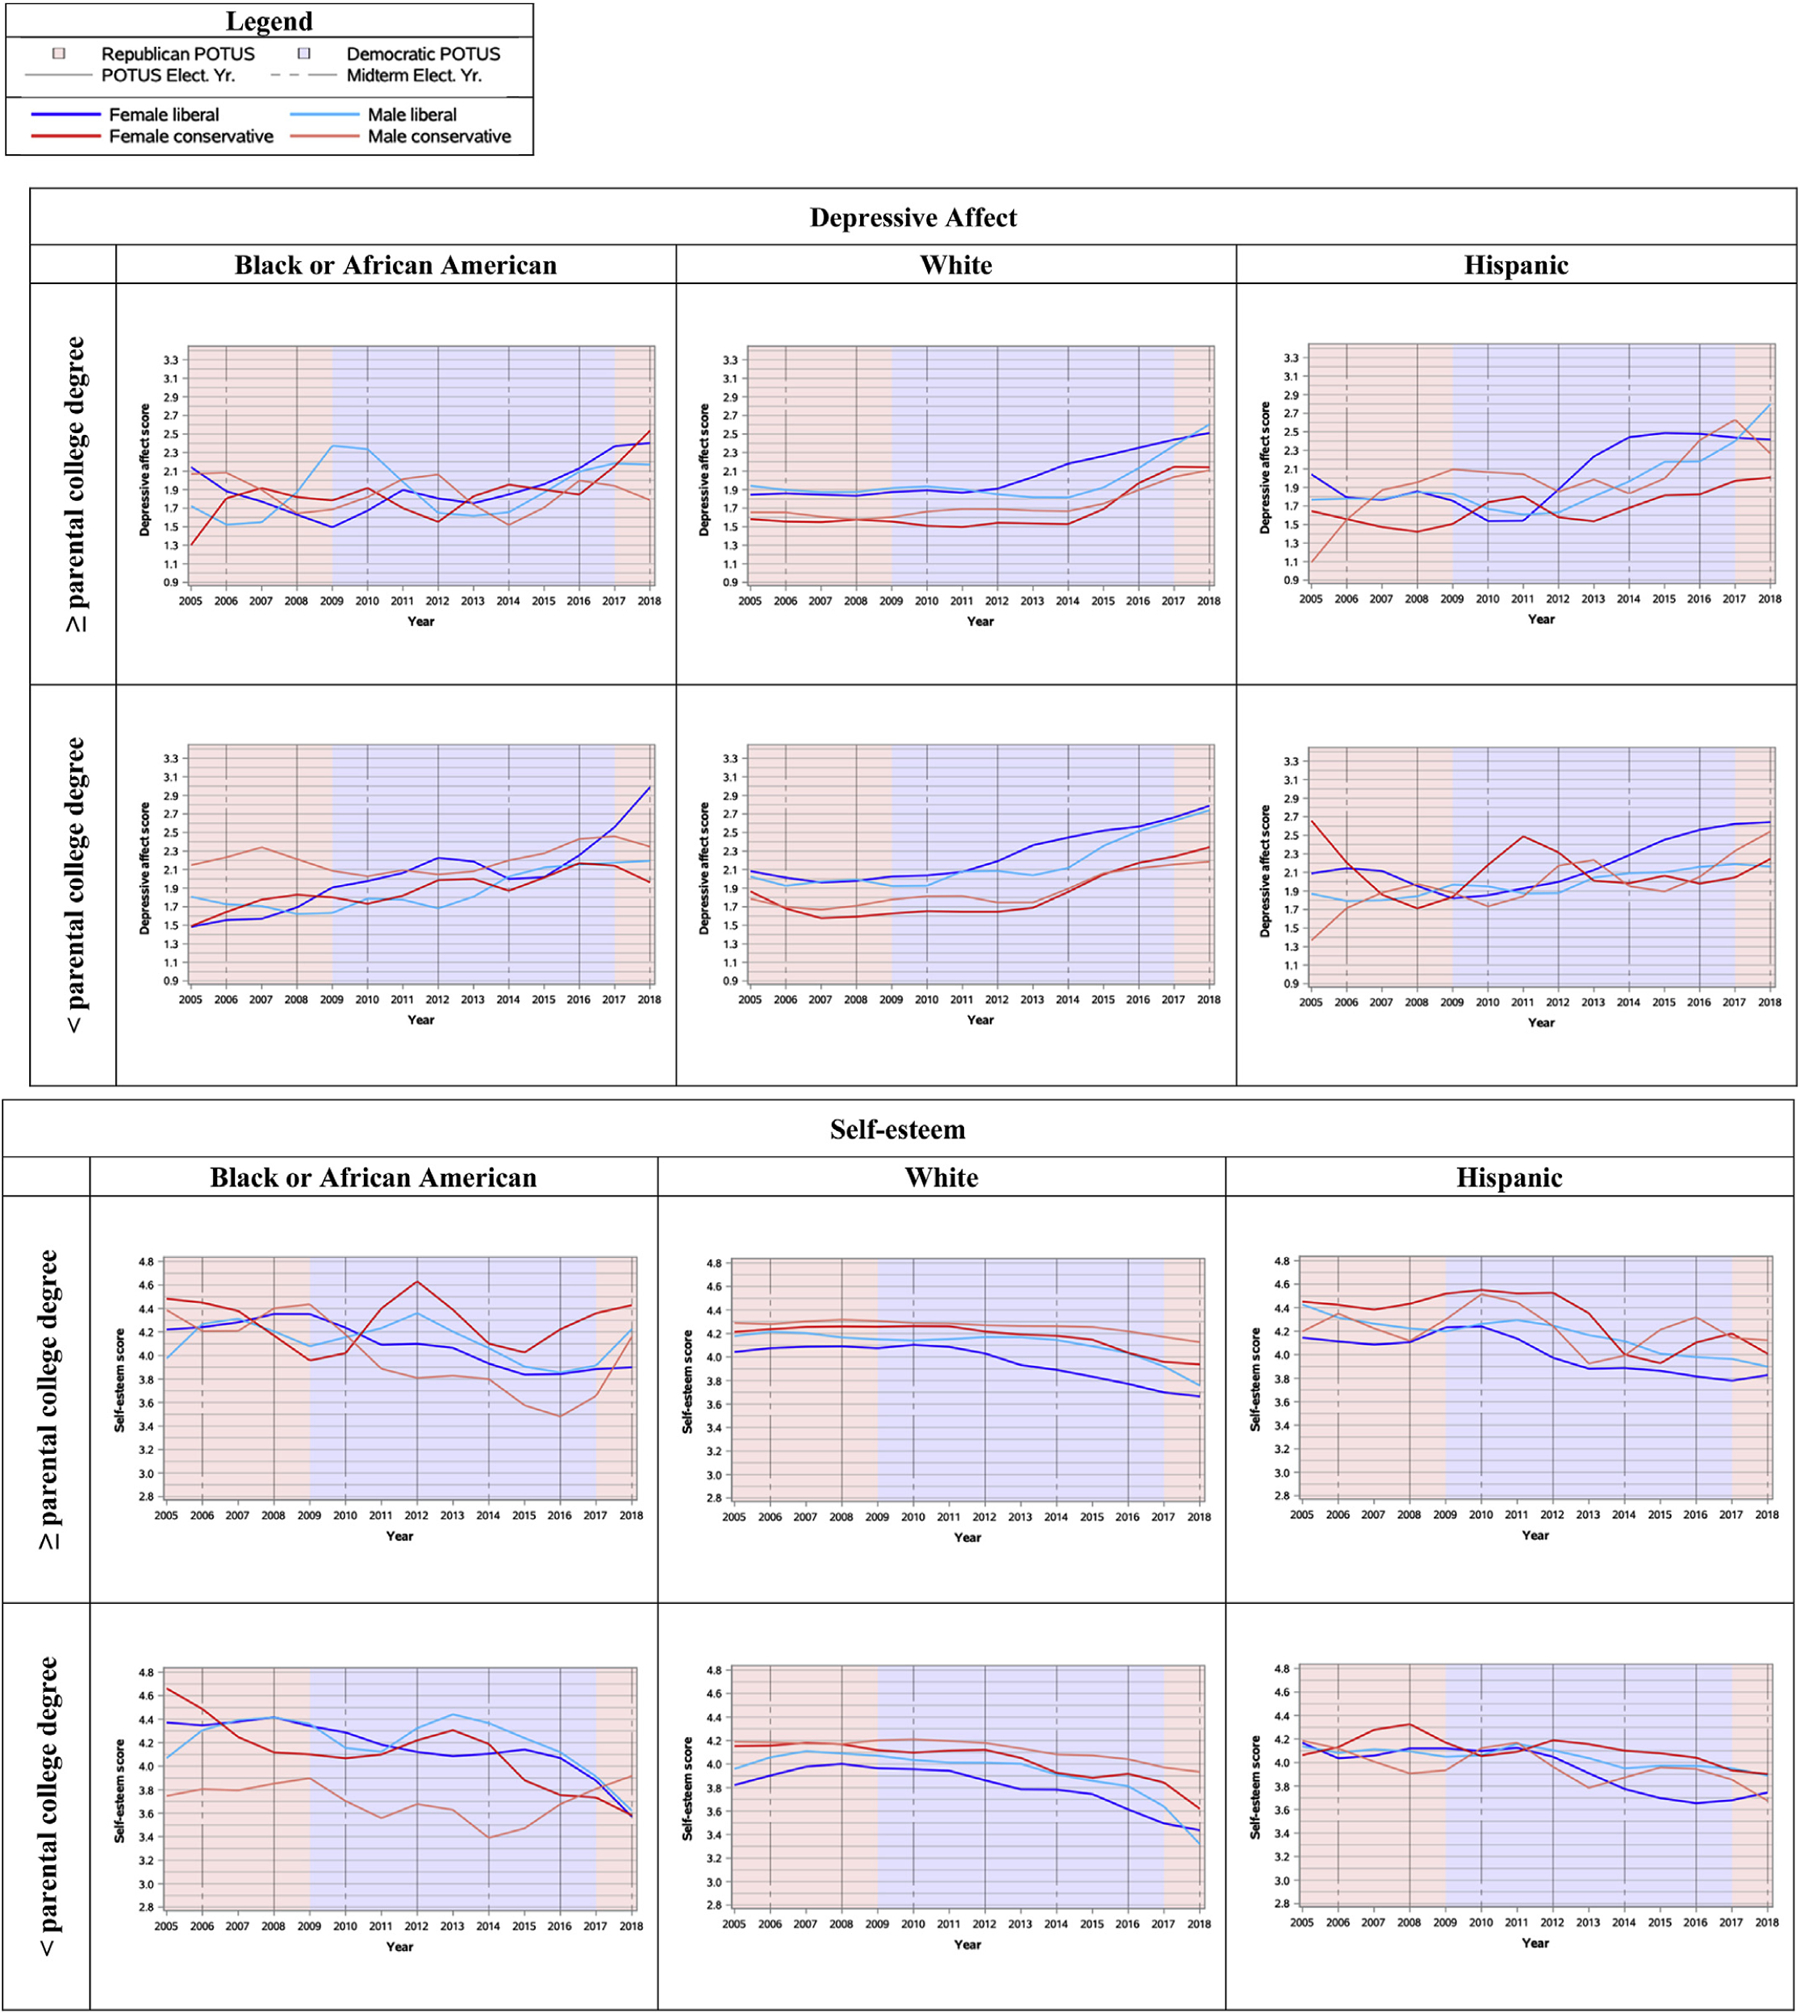
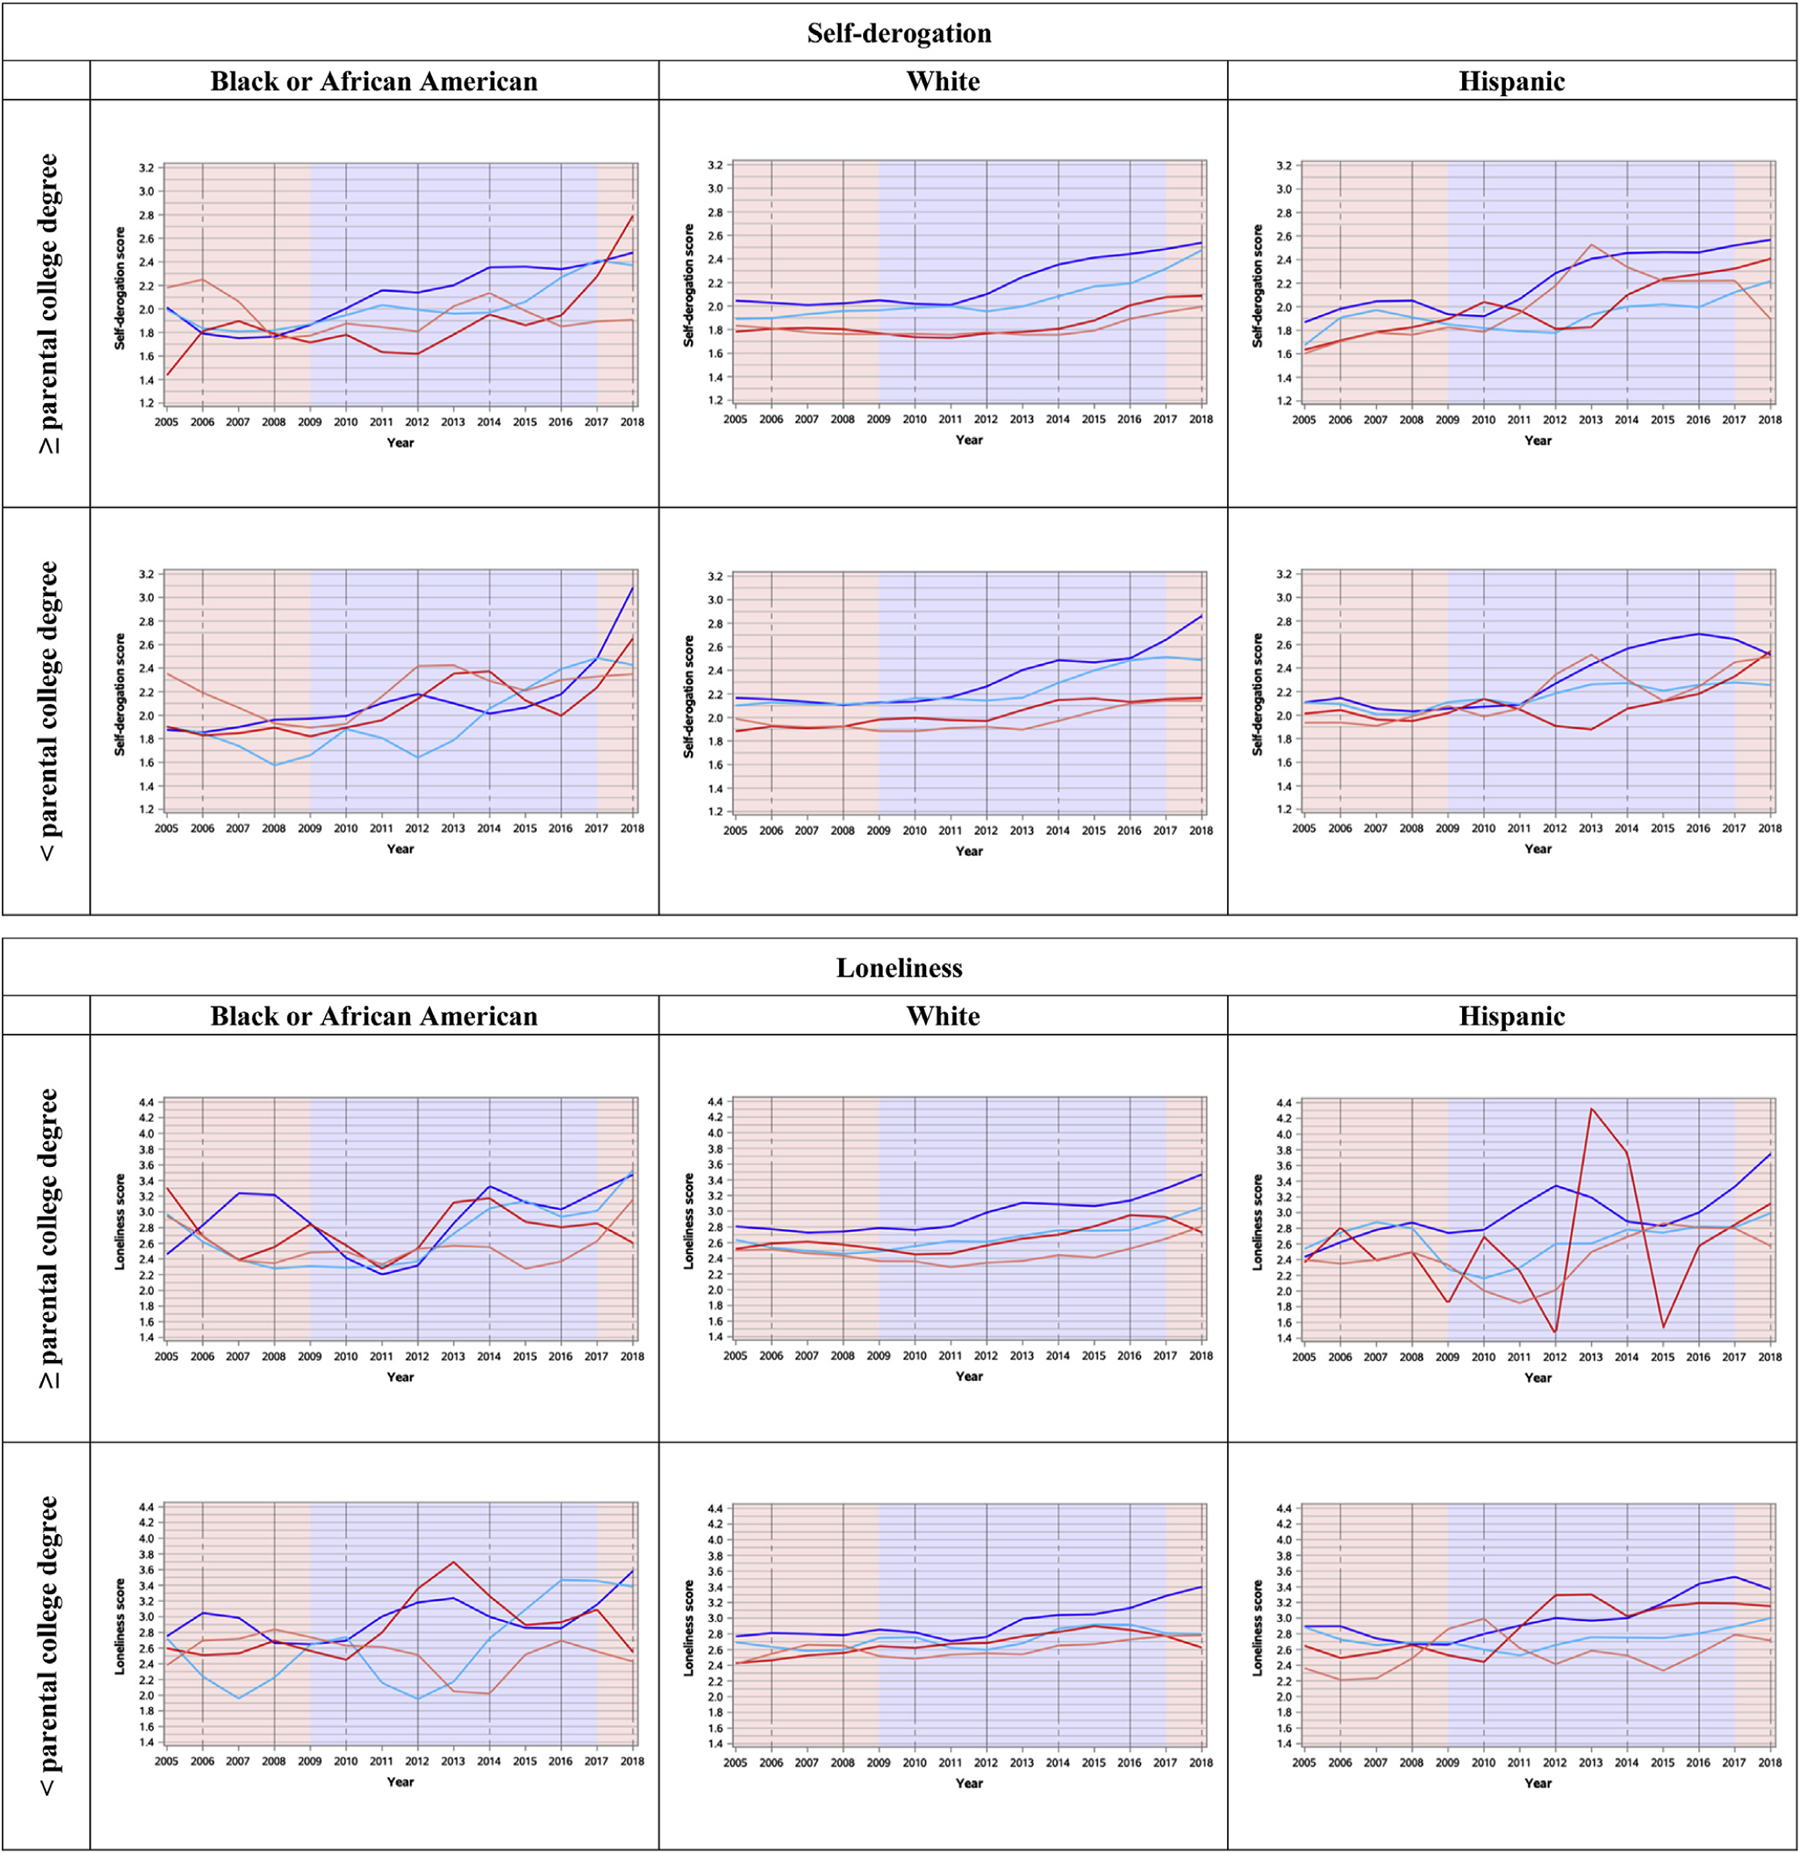
Mean main effects of political beliefs on depressive affect, self-esteem, self-derogation, and loneliness by sex, parental education, and race/ethnicity: Conservative and liberal 12th-graders from 2005 to 2018.
Appendix Fig. A.5.1.
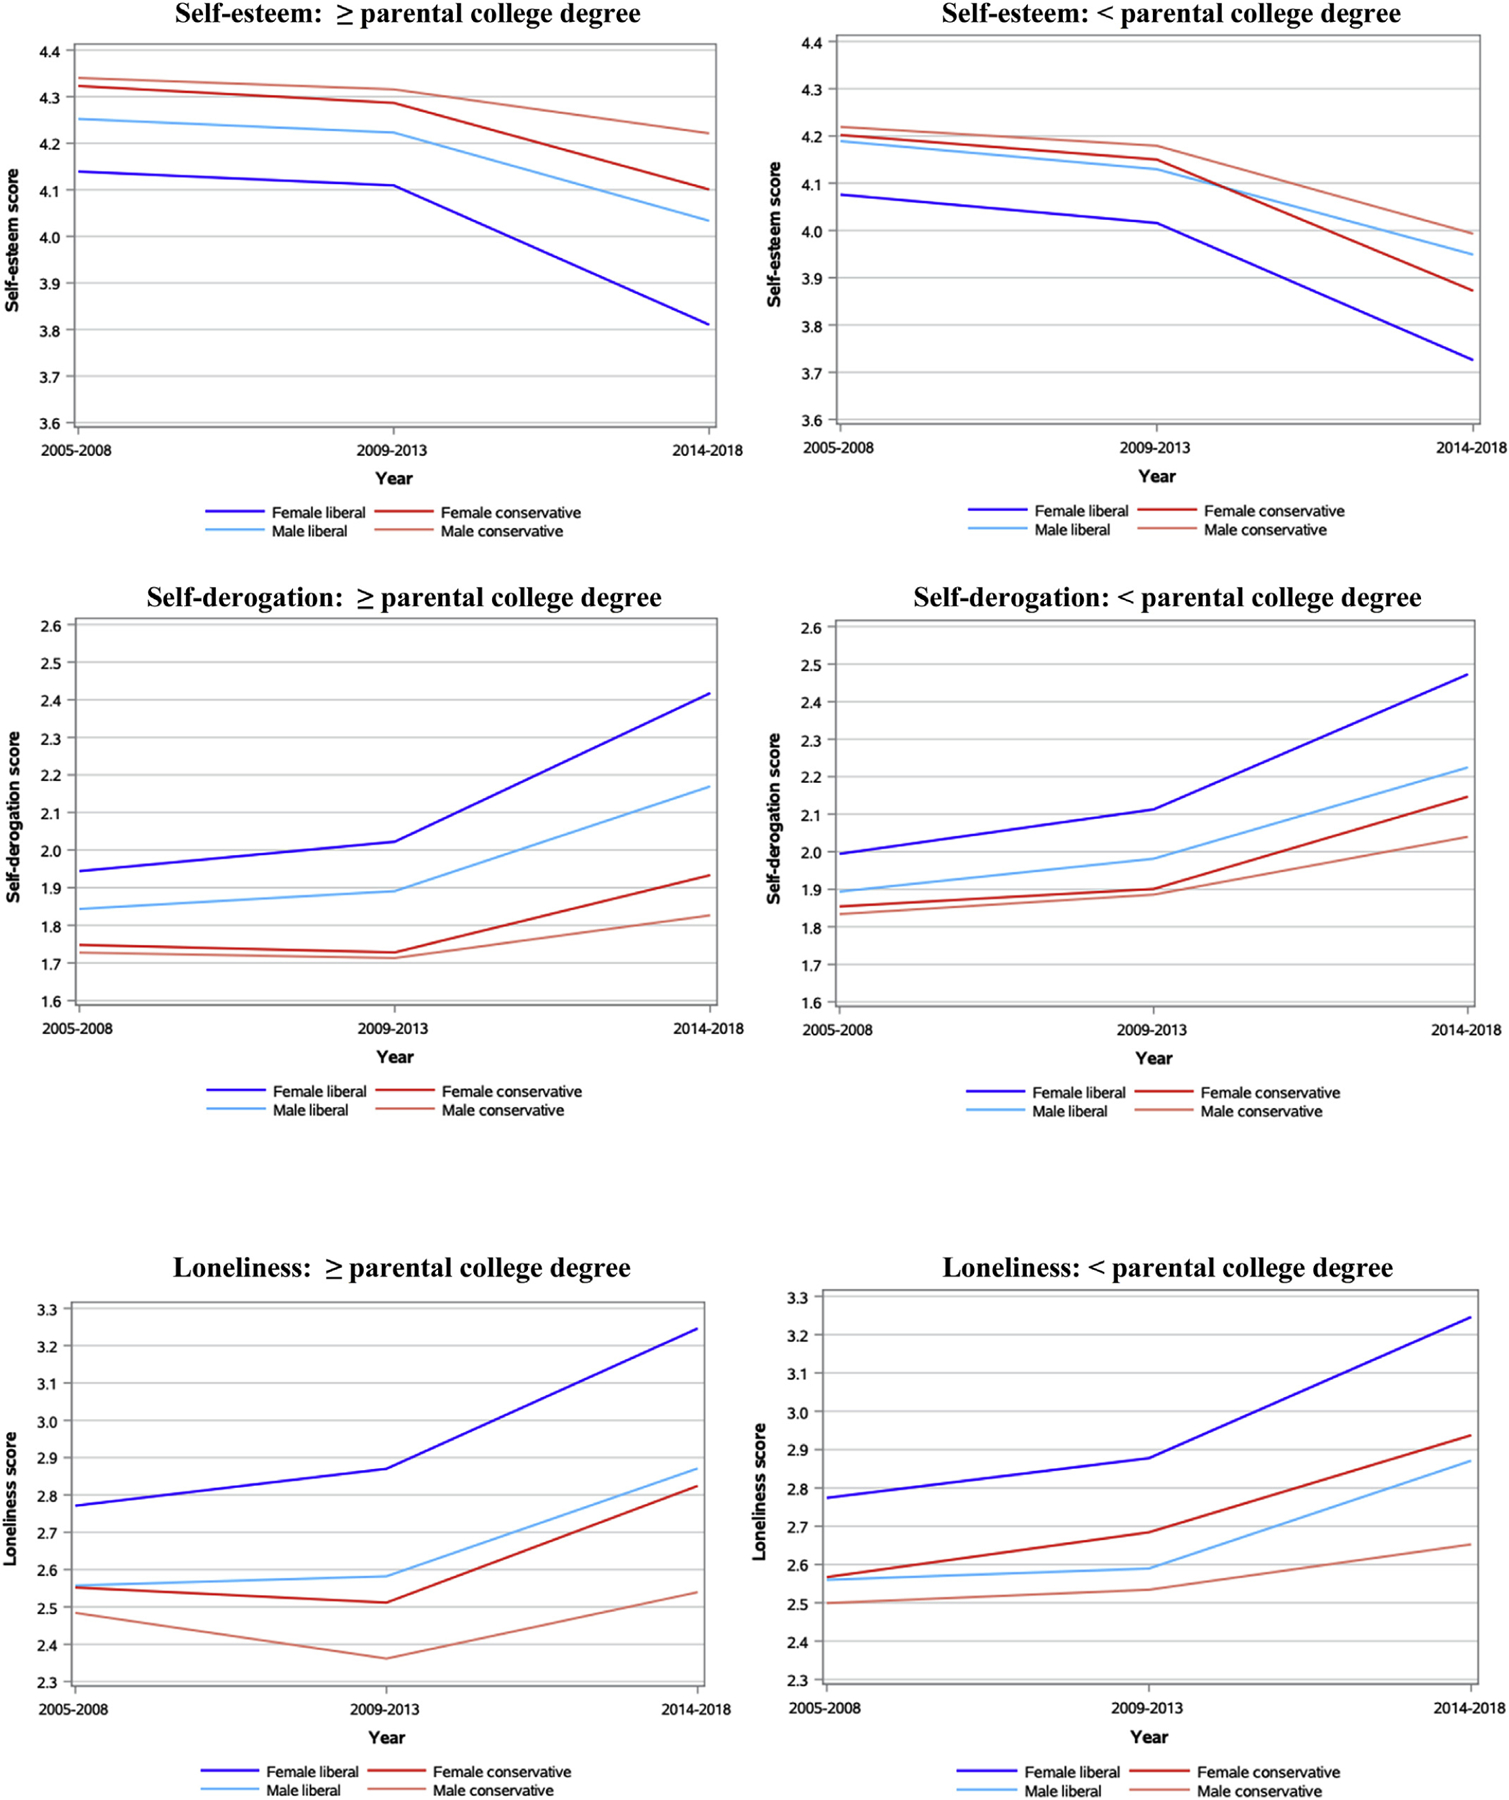
Linear regression predicted mean main effects of political beliefs on self-esteem, self-derogation, and loneliness by sex and parental education: Conservative and liberal 12th-graders from 2005 to 2018. Linear regression predictions graphed. All models were adjusted for geographic region, urbanicity, race/ethnicity, and GPA.
Appendix Fig. A.5.2.
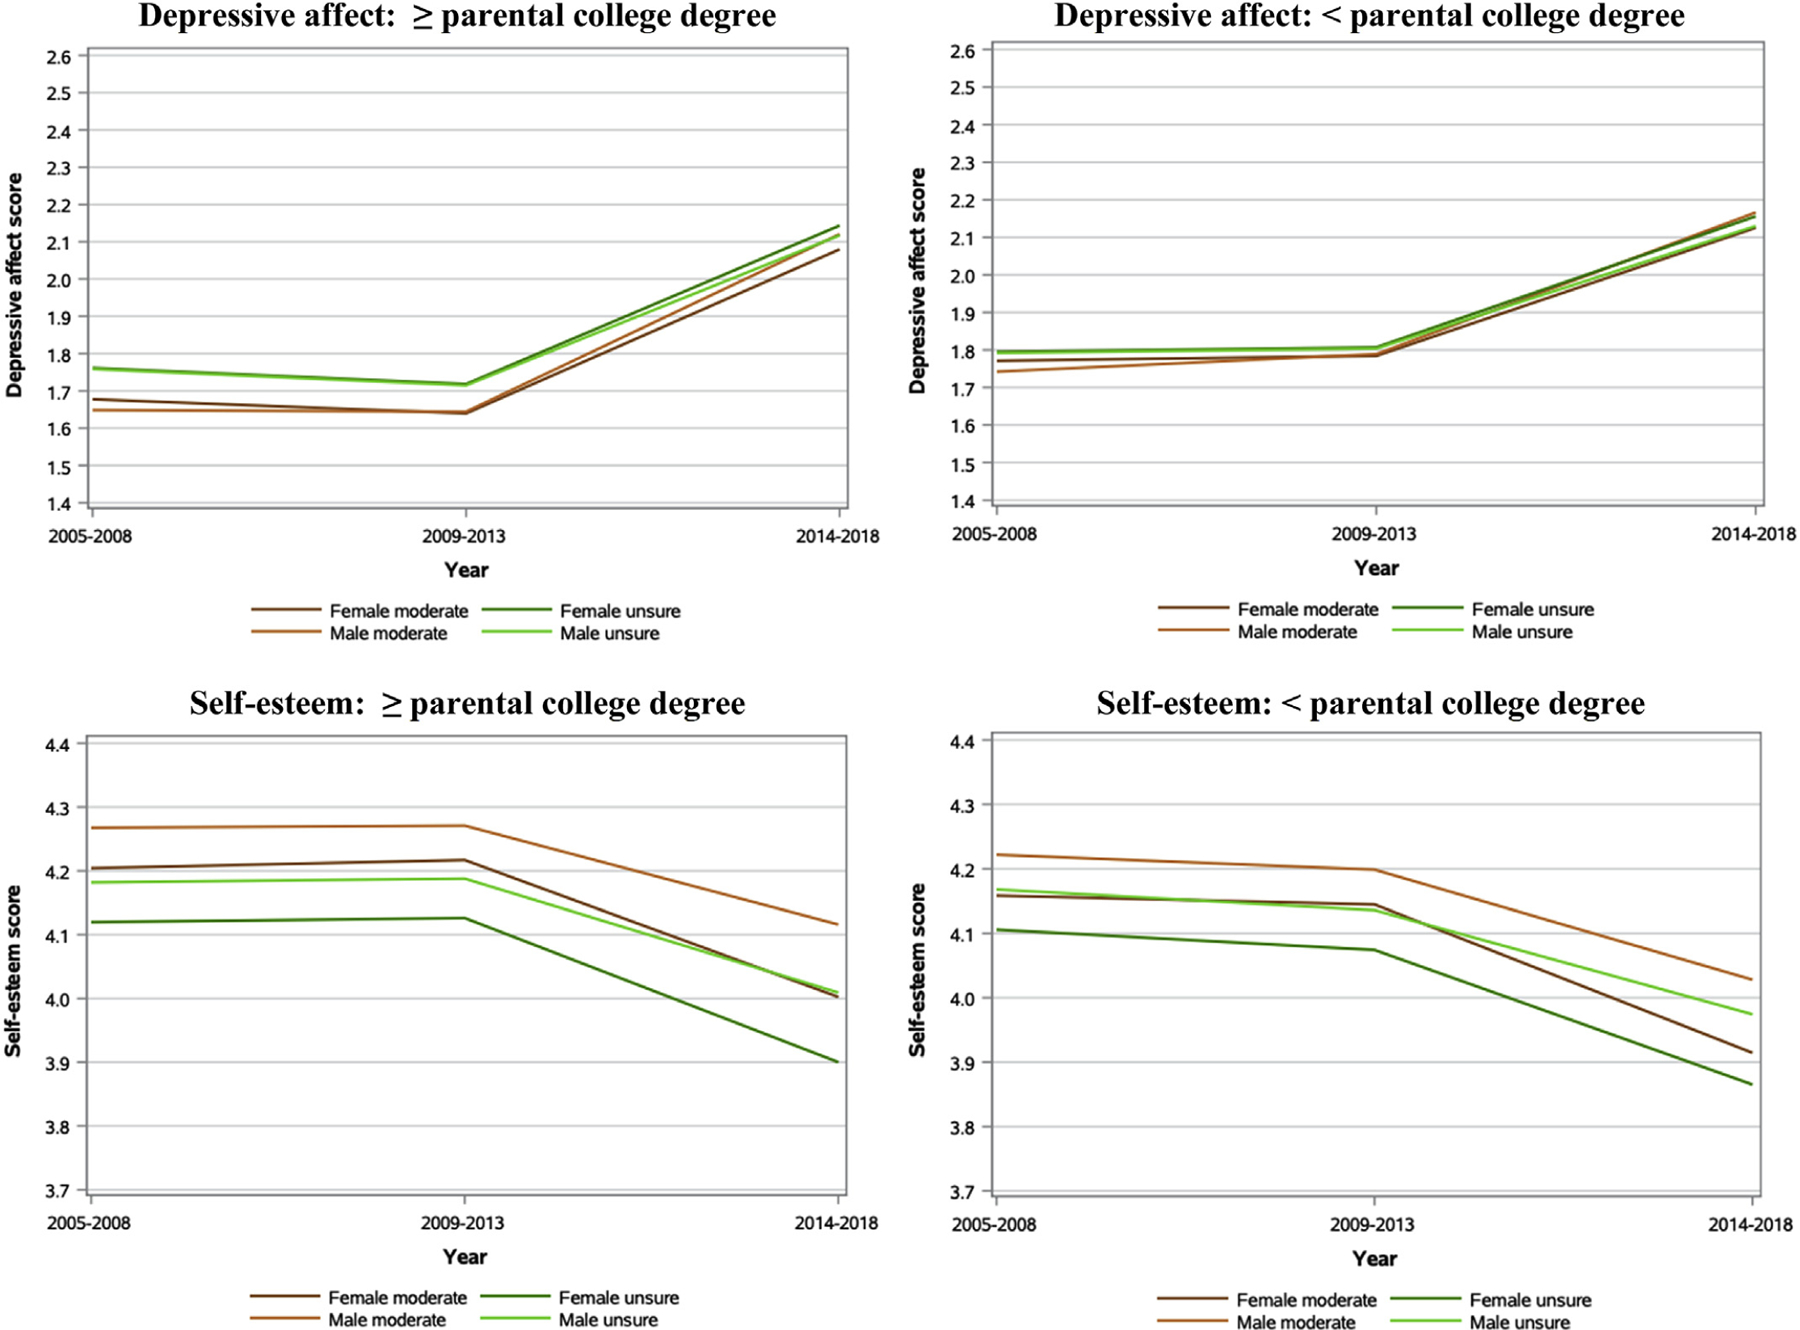
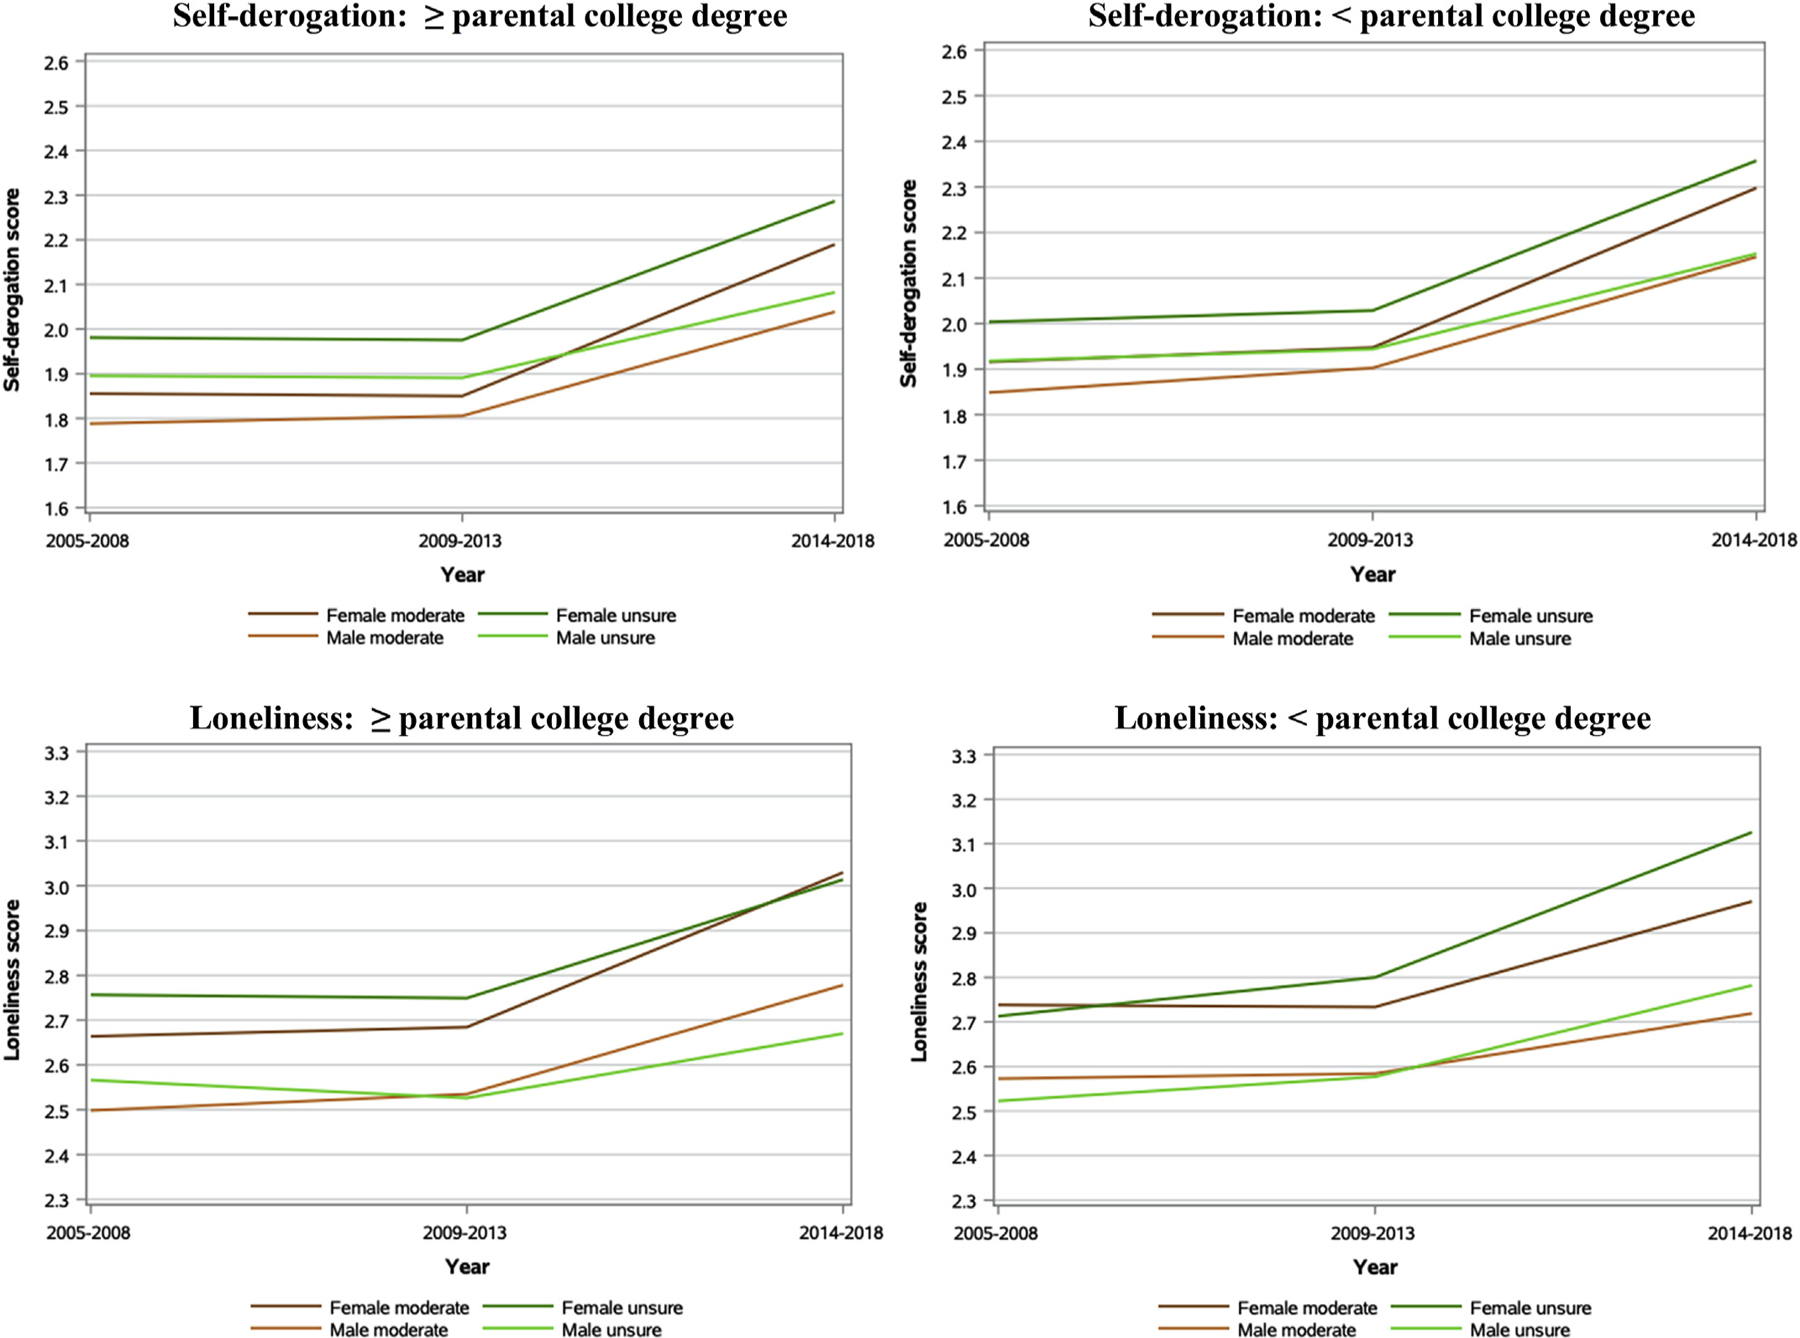
Linear regression predicted mean main effects of political beliefs on internalizing symptoms by sex and parental education: Moderate and unsure 12th-graders from 2005 to 2018. Linear regression predictions graphed. All models were adjusted for geographic region, urbanicity, race/ethnicity, and GPA.
Footnotes
Declaration of competing interest
On behalf of all authors, the corresponding author states that there is no conflict of interest.
References
- Abeshouse B (2019). Why Trump’s America is more divided than ever [Internet]. In Al jazeera [cited 11 Dec 2019]. Available: https://www.aljazeera.com/indepth/features/trump-america-divided-190805093010244.html. [Google Scholar]
- Achenbach TM, & McConaughy SH (1992). Taxonomy of internalizing disorders of childhood and adolescence. Internalizing Disord Child Adolesc, 19–60. [Google Scholar]
- Anderson M, & Jiang J (2018). Teens, social media & technology 2018. Pew Res Cent, 31, 2018. [Google Scholar]
- Augner C, & Hacker GW (2012). Associations between problematic mobile phone use and psychological parameters in young adults. International Journal of Public Health, 57, 437–441. [DOI] [PubMed] [Google Scholar]
- Bailen NH, Green LM, & Thompson RJ (2019). Understanding emotion in adolescents: A review of emotional frequency, intensity, instability, and clarity. Emot Rev, 11, 63–73. 10.1177/1754073918768878 [DOI] [Google Scholar]
- Bakker TP, & De Vreese CH (2011). Good news for the future? Young people, internet use, and political participation. Communication Research, 38, 451–470. [Google Scholar]
- Bauman S, Toomey RB, & Walker JL (2013). Associations among bullying, cyberbullying, and suicide in high school students. Journal of Adolescence, 36, 341–350. 10.1016/j.adolescence.2012.12.001 [DOI] [PubMed] [Google Scholar]
- Bornstein MH, & Bradley RH (2014). Socioeconomic Status, Parenting, and ChildDevelopment. Routledge. [Google Scholar]
- Brody DJ, Pratt LA, & Hughes JP (2018). Prevalence of Depression Among Adults Aged 20 and Over: United States, 2013–2016, 8. NCHS Data Brief. [PubMed] [Google Scholar]
- Brown CS, & Stone EA (2016). Chapter four - gender stereotypes and discrimination: How sexism impacts development. In Horn SS, Ruck MD, & Liben LS (Eds.), Advances in Child development and behavior (pp. 105–133). JAI. 10.1016/bs.acdb.2015.11.001. [DOI] [PubMed] [Google Scholar]
- Burstein B, Agostino H, & Greenfield B (2019). Suicidal attempts and ideation among children and adolescents in US emergency departments, 2007–2015. JAMA Pediatr, 173, 598–600. [DOI] [PMC free article] [PubMed] [Google Scholar]
- Centers for Disease Prevention and Control. (2015). Trends in the prevalence of suicide-related behaviors. National YRBS, 8, 2016, 1991–2015. [Google Scholar]
- Curtin SC, Warner M, & Hedegaard H (2016). Increase in suicide in the United States, 1999–2014. US Department of Health and Human Services, Centers for Disease Control and Prevention. Report No.: 241.
- Dahlgren PM, Shehata A, & Strömbäck J (2019). Reinforcing spirals at work? Mutual influences between selective news exposure and ideological leaning. European Journal of Communication, 34, 159–174. [Google Scholar]
- Devenish B, Hooley M, & Mellor D (2017). The pathways between socioeconomic status and adolescent outcomes: A systematic review. American Journal of Community Psychology, 59, 219–238. 10.1002/ajcp.12115 [DOI] [PubMed] [Google Scholar]
- Dinas E (2014). Why does the apple fall far from the tree? How early political socialization prompts parent-child dissimilarity. British Journal of Political Science, 44, 827–852. [Google Scholar]
- Farthing R (2010). The politics of youthful antipolitics: Representing the ‘issue’ of youth participation in politics. Journal of Youth Studies, 13, 181–195. 10.1080/13676260903233696 [DOI] [Google Scholar]
- Fisher DR, & Nasrin S (2021). Shifting coalitions within the youth climate movement in the US. Politics and Governance, 9, 112–123. 10.17645/pag.v9i2.3801 [DOI] [Google Scholar]
- Flanagan C (2009). Young people’s civic engagement and political development. Handbook of Youth and Young Adulthood. Routledge. [Google Scholar]
- Franklin M, Yin X, McConnell R, & Fruin S (2020). Association of the built environment with childhood psychosocial stress. JAMA Netw Open, 3, Article e2017634. 10.1001/jamanetworkopen.2020.17634 [DOI] [PMC free article] [PubMed] [Google Scholar]
- Fruehwirth JC, Iyer S, & Zhang A (2019). Religion and depression in adolescence. Journal of Political Economy, 127, 1178–1209. 10.1086/701425 [DOI] [PMC free article] [PubMed] [Google Scholar]
- Haenschen K, & Tedesco JC (2020). Framing the youth-led movement for gun violence prevention: How news coverage impacts efficacy in generation Z, millennials, and gen X. Int J Press, 25, 653–675. 10.1177/1940161220929976 [DOI] [Google Scholar]
- Ivey-Stephenson AZ, Demissie Z, Crosby A, Stone D, Gaylor E, Wilkins N, et al. (2020). Suicidal ideation and behaviors among high school students — youth risk behavior survey, United States, 2019. MMWR Suppl, 69. 10.15585/mmwr.su6901a6 [DOI] [PMC free article] [PubMed] [Google Scholar]
- Jackson S (2018). Young feminists, feminism and digital media. Feminism & Psychology,28, 32–49. 10.1177/0959353517716952 [DOI] [Google Scholar]
- Jennings MK, Stoker L, & Bowers J (2009). Politics across generations: Family transmission reexamined. The Journal of Politics, 71, 782–799. [Google Scholar]
- Jost JT, Banaji MR, & Nosek BA (2004). A decade of system justification theory: Accumulated evidence of conscious and unconscious bolstering of the status quo. Political Psychology, 25, 881–919. [Google Scholar]
- Jost J, & Hunyady O (2003). The psychology of system justification and the palliative function of ideology. European Review of Social Psychology, 13, 111–153. 10.1080/10463280240000046 [DOI] [Google Scholar]
- Jost JT, & Hunyady O (2005). Antecedents and consequences of system-justifying ideologies. Current Directions in Psychological Science, 14, 260–265. [Google Scholar]
- Jost JT, Nosek BA, & Gosling SD (2008). Ideology: Its resurgence in social, personality, and political psychology. Perspectives on Psychological Science, 3, 126–136. [DOI] [PubMed] [Google Scholar]
- Jost JT, Pelham BW, Sheldon O, & Sullivan BN (2003). Social inequality and the reduction of ideological dissonance on behalf of the system: Evidence of enhanced system justification among the disadvantaged. European Journal of Social Psychology, 33, 13–36. 10.1002/ejsp.127 [DOI] [Google Scholar]
- Kalb LG, Stapp EK, Ballard ED, Holingue C, Keefer A, & Riley A (2019). Trends in psychiatric emergency department visits among youth and young adults in the US. Pediatrics, 143, Article e20182192. [DOI] [PMC free article] [PubMed] [Google Scholar]
- Kessel Schneider S, O’Donnell L, & Smith E (2015). Trends in cyberbullying and school bullying victimization in a regional census of high school students, 2006–2012. Journal of School Health, 85, 611–620. 10.1111/josh.12290 [DOI] [PubMed] [Google Scholar]
- Keyes KM, Gary D, O’Malley PM, Hamilton A, & Schulenberg J (2019). Recent increases in depressive symptoms among US adolescents: Trends from 1991 to 2018. Social Psychiatry and Psychiatric Epidemiology, 54, 987–996. 10.1007/s00127-019-01697-8 [DOI] [PMC free article] [PubMed] [Google Scholar]
- Kim Y (2017). Knowledge versus beliefs: How knowledge and beliefs mediate the influence of likeminded media use on political polarization and participation. Journal of Broadcasting & Electronic Media, 61, 658–681. 10.1080/08838151.2017.1375497 [DOI] [Google Scholar]
- Kochhar R, & Cilluffo A (12 July 2018). Key findings on the rise in income inequality within America’s racial and ethnic groups. In Pew Research Center [cited 18 Sep 2020]. Available: https://www.pewresearch.org/fact-tank/2018/07/12/key-findings-on-the-rise-in-income-inequality-within-americas-racial-and-ethnic-groups/.
- Kochhar R, & Fry R. Wealth inequality has widened along racial, ethnic lines since end of Great Recession. Pew Research Center [Internet]. 12 December 2014. [cited 18 Sep 2020]. Available: https://www.pewresearch.org/fact-tank/2014/12/12/racial-wealth-gaps-great-recession/.
- Kreski N, Platt J, Rutherford C, Olfson M, Odgers C, Schulenberg J, et al. (2020). Social media use and depressive symptoms among United States adolescents. J Adolesc Health Off Publ Soc Adolesc Med. 10.1016/j.jadohealth.2020.07.006 [DOI] [PMC free article] [PubMed] [Google Scholar]
- Levesque RJR (2011). Externalizing and internalizing symptoms. In Levesque RJR (Ed.), Encyclopedia of Adolescence (pp. 903–905). New York, NY: Springer. 10.1007/978-1-4419-1695-2_539. [DOI] [Google Scholar]
- Lewis R, Rowe M, & Wiper C (2017). Online Abuse of feminists as an emerging form of violence against women and girls. British Journal of Criminology, 57, 1462–1481. 10.1093/bjc/azw073 [DOI] [Google Scholar]
- Lyons J (2017). The family and partisan socialization in red and blue America. Political Psychology, 38, 297–312. 10.1111/pops.12336 [DOI] [Google Scholar]
- Maciejewski DF, van Lier PAC, Branje SJT, Meeus WHJ, & Koot HM (2015). A 5-year longitudinal study on mood variability across adolescence using daily diaries. Child Development, 86, 1908–1921. 10.1111/cdev.12420 [DOI] [PubMed] [Google Scholar]
- Mathur MB, Ding P, Riddell CA, & VanderWeele TJ (2018). Website and RPackage for computing E-values. Epidemiol Camb Mass, 29, e45–e47. 10.1097/EDE.0000000000000864 [DOI] [PMC free article] [PubMed] [Google Scholar]
- Miech R, Johnston L, O’Malley P, Bachman J, Schulenberg J, & Patrick M (2019). Monitoring the future national survey results on drug use, 1975–2018: volume I, secondary school students. [Google Scholar]
- Miron O, Yu K-H, Wilf-Miron R, & Kohane IS (2019). Suicide rates among adolescents and young adults in the United States, 2000–2017. Journal of the American Medical Association, 321, 2362–2364. [DOI] [PMC free article] [PubMed] [Google Scholar]
- Mitchell A, Gottfried J, Kiley J, & Matsa KE (2014). Political polarization & media habits. Pew Res Cent. [Google Scholar]
- Moeller J, Shehata A, & Kruikemeier S (2018). Internet use and political interest: Growth curves, reinforcing spirals, and causal effects during adolescence. Journal of Communications, 68, 1052–1078. 10.1093/joc/jqy062 [DOI] [Google Scholar]
- Mojtabai R, Olfson M, & Han B (2016). National trends in the prevalence and treatment of depression in adolescents and young adults. Pediatrics, 138, Article e20161878. [DOI] [PMC free article] [PubMed] [Google Scholar]
- Monitoring the Future (MTF) public-use cross-sectional datasets. (2021). NAHDAP. Available: https://www.icpsr.umich.edu/web/NAHDAP/series/35.
- Morrison-Beedy D, & Grove L (2018). Adolescent girls’ experiences with sexual pressure, coercion, and victimization: #MeToo. Worldviews on Evidence-Based Nursing, 15, 225–229. 10.1111/wvn.12293 [DOI] [PubMed] [Google Scholar]
- Mukunda G (25 September 2018). The social and political costs of the financial crisis, 10 Years later. Harvard Business Review. Available: https://hbr.org/2018/09/the-social-and-political-costs-of-the-financial-crisis-10-years-later. (Accessed 18 September 2020). [Google Scholar]
- Napier JL, & Jost JT (2008). Why are conservatives happier than liberals? Psychological Science, 19, 565–572. [DOI] [PubMed] [Google Scholar]
- National Institute on Drug Abuse. (2020). Monitoring the future [cited 11 Dec 2019]. Available: https://www.drugabuse.gov/related-topics/trends-statistics/monitoring-future.
- Obasogie OK (5 June 2020). Police killing black people is a pandemic, too. Washington Post. Available https://www.washingtonpost.com/outlook/police-violence-pandemic/2020/06/05/e1a2a1b0-a669-11ea-b619-3f9133bbb482_story.html. (Accessed 18 September 2020).
- O’brien K, Selboe E, & Hayward BM (2018). Exploring youth activism on climate change. Ecology and Society, 23. [Google Scholar]
- Odgers C (2018). Smartphones are bad for some teens, not all. Nature, 554, 432–434. 10.1038/d41586-018-02109-8 [DOI] [PubMed] [Google Scholar]
- Ojeda C, & Hatemi PK (2015). Accounting for the child in the transmission of party identification. American Sociological Review, 80, 1150–1174. [Google Scholar]
- Orben A, & Przybylski AK (2019). The association between adolescent well-being and digital technology use. Nat Hum Behav, 3, 173. [DOI] [PubMed] [Google Scholar]
- Ozmen CB, Brelsford GM, & Danieu CR (2018). Political affiliation, spirituality, and religiosity: Links to emerging adults’ life satisfaction and optimism. Journal of Religion and Health, 57, 622–635. [DOI] [PubMed] [Google Scholar]
- Parlapiano A (16 April 2015). How Presidential Campaigns Became Two-Year Marathons. The New York Times. Available: https://www.nytimes.com/2015/04/17/upshot/how-presidential-campaigns-became-two-year-marathons.html. (Accessed 18 September 2020).
- Pew Research Center. (20 2018). Trends in party affiliation among demographic groups [cited 23 Oct 2020]. Available: https://www.pewresearch.org/politics/2018/03/20/1-trends-in-party-affiliation-among-demographic-groups/.
- Robb M (2017). News and America’s kids: How young people perceive and are impacted by the news. San Franc CA: Common Sense. [Google Scholar]
- Roberts FC (2018). Mindfulness in the social media age. In Baylor University Medical Center Proceedings (pp. 250–252). Taylor & Francis. [DOI] [PMC free article] [PubMed] [Google Scholar]
- Rosenthal CS, Jones J, & Rosenthal JA (2003). Gendered discourse in the political behavior of adolescents. Political Research Quarterly, 56, 97–104. 10.1177/106591290305600110 [DOI] [Google Scholar]
- Sapiro V (2004). Not your parents’ political socialization: Introduction for a new generation. Annual Review of Political Science, 7, 1–23. 10.1146/annurev.polisci.7.012003.104840 [DOI] [Google Scholar]
- Schulenberg JE, & Zarrett NR (2006). Mental Health During Emerging Adulthood: Continuity and Discontinuity in Courses, Causes, and Functions (pp. 135–172). Emerg Adults Am Coming Age 21st Century. 10.1037/11381-006 [DOI]
- Schuman H, & Corning AD (2000). Collective knowledge of public events: The soviet era from the Great purge to glasnost. American Journal of Sociology, 105, 913–956. [Google Scholar]
- Schuman H, & Scott J (1989). Generations and collective memories. American Sociological Review, 54, 359–381. 10.2307/2095611 [DOI] [Google Scholar]
- Slater MD (2007). Reinforcing spirals: The mutual influence of media selectivity and media effects and their impact on individual behavior and social identity. Communication Theory, 17, 281–303. [Google Scholar]
- Stickley A, & Koyanagi A (2016). Loneliness, common mental disorders and suicidal behavior: Findings from a general population survey. Journal of Affective Disorders, 197, 81–87. 10.1016/j.jad.2016.02.054 [DOI] [PubMed] [Google Scholar]
- Stiglitz JE (12 May 2013). Student debt and the crushing of the American dream. In Opinionator [cited 11 Feb 2020]. Available: https://opinionator.blogs.nytimes.com/2013/05/12/student-debt-and-the-crushing-of-the-american-dream/. [Google Scholar]
- Stravynski A, & Boyer R (2001). Loneliness in relation to suicide ideation and parasuicide: A population-wide study. Suicide and Life-Threatening Behavior, 31, 32–40. 10.1521/suli.31.1.32.21312 [DOI] [PubMed] [Google Scholar]
- Taneja H, Wu AX, & Edgerly S (2018). Rethinking the generational gap in online news use: An infrastructural perspective, 20 pp. 1792–1812). New Media Soc. [Google Scholar]
- Taylor P (2008). Republicans: Still happy campers. Pew Res Cent Soc Demogr Trends. [Google Scholar]
- Turner RH (1960). Sponsored and contest mobility and the school system. American Sociological Review, 25, 855–867. 10.2307/2089982 [DOI] [Google Scholar]
- Twenge JM, & Campbell WK (2019). Media use is linked to lower psychological well-being: Evidence from three datasets. Psychiatric Quarterly, 90, 311–331. [DOI] [PubMed] [Google Scholar]
- Twenge JM, Cooper AB, Joiner TE, Duffy ME, & Binau SG (2019). Age, period, and cohort trends in mood disorder indicators and suicide-related outcomes in a nationally representative dataset, 2005–2017. Journal of Abnormal Psychology, 128, 185–199. 10.1037/abn0000410 [DOI] [PubMed] [Google Scholar]
- Twenge JM, Honeycutt N, Prislin R, & Sherman RA (2016). More polarized but more independent: Political party identification and ideological self-categorization among US adults, college students, and late adolescents, 1970–2015. Personality and Social Psychology Bulletin, 42, 1364–1383. [DOI] [PubMed] [Google Scholar]
- Valois RF, Zullig KJ, Huebner ES, & Drane JW (2004). Life satisfaction and suicide among high school adolescents. Social Indicators Research, 66, 81–105. 10.1023/B:SOCI.0000007499.19430.2f [DOI] [Google Scholar]
- Van Aelst P, Strömbäck J, Aalberg T, Esser F, De Vreese C, Matthes J, et al. (2017). Political communication in a high-choice media environment: A challenge for democracy? Ann Int Commun Assoc, 41, 3–27. [Google Scholar]
- VanderWeele TJ, & Ding P (2017). Sensitivity analysis in observational research: Introducing the E-value. Annals of Internal Medicine, 167, 268–274. 10.7326/M16-2607 [DOI] [PubMed] [Google Scholar]
- Weinberger AH, Gbedemah M, Martinez AM, Nash D, Galea S, & Goodwin RD (2018). Trends in depression prevalence in the USA from 2005 to 2015: Widening disparities in vulnerable groups. Psychol Med Camb, 48, 1308–1315. 10.1017/S0033291717002781 [DOI] [PubMed] [Google Scholar]
- Weir K (2019). Politics is personal. In American Psychological Association [cited 22 Jul2020]. Available: https://www.apa.org/monitor/2019/11/cover-politics. [Google Scholar]
- Wicklin R Standardized regression coefficients. In: The DO Loop [Internet]. [cited 26 Aug 2021]. Available: https://blogs.sas.com/content/iml/2018/08/22/standardized-regression-coefficients.html. [Google Scholar]
- Witt E (2019). From Parkland to Sunrise: A year of extraordinary youth activism. NewYorker. [Google Scholar]
- Worland J (11 June 2020). America’s Long Overdue Awakening to Systemic Racism [Internet] Time [cited 18 Sep 2020]. Available: https://time.com/5851855/systemic-racism-america/.
- Wray-Lake L (2019). How do young people become politically engaged? Child DevPerspect, 13, 127–132. 10.1111/cdep.12324 [DOI] [Google Scholar]