

Abstract
The mediodorsal thalamus (MD) is a higher-order nucleus located within the central thalamus in many mammalian species. Emerging evidence from MD lesions and tracer injections suggests that the MD is reciprocally connected to the prefrontal cortex (PFC) and plays an essential role in specific cognitive processes and tasks. MD subdivisions (medial, central, and lateral) are poorly segregated at the molecular level in rodents, leading to a lack of MD subdivision-specific Cre driver mice. Moreover, this lack of molecular identifiers hinder MD subdivision- and cell-type-specific circuit formation and function analysis. Therefore, using publicly available databases, we explored molecules separately expressed in MD subdivisions. In addition to MD subdivision markers, we identified several genes expressed in a subdivision-specific combination and classified them. Furthermore, after developing medial MD (MDm) or central MD (MDc) region-specific Cre mouse lines, we identified diverse region- and layer-specific PFC projection patterns. Comparison between classified MD marker genes in mice and common marmosets, a non-human primate model, revealed diverging gene expression patterns. These results highlight the species-specific organization of cell types and their projections in the MD thalamus.
Keywords: mediodorsal thalamus, prefrontal cortex, evolution, non-human primate, cognition
Introduction
The mediodorsal thalamus (MD) plays a critical role in cognitive function (Mitchell, 2015). For instance, impairments in working memory and reversal learning have been reported in MD-lesioned rats and primates (Bailey et al., 2005; Block et al., 2007; Chudasama et al., 2001; Floresco et al., 1999; Hunt et al., 1998a, 1998b). MD comprises various cellular subgroups that divergently project to distinct brain areas, including the prefrontal cortex (PFC), basolateral amygdala, and striatum (Alcaraz et al., 2016; Deschenes et al., 1995; Elena Erro et al., 2002; Krettek et al., 1977). Although several studies investigated the function of MD subdivisions by targeted physical and irreversible ablation, these lesion studies produced unclear results between individual animal or experiment (Mitchell, 2015). In contrast, similar cognitive dysfunctions as those reported for MD damage have been reported following PFC damage in rodents and non-human primates (Kahn et al., 2012; Ongur et al., 2000). Furthermore, several brain imaging studies show decreased functional connectivity between the MD and PFC in the schizophrenia patients exhibiting cognitive deficits, suggesting that a subpolulation of MD projects to PFC and plays distinctive roles on cognitive function. Recent optogenetic and chemogenetic studies on MD-PFC neural circuits aimed to reveal the neuronal activity in the MD in the context of working memory and cognition (Bolkan et al., 2017; Parnaudeau et al., 2013). However, these approaches still involve necessitate stereotaxic injections into the MD without targeting discrete subdivisions.
Identifying MD subdivision-specific molecular markers is crucial to enable the dissection of MD cell-specific circuit formation and function. Based on simple histological staining such as Nissl substrate, the MD can be divided into cytoarchitectonically distinct subnuclei. In rodents, the MD is typically subdivided into three distinct regions: the medial MD (MDm) (closest to the midline), central MD (MDc), and lateral MD (MDl) (bordering the rostral intralaminar nuclei and internal medullary lamina) (Krettek et al., 1977; Mitchell et al., 2013; Van Eden, 1986). In primates, MD subdivisions can be morphologically parsed into a magnocellular subdivision (MDmc) (corresponding to the MDm in rodents), parvocellular subdivision (MDpc) (corresponding to the MDc in rodents), pars multiformis, and densocellular subdivisions (MDmf [rostral MDl] and MDdc [caudal MDl], corresponding to the MDl in rodents) (Barbas et al., 1991; Giguere et al., 1988; Goldman-Rakic et al., 1985). Although the corresponding subdivisions are speculated based on anatomical location, the connectivity of different subdivisions to the PFC differs between primates and rodents (Parnaudeau et al., 2018). For example, the MDc in rodents and the MDmc in primates project to the orbitofrontal cortex, while the MDm in rodents and the MDpc in primates project to the medial PFC. In addition to the different organization of MD projections, the mPFC itself is also differently organized differently in rodents and marmosets, which makes it even more difficult to compare the MD-mPFC connectivity among the two species (Schaeffer et al., 2020).
To elucidate the homology between these subdivisions across species, unveiling the molecular identities of MD subdivisions is critical. Therefore, in the present study, we explored molecules that were expressed explicitly in MD subdivisions and compared patterns of gene expression and connectivity of MD subdivisions between rodents (mice) and primates (common marmosets, Callithrix jacchus).
Materials and Methods
Animals
All procedures in mice were performed in accordance with protocols approved by the Institutional Animal Care, and Use Committee of RIKEN Wako and Kobe branches (W2020-2-021). ICR (CD1) mice were purchased from Japan SLC. Tacr3-IRES-Cre mice (accession No. CDB0056E: http://www2.clst.riken.jp/arg/mutant%20mice%20list.html) were generated by the Laboratory for Animal Resources and Genetic Engineering (RIKEN Center for Biosystems Dynamics Research). The SERTCre knock-in mice used in the present study were provided by Dr. Zhuang (Zhuang et al., 2005). Ai9 (The Jackson Laboratory, JAX#007909, RRID: IMSR_JAX#007909) and R26R mice (Jackson Laboratory, JAX#003309, RRID: IMSR_JAX:003309) were used as reporter mice. The day of birth was designated as postnatal day 0. Both sexes were analyzed and ≥3 individual mice were analyzed in each experiment. Genotyping of tail clips was confirmed by genomic PCR. The following primers were used for the genotyping of Tacr3-IRES-Cre mice: FW: 5’-GAC TCC ACC TAC TTA GAG-3’, REV1: 5’-TCG GCC AGT AAC GTT AGG-3’, and REV2: 5’-CTC CCT ACT CTT TGA GGC TG-3’ (502 bp and 878 bp, respectively).
All procedures in marmosets were performed in accordance with protocols approved by the Institutional Animal Care, and Use Committee of RIKEN Wako branches (W2020-2-022). Marmosets were derived from a breeding colony at RIKEN Center for Brain Science.
In situ hybridization (ISH)
Mice were deeply anesthetized with a lethal dose of pentobarbitone (150 mg/kg). After three failed attempts to elicit a foot withdrawal reflex, the animals were transcardially perfused with 4% paraformaldehyde (PFA) in phosphate-buffered saline (PBS). Brains were removed and post fixed in the same fixative for 1h at 4°C and 2 h at room temperature and equilibrated with 30% sucrose in 4% PFA at 4°C overnight. Coronal sections of 28 μm thickness were generated with a sliding microtome (SM2020R, Leica). ISH was performed as described previously (Grove et al., 1998). Antisense probes were generated from the template plasmids (FANTOM clone, B230383K19 for Tacr3, K530020M21 for Gnb4, C730036B16 for Necab1, G530130E02 for Ptk2b, E230015I18 for Ucp2, B230325C03 for Shox2, 0610025O15 for Cck and GenBank clone, and Z48800 for Gbx2). Tnnt1 (nucleotides 525–875, NM_001277903.1) was subcloned into a pGEM-T-Easy vector (Promega) and used as a template. The expression patterns of each gene were confirmed in three independent brains.
Neonate marmosets were deeply anesthetized with a lethal dose of pentobarbitone (100 mg/kg). After three failed attempts to elicit a foot withdrawal reflex, the animals were transcardially perfused with 4% PFA in PBS. Brains were removed and fixed with 30% sucrose in 4% PFA at 4°C for several days until sinkage. Coronal sections of 28 μm thickness were generated with a sliding microtome (SM2020R, Leica). ISH was performed as previously described (Mashiko et al., 2012). Probes and images were obtained from the Marmoset Gene Atlas (https://gene-atlas.brainminds.riken.jp) (Shimogori et al., 2018).
Stereotaxic virus injection
The AAV-DIO-EYFP was produced as previously described (Kinoshita et al., 2019). Tacr3Cre heterozygous mice at P2 or P3 were used for stereotaxic virus injection. The mice were anesthetized on ice for several minutes. After confirmation of the lack of reflex by pinching, pups were placed on a stereotaxic apparatus maintaining hypothermia by ice during surgery. A purified AAV solution (200 nl/site, injection rate 50 nl/min) was injected into the right side of the MD (A/P −2.3 mm, M/L +0.33 mm from bregma, D/V −2.2 mm from the skull surface). Experiments were carried out with KDS Legato 130 (KD Scientific) and stereotaxic frame (Muromachi Kikai).
Immunohistochemistry
Mice were deeply anesthetized (150 mg/kg) and transcardially perfused with 4% PFA in PBS. Brains were removed and post fixed in the same fixative for 2h at 4°C and equilibrated with 30% sucrose in PBS at 4°C overnight. Coronal sections (50 μm thickness) were generated using a sliding microtome (SM2020R, Leica). Sections were blocked for 1h at room temperature with blocking buffer (0.1% Triton X-100 and 5% normal goat serum in PBS) and incubated with rabbit polyclonal anti-RFP antibody (Abcam, Cat#ab62341, RRID: AB_945213), rabbit polyclonal anti-GFP antibody (MBL International, Cat#598, RRID: AB_591819) and/or rat-monoclonal anti-Ctip2 antibody (Abcam, Cat#ab18465, RRID: AB_2064130) at 1:200 in blocking buffer at 4°C overnight. After washing three times in PBS for 10 min, sections were incubated with Alexa-594-conjugated anti-rabbit IgG secondary antibody (Thermo Fisher Scientific, Cat# A11037, RRID: AB_2534095), Alexa-488-conjugated anti-rabbit IgG secondary antibody (Thermo Fisher Scientific, Cat#A11034, RRID: AB_2576217) and/or Alexa-488-conjugated anti-rat IgG secondary antibody (Thermo Fisher Scientific, Cat#A11006, RRID: AB_2534074) at 1:400 in blocking buffer for 2 h at room temperature. After washing three times in PBS for 10 min, sections were counterstained with 1 μg/mL of 4’, 6-diamidino-2-phenylindole (DAPI) (11034-56, Nacalai Tesque).
X-gal staining
Brains were removed and post fixed in the same fixative for 2h at 4°C and equilibrated with 30% sucrose in PBS at 4°C overnight. Coronal sections (28 μm thickness) were generated with a sliding microtome (SM2020R, Leica). After washing in PBS for 10 min, sections were incubated with staining buffer (1 mg/mL X-gal, 5 mM K3Fe(CN)6, K4Fe(CN)6, 5 mM EDTA, 2 mM MgCl2, 0.01% deoxycholate, and 0.02% NP-40 in PBS) at 37°C overnight.
Images
Mouse ISH images and X-gal-stained images were acquired using a digital slide scanner (NanoZoomer S210, Hamamatsu Photonics). Marmoset ISH images were obtained from the Marmoset Gene Atlas (https://gene-atlas.brainminds.riken.jp). Fluorescent images were acquired by fluorescence microscopy (BZ-9000, KEYENCE) or confocal microscopy (FV3000, Olympus). The images were imported into Adobe Photoshop (Adobe) or ImageJ (NIH) to adjust brightness and contrast.
Results
Gene expression patterns in mouse MD subdivisions
To investigate the molecular markers labeling each MD subdivisions in mice, we investigated gene expression patterns using ISH in mice on postnatal day (P) 15. This is the earliest stage of development detected by Nissl staining in each subdivision (Fig. 1a). In mice, MD subdivisions were distributed along the medial-lateral and anterior-posterior axes. The anterior part of the MD consisted of the MDm (medial) and MDl (lateral), whereas the posterior part of the MD consisted of the MDm, MDc (central), and MDl (Fig. 1a). Based on multiple tracer analysis in rodents (already well established in rat), each MD region was identified to have a specific target area in the PFC (Alcaraz et al., 2016). A summary of the connections from the MD to the PFC identified by retrograde tracer injections into the PFC is illustrated in Fig. 1a (Alcaraz et al., 2016). Projections from the MDm to the prelimbic cortex, infralimbic cortex, agranular insular area (AID), and basolateral amygdala; from the MDc to the orbital frontal cortex and AID; and from the MDl to the prelimbic cortex, anterior cingulate area, and orbitofrontal cortex (OFC) were observed (Alcaraz et al., 2016; Murphy et al., 2018).
Figure 1.
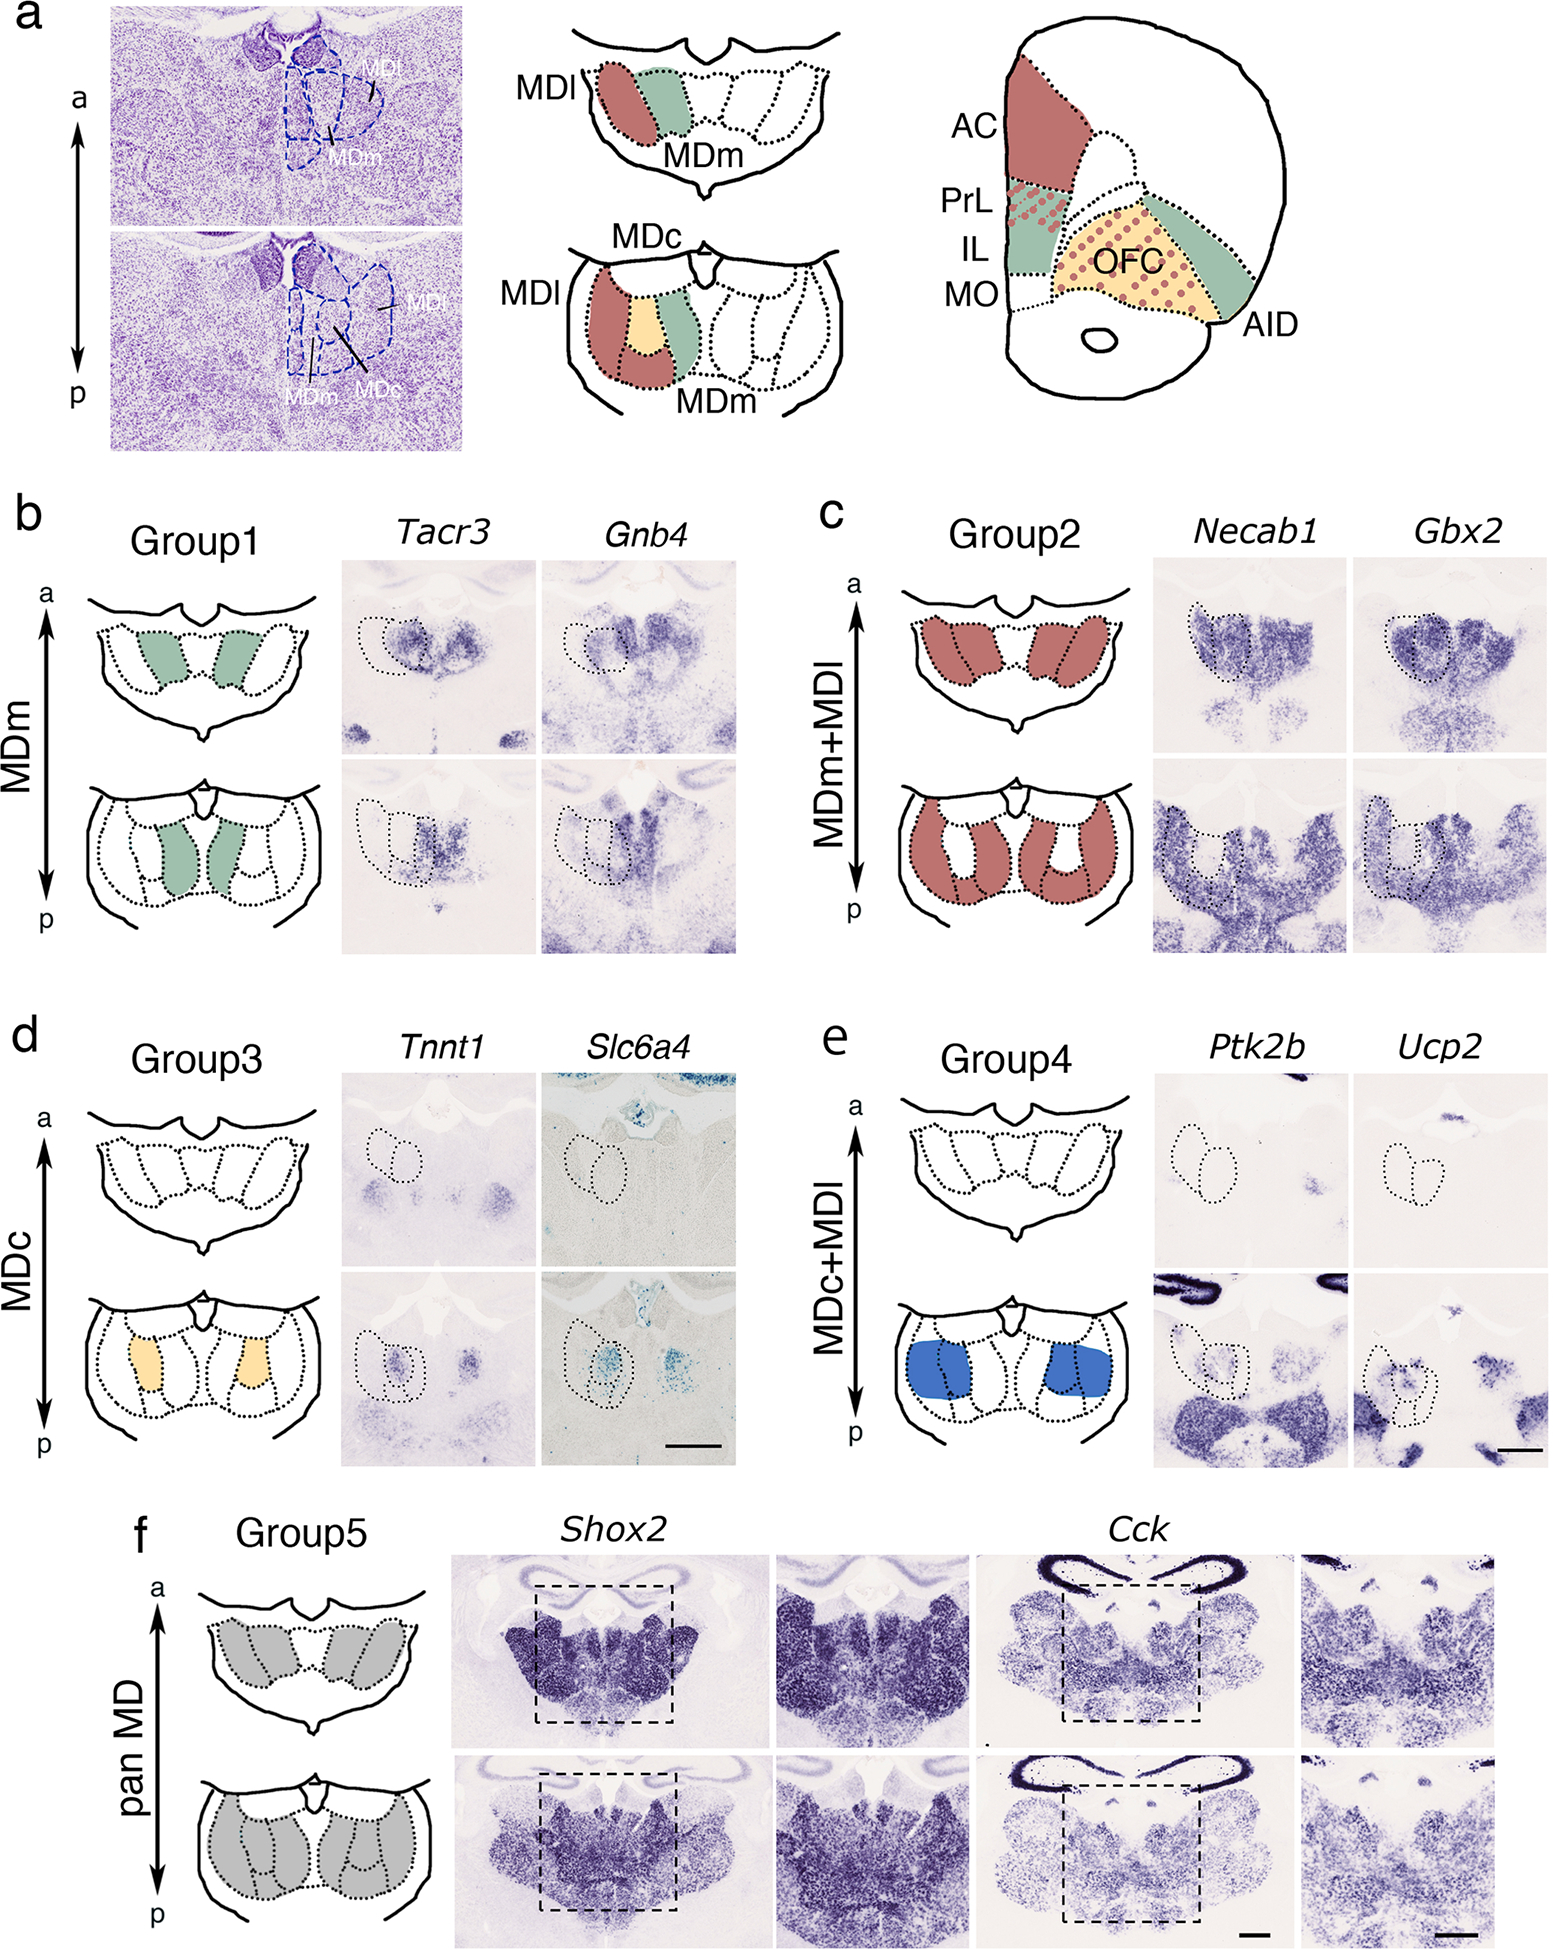
(a) Nissl staining in P15 mouse brain and schematic of the projection patterns from each MD subdivision (MDm, MDc, and MDl) to the PFC as based on a previous study (Alcaraz et al., 2016). AC, anterior cingulate cortex; PrL, prelimbic cortex; IL, infralimbic cortex; OFC orbitofrontal cortex; AID, agranular insular cortex. (b-f) Representative images of in situ hybridization revealed expression patterns in mice MD subdivisions at P15. Five groups were categorized based on the expression patterns in MD subdivisions. (b) Group 1: Tacr3 and Gnb4 were expressed in the anterior and posterior MDm. (c) Group 2: Tnnt1 in the MDc. X-gal staining revealed Cre-mediated recombination in the MDc of SERTCre;R26R mice at P6. (d) Group 3: Necab1 and Gbx2 were expressed in the anterior and posterior MDm and MDl. (e) Group 4: Ptk2 and Ucp2 were expressed in the MDc and in a subregion of the posterior MDl. (f) Group 5: Shox2 and Cck were broadly expressed throughout the entire MD.
Single-cell anterograde tracer labeling provides a detailed projection mapping of MD subdivisions to specific regions and layers of the PFC (Kuramoto et al., 2017; Winnubst et al., 2019). Although tracer injections into the MD revealed projections to parvalbumin-positive (PV+) cells in the dorsal anterior cingulate cortex (dACC) layer 2/3 (Delevich et al., 2015) and vasoactive intestinal peptide (VIP) cells in layer 1b in the prelimbic cortex (PrL) (Anastasiades et al., 2021), the MD subdivisions that project to these specific PFC cell populations have not been systematically investigated. To search for genes expressed in the MD, we used a publicly available ISH database (Allen Brain Atlas: https://portal.brain-map.org) (Lein et al., 2007) and our ISH data to further explore MD-expressing marker genes (Shimogori et al., 2010). Expression patterns were classified into five groups based on the number of molecules differentially expressed in MD subdivisions (Table 1). Group 1 comprised genes showing MDm-subregional expression in both anterior and posterior MD portions (Fig. 1b), Group 2 comprised expression in anterior and posterior MDm and MDl portions (Fig. 1c), Group 3 MDc expression (Fig. 1d), Group 4 expression in the MDc and posterior/dorsal MDl (Fig. 1e), and Group 5 the entire MD (Fig. 1f and Table 1). MDm markers, such as Tacr3 (tacykinin receptor 3) and Gnb4 (guanine nucleotide binding protein beta 4), were expressed in both the anterior MDm (Fig. 1b, upper panel) and posterior MDm (Fig. 1b, lower panel). Group 2 marker genes, such as Necab1 (N-terminal EF-hand calcium binding protein 1) and Gbx2 (gastrulation brain homeobox 2), were expressed in the anterior MDm and MDl (Fig. 1c, upper panel) and in the posterior MDm and MDl but not in the MDc (Fig. 1c, lower panel). Group 3 comprised MDc markers, including Tnnt1 (slow skeletal muscle troponin T) and Slc6A4 (solute carrier family member 4) (Fig. 1d). Slc6A4 (SERT: serotonin transporter) was only transiently expressed in the MDc (until P4) (Fig. 1d) (Narboux-Nême et al., 2008). In order to perform Slc6a4 lineage analysis, we employed Slc6A4 reporter mice (SERTCre line) and crossed them with R26R mice (Narboux-Neme et al., 2008). X-gal staining in SERTCre × R26R mice revealed labeling in the MDc at P6 (Fig. 1d). We further identified Group 4 genes that were expressed in the MDc and posterior/dorsal part of the MDl, such as Ptk2b (protein tyrosine kinase 2 beta) and Ucp2 (uncoupling protein 2), implying the presence of further anterior/posterior MDl subdivisions based on these molecular expression patterns (Fig. 1e). Genes expressed in the entire MD, such as Shox2 (short stature homeobox 2) and Cck (cholecystokinin), were classified as Group 5 (Fig. 1f).
Table 1.
Molecular profile in mouse MD subdivisions. Mouse genes were categorized into five groups from their expression patterns.
| Group1 (MDm) |
Group2 (MDm + MDl) |
Group3 (MDc) |
Group4 (MDc + MDl) |
Group5 (MDm + MDc + MDl) |
|---|---|---|---|---|
| Gnb4 | Col25a1 | Gabra4 | Fam20c | Cck |
| Kitl | Gbx2 | Lynx1 | Plekhg1 | Ppm1a |
| Rab37 | Htr2c | Nefh | Ptk2b | Shox2 |
| Tacr3 | LOC432748 | Ptprj | Ucp2 | Tshz1 |
| Necab1 | Slc6a4 | |||
| Stmn1 | Tnnt1 | |||
| Stxbp6 |
Visualization of MDm circuits using Tacr3Cre mice
In order to examine the specificity of the molecular markers of MD regions for afferent fibers and projection targets, we generated a Tacr3-IRES-Cre mouse line (Tacr3Cre line) to label the MDm population. Using the CRISPR/Cas9 system, the IRES-Cre cassette was inserted into the 3’-UTR of the Tacr3 gene locus (Fig. 2a). To confirm Cre-mediated recombination in Tacr3-expressing cells, Tacr3Cre mice were crossed with Ai9 reporter mice (Madisen et al., 2010). tdTomato-positive cells were explicitly detected in the anterior and posterior MDm, and ventral hippocampal (vHip) neurons, with scattered expression in the cortex and ventral tegmental area (VTA), consistent with the observation of Tacr3 signals from our ISH analysis at P10 (Fig. 2b and c). Additional expression was observed in the paraventricular thalamus (PVT, Fig. 2b), which exhibited a weak ISH signal (Fig. 1b). To further investigate detailed projections from the MD to the PFC, we performed stereotaxic injections of AAV-DIO-EYFP virus to specifically label MDm neurons in Tacr3Cre mice at P2 (Figs. 2d–i). Detailed analysis of the PFC region of virus-injected mice at P14 revealed layer-specific axon terminals in prelimbic cortex (PrL) layers 1b and 3, layers 1 and 3 and deep layers of the infralimbic cortex (IL), and the medial orbital cortex (MO) (Figs. 2g–i). Taken together, these results indicate that Tacr3-positive MDm neurons project to specific layers in mPFC subdivisions.
Figure 2.
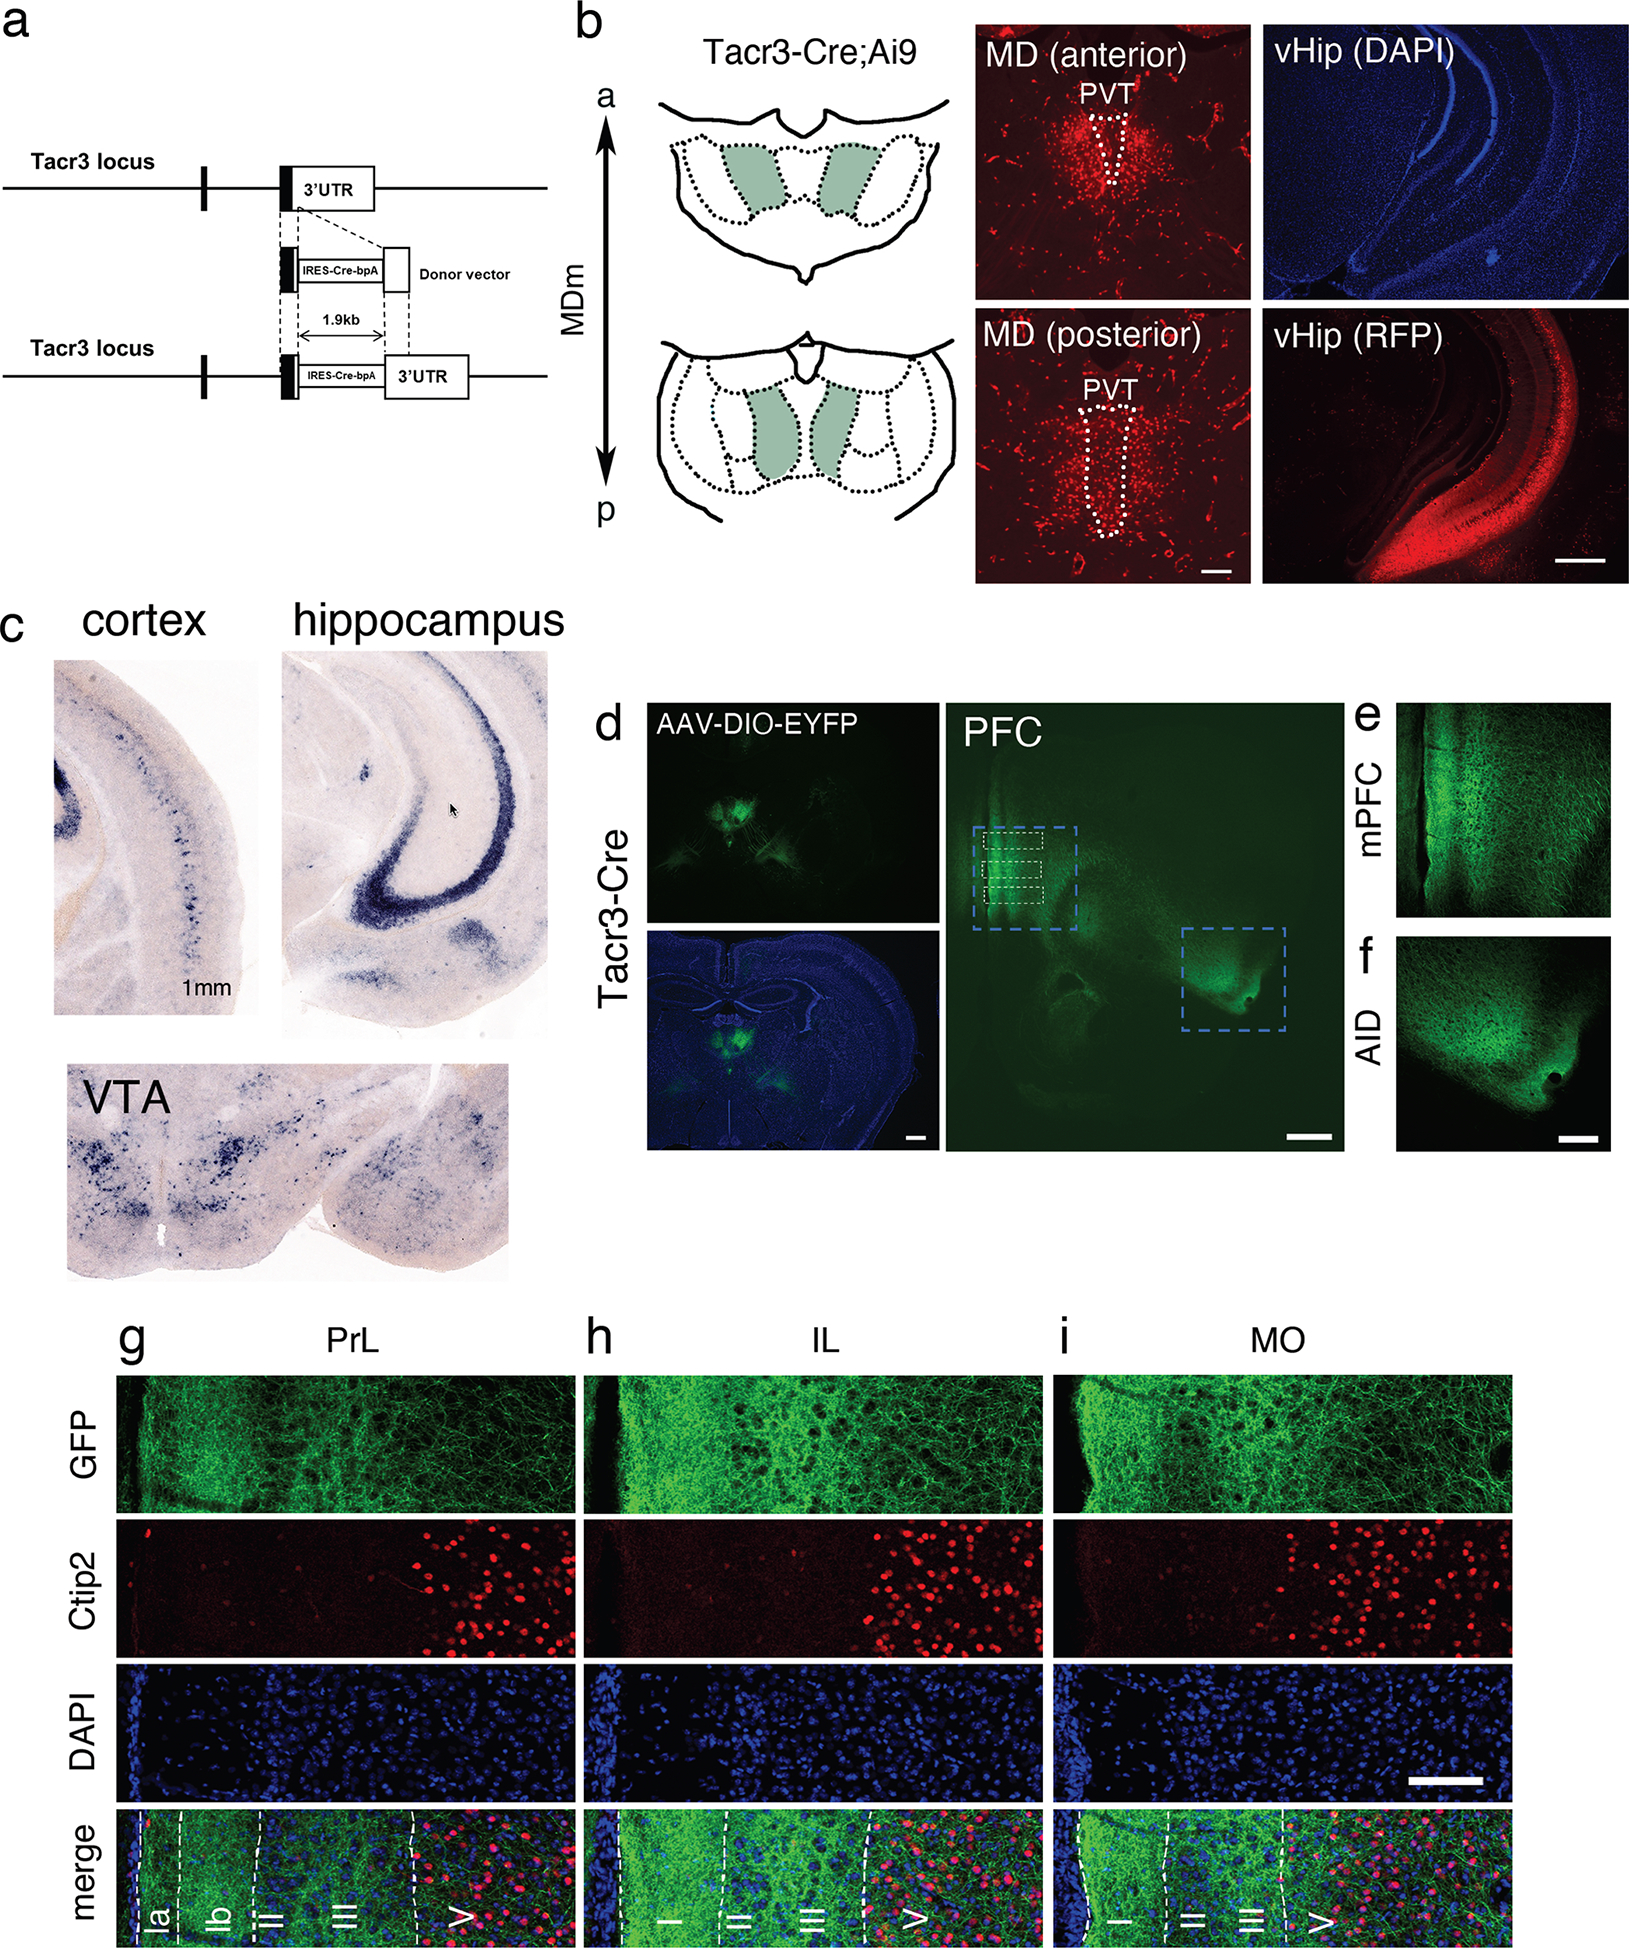
(a) Scheme of the targeting strategy for Tacr3-IRES-Cre mice. The guide RNA was designed based on the 3’UTR of the Tacr3 gene locus. The IRES-Cre-bpA cassette was inserted into the 3’UTR of the Tacr3 gene locus. (b) Representative immunohistochemistry images with anti-RFP antibody in Tacr3Cre;Ai9 at P16. Cre-mediated recombination confirmed by crossing Tacr3Cre with Ai9 mice. tdTomato-positive neurons observed in the anterior and posterior MDm and ventral hippocampus of Tacr3Cre;Ai9 mice. Sections counterstained with DAPI. Scale bars, 200 μm and 500 μm. (c) Tacr3 expression in cortex, hippocampus and ventral tegmental area (VTA) at P10, as revealed by ISH. (d–i) Stereotaxic injection of AAV-DIO-EYFP into MD of Tacr3Cre at P2 revealing the projection from Tacr3-positivie MD neurons to the PFC. Representative immunohistochemistry images with anti-GFP and anti-Ctip2 antibodies in virus-injected-Tacr3Cre at P14. Projections from the MDm to the PFC. Scale bars, 500 μm. Strong projections observed in the mPFC (ventral part of the PrL and IL) (e) and agranular insular cortex (AID) (f) depicted in high magnification images. Scale bar, 200 μm. (g–i) High magnification images in the PrL (g), IL (h), and MO (i) revealed differentially distributed GFP-positive axon terminals in the cortical layers of each region. Cortical layers were identified based on immunohistochemistry with anti-Ctip2 antibody and DAPI staining patterns. MO, medial orbital cortex. Scale bar, 100 μm.
Visualization of MDc circuits using SERTCre mice
In order to distinguish between MDc and MDm projections, MDc projections were visualized using SERTCre mice crossed with Ai9 reporter mice (Fig. 3). Consistent with the ISH results and analysis of lacZ staining of SERTCre × Rosa26 mice (Fig. 1d), we observed SERT tdTomato-positive MDc glutamatergic neurons and some scattered tdTomato-positive neurons in the anterior MDm (Fig. 3a). As previously reported, strong tdTomato fluorescence was observed in deep-layer neurons in the PFC (Fig. 3b) (Soiza-Reilly et al., 2019). Despite considerable innervation of the OFC by tdTomato-positive fibers, no obvious axon terminals were observed in the PrL and IL (Fig. 3b). Despite the need for technical improvements to more specifically label MDc projections in SERTCre mice, our data suggested that the SERTCre mouse line is a useful tool for labeling MDc neurons and that MD subdivisions project to distinct target regions and layers, underpinning their divergent connectivity and function.
Figure 3.
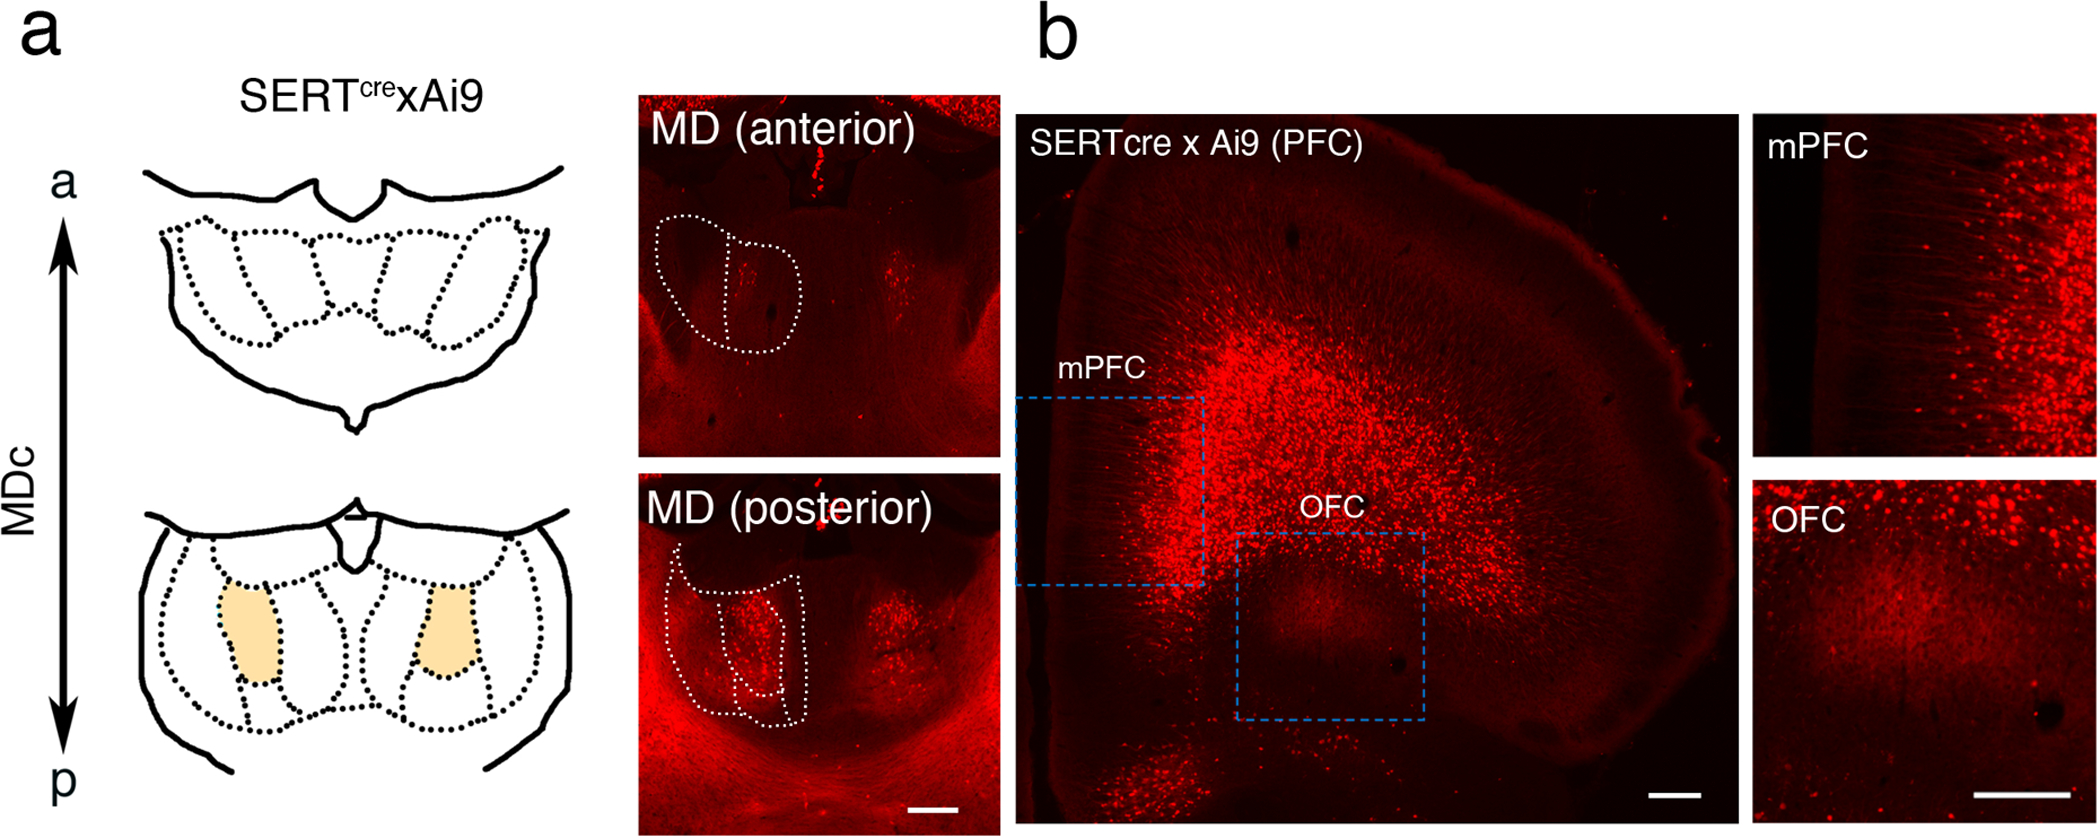
(a, b) Representative immunohistochemistry images with anti-RFP antibody in SertCre;Ai9 mice at P9. Scale bars, 200 μm. (a) Cre-mediated recombination confirmed by crossing SertCre mice with Ai9 mice. tdTomato-positive neurons observed in the MDc of Sert-Cre;Ai9 mice. (b) Projections from the MDc to PFC in SertCre;Ai9 mice. Strong projections were observed in the OFC but not in the mPFC, and depicted in high magnification images.
Gene expression patterns in common marmoset MD
In non-human primates, interconnectivity is observed between the MDmc region and OFC, the MDpc region and medial to dorsal PFC, and the lateral multiform part and premotor cortical area (Barbas et al., 1991; Giguere et al., 1988) (Fig. 4a). These afferents innervate layer 3 and layer 5 in primates, while reciprocal connections originate from layer 5/6 (Giguere et al., 1988; Krettek et al., 1977; Van Eden, 1986). Based on the distinct connectivity of MD subdivisions to the PFC in primates, we compared the molecular expression patterns of MD subdivisions in the mouse and common marmoset (Callithrix jacchus). The common marmoset is a small New World monkey that has recently emerged as a novel animal model in neuroscience research (Okano, 2021). A brain mapping project in Japan, Brain/MIND (Brain Mapping by Integrated Neurotechnologies for Disease Studies), focused on structural and functional mapping of the common marmoset brain, provides a comprehensive gene expression mapping in the marmoset brain based on ISH over the Marmoset Gene Atlas (https://gene-atlas.brainminds.riken.jp) (Shimogori et al., 2018).
Figure 4.
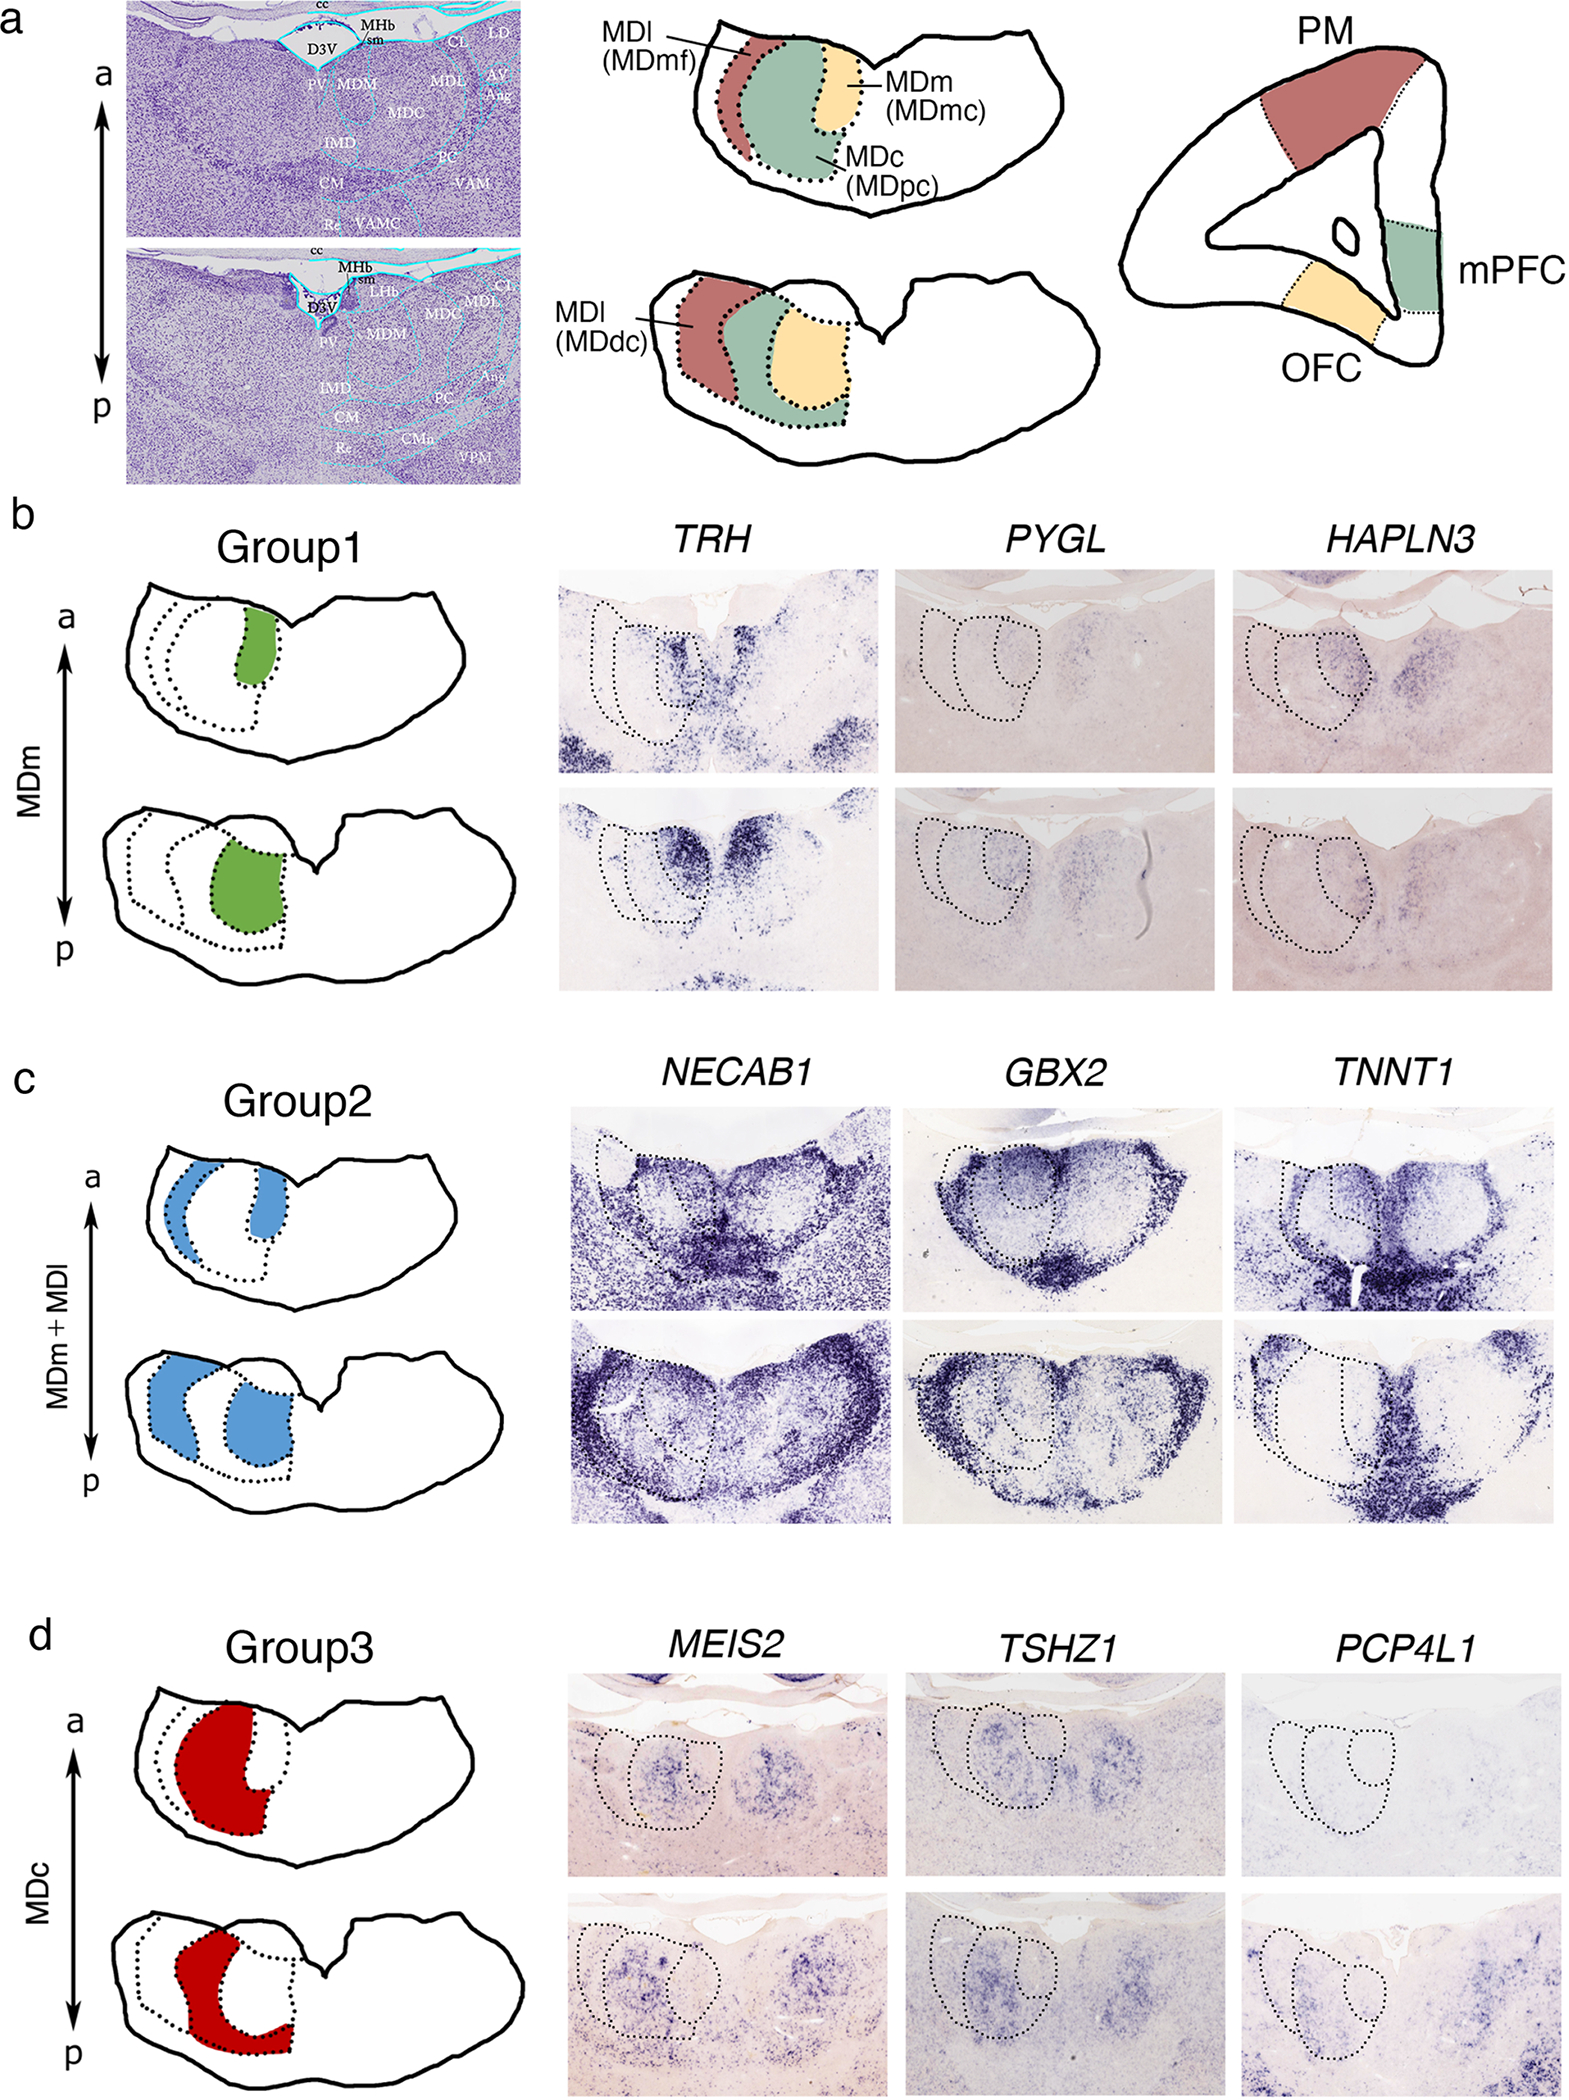
(a) Nissl staining in the neonate marmoset brain and schematic of the projection patterns from each MD subdivision (MDmc, MDpc, MDmf, and MDdc) to the PFC. Projections from the MDmc to the OFC, the MDpc to the mediodorsal PFC, and the MDmf and MDdc to premotor cortical areas. (b–d) Representative in situ hybridization images against genes expressed in marmoset MD subdivisions at P0. (b) Group 1: TRH, PYGL, and HAPLN3 expressed in the MDm. (c) Group 2: NECAB1, GBX2, and TNNT1 expressed in the MDm and MDl. (d) Group 3: MEIS2, PCP4L1, and TSHZ1 expressed in the MDc.
According to the marmoset atlas (Paxinos et al., 2012), and similar to mice, MD subdivisions are generally categorized into the MDm, MDc, and MDl. We first analyzed mouse MD gene expression in the neonatal marmoset brain, which is equivalent to mouse P15 (Mashiko et al., 2012). We first searched for Group1 (MDm) marker genes using a gene expression profiling system (GePS), which systematically and automatically identified gene expression patterns in specific regions of the neonatal marmoset brain (Kita et al., 2021). We identified 18 marmoset genes in the MDm (Table 2), the majority of which showed disperse expression. For example, thyrotropin-releasing hormone (TRH), glycogen phosphorylase L (PYGL), and hyaluronan and proteoglycan link protein 3 (HAPLN3) were expressed in the MDm in a scattered pattern with regional expression within the MDm (Fig. 4b). Other mouse MDm markers were not defined in the marmoset MD. For example, TACR3 was not detected in marmoset MDm, despite showing similar expression patterns in the hippocampus and hypothalamus of mice and marmosets (data not shown). We next searched for Group 2 marker genes (expressed in the MDm and MDl, 28 genes, Table 2) in marmosets and observed that both NECAB1 and GBX2 were expressed in the anterior MDm and MDl, similar to the pattern observed in the anterior and posterior MD in mice (Fig. 4c). Further, TNNT1 exhibited Group 2 expression patterns in the marmoset MD (Fig. 4c), although in mice its expression was detected in the MDc (Fig. 1d).
Table 2.
Molecular profile in marmoset MD subdivisions. Marmoset genes were categorized into seven groups from their expression patterns.
| Group1 (MDm) |
Group2 (MDm + MDl) |
Group3 (MDc) |
Group4 (MDc + MDl) |
Group5 (MDm + MDc + MDl) |
Group6 (MDl) |
Group7 (MDm + MDc) |
|||||
|---|---|---|---|---|---|---|---|---|---|---|---|
| CACNA2D3 | ALDH2 | ADD2 | UCP2 | AAK1 | CCDC184 | GABRA5 | LY6H | PLEKHG1 | SORL1 | APRT | CDKL5 |
| CHRM3 | ANK2 | ARHGAP32 | ADAMTS2 | AARS1 | CCK | GABRB3 | LYNX1 | PNISR | SPOCK1 | ARL10 | CNKSR3 |
| CYB5R1 | ATP2C1 | EGR1 | CACNA2D1 | ABAT | CD47 | GAD1 | MAL2 | PODXL2 | SRGAP2 | BHLHE40 | CRH |
| FBXW7 | CCK | GABRA3 | CADM1 | ABLIM3 | CDC34 | GAP43 | MAP2K1 | PPM1G | SRPK2 | CACNG5 | GPR161 |
| GABRA5 | CDH6 | GRIN1 | CBLN1 | ACE | CDH8 | GIT1 | MARK1 | PRDX2 | SRSF5 | CCN2 | KCTD1 |
| GNAL | CERK | IGSF21 | CHRNA4 | ACHE | CDHR1 | GLRB | MBOAT7 | PRDX6 | ST6GALNAC5 | CCNDBP1 | MAPK11 |
| GRIN3A | DGCR2 | ITPR1 | CUX1 | ACLY | CHD3 | GLYR1 | MEF2A | PRICKLE1 | STMN4 | CLVS2 | NECTIN1 |
| GRM8 | GABRG2 | KCNQ3 | GAD2 | ADARB1 | CHRNB2 | GNAS | METTL9 | PRKCD | STXBP6 | CSDC2 | NPNT |
| HAPLN3 | GBX2 | KIT | GJD2 | ADCYAP1R1 | CIAPIN1 | GPM6B | MICU1 | PRKCG | SUSD4 | DNAJC7 | NTN4 |
| HTR7 | GFAP | MAGEL2 | GNB4 | ADGRL1 | CIT | GPR153 | MRAP2 | PRPH | SYN1 | EIF4H | PDZD2 |
| MAP2K2 | MAPK1 | MEIS2 | LMO1 | ADM | CLASP2 | GRID2IP | MTCH2 | PRR12 | SYNGAP1 | ENTPD2 | PMP22 |
| NRSN2 | MAPK3 | N4BP2 | NDNF | AFF2 | CLIP2 | GRM4 | MTMR9 | PTPN3 | SYNJ1 | EPHA5 | PTK2B |
| PYGL | MRPL38 | PCP4L1 | NETO1 | AGPAT1 | CLMN | GRM5 | NBEA | PTPRO | SYNPR | FARSA | SCUBE1 |
| RTN4R | MSMO1 | RELN | NR4A1 | AKAP8L | CLMP | GSG1L | NCDN | RAB1A | TBC1D24 | GPRIN3 | SLC6A3 |
| SCN1B | NECAB1 | TSHZ1 | NRXN3 | ALDH5A1 | CLSTN2 | GSK3A | NDUFB7 | RASD2 | TGFA | GPX3 | |
| SCN8A | NFXL1 | ZADH2 | OTX2 | AMPH | CNTNAP4 | GSTA4 | NECAB2 | RASGRP2 | TIMP2 | GRM7 | |
| SDHB | OPRM1 | ZNF521 | PCDH19 | ANK3 | COL25A1 | GTF2I | NECAP1 | RASSF4 | TM2D3 | IRS4 | |
| TRH | PAK6 | ROBO1 | ANOS1 | CORO2B | GUCY1A1 | NEFM | RBFA | TMEM179 | KLHL1 | ||
| PKIA | ANP32A | CPLX3 | HRH3 | NLGN4X | RBFOX1 | TMX4 | KMT5A | ||||
| PLCH2 | ANXA2 | CPNE6 | HS6ST3 | NPTX2 | RCAN2 | TOMM20 | LYPD1 | ||||
| SCN1B | AP3B2 | CPNE7 | HSD17B12 | NPTXR | REEP2 | TOMM70 | OPCML | ||||
| SLC17A6 | APBA1 | CRTAC1 | HSPD1 | NR1D1 | RORA | TOX4 | PCSK5 | ||||
| SLC6A7 | ARCN1 | CSPG5 | HTR7 | NREP | RTN4RL2 | TPPP3 | PDE1B | ||||
| SPARC | ARL6IP5 | CTNNA2 | IDH2 | NRIP3 | SAMD14 | TRPC3 | PITPNC1 | ||||
| TNNT1 | ARNTL | CTNNB1 | IGFBP3 | NRN1 | SCG2 | TSPAN2 | PPM1A | ||||
| TSPYL2 | ATP1B2 | CTTN | IGFBP6 | NRXN2 | SCN1B | USP11 | PRDX3 | ||||
| TSPYL4 | ATP2A2 | DEXI | INA | NSDHL | SCN3B | USP9X | RADIL | ||||
| VAV3 | ATP6V0A1 | DGKZ | INPP5A | NSG2 | SDK2 | VAT1 | RANGAP1 | ||||
| ATP6V1C1 | DLAT | INSYN1 | NTNG1 | SEMA6D | VDAC2 | SHOX2 | |||||
| ATP8A2 | DLG4 | INSYN2A | NTRK2 | SEMA7A | VGF | SNCA | |||||
| ATRX | DLGAP4 | JMJD1C | NTS | SERPINE2 | VSTM2B | SV2B | |||||
| AUTS2 | DMTN | KCNAB2 | NUTF2 | SERPINF1 | VWC2 | SYN2 | |||||
| B3GALT2 | DPP6 | KCNH2 | NYAP2 | SETBP1 | WDR47 | TMEM215 | |||||
| BACE1 | DPYSL5 | KCNH8 | OGFRL1 | SETD2 | WLS | ||||||
| BBS2 | DSCAM | KCNMA1 | OPRK1 | SEZ6 | WNK2 | ||||||
| BDNF | EDEM3 | KCTD17 | PACS1 | SFXN1 | WNT4 | ||||||
| BRAF | EFNA5 | KCTD2 | PAK3 | SHANK2 | WNT7B | ||||||
| BRINP1 | EFNB3 | KITLG | PAK5 | SHOC2 | ZDHHC14 | ||||||
| BRSK2 | EPC1 | L1CAM | PAM | SIPA1L2 | ZIC1 | ||||||
| BTBD3 | EPHA4 | LEF1 | PAMR1 | SLC12A5 | ZIC4 | ||||||
| CA10 | FAM3C | LGALS1 | PCDH10 | SLC17A6 | ZNHIT1 | ||||||
| CACNA1A | FAM43A | LGI4 | PCDH17 | SLC24A3 | |||||||
| CACNA1C | FAM49A | LHFPL3 | PCDH9 | SLC29A4 | |||||||
| CACNA1E | FAM49B | LHFPL6 | PCP4 | SLC2A13 | |||||||
| CACNA1G | FHOD3 | LHX9 | PDE5A | SLC39A10 | |||||||
| CACNA1H | FIGN | LIMK1 | PEX5 | SLC39A6 | |||||||
| CACNG8 | FNBP1L | LIN7A | PHACTR1 | SLC8A1 | |||||||
| CALB2 | FOS | LRP8 | PI4KA | SLC9A6 | |||||||
| CAMKV | FOXP2 | LRRC3B | PITPNA | SMG7 | |||||||
| CBLN4 | FXYD6 | LRRTM1 | PJA2 | SNAP91 | |||||||
We searched for Group 3 marker genes using the GePS and identified 17 genes expressed in the MDc (Table 2). The majority of these marker genes were dispersely expressed with some regional specificity. Meis homeobox 2 (MEIS2) and teashirt zinc finger homeobox 1 (TSHZ1) were expressed in the MDc in a scattered manner, whereas Purkinje cell protein 4 like 1 (PCP4L1) was more strongly expressed only in the lateral portion of the posterior MDc (Fig. 4d). For Group 4 marker genes (genes expressed in the MDc and MDl, 18 genes, Table 2), we identified GNB4, UCP2, and NDNF (Fig. 5a). GNB4, categorized as a Group 1 (MDm) marker gene in mice, was observed in the MDc and anterior MDl in marmosets (Fig. 5A, green arrow). NDNF was expressed in the MDc and MDl with regional specificity in marmosets (Fig. 5a, magenta arrows), but its expression was not evident in the mouse MD (data not shown), highlighting the differences in marmoset and mouse MD marker expression. We also searched for genes expressed in all MD subdivisions (291 genes expressed in the entire thalamus were excluded, Group 5, Table 2). Our search for genes expressed in the MDl but not in the MDm and MDc in marmosets using the GePS revealed 33 genes (Group 6) including short stature homeobox 2 (SHOX2), synaptic vesicle glycoprotein 2B (SV2B), and protein phosphatase Mg2+/Mn2+ dependent 1A (PPM1A) (Fig. 5b and Table 2).
Figure 5.
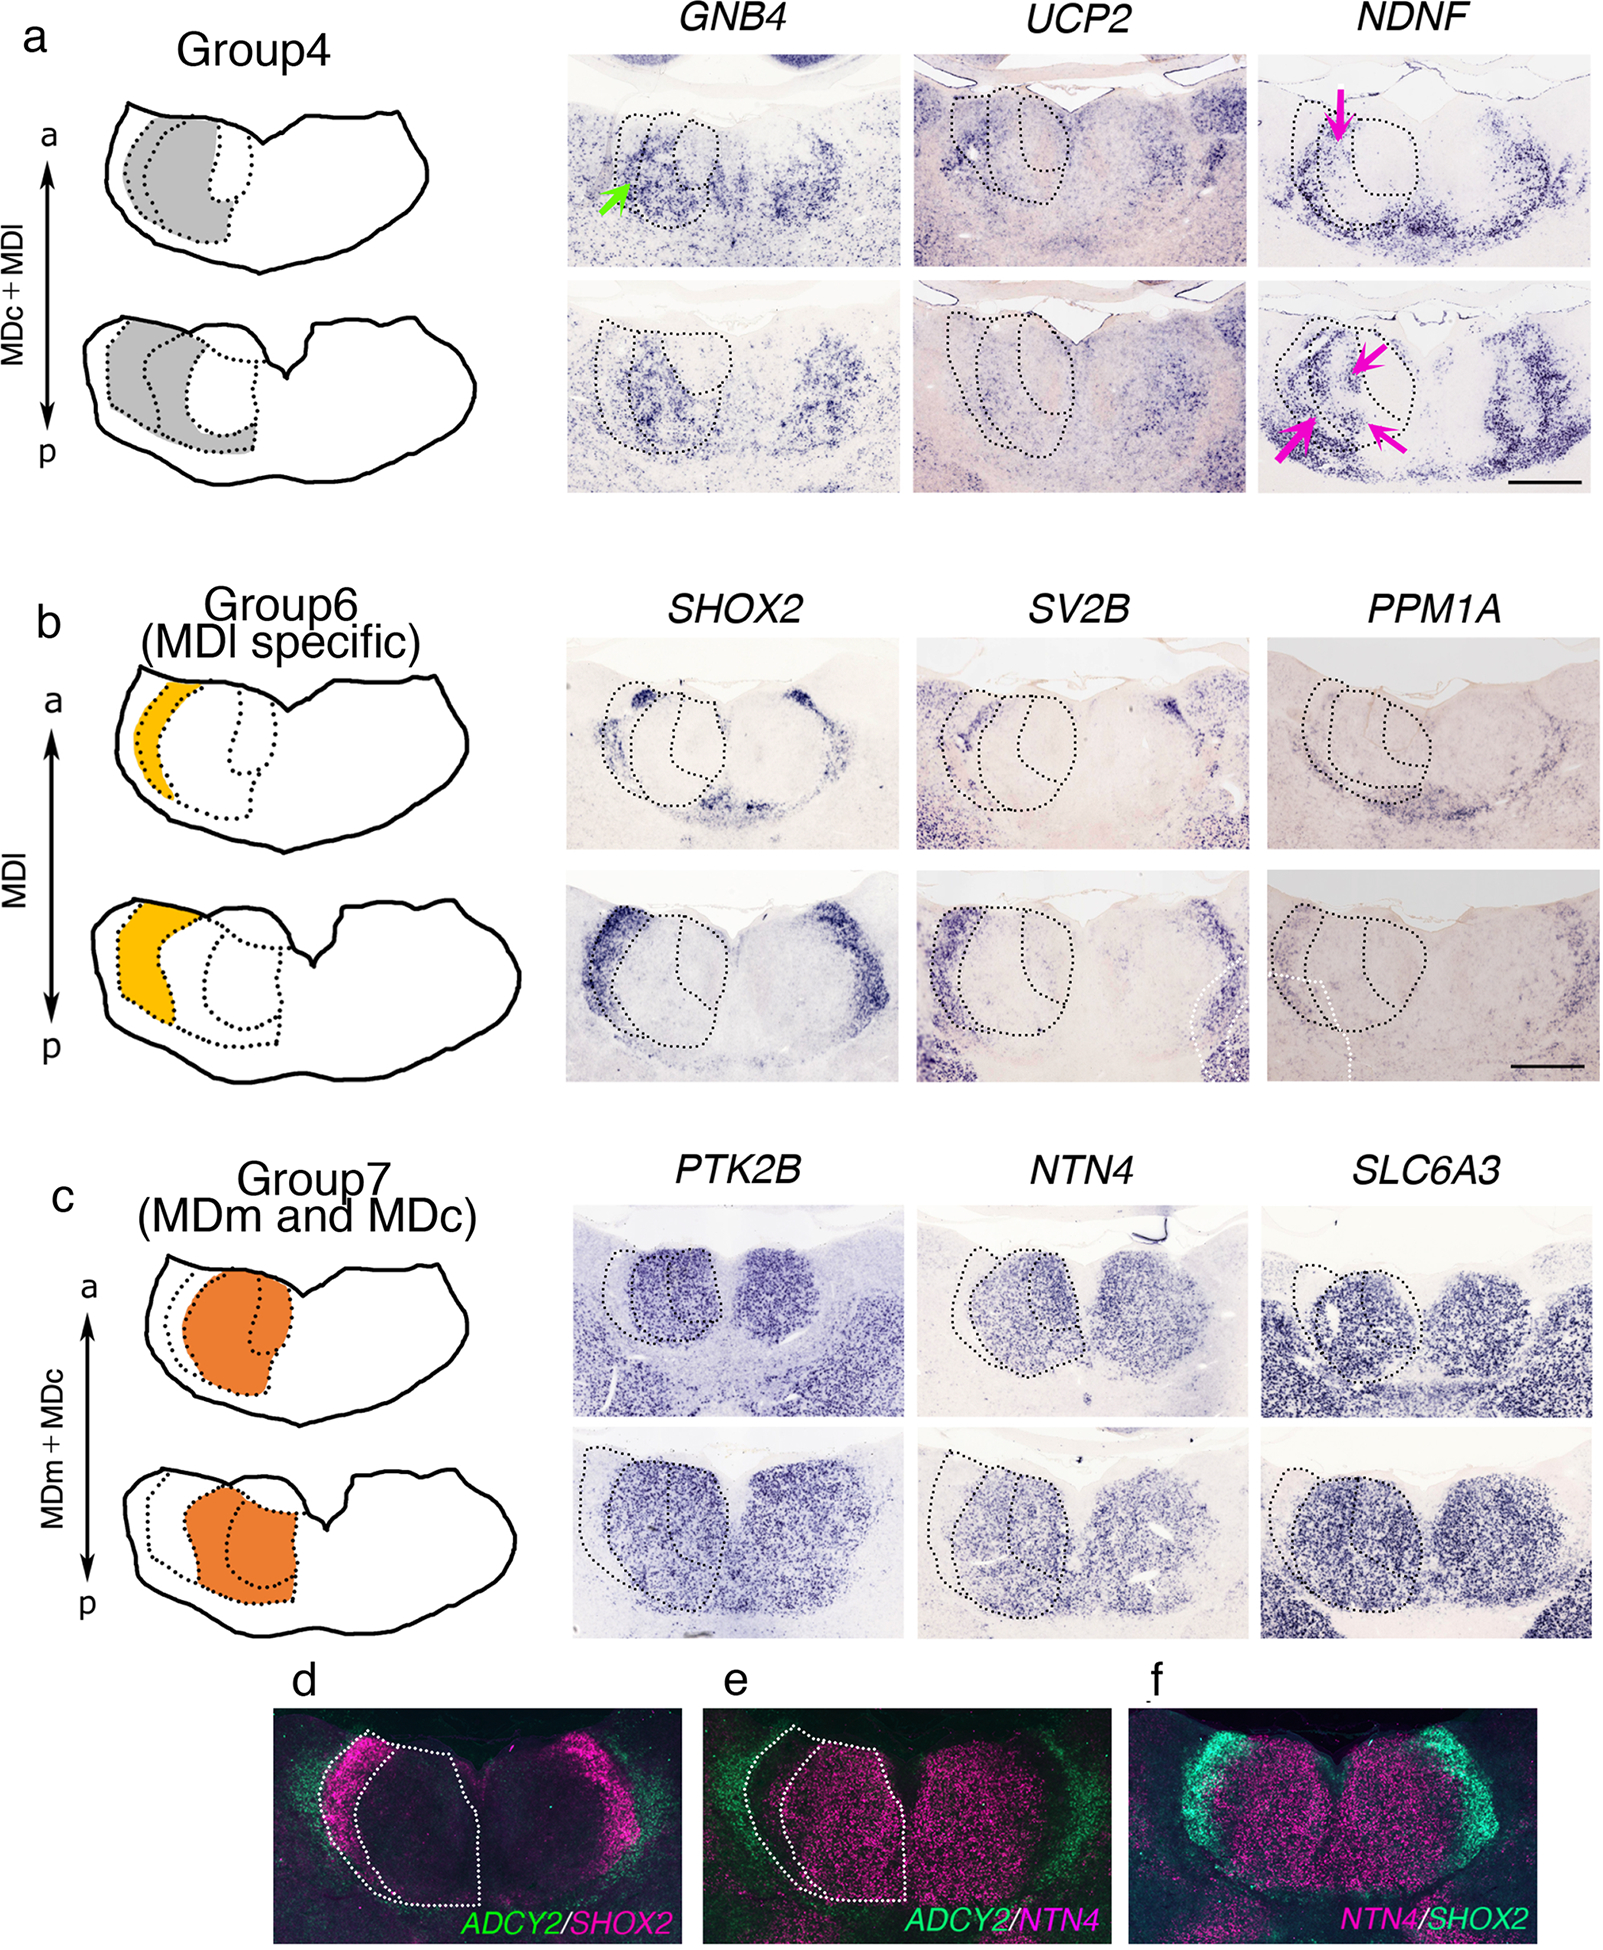
(a–c) Representative in situ hybridization images against genes expressed in marmoset MD subdivisions at P0. Scale bar, 1 mm. (a) Group 4: GNB4, UCP2, and NDNF expressed in the MDc and MDl. Green and magenta arrows indicate subregional expression, respectively. (b) SHOX2, SV2B, and PPM1A expressed in the MDl. (c) PTK2B, NTN4, and SLC6A3 expressed in the MDm and MDc. (d–f) Pseudo-colored ISH images of ADCY2 (CL), SHOX2 (MDl), and NTN4 (MDm and MDc) revealing the MDl borders. Overlaid pseudo-colored ISH images revealing the border between MDl and adjacent regions.
Finally, we searched for genes expressed in the MDm and MDc (not identified in the mouse, Group 7, 14 genes, Table 2). We observed that PTK2B, netrin 4 (NTN4), and solute carrier family 6 member 3 (SLC6A3, also known as DAT) were expressed in MDl. In contrast, Ntn4 and slc6a3 were not detected in the mouse MD, whereas Ptk2b showed different expression in mouse MD than Group 4 (Table 1). The MD is separated from the ventral thalamic nuclei by the central lateral thalamic nuclei (CL), which are easily distinguished with simple Nissl staining (Jones, 2007). We used a CL marker, adenylate cyclase 2 (ADCY2), as a landmark to confirm MDl marker genes. Pseudo-colored ADCY2 ISH was overlaid on a pseudo-colored SHOX2 ISH, which revealed a non-overlapping expression pattern (Fig. 5d). Overlay of MDm and MDc marker genes, such as NTN4, delineated precise MDl patterns in the non-overlapping region (Fig. 5e). The NTN4 and SHOX2 ISH combination labeled the entire MD, suggesting that we identified marker genes that delineated all the marmoset MD subdivisions (Fig. 5f). Collectively, we identified dynamic gene expression profiles in mouse and marmoset MD subdivisions and cell types, highlighting partially overlapping patterns between these species. Nevertheless, many genes were differentially expressed in mice and marmosets MD subdivisions, supporting the concept that heterogeneous MD cell types and diverse connectivity patterns to distinct target regions may underpin functional differences between MD subdivisions.
Discussion
The mediodorsal thalamus (MD) is a higher-order nucleus located in the central thalamus. MD subdivisions are connected to specific PFC regions and layers, which play important roles in cognitive control, working memory, and decision-making. We identified several molecular markers of mouse MD subdivisions, which could be used to label MD-PFC projections using a combination of genetically modified animals and in utero electroporation. We also compared MD marker expression in common marmosets to define the molecular similarities and differences between the mouse and marmoset MD. Notably, the genes expressed in MD subdivisions partially overlapped in mice and marmosets, but the majority exhibited different expression patterns. These results suggest that MD subdivisions in mice and marmosets differ at the molecular level.
MD subdivisions in evolution
The MD is widely recognized as the largest nucleus in the medial thalamus in rodents. Its size is relatively larger in humans, and this volumetric increase is thought to parallel the volumetric increase of the PFC in humans. MD subdivisions are well segregated in primates based on cytoarchitecture and chemoarchitecture (Jones, 2007). Our ISH analysis revealed many genes showing differential expression patterns in MD subdivisions of marmosets and mice, suggesting that MD subdivisions can also be described based on gene expression patterns in addition to anatomical segregation.
In primates, MDmc (MDm in rodents) neurons project to the OFC, and MDpc (MDc in rodents) neurons project to the medial PFC. In mice, MDm neurons project to the ventral PrL and IL, and MDc neurons project to the OFC. These results suggest that the cell types in these two MD subdivisions may differ between rodents and primates (Kuroda et al., 1998; Morecraft et al., 1992; Ray et al., 1993). Indeed, few genes exhibited the same expression patterns in the MDm and MDc in both mice and marmosets. For example, Gnb4, which was expressed in the mouse MDm, was found in the marmoset MDc, while Tnnt1, in the mouse MDc, was expressed in the marmoset MDm and MDl. A recent transcriptomic analysis delineated comprehensive gene profiling of MD subdivision neurons in mice (Phillips et al., 2019). Although the Marmoset Gene Atlas provides abundant gene expression profiles, comprehensive analyses such as single-cell-based RNA sequences will facilitate further comparisons of gene expression patterns between mouse, marmoset, and other non-human primate MD neurons.
The MDl can be further subdivided into pars multiformis subdivisions (MDmf or rostral MDl) and densocellular subdivisions (MDdc or caudal MDl) in primates (Barbas et al., 1991; Giguere et al., 1988; Goldman-Rakic et al., 1985). However, this cytoarchitectonic definition may not translate to rodents. A previous report demonstrated that anterior MDl neurons project predominantly to the dorsal part of the mPFC (Alcaraz et al., 2016), whereas the posterior MDl contains dorsal mPFC-projecting neurons and OFC-projecting neurons, suggesting that MDl neurons can be further subdivided based on projection patterns. In this study, we observed that Ptk2b and Ucp2 were expressed in the posterior MDl but not in the anterior MDl (Fig. 1e), indicating the presence of further anterior/posterior subdivisions of MDl as shown by ISH analysis.
The majority of genes expressed in the neonatal marmoset MD were not restricted only to the MD, and their expression domain often showed expression in neighboring dorsal thalamus nuclei, including the Pulvinar (Pul) (data not shown). The majority of genes expressed in the Pul were also expressed in other dorsal thalamic nuclei, which suggests a possible shared identity and potentially common origin; this needs further investigation.
Specific MD subdivision-PFC circuits
In this study, we established a Tacr3Cre mouse line that genetically labels MDm neurons. Single-cell morphological analysis revealed that the MDm contained mPFC-projecting neurons and AID-projecting neurons, indicating that MDm neurons have heterogeneous projection patterns (Kuramoto et al., 2017). Stereotaxic virus injection in Tacr3Cre mice visualized projections from the MDm to the mPFC and AID (Fig. 2). SERTCre mice labeled MDc neurons, which enabled visualization of the MDc-OFC circuit (Fig. 3). Taken together, in combination with optogenetic tools, Tacr3Cre and SERTCre mice will enable high-resolution dissection of MDm-mPFC and MDc-OFC-specific circuit function. Derivation of an MDl-specific Cre mouse line will provide novel insights into MD subdivision-specific neural circuits and their specific functions.
The roles of MD subdivisions in cognitive function
The critical roles of MD-PFC neural circuits in cognitive function was demonstrated using MD lesions in rodents and non-human primates. These studies, especially in non-human primates, provided MD subdivision-specific functions based on lesions of each MD subdivision. For example, ablation of the MDmc induced PFC hypoactivity and disrupted cognitive function (Parker et al., 1998). Furthermore, selective damage in the MDmc disrupted learning and memory (Gaffan et al., 2000; Mitchell et al., 2007). Similar deficits in cognitive function were observed in animals with bilateral ablation of the OFC and ventral PFC (Baxter, Browning, et al., 2008; Baxter et al., 2007). However, these deficits were not observed in animals with ablation of the dorsolateral PFC (Baxter, Gaffan, et al., 2008).
In rodents, ablation of the MD disrupts working memory, which depends on mPFC function (M’Harzi et al., 1991; Stokes et al., 1990a, 1990b), suggesting that the MD-mPFC circuit underscores working memory in rodents. Recently, the function of this circuit in working memory was confirmed using optogenetics. Inhibition of the MD-mPFC circuit disrupted performance in a delayed non-matching-to-sample T-maze test. In contrast, inhibition of the MD-OFC circuit did not affect performance in this task (Bolkan et al., 2017). These results suggest that each MD subdivision contributes to higher cognitive functions, but their precise roles remain unclear. Therefore, the elucidation of MD subdivisions and cell types in both rodents and primates is necessary to further investigate the specific roles of MD subpopulations in cognitive function.
Cell type specific MD dysfunction in schizophrenia
The MD has been implicated in the pathogenesis of schizophrenia. Strong evidence for the relationship between the MD and schizophrenia is based on the smaller MD volume in patients with schizophrenia (Young et al., 2000). Despite controversy regarding volumetric MD reduction in schizophrenia due to technical limitations (Cullen et al., 2003; Young et al., 2000), a recent study using high-resolution MRI analysis of a large sample provided support for smaller MD volume in patients with schizophrenia (Pergola et al., 2017). Several neuroimaging studies have reported disruption of the MD-PFC neural circuit in patients with schizophrenia (Anticevic et al., 2014; Giraldo-Chica et al., 2017). In addition, a previous study demonstrated that decreased neuronal activity in the MD disrupted the MD-PFC circuit and cognition in mice (Parnaudeau et al., 2013). These results strongly suggest that the MD-PFC circuit contributes to cognitive symptoms in schizophrenia.
Several risk genes for schizophrenia have been identified in schizophrenia models as pathogenic mechanisms underpinning schizophrenia, such as 22q11.2 deletion syndrome (22q11DS). This syndrome results from the hemizygous deletion of a part of human chromosome 22, a genomic locus is conserved in the mouse genome. Therefore, a mouse model (Df(16)1/+) carrying this genomic deletion has been established (Lindsay et al., 1999), which strongly supports the presence of genetic risk factors for schizophrenia. For example, in this schizophrenia model, Dgcr8 disruption, which controls miRNA biogenesis, induced behavioral abnormalities similar to those in schizophrenia (Stark et al., 2008). Although Dgcr8 is ubiquitously expressed, the thalamus-specific Dgcr8 deletion identified in 22q11DS disrupted the thalamus-amygdala neural circuit and fear memory (Eom et al., 2017). In addition, several risk genes from schizophrenia Genome Wide Association Study (GWAS) data show the expression in marmoset MD (PAK6 in Group 2 and ATP2A2, CACNA1C, CNTNAP4, DGKZ, NLGN4X, SNAP91, SRPK2 and SYNGAP1 in Group 5 of Table 2).
In the present study, we established an MDm-Cre mouse line, Tacr3Cre (Fig. 2). A Tacr3Cre mouse line in combination with a floxed mouse line with schizophrenia risk genes (MD-specific conditional knockout mouse of risk genes) may reveal the sufficiency of MD-specific gene ablation to disrupt the MD-mPFC neural circuits responsible for the behavioral impairments observed in schizophrenia. As described above (Parnaudeau et al., 2013), it will also be useful to investigate the involvement of MD neuronal activity in cognitive function using MD-Cre mouse lines combined with manipulation of neuronal activity. These specific analyses of MD-PFC circuits will provide novel insights into the pathogenesis of schizophrenia.
This is the first report revealing the detailed molecular organization of MD subdivisions in mice and marmosets. These molecular markers allowed us to analyze subdivision-specific circuits and functions by means of transgenic mouse model. Moreover, a subdivision-specific promotor AAV line will help us understand primate MD subdivision-specific circuit formation and function in non-human primates. In the future, these technologies can provide further insights into species-specific MD function and dysfunction.
Acknowledgments
We thank the members of the Shimogori lab for their technical support. We thank the Laboratory for Animal Resources and Genetic Engineering (RIKEN Center for Biosystems Research) for Tacr3-IRES-Cre mice and Dr. Zhuang for SERTCre knock-in mice. We thank Dr. Thomas McHugh for pAAV-EF1a-DIO-EYFP plasmid. We would like to thank Editage (www.editage.com) for English language editing. This work was supported by the RIKEN Center for Brain Science, Brain Mapping by Integrated Neurotechnologies for Disease Studies (Brain/MINDS) project from the Japan Agency for Medical Research and Development (JP20dm0207001) and, in part, by the National Institutes of Health grants (U01MH124619).
Footnotes
DECLARATION OF INTERESTS
The authors declare no competing financial interests.
References
- Alcaraz F, Marchand AR, Courtand G, Coutureau E, & Wolff M (2016). Parallel inputs from the mediodorsal thalamus to the prefrontal cortex in the rat. Eur J Neurosci, 44(3), 1972–1986. doi: 10.1111/ejn.13316 [DOI] [PubMed] [Google Scholar]
- Anastasiades PG, Collins DP, & Carter AG (2021). Mediodorsal and Ventromedial Thalamus Engage Distinct L1 Circuits in the Prefrontal Cortex. Neuron, 109(2), 314–330 e314. doi: 10.1016/j.neuron.2020.10.031 [DOI] [PMC free article] [PubMed] [Google Scholar]
- Anticevic A, Cole MW, Repovs G, Murray JD, Brumbaugh MS, Winkler AM, Savic A, Krystal JH, Pearlson GD, & Glahn DC (2014). Characterizing thalamo-cortical disturbances in schizophrenia and bipolar illness. Cereb Cortex, 24(12), 3116–3130. doi: 10.1093/cercor/bht165 [DOI] [PMC free article] [PubMed] [Google Scholar]
- Bailey KR, & Mair RG (2005). Lesions of specific and nonspecific thalamic nuclei affect prefrontal cortex-dependent aspects of spatial working memory. Behav Neurosci, 119(2), 410–419. doi: 10.1037/0735-7044.119.2.410 [DOI] [PubMed] [Google Scholar]
- Barbas H, Henion TH, & Dermon CR (1991). Diverse thalamic projections to the prefrontal cortex in the rhesus monkey. J Comp Neurol, 313(1), 65–94. doi: 10.1002/cne.903130106 [DOI] [PubMed] [Google Scholar]
- Baxter MG, Browning PG, & Mitchell AS (2008). Perseverative interference with object-in-place scene learning in rhesus monkeys with bilateral ablation of ventrolateral prefrontal cortex. Learn Mem, 15(3), 126–132. doi: 10.1101/lm.804508 [DOI] [PMC free article] [PubMed] [Google Scholar]
- Baxter MG, Gaffan D, Kyriazis DA, & Mitchell AS (2007). Orbital prefrontal cortex is required for object-in-place scene memory but not performance of a strategy implementation task. J Neurosci, 27(42), 11327–11333. doi: 10.1523/JNEUROSCI.3369-07.2007 [DOI] [PMC free article] [PubMed] [Google Scholar]
- Baxter MG, Gaffan D, Kyriazis DA, & Mitchell AS (2008). Dorsolateral prefrontal lesions do not impair tests of scene learning and decision-making that require frontal-temporal interaction. Eur J Neurosci, 28(3), 491–499. doi: 10.1111/j.1460-9568.2008.06353.x [DOI] [PMC free article] [PubMed] [Google Scholar]
- Block AE, Dhanji H, Thompson-Tardif SF, & Floresco SB (2007). Thalamic-prefrontal cortical-ventral striatal circuitry mediates dissociable components of strategy set shifting. Cereb Cortex, 17(7), 1625–1636. doi: 10.1093/cercor/bhl073 [DOI] [PubMed] [Google Scholar]
- Bolkan SS, Stujenske JM, Parnaudeau S, Spellman TJ, Rauffenbart C, Abbas AI, Harris AZ, Gordon JA, & Kellendonk C (2017). Thalamic projections sustain prefrontal activity during working memory maintenance. Nat Neurosci, 20(7), 987–996. doi: 10.1038/nn.4568 [DOI] [PMC free article] [PubMed] [Google Scholar]
- Chudasama Y, Bussey TJ, & Muir JL (2001). Effects of selective thalamic and prelimbic cortex lesions on two types of visual discrimination and reversal learning. Eur J Neurosci, 14(6), 1009–1020. doi: 10.1046/j.0953-816x.2001.01607.x [DOI] [PubMed] [Google Scholar]
- Cullen TJ, Walker MA, Parkinson N, Craven R, Crow TJ, Esiri MM, & Harrison PJ (2003). A postmortem study of the mediodorsal nucleus of the thalamus in schizophrenia. Schizophr Res, 60(2–3), 157–166. doi: 10.1016/s0920-9964(02)00297-9 [DOI] [PubMed] [Google Scholar]
- Delevich K, Tucciarone J, Huang ZJ, & Li B (2015). The mediodorsal thalamus drives feedforward inhibition in the anterior cingulate cortex via parvalbumin interneurons. J Neurosci, 35(14), 5743–5753. doi: 10.1523/JNEUROSCI.4565-14.2015 [DOI] [PMC free article] [PubMed] [Google Scholar]
- Deschenes M, Bourassa J, & Parent A (1995). Two different types of thalamic fibers innervate the rat striatum. Brain Res, 701(1–2), 288–292. doi: 10.1016/0006-8993(95)01124-3 [DOI] [PubMed] [Google Scholar]
- Elena Erro M, Lanciego JL, & Gimenez-Amaya JM (2002). Re-examination of the thalamostriatal projections in the rat with retrograde tracers. Neurosci Res, 42(1), 45–55. doi: 10.1016/s0168-0102(01)00302-9 [DOI] [PubMed] [Google Scholar]
- Eom TY, Bayazitov IT, Anderson K, Yu J, & Zakharenko SS (2017). Schizophrenia-Related Microdeletion Impairs Emotional Memory through MicroRNA-Dependent Disruption of Thalamic Inputs to the Amygdala. Cell Rep, 19(8), 1532–1544. doi: 10.1016/j.celrep.2017.05.002 [DOI] [PMC free article] [PubMed] [Google Scholar]
- Floresco SB, Braaksma DN, & Phillips AG (1999). Thalamic-cortical-striatal circuitry subserves working memory during delayed responding on a radial arm maze. J Neurosci, 19(24), 11061–11071. [DOI] [PMC free article] [PubMed] [Google Scholar]
- Gaffan D, & Parker A (2000). Mediodorsal thalamic function in scene memory in rhesus monkeys. Brain, 123 (Pt 4), 816–827. doi: 10.1093/brain/123.4.816 [DOI] [PubMed] [Google Scholar]
- Giguere M, & Goldman-Rakic PS (1988). Mediodorsal nucleus: areal, laminar, and tangential distribution of afferents and efferents in the frontal lobe of rhesus monkeys. J Comp Neurol, 277(2), 195–213. doi: 10.1002/cne.902770204 [DOI] [PubMed] [Google Scholar]
- Giraldo-Chica M, & Woodward ND (2017). Review of thalamocortical resting-state fMRI studies in schizophrenia. Schizophr Res, 180, 58–63. doi: 10.1016/j.schres.2016.08.005 [DOI] [PMC free article] [PubMed] [Google Scholar]
- Goldman-Rakic PS, & Porrino LJ (1985). The primate mediodorsal (MD) nucleus and its projection to the frontal lobe. J Comp Neurol, 242(4), 535–560. doi: 10.1002/cne.902420406 [DOI] [PubMed] [Google Scholar]
- Grove EA, Tole S, Limon J, Yip L, & Ragsdale CW (1998). The hem of the embryonic cerebral cortex is defined by the expression of multiple Wnt genes and is compromised in Gli3-deficient mice. Development, 125(12), 2315–2325. [DOI] [PubMed] [Google Scholar]
- Hunt PR, & Aggleton JP (1998a). An examination of the spatial working memory deficit following neurotoxic medial dorsal thalamic lesions in rats. Behav Brain Res, 97(1–2), 129–141. doi: 10.1016/s0166-4328(98)00033-3 [DOI] [PubMed] [Google Scholar]
- Hunt PR, & Aggleton JP (1998b). Neurotoxic lesions of the dorsomedial thalamus impair the acquisition but not the performance of delayed matching to place by rats: a deficit in shifting response rules. J Neurosci, 18(23), 10045–10052. [DOI] [PMC free article] [PubMed] [Google Scholar]
- Jones EG (2007). The thalamus (2nd ed.). Cambridge; New York: Cambridge University Press. [Google Scholar]
- Kahn JB, Ward RD, Kahn LW, Rudy NM, Kandel ER, Balsam PD, & Simpson EH (2012). Medial prefrontal lesions in mice impair sustained attention but spare maintenance of information in working memory. Learn Mem, 19(11), 513–517. doi: 10.1101/lm.026302.112 [DOI] [PMC free article] [PubMed] [Google Scholar]
- Kinoshita N, Huang AJY, McHugh TJ, Suzuki SC, Masai I, Kim IH, Soderling SH, Miyawaki A, & Shimogori T (2019). Genetically Encoded Fluorescent Indicator GRAPHIC Delineates Intercellular Connections. iScience, 15, 28–38. doi: 10.1016/j.isci.2019.04.013 [DOI] [PMC free article] [PubMed] [Google Scholar]
- Kita Y, Nishibe H, Wang Y, Hashikawa T, Kikuchi SS, U M, Yoshida AC, Yoshida C, Kawase T, Ishii S, Skibbe H, & Shimogori T (2021). Cellular-resolution gene expression profiling in the neonatal marmoset brain reveals dynamic species- and region-specific differences. Proc Natl Acad Sci U S A, 118(18). doi: 10.1073/pnas.2020125118 [DOI] [PMC free article] [PubMed] [Google Scholar]
- Krettek JE, & Price JL (1977). The cortical projections of the mediodorsal nucleus and adjacent thalamic nuclei in the rat. J Comp Neurol, 171(2), 157–191. doi: 10.1002/cne.901710204 [DOI] [PubMed] [Google Scholar]
- Kuramoto E, Pan S, Furuta T, Tanaka YR, Iwai H, Yamanaka A, Ohno S, Kaneko T, Goto T, & Hioki H (2017). Individual mediodorsal thalamic neurons project to multiple areas of the rat prefrontal cortex: A single neuron-tracing study using virus vectors. J Comp Neurol, 525(1), 166–185. doi: 10.1002/cne.24054 [DOI] [PubMed] [Google Scholar]
- Kuroda M, Yokofujita J, & Murakami K (1998). An ultrastructural study of the neural circuit between the prefrontal cortex and the mediodorsal nucleus of the thalamus. Prog Neurobiol, 54(4), 417–458. doi: 10.1016/s0301-0082(97)00070-1 [DOI] [PubMed] [Google Scholar]
- Lein ES, Hawrylycz MJ, Ao N, Ayres M, Bensinger A, Bernard A, Boe AF, Boguski MS, Brockway KS, Byrnes EJ, Chen L, Chen L, Chen TM, Chin MC, Chong J, Crook BE, Czaplinska A, Dang CN, Datta S, Dee NR, Desaki AL, Desta T, Diep E, Dolbeare TA, Donelan MJ, Dong HW, Dougherty JG, Duncan BJ, Ebbert AJ, Eichele G, Estin LK, Faber C, Facer BA, Fields R, Fischer SR, Fliss TP, Frensley C, Gates SN, Glattfelder KJ, Halverson KR, Hart MR, Hohmann JG, Howell MP, Jeung DP, Johnson RA, Karr PT, Kawal R, Kidney JM, Knapik RH, Kuan CL, Lake JH, Laramee AR, Larsen KD, Lau C, Lemon TA, Liang AJ, Liu Y, Luong LT, Michaels J, Morgan JJ, Morgan RJ, Mortrud MT, Mosqueda NF, Ng LL, Ng R, Orta GJ, Overly CC, Pak TH, Parry SE, Pathak SD, Pearson OC, Puchalski RB, Riley ZL, Rockett HR, Rowland SA, Royall JJ, Ruiz MJ, Sarno NR, Schaffnit K, Shapovalova NV, Sivisay T, Slaughterbeck CR, Smith SC, Smith KA, Smith BI, Sodt AJ, Stewart NN, Stumpf KR, Sunkin SM, Sutram M, Tam A, Teemer CD, Thaller C, Thompson CL, Varnam LR, Visel A, Whitlock RM, Wohnoutka PE, Wolkey CK, Wong VY, Wood M, Yaylaoglu MB, Young RC, Youngstrom BL, Yuan XF, Zhang B, Zwingman TA, & Jones AR (2007). Genome-wide atlas of gene expression in the adult mouse brain. Nature, 445(7124), 168–176. doi: 10.1038/nature05453 [DOI] [PubMed] [Google Scholar]
- Lindsay EA, Botta A, Jurecic V, Carattini-Rivera S, Cheah YC, Rosenblatt HM, Bradley A, & Baldini A (1999). Congenital heart disease in mice deficient for the DiGeorge syndrome region. Nature, 401(6751), 379–383. doi: 10.1038/43900 [DOI] [PubMed] [Google Scholar]
- M’Harzi M, Jarrard LE, Willig F, Palacios A, & Delacour J (1991). Selective fimbria and thalamic lesions differentially impair forms of working memory in rats. Behav Neural Biol, 56(3), 221–239. doi: 10.1016/0163-1047(91)90364-v [DOI] [PubMed] [Google Scholar]
- Madisen L, Zwingman TA, Sunkin SM, Oh SW, Zariwala HA, Gu H, Ng LL, Palmiter RD, Hawrylycz MJ, Jones AR, Lein ES, & Zeng H (2010). A robust and high-throughput Cre reporting and characterization system for the whole mouse brain. Nat Neurosci, 13(1), 133–140. doi: 10.1038/nn.2467 [DOI] [PMC free article] [PubMed] [Google Scholar]
- Mashiko H, Yoshida AC, Kikuchi SS, Niimi K, Takahashi E, Aruga J, Okano H, & Shimogori T (2012). Comparative anatomy of marmoset and mouse cortex from genomic expression. J Neurosci, 32(15), 5039–5053. doi: 10.1523/JNEUROSCI.4788-11.2012 [DOI] [PMC free article] [PubMed] [Google Scholar]
- Mitchell AS (2015). The mediodorsal thalamus as a higher order thalamic relay nucleus important for learning and decision-making. Neurosci Biobehav Rev, 54, 76–88. doi: 10.1016/j.neubiorev.2015.03.001 [DOI] [PubMed] [Google Scholar]
- Mitchell AS, Baxter MG, & Gaffan D (2007). Dissociable performance on scene learning and strategy implementation after lesions to magnocellular mediodorsal thalamic nucleus. J Neurosci, 27(44), 11888–11895. doi: 10.1523/JNEUROSCI.1835-07.2007 [DOI] [PMC free article] [PubMed] [Google Scholar]
- Mitchell AS, & Chakraborty S (2013). What does the mediodorsal thalamus do? Front Syst Neurosci, 7, 37. doi: 10.3389/fnsys.2013.00037 [DOI] [PMC free article] [PubMed] [Google Scholar]
- Morecraft RJ, Geula C, & Mesulam MM (1992). Cytoarchitecture and neural afferents of orbitofrontal cortex in the brain of the monkey. J Comp Neurol, 323(3), 341–358. doi: 10.1002/cne.903230304 [DOI] [PubMed] [Google Scholar]
- Murphy MJM, & Deutch AY (2018). Organization of afferents to the orbitofrontal cortex in the rat. J Comp Neurol, 526(9), 1498–1526. doi: 10.1002/cne.24424 [DOI] [PMC free article] [PubMed] [Google Scholar]
- Narboux-Neme N, Pavone LM, Avallone L, Zhuang X, & Gaspar P (2008). Serotonin transporter transgenic (SERTcre) mouse line reveals developmental targets of serotonin specific reuptake inhibitors (SSRIs). Neuropharmacology, 55(6), 994–1005. doi: 10.1016/j.neuropharm.2008.08.020 [DOI] [PubMed] [Google Scholar]
- Okano H (2021). Current Status of and Perspectives on the Application of Marmosets in Neurobiology. Annual Review of Neuroscience, 44. [DOI] [PubMed] [Google Scholar]
- Ongur D, & Price JL (2000). The organization of networks within the orbital and medial prefrontal cortex of rats, monkeys and humans. Cereb Cortex, 10(3), 206–219. doi: 10.1093/cercor/10.3.206 [DOI] [PubMed] [Google Scholar]
- Parker A, & Gaffan D (1998). Interaction of frontal and perirhinal cortices in visual object recognition memory in monkeys. Eur J Neurosci, 10(10), 3044–3057. doi: 10.1046/j.1460-9568.1998.00306.x [DOI] [PubMed] [Google Scholar]
- Parnaudeau S, Bolkan SS, & Kellendonk C (2018). The Mediodorsal Thalamus: An Essential Partner of the Prefrontal Cortex for Cognition. Biol Psychiatry, 83(8), 648–656. doi: 10.1016/j.biopsych.2017.11.008 [DOI] [PMC free article] [PubMed] [Google Scholar]
- Parnaudeau S, O’Neill PK, Bolkan SS, Ward RD, Abbas AI, Roth BL, Balsam PD, Gordon JA, & Kellendonk C (2013). Inhibition of mediodorsal thalamus disrupts thalamofrontal connectivity and cognition. Neuron, 77(6), 1151–1162. doi: 10.1016/j.neuron.2013.01.038 [DOI] [PMC free article] [PubMed] [Google Scholar]
- Paxinos G, Watson C, Petrides M, Rosa M, & Tokuno H (2012). The marmoset brain in stereotaxic coordinates: Elsevier Academic Press. [Google Scholar]
- Pergola G, Trizio S, Di Carlo P, Taurisano P, Mancini M, Amoroso N, Nettis MA, Andriola I, Caforio G, Popolizio T, Rampino A, Di Giorgio A, Bertolino A, & Blasi G (2017). Grey matter volume patterns in thalamic nuclei are associated with familial risk for schizophrenia. Schizophr Res, 180, 13–20. doi: 10.1016/j.schres.2016.07.005 [DOI] [PubMed] [Google Scholar]
- Phillips JW, Schulmann A, Hara E, Winnubst J, Liu C, Valakh V, Wang L, Shields BC, Korff W, Chandrashekar J, Lemire AL, Mensh B, Dudman JT, Nelson SB, & Hantman AW (2019). A repeated molecular architecture across thalamic pathways. Nat Neurosci, 22(11), 1925–1935. doi: 10.1038/s41593-019-0483-3 [DOI] [PMC free article] [PubMed] [Google Scholar]
- Ray JP, & Price JL (1993). The Organization of Projections from the Mediodorsal Nucleus of the Thalamus to Orbital and Medial Prefrontal Cortex in Macaque Monkeys. Journal of Comparative Neurology, 337(1), 1–31. doi:DOI 10.1002/cne.903370102 [DOI] [PubMed] [Google Scholar]
- Schaeffer DJ, Hori Y, Gilbert KM, Gati JS, Menon RS, & Everling S (2020). Divergence of rodent and primate medial frontal cortex functional connectivity. Proc Natl Acad Sci U S A, 117(35), 21681–21689. doi: 10.1073/pnas.2003181117 [DOI] [PMC free article] [PubMed] [Google Scholar]
- Shimogori T, Abe A, Go Y, Hashikawa T, Kishi N, Kikuchi SS, Kita Y, Niimi K, Nishibe H, Okuno M, Saga K, Sakurai M, Sato M, Serizawa T, Suzuki S, Takahashi E, Tanaka M, Tatsumoto S, Toki M, Mami U, Wang Y, Windak KJ, Yamagishi H, Yamashita K, Yoda T, Yoshida AC, Yoshida C, Yoshimoto T, & Okano H (2018). Digital gene atlas of neonate common marmoset brain. Neuroscience Research, 128, 1–13. doi: 10.1016/j.neures.2017.10.009 [DOI] [PubMed] [Google Scholar]
- Soiza-Reilly M, Meye FJ, Olusakin J, Telley L, Petit E, Chen X, Mameli M, Jabaudon D, Sze JY, & Gaspar P (2019). SSRIs target prefrontal to raphe circuits during development modulating synaptic connectivity and emotional behavior. Mol Psychiatry, 24(5), 726–745. doi: 10.1038/s41380-018-0260-9 [DOI] [PMC free article] [PubMed] [Google Scholar]
- Stark KL, Xu B, Bagchi A, Lai WS, Liu H, Hsu R, Wan X, Pavlidis P, Mills AA, Karayiorgou M, & Gogos JA (2008). Altered brain microRNA biogenesis contributes to phenotypic deficits in a 22q11-deletion mouse model. Nat Genet, 40(6), 751–760. doi: 10.1038/ng.138 [DOI] [PubMed] [Google Scholar]
- Stokes KA, & Best PJ (1990a). Mediodorsal thalamic lesions impair “reference” and “working” memory in rats. Physiol Behav, 47(3), 471–476. doi: 10.1016/0031-9384(90)90111-g [DOI] [PubMed] [Google Scholar]
- Stokes KA, & Best PJ (1990b). Response biases do not underlie the radial maze deficit in rats with mediodorsal thalamus lesions. Behav Neural Biol, 53(3), 334–345. doi: 10.1016/0163-1047(90)90198-f [DOI] [PubMed] [Google Scholar]
- Van Eden CG (1986). Development of connections between the mediodorsal nucleus of the thalamus and the prefrontal cortex in the rat. J Comp Neurol, 244(3), 349–359. doi: 10.1002/cne.902440307 [DOI] [PubMed] [Google Scholar]
- Winnubst J, Bas E, Ferreira TA, Wu Z, Economo MN, Edson P, Arthur BJ, Bruns C, Rokicki K, Schauder D, Olbris DJ, Murphy SD, Ackerman DG, Arshadi C, Baldwin P, Blake R, Elsayed A, Hasan M, Ramirez D, Dos Santos B, Weldon M, Zafar A, Dudman JT, Gerfen CR, Hantman AW, Korff W, Sternson SM, Spruston N, Svoboda K, & Chandrashekar J (2019). Reconstruction of 1,000 Projection Neurons Reveals New Cell Types and Organization of Long-Range Connectivity in the Mouse Brain. Cell, 179(1), 268–281 e213. doi: 10.1016/j.cell.2019.07.042 [DOI] [PMC free article] [PubMed] [Google Scholar]
- Young KA, Manaye KF, Liang C, Hicks PB, & German DC (2000). Reduced number of mediodorsal and anterior thalamic neurons in schizophrenia. Biol Psychiatry, 47(11), 944–953. doi: 10.1016/s0006-3223(00)00826-x [DOI] [PubMed] [Google Scholar]
- Zhuang X, Masson J, Gingrich JA, Rayport S, & Hen R (2005). Targeted gene expression in dopamine and serotonin neurons of the mouse brain. J Neurosci Methods, 143(1), 27–32. doi: 10.1016/j.jneumeth.2004.09.020 [DOI] [PubMed] [Google Scholar]