In the original article, there was a mistake in the citation as published. In the citation, commas were missing between “He Y-Y and Xie X-M, Xie X-M and Zhang H-D, Zhang H-D and Ye J, Pang X-B and Jing Z-C, Jing Z-C and Yan Y”. The corrected citation should be “He Y-Y, Xie X-M, Zhang H-D, Ye J, Gencer S, van der Vorst EPC, Döring Y, Weber C, Pang X-B, Jing Z-C, Yan Y and Han Z-Y (2021) Identification of Hypoxia Induced Metabolism Associated Genes in Pulmonary Hypertension. Front. Pharmacol. 12:753727. doi:10.3389/fphar.2021.753727.”
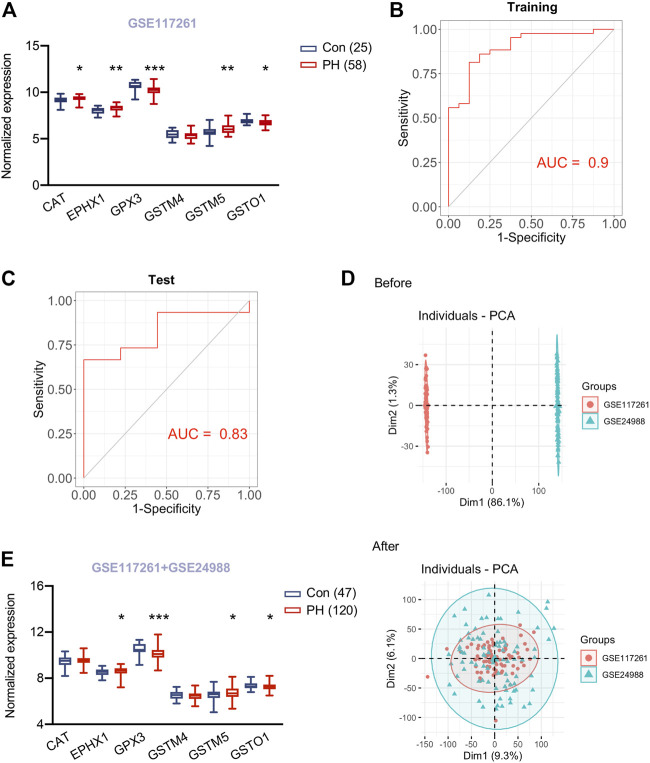
In addition, there was a mistake in Figure 6 as published. The x-axis labels for Figures 6B and 6C were incorrectly labelled as “specficity”. The corrected Figure 6 appears below.
FIGURE 6.
Validation of hub genes in lungs of PH patients and a predicting model for PH. (A) Expression of six hypoxia induced metabolism associated hub genes in lung tissues of 58 patients with pulmonary hypertension (PH) and 25 control subjects from GSE117261. (B) ROC curve analysis of training set (GSE117261) using six hub genes. (C) ROC curve analysis of test set (GSE117261) using six hub genes. (D) PCA analysis demonstrated the distribution of data sets GSE117261 (red) and GSE24988 (green) before (upper panel) and after (lower panel) removal of batch effect. The distribution was visualized in scatter plot. (E) Expression of six hypoxia induced metabolism associated hub genes in lung tissues of 120 patients with pulmonary hypertension (PH) and 47 control subjects from GSE117261 and GSE24988 after correction of batch effect. Data represent mean ± SEM. *p < 0.05, **p < 0.01, ***p < 0.001 compared to corresponding control subjects, as analyzed by unpaired t test or Mann-Whitney U test respectively, as appropriate.
The authors apologize for this error and state that this does not change the scientific conclusions of the article in any way. The original article has been updated.
Publisher’s Note
All claims expressed in this article are solely those of the authors and do not necessarily represent those of their affiliated organizations, or those of the publisher, the editors and the reviewers. Any product that may be evaluated in this article, or claim that may be made by its manufacturer, is not guaranteed or endorsed by the publisher.


