

Abstract
Voltage-gated sodium channels play a vital role in nerve and muscle cells, enabling them to encode and transmit electrical signals. Currently, there exist several classes of drugs that aim to inhibit these channels for therapeutic purposes, including local anesthetics, antiepileptics and antiarrhythmics. However, sodium-channel-inhibiting drugs lack subtype specificity; instead, they inhibit all sodium channels in the human body. Improving understanding of the mechanisms of binding of existing nonselective drugs is important in providing insight into how subtype-selective drugs could be developed. This study used molecular dynamics simulations to investigate the binding of the antiepileptics carbamazepine and lamotrigine and the local anesthetic lidocaine in neutral and charged states to the recently resolved human Nav1.4 channel. Replica exchange solute tempering was used to enable greater sampling of each compound within the pore. It was found that all four compounds show similarities in their binding sites within the pore. However, the positions of the carbamazepine and lamotrigine did not occlude the center of the pore but preferentially bound to homologous domain DII and DIII. The charged and neutral forms of lidocaine positioned themselves more centrally in the pore, with more common interactions with DIV. The best localized binding site was for charged lidocaine, whose aromatic moiety interacted with Y1593, whereas the amine projected toward the selectivity filter. Comparisons with our previous simulations and published structures highlight potential differences between tonic and use-dependent block related to conformational changes occurring in the pore.
Significance
Voltage-gated sodium channels are integral in neuronal signaling, and malfunctions in these channels lead to many nervous system disorders, such as chronic pain and epilepsy. Designing drugs with voltage-gated sodium channel specificity would be invaluable in improving the precision and efficacy of current therapeutic pathways and in the development of new pathways. We have used molecular simulations to determine how antiepileptic and local anesthetic drugs bind to a human neuronal sodium channel. We have determined that the local anesthetic and antiepileptic drugs bind to different subunits of the channel and that this may be influenced by the functional state of the pore, helping explain their differing mode of action.
Introduction
Voltage-gated sodium channels (VGSCs) are transmembrane proteins that open a Na+-selective pore in response to cellular depolarization and play a vital role in encoding and conducting information in both the nervous and muscular systems (1). There are nine different subtypes of sodium channels that have differing tissue localization and biophysical properties, and their dysfunction is implicated in distinct channelopathies, such as epilepsy, cardiac arrhythmias and pain disorders (2). These nine subtypes share the same basic architecture, as confirmed by many recently solved structures (3, 4, 5, 6, 7, 8, 9, 10, 11, 12, 13, 14). They consist of one α- and often at least one auxiliary β-subunit (3). The α-subunit has the crucial role of forming the pore and responding to voltage changes, whereas the β-subunits assist in modulating the function of the pore (15). These α-subunits consist of a single polypeptide with four homologous domains (referred to as DI–IV), which are linked by intracellular loops (1). Each domain possesses six transmembrane helices (known as S1–S6), with helices S1–S4 forming a voltage-sensing domain and the S5 and S6 helices from all four domains forming the pore. A crucial part of the pore is the P-loop that connects segments S5 and S6 in each domain. The four P-loops together form a structure on the extracellular side of the channel known as the selectivity filter (SF), which imparts VGSCs with Na+ ion selectivity (1). The SF contains a “DEKA” motif, comprising four residues that mutagenesis studies have shown are essential for a channel’s Na+ selectivity (1). Within the pore is the central cavity, which is lined by the S6 segments of each domain and is believed to be the primary binding site of clinically used VGSC inhibitors, such as local anesthetics and antiepileptics (1,16). Finally, on the intracellular side of the pore is the activation gate, which opens when the cell transitions from the closed to the open state and occludes ion flow when the channel is closed (1).
Local anesthetics and antiepileptics are two categories of drug that target VGSCs. Both of these compounds work by inhibiting the capacity of VGSCs to conduct sodium currents into the cell, thereby reducing neuronal excitability (1). Local anesthetics display both tonic and use-dependent block (that is, they can enter and block the resting state of the channel [tonic], but they can also enter the pore through the activation gate when the channel is in the open state and preferentially stabilize the inactivated state of the channel to temporarily reduce neuronal firing after an initial impulse [use dependent]). For example, lidocaine has been shown to be able to enter in both ways (17,18). On the other hand, antiepileptics primarily display use-dependent block. Whereas local anesthetics are generally amphiphilic structures, containing an aromatic ring on one end and a protonatable amine on the other, antiepileptics tend to have a more rigid bi- or tricyclic structure with a central polar amide (19). Local anesthetics tend to exist in both a charged and uncharged form at physiological pH, whereas antiepileptics tend to be perpetually neutral. Despite these considerable structural and chemical differences, drugs in both of these classes are believed to bind at similar sites inside the central cavity of the pore (14,20,21) and with similar affinity (22). Although several ideas have been proposed to explain how such different compounds can exhibit similar physiological outcomes, there still remains a great deal of uncertainty (19,23,24). The high sequence similarity in the SF and central cavity-lining S6 segments, where these drugs are believed to bind, makes the development of subtype-specific therapeutics for VGSCs difficult (25). Current VGSC-targeting therapeutics lack subtype specificity and can result in problematic side effects, which lowers the dosage of the drug that is deemed “safe” (26). The development of drugs with specificity for VGSC subtypes could thus provide considerable benefits because it would increase efficacy while reducing side effects (27).
Many previous studies have aimed to tease out the mechanisms of sodium channel inhibitor binding. Mutagenesis studies have revealed residues critical to the binding of both local anesthetics and antiepileptics in the S6 helices of all four domains, with data indicating those in DIII and particularly DIV are most prominent (28). For example, Ragsdale et al. performed an alanine scan of the S6 segment of DIV in the type IIA rat brain VGSC, and identified F1764 (F1586 in human Nav1.4) and Y1771 (Y1593 in human Nav1.4) to be the most important residues in the binding of the local anesthetics etidocaine and lidocaine, as well as antiarrhythmic and anticonvulsant drugs (18,22). Subsequent mutagenesis identified amino acids in the S6 segments of DI, DII, and DIII, which also appear to have substantial involvement in VGSC inhibitor binding (29, 30, 31, 32, 33), as well as an additional residue in DIV. Although some of these mutants suggest virtually no role for residues in segment S6 of DII in drug binding (23), there exists some disagreement (31). Replacement of the lysine in the SF has also been shown to enhance anesthetic binding (34). Molecular modeling studies have supported the involvement of the key phenylalanine and tyrosine residues in DIV in both local anesthetic and antiepileptic binding and have also proposed mechanisms to explain the similar behavior of these drug types inside the pore (19,24,35).
Molecular dynamics (MD) simulations have previously shown that, on account of the charged moieties within the SF, charged local anesthetics tend to have stronger interactions with the SF than do neutral antiepileptics (36). One model suggests that it is the repulsive electrostatic interactions between the local anesthetic’s cationic group pointing up into the SF and Na+ ions attempting to enter the SF that underlies the inhibition of sodium currents by charged VGSC inhibitors. Although this theory may seem to exclude neutral compounds from inhibiting sodium currents by such a mechanism, Tikhonov and Zhorov (24) theorize that in neutral compounds, such as carbamazepine (CBZ), the role of the positive group is played by a sodium ion bound weakly to the neutral compound by an electronegative group. In this context, researchers suggest that charged local anesthetics and neutral antiepileptics in the pore share a common pharmacophore consisting of a cationic moiety that binds in or near the SF separated from an aromatic ring by three intervening atoms (19,24). In this model, both types of drug are held in place by interactions between the key phenylalanine and tyrosine residues in segment S6 of DIV (24). Although a previous molecular modeling study found lamotrigine (LMT) to bind higher in the pore than CBZ in a prokaryotic VGSC, this same study also found that the two compounds still interacted with a similar set of amino acid residues (36). It was thus predicted that the two antiepileptic drugs would bind in similar regions of the pore and interact with a similar set of residues. This is supported by electrophysiological studies that suggest these two compounds bind in a common binding site within the pore (37). Mutagenesis studies have also suggested that the inhibition of VGSCs by both LMT and lidocaine is dependent on a similar set of residues (22,38). This was shown in a 2018 MD study on prokaryotic sodium channels and the (recent at the time) NavPas structure (36). However, these simulations had not been extended to human sodium channels or to a channel in an “inactivated” state.
In this study, we used MD simulations to investigate the binding of three VGSC inhibitors in the recently resolved human VGSC Nav1.4 (5): CBZ, LMT, and lidocaine. Of the three drugs studied, LMT and CBZ are perpetually neutral at physiological pH, whereas lidocaine exists in both a charged and a neutral state at physiological pH. Lidocaine was therefore simulated once as neutral lidocaine (LDN) and once as charged lidocaine (LDC). The Nav1.4 channel structure used in this study (5) was in the inactivated state, to which these drugs are thought to strongly bind (38). Simulations were run with an enhanced sampling method, replica exchange with solute tempering (REST2) (39,40) because this was previously shown to enhance the exploration of drugs within sodium channel pores (36). We found that CBZ and LMT did not occlude the center of the pore but unexpectedly preferred to bind to DII and DIII in some of their poses as well as to residues in DIV. These antiepileptic medications bound to a markedly different place in the pore than the local anesthetic lidocaine. Both forms of lidocaine bound to DIV, with LDC projecting its protonated amine toward the SF as proposed by Buyan et al. (36). Unlike this previous work, however, we find a more significant role for Y1593, potentially because of structural differences between resting and inactivated channels. This suggests a difference in how local anesthetics and antiepileptic drugs interact with different states of sodium channels and sheds more light on the subtle differences between tonic and use-dependent block.
Materials and methods
Simulations
For these simulations, a truncated model based on the human VGSC Nav1.4 in complex with its β1-subunit (PDB: 6AGF) was used (5). This model contained only the pore-forming module of each domain of Nav1.4 (residue index ranges: DI, 234–286 and 336–451; DII, 683–805; DIII, 1143–1298; and DIV, 1464–1601). The structure utilized in this study is likely in an inactivated state and, although the structure initially had its activation gate held open with a digitonin molecule, the gate closed during the equilibration phase of the simulation in which no detergent molecule was present. The protein was aligned along the z-axis and placed into a lipid bilayer of pure 1-palmitoyl-2-oleoyl-sn-glycero-3-phosphocholine, with xy dimensions 95.5 Å × 95.5 Å. The system was solvated in a rectangular prism, with a z-axis length of 117.2 Å. The CHARMM36m force field and TIP3P water model was employed, and Lennard-Jones parameters from Joung and Cheatum (41) were utilized for the ions. Full details of the rest of the setup parameters, including equilibration, are in (42). REST2 simulations (39,40) were performed on the system using a REST2 patch (39) in NAMD 2.10. Restraints of 0.1 kcal/molÅ−2 were added onto select atoms on each S5 helix to limit translational diffusion of the channel around the bilayer. Each drug was constrained within the pore by a spherical potential with a radius of 37 Å from the pore center and a force constant of 20 kcal/molÅ−2. In all of the systems, 26 replicas were used because this was the number of replicas predicted for the system by a temperature generator for replica exchange molecular dynamics (REMD) simulations (43) (folding.bmc.uu.se/remd). Only the protein and the drug are the “hot” parts of the system, whereas the rest of the system remains “cold.” For these simulations, a temperature range of 310–410 K was used, and exchanges were attempted every 2 ps, yielding an exchange rate of ∼0.3. The simulation was run for 100 ns using 2-fs timesteps, with bonds to hydrogen atoms kept rigid in an NPT ensemble at a pressure of 1 atm maintained by a Langevin barostat, and the Langevin thermostat was used to control temperature. Long range electrostatics were calculated using the Particle Mesh Ewald (PME) scheme (44) with a 1-Å grid spacing, whereas van der Waals interactions used a 12-Å cutoff and the Langevin thermostat was used. Force field parameters for the four compounds investigated in this study were taken from Buyan et al. (36).
Analysis
Low temperature trajectories were reconstructed using an in-house Python script. Simulation snapshots were saved every 20 ps and used in locally written scripts to generate free energy landscapes for the drug in the pore directly from the probability density. For each compound, a cluster analysis was performed with the quality threshold algorithm, using every fourth snapshot to distinguish different binding positions that the drugs occupy. Using the measure cluster tool within Visual Molecular Dynamics (VMD) (45), 10 clusters were generated for each drug, using a Root Mean Square Deviation (RMSD) cutoff of 2.5 Å. The average interaction energy of each residue in the SF and S6 of DI–IV, with the top four clusters from each compound in the study, was calculated using the NAMD Energy plugin in VMD (45). VMD was used to create images of the simulations (45). To determine how much the choice of cutoff influences the nature of the drug clusters, we repeated the analysis using cut-offs of 0.5, 1.5, and 3.5 Å. The similarity of the drug poses for the top clusters shown in Figs. S1–S5 indicates that the locations are not significantly affected by cutoff choice. An examination of the clustering tendency of the drug poses in the pore for each cutoff is shown in Figs. S1–S5. To help determine how distinct the clusters are from one another, the similarity of the per residue interaction energies of each cluster is given in Tables S1–S4, as determined by the correlation coefficient of the per residue interaction strengths.
Results
Neutral compounds prefer DII-DIII, whereas LDC prefers DIV
Free energy landscapes were calculated from the REST2 simulations to determine regions where the compounds preferentially bound in the pore. Cluster analysis, in which drug positions were grouped into the most commonly occupied poses, was also performed to gain a more detailed understanding of each compounds’ behavior inside the pore. Ten clusters were determined for each drug; however, the number of frames assigned to each cluster varied considerably between the compounds (Table 1).
Table 1.
The distribution of the 12,500 frames for each compound across the clusters
| Molecule | Cluster (%) |
||||||||||
|---|---|---|---|---|---|---|---|---|---|---|---|
| 1 | 2 | 3 | 4 | 5 | 6 | 7 | 8 | 9 | 10 | LO | |
| CBZ | 18.7 | 8.97 | 7.6 | 6.30 | 4.90 | 4.88 | 3.42 | 2.57 | 2.47 | 2.13 | 38.0 |
| LMT | 13.1 | 9.63 | 7.86 | 7.18 | 4.60 | 4.03 | 3.57 | 3.03 | 2.86 | 2.25 | 41.9 |
| LDN | 10.8 | 6.78 | 4.91 | 4.71 | 3.34 | 2.77 | 2.77 | 2.29 | 2.18 | 1.98 | 57.5 |
| LDC | 18.4 | 8.93 | 8.30 | 7.34 | 6.55 | 4.59 | 3.39 | 3.22 | 2.38 | 2.35 | 34.5 |
LO, leftover frames not belonging to any cluster.
All of the compounds studied had their lowest energy sites near the center of the pore, ∼10 Å below the SF (Figs. 1, 2, 3, and 4), and were seen to enter the DI–DII fenestration. Interestingly, the two antiepileptic medications (CBZ and LMT, Figs. 1 and 2, respectively), occupied regions on the DII-DIII side of the pore, whereas LDN and LDC were more centrally located in the pore, with stronger interactions with DIV. The results reinforce that it is not just residues in DIV that can stabilize binding (29, 30, 31, 32, 33, 34), despite those being most commonly discussed in previous studies (18,22,29, 30, 31,36,46).
Figure 1.

Free energy landscapes of the center of mass of CBZ visualized from the top of the sodium channel (A) and the side (B). To the right of the energy landscapes in (A) and (B) are representative images of the top four clusters imaged from the same orientation, with the boundaries of the free energy plot noted by the box. Free energies are in units of kcal /mol. Each domain of the protein is shown in a different shade of gray, with DI represented in white and DII–DIV represented in progressively darker shades of gray. CBZ is shown in licorice, with the top binding pose in the lightest color and the other binding poses in darker colors in descending order of prevalence. To see this figure in color, go online.
Figure 2.

Free energy landscapes of the center of mass of LMT visualized from the top of the sodium channel (A) and the side (B). To the right of the energy landscapes in (A) and (B) are representative images of the top four clusters imaged from the same orientation, with the boundaries of the free energy plot noted by the box. Free energies are in kilocalories per mole. Each domain of the protein is shown in a different shade of gray, with DI represented in white and DII–DIV represented in progressively darker shades of gray. LMT is shown in licorice, with the top cluster/binding pose in the lightest color and the other binding poses in darker colors in descending order of prevalence. To see this figure in color, go online.
Figure 3.

Free energy landscapes of the center of mass of LDN visualized from the top of the sodium channel (A) and the side (B). To the right of the energy landscapes in (A) and (B) are representative images of the top four clusters imaged from the same orientation, with the boundaries of the free energy plot noted by the box. Free energies are in kilocalories per mole. Each domain of the protein is shown in a different shade of gray, with DI represented in white and DII–DIV represented in progressively darker shades of gray. LDN is shown in licorice, with the top cluster/binding pose in the lightest color and the other binding poses in darker colors in descending order of prevalence. To see this figure in color, go online.
Figure 4.

Free energy landscapes of the center of mass of LDC visualized from the top of the sodium channel (A) and the side (B). To the right of the energy landscapes in (A) and (B) are representative images of the top four clusters imaged from the same orientation, with the boundaries of the free energy plot noted by the box. Free energies are in kilocalories per mole. Each domain of the protein is shown in a different shade of gray, with DI represented in white and DII–DIV represented in progressively darker shades of gray. LDC is shown in licorice, with the top cluster/binding pose in the lightest color and the other binding poses in darker colors in descending order of prevalence. To see this figure in color, go online.
Of the two antiepileptic compounds studied, CBZ has better defined binding sites. The first low-energy site of CBZ had a position close to the fenestration between DII and DIII (Fig. 1, A and B) and the S6 helix, directly under the pore helix forming the SF. This site represents the top two clusters (which make up ∼32% of the total simulation frames) and is strongly associated with the DII-DIII side of the pore. In addition, the carboxyl and amine group of CBZ is pointing up toward the SF, which is similar to previously published docking results from Tikhonov and Zhorov (24). However, Tikhonov and Zhorov predicted that CBZ would be interacting primarily with DIV (24), whereas our results predict that it would primarily bind to DII and DIII. The other low-energy site for CBZ was found to be closer to the pore axis but nearer the activation gate, where it interacts more strongly with DIV. This spot on the energy landscape is where clusters 3 and 4 are localized and makes up ∼14% of the simulation frames.
LMT was found to have more diffuse binding sites, exploring multiple places inside of the pore (Fig. 2 B). LMT’s top four clusters show the greatest diversity in their localization and orientation within the pore of all the compounds studied, with little overlap between the clusters (Fig. 2), consistent with the energy landscapes. Despite this, there are at least two energy minima of note. One of these (cluster 3) is analogous to the CBZ binding site near the SF and is strongly associated with the DIII-DIV side of the pore, whereas CBZ prefers to reside between DII-DIII. LMT’s second “binding site” is more diffuse, essentially a collection of sub-binding sites corresponding to clusters 1, 2, and 4 in Table 1 (occurring between an x or radial position of −5 and 5 Å and an axial position between −10 and −15 Å). The top cluster was mainly localized to the DI-DII side of the pore, whereas clusters 2 and 4 were more centrally located.
The differences between lidocaine and the two antiepileptic medications are noticeable, with LDN preferring to remain in the center of the pore (Fig. 3). In support of this, the four most populous clusters of LDC, which contain 43% of the total frames from the simulation, show considerable similarity in their localization (Fig. 4). The tail part of the molecule of LDN cluster 2 was oriented in a different direction to those of clusters 1 and 4, suggesting different residues could contribute to the same central location. In contrast to the central localization of the other clusters for this compound, LDN cluster 3 displayed a strong association with the DI-DII side of the pore. LDN is also seen to commonly penetrate into the fenestration between DI and DII.
The differences between the neutral and charged forms of lidocaine are subtle yet distinct. When the amine of lidocaine was neutral, it remained in the center of the pore, further from the SF (Figs. 3 and 5). In contrast, the charged amine preferred to occupy the center of the pore directly below the SF (Figs. 4 and 5). The benzene rings of the top cluster of LDN and that of LDC occupy approximately the same position and both are oriented facing DIV. The neutral amine of LDN cluster 1 is oriented toward the DII-DIII wall of the channel and overlaps with the rings of CBZ, whereas the charged amine of the top cluster of LDC is oriented upwards into the SF (Fig. 4 A). LDC is also seen entering the DI-DII fenestration. That the protonated amine pointed up toward the SF in all our top clusters, which did not occur in the neutral system, is in agreement with our previous predictions (36) and later structures of lidocaine in a bacterial channel (21).
Figure 5.

Free energy landscapes of the center of mass of the amine in LDN (A) and LDC (B). The top graphs show the pore from the same orientation as the top energy landscapes in Figs. 1, 2, 3, and 4 (top). The bottom graphs show the pore from the same orientation as the bottom energy landscapes in Figs. 1, 2, 3, and 4 (bottom). To see this figure in color, go online.
In summary, it was found that the top clusters of LDN and LDC appear to occupy more central regions of the pore than the top clusters of CBZ and LMT, which associate with the DII-DIII and DI-DII sides of the pore, respectively. LDC has the most clearly defined binding site, with the protonated amine pointing toward the SF.
Identifying residues involved in inhibitor binding
To identify the most important residues involved in drug binding, we quantified the drug-residue interaction energies for the top four clusters. The results of the interaction energy analysis reinforce the trends seen in the localization of the different clusters within the pore (Fig. 5).
All significant favorable drug-protein interactions between Nav1.4 and the top two clusters of CBZ occurred in DII and DIII (Figs. 1 and 6 A), and the residues V793, F797, F1243, F1284, and L1287 are important in these clusters’ binding (Fig. 6). Interestingly, in almost all of the clusters, Q405 had a large repulsive force on it, suggesting that this glutamine attracts or repels different compounds from the SF. Whereas clusters 3 and 4 had a residue in common with clusters 1 and 2 (F797), the residues most likely to interact with these clusters were L794, K1244, F1586, and Y1593, suggesting a greater interaction with DIV, more along the lines of the “classic” binding pose.
Figure 6.

Average interaction energy of the four most populous clusters of each compound with the Nav1.4 channel. The compound-protein interaction energy is shown for CBZ (A), LMT (B), LDN (C), and LDC (D) in kilocalories per mole. The 10 amino acid residues with the most negative energy of interaction with the drugs were singled out and labeled. Only residues from the SF and segment S6 were plotted. The x axis of the plot is broken up into eight sections, each representing either part of the SF or S6 segment of each of the four domains. The y scale differs between the graphs, but all graphs are plotted with 0 kcal/mol at the center. To see this figure in color, go online.
Similarly, clusters 1, 2, and 4 of LMT had the majority of their favorable interactions with residues overlap with clusters 3 and 4 of CBZ (Fig. 6 B; Table 2). L794, F797, F1586, and Y1593 are all residues that CBZ interacts with; the one residue that LMT interacts with that CBZ does not is N790. The third cluster of LMT was different yet again. Its residues did not overlap with CBZ’s residues but instead had its own set of interacting residues, including one of the SF residues (K1244, E1531, I1552, A1536, W1538, I1582, and F1586). LMT has the most dissimilar clusters, indicating it does not have a single distinct binding pose.
Clusters 1, 2, and 4 of LDN had their strongest interactions with residues in DII, DIII, and DIV and showed similarities with CBZ clusters 1 and 2 in the pattern of residues they interacted with (Fig. 6 C; Table 2). For example, they both interact with F790, F797, F1243, F1284, and L1287 on DII and DIII. The extra residues that these clusters of LDN interacts with are L794, K1244, and Y1593.
Finally, the top four clusters of LDC exhibited much stronger interactions with the protein compared with the three neutral compounds, whose interactions strengths were all of similar magnitude (Fig. 6 D). This result is expected on account of LDC carrying a positive charge and it engaging in more polar interactions (Fig. 6 D). Significantly, whereas CBZ, LMT, and LDN had the majority of their strongest interactions with residues in the S6 segments of the protein, the majority of strong interactions between the LDC molecule and the protein were with residues in the SF (Fig. 7). Included in this list is the extremely unfavorable interaction between cluster 1 of LDC and residue K1244 in the SF of DIII. Both lysine and LDC have positively charged amides, and as LDC’s amine group projects up into the pore (Fig. 4), this positive interaction energy is easily explained by the repulsion between these charges. Indeed, removal of this positive charge on the lysine was shown to improve local anesthetic block (34). Although all the compounds had some interactions with F1586 and Y1593, none of them had strong interactions with F1586, and both LDN and LDC had strong favorable interactions with Y1593.
Figure 7.

Binding of each compound to Nav1.4. Representative snapshots from the top cluster for each compound. The compounds of interest are shown in licorice with heteroatoms colored according to their type and carbons colored according to the compound’s identity: yellow for CBZ (A), blue for LMT (B), orange for LDN (C), and green for LDC (D). The protein backbone is depicted in new cartoon, with DI represented in white and DII–DIV represented in progressively darker shades of gray. The six amino acid residues with the most negative energy of interaction with each compound are depicted in licorice, and their atoms are colored according to their type. Carbons (excluding those in the compounds of interest) are cyan, oxygens are red, nitrogens are dark blue, sulfurs are yellow, chlorines are green-yellow, and hydrogens are white. To see this figure in color, go online.
It is notable that, unlike the other compounds studied, all six of the top residues with which the top cluster of CBZ has the most favorable interactions possess hydrophobic side chains (Figs. 6 A and 7 A). The three strongest among these are phenylalanine residues, which, given their position, likely undergo aromatic-aromatic interactions with CBZ’s own aromatic rings (Figs. 6 A and 7 A). By comparison, the two residues with the most favorable interaction energies with the top cluster of LMT are each either polar or charged and likely undergo dipole-dipole interactions with LMT (Figs. 6 B and 7 B). Interestingly, of the remaining four of the top six residues with the most favorable interactions, M403 and L758, are not in positions that would suggest particularly strong dispersion forces (Figs. 6 B and 7 B). The finding that LMT engages in more polar interactions than CBZ is not surprising, given the greater number of electronegative heteroatoms in LMT, but it does suggest that these two members of the same drug class are anchored in the pore by different interactions.
Of the six residues with the most favorable interactions with the top cluster of LDN, all but one is hydrophobic, and the proximity of these hydrophobic groups to LDN in conjunction with the strength of interaction suggests these residues’ interactions with the drug are nonpolar (Figs. 3 C and 4 C). Three of these hydrophobic residues (F797, F1284, and L1287) also are among the six most favorable residues that interact with the top cluster of CBZ (Fig. 6). The nonhydrophobic residue within the top six with which LDN interacts most favorably is the positively charged K1244, which likely undergoes a dipole-dipole interaction with LDN’s amide oxygen (Figs. 3 C and 4 C).
In contrast to the other compounds, four of the six residues with which the top cluster of LDC forms its most favorable bonds possess either polar or charged side chains, likely reflecting dipole-dipole and ionic interactions between these residues and the ammonium group on LDC (Fig. 4 D). Of the remaining two residues, the side chain of L758 is angled away from the drug, suggesting the interaction is predominantly polar and involves the amino acid backbone, as in the interaction between LMT and this residue (Fig. 4). Finally, based on the relative positions and orientations of the molecules, Y1593 in LDC’s top cluster, as in LDN’s top cluster, most likely interacts with the compound via aromatic-aromatic interactions (Fig. 7).
Discussion
This study aimed to determine the preferred binding modes of three VGSC inhibitors within the pore of the human VGSC Nav1.4. This included a comparison of charged and neutral compounds as well as tonic and use-dependent blockers. A surprising result of our simulations is the variety of positions that can be occupied by the different drugs, with a number of energy minima seen for most of the compounds rather than a unique low-energy pose. Whereas all the compounds bound at a similar height in the pore and point their most polar groups toward the SF, our results suggest that CBZ, and to a lesser extent, LMT, occupy more lateral regions of the pore than either LDN or LDC (Figs. 3 and 4). Whereas charged LDC is seen to occupy a classic binding pose near DIV, the neutral compounds, most notably CBZ, prefer to interact with DII-DIII. Since the work of Ragsdale et al. (18,22), much discussion has focused on the importance of residues in DIV in local anesthetic binding; however, there is strong evidence for residues in all domains influencing binding (29, 30, 31, 32, 33,38). The disparate and often contrary data on which residues are involved in drug binding seen in mutagenesis studies can be partly explained by the use of different compounds (28). For example, mutagenesis data have shown that different residues aid binding of etidocaine and LMT (29). Recent structures have shown that two class 1 antiarrythmics, flecainide and quinidine, can bind in distinct locations in the Nav1.5 pore (12,47) Both bind below the SF, where the protonated nitrogens can block Na+ permeation in accord with our previous predictions (36). However, flecainide interacts with residues in S6 of DII and DIII, and quinidine interacts with S6 of DI, DIII, and DIV, indicating that a variety of binding sites exist in the pore. The variety of binding poses seen in our data shows that even a single drug can have many favorable poses in the pore, which may aid in explaining the large number of residues identified to influence binding.
In this study, there was a large degree of variation between both the residues with which compounds interacted and the type of interactions that were predominant in the binding of each the four drugs (Figs. 1, 2, 3, and 4). CBZ and LDN showed the greatest overlap in residues with which they had favorable interactions, sharing three in their top six. This finding is interesting, given that Yang et al. (48) suggested that CBZ and LDN share a common aromatic motif that enables them to bind to the same site. Whereas the binding site suggested in that study involved the interaction of both of these compounds with the Nav1.2 equivalents of F1586 and Y1593, the structural similarity observed in the study may still underlie the similarities in the two compounds’ interactions observed here (48). That the lowest energy poses (top clusters) of CBZ interact with DII-DIII rather than DIV is surprising, given that Tikhonov and Zhorov predicted CBZ binding to DIV (24). Our simulations do show less populated clusters that interact more classically with F1586 and Y1593 on DIV, and it is possible that either CBZ can adopt both of these poses or that our simulations cannot easily discriminate between them. Alternatively, there is an opportunity for more than one compound to bind in the cavity at a time, something previously suggested from simulation data (49).
Lidocaine, in both its neutral and charged forms, has a distinctly different mode of binding to that seen for CBZ and LMT. Both charge states of lidocaine have strong interactions with the SF, including repulsion to the positive K1244 in the DEKA ring and attraction to the negatively charged aspartate (D406) and glutamate (E761). This is in agreement with mutagenesis data, in which replacement of K1244 enhances block by lidocaine (34). The phenyl groups of both LDN and LDC are found to localize to approximately the same site in the pore, most likely on account of the interaction between this moiety and Y1593 in both compounds (Fig. 6). This finding supports the view that this residue plays an important role in use-dependent block by anchoring lidocaine within the pore, explaining its necessity in effective drug binding (18,22). Unlike the benzene groups, the amine groups of LDN and LDC were observed to diverge significantly, with the charged ammonium of LDC reaching up to the SF, whereas the neutral amine of LDN remained lower and less centered within the pore (Fig. 7). These findings complement the observation of Buyan et al. (36) that neutral and charged compounds bind differently on account of charged residues being attracted up into the SF. The orientation of the ammonium group toward the SF also supports the model of Tikhonov and Zhorov (24), which explains inhibition of sodium currents by charged local anesthetics as being mediated by electrostatic repulsion between a cationic group in the SF and sodium ions at the narrow SF.
We found that Y1593 in DIV had important interactions with both forms of lidocaine. Interestingly, Buyan et al. (36) found that the bacterial VGSC NavMs equivalent to Y1593 did not engage in major interactions with the compounds that they studied, including LDN and LDC. They suggested this result may be attributable to the fact that the channel used was not in an inactivated state and not able to show Y1593’s importance in use-dependent block (36). This hypothesis is supported by the observations that, in this study using an inactivated channel, Y1593 interacted with LDN and LDC significantly.
To better understand how the functional state of the channel could influence the binding of local anesthetics and antiepileptics, we compare the structure of Nav1.4 in an inactivated state with that of NavPas (believed to represent a closed state), as well as that of NavMs (also with a closed pore) in Fig. 8. Here, we align the S6 helices of the proteins and highlight the position of the residues corresponding to Y1593 and F1586. In addition, we show the binding pose of LDC predicted here for Nav1.4 and by Buyan et al. (36) for NavPas and NavMs. As seen in Fig. 8 A, the side chains of Y1593 (or equivalent) occupy vastly different positions in the three structures. Although it is exposed, the central cavity in the inactivated Nav1.4 rotation of the S6 helix and differing side-chain orientations mean that this residue becomes more buried in closed NavPas and NavMs. As a consequence, LDC only has significant interactions with this residue in the inactivated Nav1.4. In contrast, F1586 is accessible to the cavity in all three structures. Although both F1586 and Y1593 are considered important to local anesthetic and antiepileptic activity, they do not participate in the same way for resting state and inactivated state block (23). Results from early alanine scanning experiments suggest that replacing the F with A results in a considerably smaller reduction in protein binding of antiepileptics than of local anaesthetics (38). Conversely, replacing the Y with A results in a considerably larger reduction in the protein binding of antiepilepticss than that of local anaesthetics (38). This makes sense if the Y is only accessible in the inactivated state, in which it would influence use-dependent block of antiepiletpics. That F1586 is accessible in all states explains why this residue has a greater role in tonic block.
Figure 8.
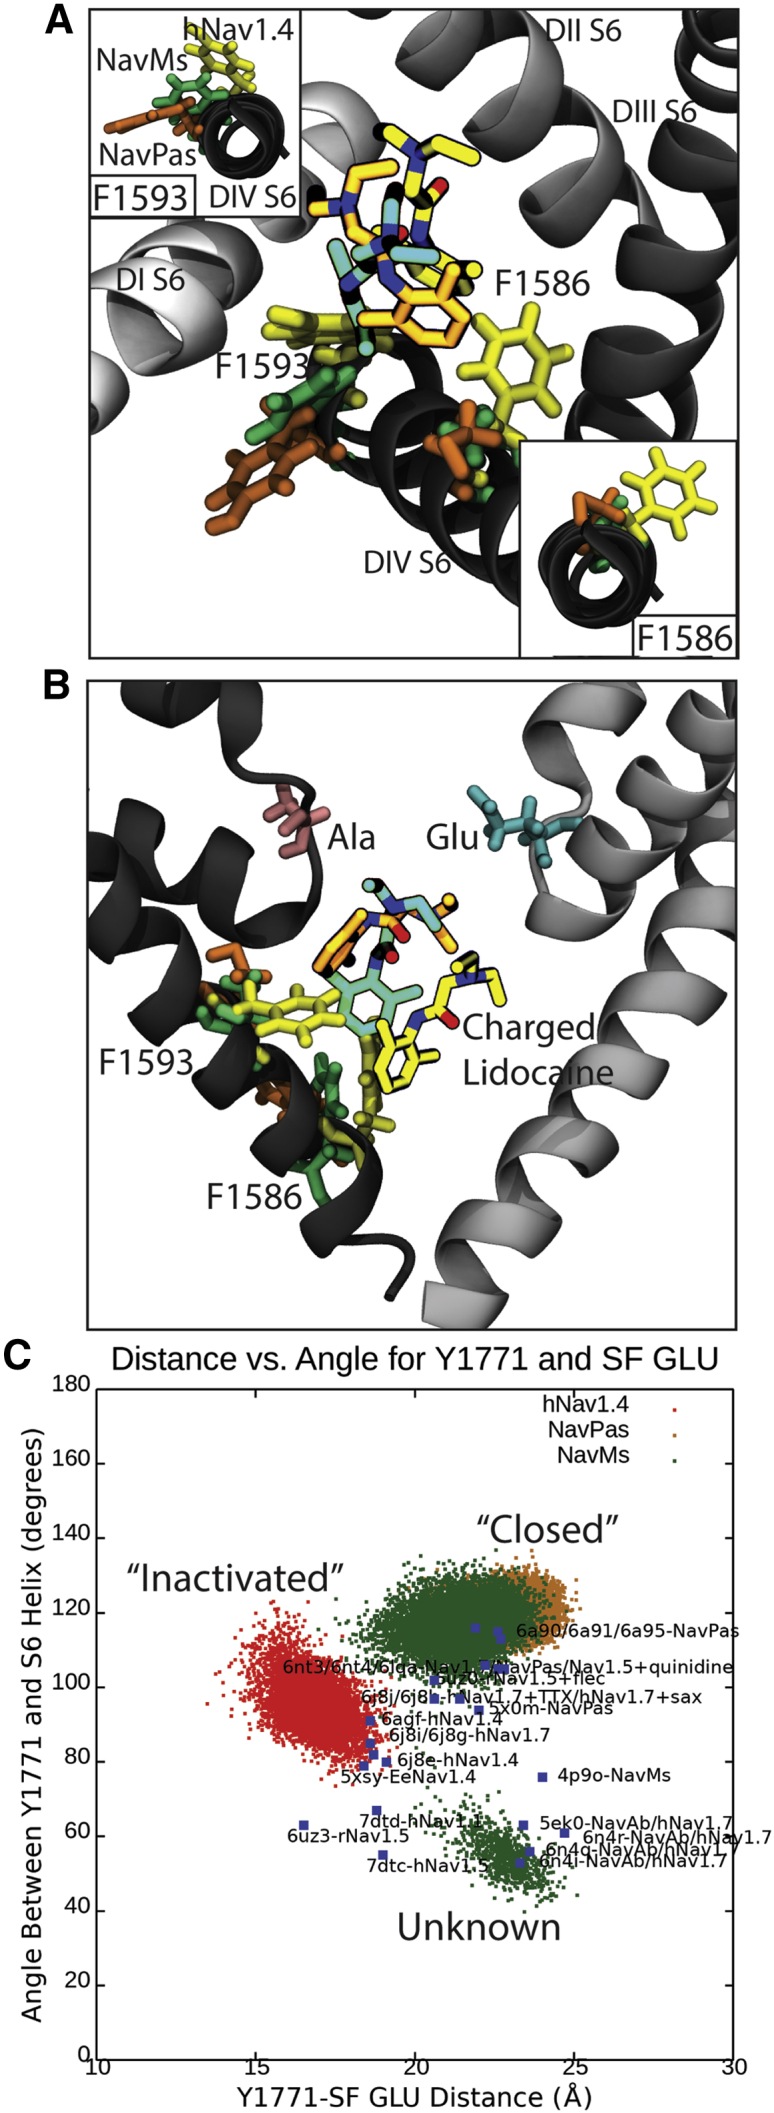
Binding of charged lidocaine (LDC) to human Nav1.4, NavPas, and NavMs, along with the role of F1583 and Y1593 in binding. (A) Representative snapshots from the top cluster for each channel, with the orientation of Y1593 and equivalent residues shown in the inset in the top left and the orientation of F1586 and equivalent residues shown in the bottom right. (B) A 90° rotation of figure (A) showing positions of Y1593, F1586, and lidocaine with respect to the SF. The E (Glu) and A (Ala) of the DEKA motif are shown in blue and pink licorice. Residues associated with hNav1.4 are in yellow, NavMs in green, and NavPas in orange. The protein is shown in different shades of gray, for which DI is the lightest and DIV is the darkest. (C) Angle between Y1593 and equivalents versus distance between Y1593 and Glu in the SF. The hNav1.4 simulation is in red, the NavPas simulation is in yellow, and the NavMs simulation in in green. The blue dots are all known crystal structures of eukaryotic channels or chimeras between eukaryotic and prokaryotic channels. To see this figure in color, go online.
To further support this hypothesis, we examine the location of the Y1593 side chain across our simulations as well as in all the other available Nav structures in Fig. 8 C (as characterized by the distance between this residue and the SF as well as the angle of the side chain relative to the DIV S6 helix.) A clear difference in Y1593 side-chain position persists throughout our simulations, demonstrating that the differences seen in Fig. 8, A and B are not due to an unrepresentative selection of snapshots. This difference could be representative of changes occurring between the closed and inactivated states of the channel (only the Y1593 orientation seen in the inactivated state allows for local anesthetics to bind in a position where they can also link to favorable interactions in the SF). The NavMs simulations show similar results to those for closed NavPas but also identify a second side-chain orientation. In the bacterial channels, the equivalent residue is a phenylalanine rather than a tyrosine, and this position represents the less polar F side chain pointing down into a hydrophobic pocket not occupied by the polar Y side chain of eukaryotic channels. Analysis of cryo-electron microscopy structures of other Nav channels follow the same trend seen in our simulations. Structures of human channels purported to be in the inactivated state all have side chains of the residue equivalent to Y1593 pointing into the cavity toward the SF. Structures of purportedly closed NavPas analogs have the side chain pointing away from the cavity, where it is hidden to LAs. Structures of the bacterial channels tend to also have the side chain pointing away from the filter but more often tucked in the hydrophobic pocket near the activation gate. Our results suggest that the orientation of the Y1593 side chain may be a good indicator of the functional state of the channel.
In conclusion, we found that inhibitors can adopt a variety of binding poses in the pore rather than one distinct pose, potentially explaining the large number of residues shown to influence binding in mutagenesis studies. CBZ and LMT showed a preference to bind on the side of the pore and closer to DII-DIII, with additional binding poses close to DIV. This highlighted the role of nonclassical residues in binding, as well as reopening the concept that multiple molecules of these drugs might simultaneously bind in the pore. Unlike those of the CBZ and LMT, the interactions of LDN and LDC with residues in DIV (especially Y1593) largely reflected what was expected and reinforced that the protonated compounds are likely to interact with and occlude the SF, supporting the model presented by Buyan et al. (36). A comparison of the side-chain locations of the key DIV in our simulations of Nav1.4, NavPas, and NavMs, as well as in published structures of other channels suggests that Y1593 is accessible only in the inactivated state, whereas F1586 is accessible in all states. This could explain the greater role of Y1593 in use-dependent block and of F1586 in tonic block. Future studies should also repeat these simulations, using channels in different conformational states and different VGSC subtypes as they become available to see how pore occupation by these drugs differs.
Author contributions
A.B. set up, executed, and ran the simulations, helped with analysis, and wrote the article. A.A.W. analyzed all of the simulations, made the figures, and wrote the article. B.C. planned and supervised the study, aided with analysis, and wrote the article.
Acknowledgments
The authors thank Dr. Juan Jose Nogueira Perez for supplying coordinates from his simulations on hNav1.4, used as a starting point for this project. This work was supported by computational resources provided by the Australian Government through the National Computational Infrastructure (NCI) under the ANU and National Merit Allocation Schemes. The authors acknowledge funding from the Australian Research Council (FT130100781 and DP200100860)
Editor: Lucie Delemotte.
Footnotes
Amanda Buyan and Aidan A. Whitfield contributed equally to this work.
For submission to: Biophysical Journal
Supporting material can be found online at https://doi.org/10.1016/j.bpj.2021.11.014.
Supporting material
References
- 1.Ahern C.A., Payandeh J., et al. Chanda B. The hitchhiker’s guide to the voltage-gated sodium channel galaxy. J. Gen. Physiol. 2016;147:1–24. doi: 10.1085/jgp.201511492. [DOI] [PMC free article] [PubMed] [Google Scholar]
- 2.Andavan G.S., Lemmens-Gruber R. Voltage-gated sodium channels: mutations, channelopathies and targets. Curr. Med. Chem. 2011;18:377–397. doi: 10.2174/092986711794839133. [DOI] [PubMed] [Google Scholar]
- 3.Shen H., Zhou Q., et al. Yan N. Structure of a eukaryotic voltage-gated sodium channel at near-atomic resolution. Science. 2017;355:eaal4326. doi: 10.1126/science.aal4326. [DOI] [PubMed] [Google Scholar]
- 4.Yan Z., Zhou Q., et al. Yan N. Structure of the Nav1.4-β1 complex from electric eel. Cell. 2017;170:470–482.e11. doi: 10.1016/j.cell.2017.06.039. [DOI] [PubMed] [Google Scholar]
- 5.Pan X., Li Z., et al. Yan N. Structure of the human voltage-gated sodium channel Nav1.4 in complex with β1. Science. 2018;362:eaau2486. doi: 10.1126/science.aau2486. [DOI] [PubMed] [Google Scholar]
- 6.Shen H., Li Z., et al. Yan N. Structural basis for the modulation of voltage-gated sodium channels by animal toxins. Science. 2018;362:eaau2596. doi: 10.1126/science.aau2596. [DOI] [PubMed] [Google Scholar]
- 7.Pan X., Li Z., et al. Yan N. Molecular basis for pore blockade of human Na+ channel Nav1.2 by the μ-conotoxin KIIIA. Science. 2019;363:1309–1313. doi: 10.1126/science.aaw2999. [DOI] [PubMed] [Google Scholar]
- 8.Clairfeuille T., Cloake A., et al. Payandeh J. Structural basis of α-scorpion toxin action on Nav channels. Science. 2019;363:eaav8573. doi: 10.1126/science.aav8573. [DOI] [PubMed] [Google Scholar]
- 9.Ahuja S., Mukund S., et al. Payandeh J. Structural basis of Nav1.7 inhibition by an isoform-selective small-molecule antagonist. Science. 2015;350:aac5464. doi: 10.1126/science.aac5464. [DOI] [PubMed] [Google Scholar]
- 10.Shen H., Liu D., et al. Yan N. Structures of human Nav1.7 channel in complex with auxiliary subunits and animal toxins. Science. 2019;363:1303–1308. doi: 10.1126/science.aaw2493. [DOI] [PubMed] [Google Scholar]
- 11.Xu H., Li T., et al. Payandeh J. Structural basis of Nav1.7 inhibition by a gating-modifier spider toxin. Cell. 2019;176:702–715.e14. doi: 10.1016/j.cell.2018.12.018. [DOI] [PubMed] [Google Scholar]
- 12.Jiang D., Shi H., et al. Catterall W.A. Structure of the cardiac sodium channel. Cell. 2020;180:122–134.e10. doi: 10.1016/j.cell.2019.11.041. [DOI] [PMC free article] [PubMed] [Google Scholar]
- 13.Pan X., Li Z., et al. Yan N. Comparative structural analysis of human Nav1.1 and Nav1.5 reveals mutational hotspots for sodium channelopathies. Proc. Natl. Acad. Sci. USA. 2021;118 doi: 10.1073/pnas.2100066118. e2100066118. [DOI] [PMC free article] [PubMed] [Google Scholar]
- 14.Li Z., Jin X., et al. Yan N. Structure of human Nav1.5 reveals the fast inactivation-related segments as a mutational hotspot for the long QT syndrome. Proc. Natl. Acad. Sci. USA. 2021;118 doi: 10.1073/pnas.2100069118. e2100069118. [DOI] [PMC free article] [PubMed] [Google Scholar]
- 15.Yu F.H., Catterall W.A. Overview of the voltage-gated sodium channel family. Genome Biol. 2003;4:207. doi: 10.1186/gb-2003-4-3-207. [DOI] [PMC free article] [PubMed] [Google Scholar]
- 16.O’Malley H.A., Isom L.L. Sodium channel β subunits: emerging targets in channelopathies. Annu. Rev. Physiol. 2015;77:481–504. doi: 10.1146/annurev-physiol-021014-071846. [DOI] [PMC free article] [PubMed] [Google Scholar]
- 17.Zamponi G.W., Doyle D.D., French R.J. Fast lidocaine block of cardiac and skeletal muscle sodium channels: one site with two routes of access. Biophys. J. 1993;65:80–90. doi: 10.1016/S0006-3495(93)81042-7. [DOI] [PMC free article] [PubMed] [Google Scholar]
- 18.Ragsdale D.S., McPhee J.C., et al. Catterall W.A. Molecular determinants of state-dependent block of Na+ channels by local anesthetics. Science. 1994;265:1724–1728. doi: 10.1126/science.8085162. [DOI] [PubMed] [Google Scholar]
- 19.Lipkind G.M., Fozzard H.A. Molecular model of anticonvulsant drug binding to the voltage-gated sodium channel inner pore. Mol. Pharmacol. 2010;78:631–638. doi: 10.1124/mol.110.064683. [DOI] [PMC free article] [PubMed] [Google Scholar]
- 20.Bagnéris C., DeCaen P.G., et al. Wallace B.A. Prokaryotic NavMs channel as a structural and functional model for eukaryotic sodium channel antagonism. Proc. Natl. Acad. Sci. USA. 2014;111:8428–8433. doi: 10.1073/pnas.1406855111. [DOI] [PMC free article] [PubMed] [Google Scholar]
- 21.Gamal El-Din T.M., Lenaeus M.J., et al. Catterall W.A. Fenestrations control resting-state block of a voltage-gated sodium channel. Proc. Natl. Acad. Sci. USA. 2018;115:13111–13116. doi: 10.1073/pnas.1814928115. [DOI] [PMC free article] [PubMed] [Google Scholar]
- 22.Ragsdale D.S., McPhee J.C., et al. Catterall W.A. Common molecular determinants of local anesthetic, antiarrhythmic, and anticonvulsant block of voltage-gated Na+ channels. Proc. Natl. Acad. Sci. USA. 1996;93:9270–9275. doi: 10.1073/pnas.93.17.9270. [DOI] [PMC free article] [PubMed] [Google Scholar]
- 23.Wang G.K., Strichartz G.R. State-dependent inhibition of sodium channels by local anesthetics: a 40-year evolution. Biochem. (Mosc) Suppl. Ser. A Membr. Cell Biol. 2012;6:120–127. doi: 10.1134/S1990747812010151. [DOI] [PMC free article] [PubMed] [Google Scholar]
- 24.Tikhonov D.B., Zhorov B.S. Mechanism of sodium channel block by local anesthetics, antiarrhythmics, and anticonvulsants. J. Gen. Physiol. 2017;149:465–481. doi: 10.1085/jgp.201611668. [DOI] [PMC free article] [PubMed] [Google Scholar]
- 25.Catterall W.A. From ionic currents to molecular mechanisms: the structure and function of voltage-gated sodium channels. Neuron. 2000;26:13–25. doi: 10.1016/s0896-6273(00)81133-2. [DOI] [PubMed] [Google Scholar]
- 26.Fozzard H.A., Sheets M.F., Hanck D.A. The sodium channel as a target for local anesthetic drugs. Front. Pharmacol. 2011;2:68. doi: 10.3389/fphar.2011.00068. [DOI] [PMC free article] [PubMed] [Google Scholar]
- 27.Bhattacharya A., Wickenden A.D., Chaplan S.R. Sodium channel blockers for the treatment of neuropathic pain. Neurotherapeutics. 2009;6:663–678. doi: 10.1016/j.nurt.2009.08.001. [DOI] [PMC free article] [PubMed] [Google Scholar]
- 28.Nau C., Wang G.K. Interactions of local anesthetics with voltage-gated Na+ channels. J. Membr. Biol. 2004;201:1–8. doi: 10.1007/s00232-004-0702-y. [DOI] [PubMed] [Google Scholar]
- 29.Yarov-Yarovoy V., Brown J., et al. Catterall W.A. Molecular determinants of voltage-dependent gating and binding of pore-blocking drugs in transmembrane segment IIIS6 of the Na(+) channel alpha subunit. J. Biol. Chem. 2001;276:20–27. doi: 10.1074/jbc.M006992200. [DOI] [PubMed] [Google Scholar]
- 30.Yarov-Yarovoy V., McPhee J.C., et al. Catterall W.A. Role of amino acid residues in transmembrane segments IS6 and IIS6 of the Na+ channel alpha subunit in voltage-dependent gating and drug block. J. Biol. Chem. 2002;277:35393–35401. doi: 10.1074/jbc.M206126200. [DOI] [PubMed] [Google Scholar]
- 31.Kondratiev A., Tomaselli G.F. Altered gating and local anesthetic block mediated by residues in the I-S6 and II-S6 transmembrane segments of voltage-dependent Na+ channels. Mol. Pharmacol. 2003;64:741–752. doi: 10.1124/mol.64.3.741. [DOI] [PubMed] [Google Scholar]
- 32.Wang G.K., Quan C., Wang S.Y. Local anesthetic block of batrachotoxin-resistant muscle Na+ channels. Mol. Pharmacol. 1998;54:389–396. doi: 10.1124/mol.54.2.389. [DOI] [PubMed] [Google Scholar]
- 33.Wang S.Y., Nau C., Wang G.K. Residues in Na(+) channel D3-S6 segment modulate both batrachotoxin and local anesthetic affinities. Biophys. J. 2000;79:1379–1387. doi: 10.1016/S0006-3495(00)76390-9. [DOI] [PMC free article] [PubMed] [Google Scholar]
- 34.Sunami A., Dudley S.C., Jr., Fozzard H.A. Sodium channel selectivity filter regulates antiarrhythmic drug binding. Proc. Natl. Acad. Sci. USA. 1997;94:14126–14131. doi: 10.1073/pnas.94.25.14126. [DOI] [PMC free article] [PubMed] [Google Scholar]
- 35.Lipkind G.M., Fozzard H.A. Molecular modeling of local anesthetic drug binding by voltage-gated sodium channels. Mol. Pharmacol. 2005;68:1611–1622. doi: 10.1124/mol.105.014803. [DOI] [PubMed] [Google Scholar]
- 36.Buyan A., Sun D., Corry B. Protonation state of inhibitors determines interaction sites within voltage-gated sodium channels. Proc. Natl. Acad. Sci. USA. 2018;115:E3135–E3144. doi: 10.1073/pnas.1714131115. [DOI] [PMC free article] [PubMed] [Google Scholar]
- 37.Kuo C.C. A common anticonvulsant binding site for phenytoin, carbamazepine, and lamotrigine in neuronal Na+ channels. Mol. Pharmacol. 1998;54:712–721. [PubMed] [Google Scholar]
- 38.Liu G., Yarov-Yarovoy V., et al. Catterall W.A. Differential interactions of lamotrigine and related drugs with transmembrane segment IVS6 of voltage-gated sodium channels. Neuropharmacology. 2003;44:413–422. doi: 10.1016/s0028-3908(02)00400-8. [DOI] [PubMed] [Google Scholar]
- 39.Jo S., Jiang W. A generic implementation of replica exchange with solute tempering (REST2) algorithm in NAMD for complex biophysical simulations. Comput. Phys. Commun. 2015;197:304–311. [Google Scholar]
- 40.Terakawa T., Kameda T., Takada S. On easy implementation of a variant of the replica exchange with solute tempering in GROMACS. J. Comput. Chem. 2011;32:1228–1234. doi: 10.1002/jcc.21703. [DOI] [PubMed] [Google Scholar]
- 41.Joung I.S., Cheatham T.E., III Determination of alkali and halide monovalent ion parameters for use in explicitly solvated biomolecular simulations. J. Phys. Chem. B. 2008;112:9020–9041. doi: 10.1021/jp8001614. [DOI] [PMC free article] [PubMed] [Google Scholar]
- 42.Palmisano V.F., Gómez-Rodellar C., et al. Nogueira J.J. Binding of azobenzene and p-diaminoazobenzene to the human voltage-gated sodium channel Nav1.4. Phys. Chem. Chem. Phys. 2021;23:3552–3564. doi: 10.1039/d0cp06140a. [DOI] [PubMed] [Google Scholar]
- 43.Patriksson A., van der Spoel D. A temperature predictor for parallel tempering simulations. Phys. Chem. Chem. Phys. 2008;10:2073–2077. doi: 10.1039/b716554d. [DOI] [PubMed] [Google Scholar]
- 44.Essmann U., Perera L., Berkowitz M.L. A smooth particle mesh Ewald method. J. Chem. Phys. 1995;103:8577–8593. [Google Scholar]
- 45.Humphrey W., Dalke A., Schulten K. VMD: visual molecular dynamics. J. Mol. Graph. 1996;14:33–38, 27–8. doi: 10.1016/0263-7855(96)00018-5. [DOI] [PubMed] [Google Scholar]
- 46.Chen R., Buyan A., Corry B. Voltage-gated sodium channel pharmacology: insights from molecular dynamics simulations. Adv. Pharmacol. 2017;79:255–285. doi: 10.1016/bs.apha.2017.02.002. [DOI] [PubMed] [Google Scholar]
- 47.Li Z., Jin X., et al. Yan N. Structural basis for pore blockade of the human cardiac sodium channel Nav 1.5 by the antiarrhythmic drug quinidine∗. Angew. Chem. Int.Engl. 2021;60:11474–11480. doi: 10.1002/anie.202102196. [DOI] [PubMed] [Google Scholar]
- 48.Yang Y.C., Huang C.S., Kuo C.C. Lidocaine, carbamazepine, and imipramine have partially overlapping binding sites and additive inhibitory effect on neuronal Na+ channels. Anesthesiology. 2010;113:160–174. doi: 10.1097/ALN.0b013e3181dc1dd6. [DOI] [PubMed] [Google Scholar]
- 49.Nguyen P.T., DeMarco K.R., et al. Yarov-Yarovoy V. Structural basis for antiarrhythmic drug interactions with the human cardiac sodium channel. Proc. Natl. Acad. Sci. USA. 2019;116:2945–2954. doi: 10.1073/pnas.1817446116. [DOI] [PMC free article] [PubMed] [Google Scholar]
Associated Data
This section collects any data citations, data availability statements, or supplementary materials included in this article.