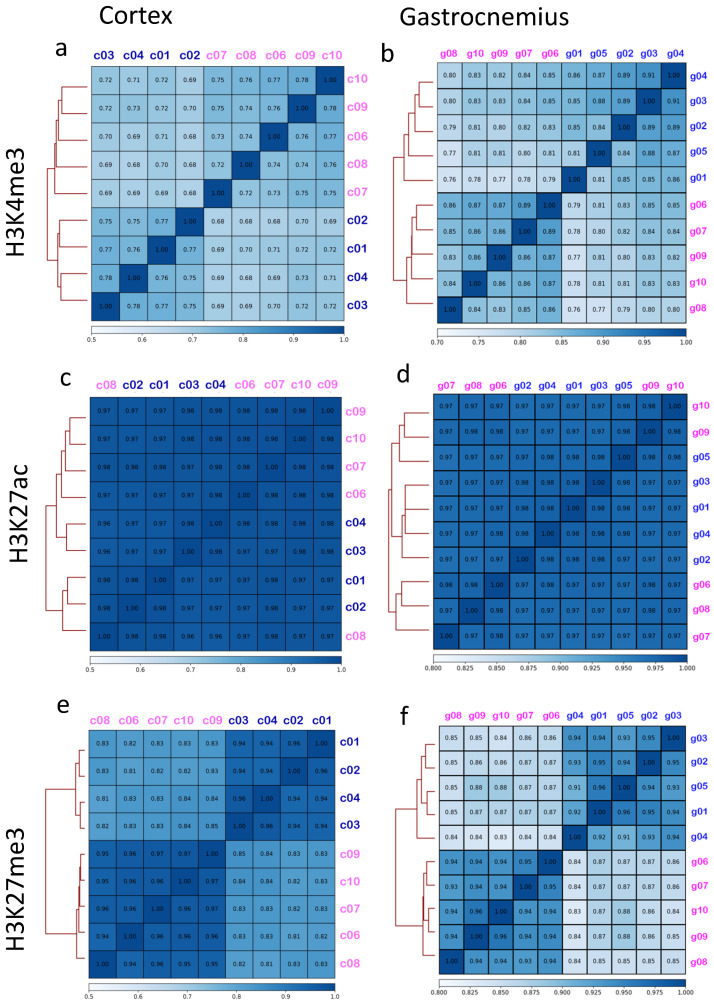
Figure 1.
Spearman correlation including autosomes and X chromosome. Spearman correlation heatmap including chromosomes 1-19 and X for H3K4me3 (a), H3K27ac (c), and H3K27me3 (e) from cortexes are represented in the graphs on the left side. Corresponding graphs from gastrocnemius, for H3K4me3 (b), H3K27ac (d), and H3K27me3 (f), are reported on the right side. Male IDs are indicated in blue, female IDs are in pink. The color within each cell represents the Spearman coefficient which ranges from 0.68 to 1 (maximal correlation).

