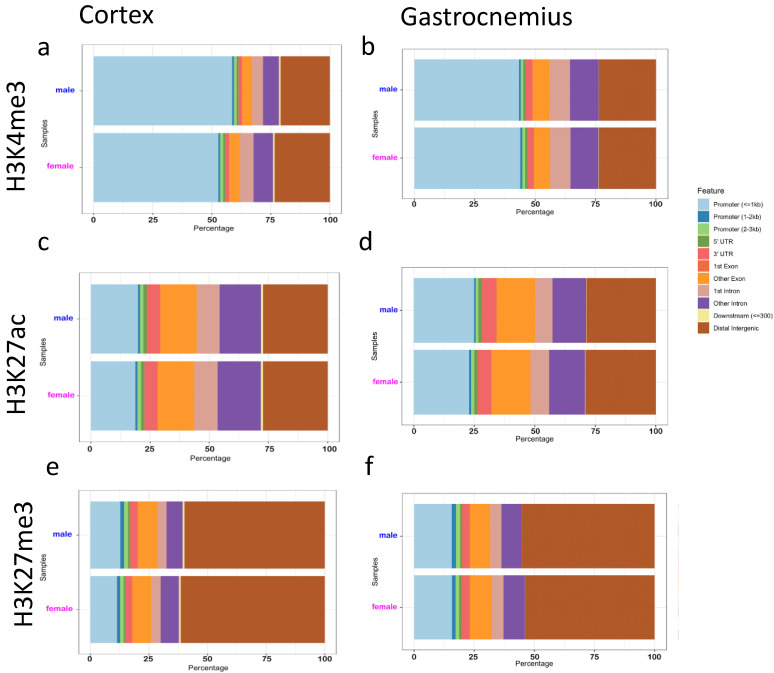
Figure 3.
Feature distribution of called peaks for H3K4me3, H3K27ac, and H3K27me3 in cortex and gastrocnemius tissues. Feature distribution of the identified peaks for H3K4me3 (a), H3K27ac (c), and H3K27me3 (e) in cortexes are reported on the left. Feature distribution of H3K4me3 (b), H3K27ac (d), and H3K27me3 (f) peaks found in the gastrocnemius are reported in the plots on the right. Males are in blue, females in pink. The color code indicating each genomic feature is shown.

