

Abstract
Free-radical generation is suspected to play a key role in cardiovascular diseases. Another crucial factor is shear stress. Human umbilical vein endothelial cells (HUVECS), which form the lining of blood vessels, require a physiological shear stress to activate many vasoactive factors. These are needed for maintaining vascular cell functions such as nonthrombogenicity, regulation of blood flow, and vascular tone. Additionally, blood clots form at regions of high shear stress within a blood vessel. Here, we use a new method called diamond magnetometry which allows us to measure the dynamics of free-radical generation in real time under shear stress. This quantum sensing technique allows free-radical detection with nanoscale resolution at the single-cell level. We investigate radical formation in HUVECs in a microfluidic environment under different flow conditions typically found in veins and arteries. Here, we looked into free-radical formation before, during, and after flow. We found that the free-radical production varied depending on the flow conditions. To confirm the magnetometry results and to differentiate between radicals, we performed conventional fluorescent reactive oxygen species (ROS) assays specific for superoxide, nitric oxide, and overall ROS.
Keywords: NV centers, nanodiamonds, cells, quantum sensing, relaxometry, shear stress
Endothelial cell functions, shapes, physiology, and pathophysiology are regulated by the type and magnitude of shear stress. The magnitude of shear stress varies greatly between different locations in the vascular system. Typically, the shear stress ranges from 1 to 6 dyne/cm2 (1 dyne/cm2 equals 0.1 Pa) in veins and from 10 to 70 dyne/cm2 in arteries. Both the increase and decrease of the shear stress can lead to pathological conditions. In arteries, low shear stresses up to 4 dyne/cm2 are responsible for atherosclerosis and high shear stresses from 70 to 100 dyne/cm2 cause thrombosis.1,2 It has been proven that imbalance of free radicals in endothelial cells can lead to vascular diseases such as hypertension, diabetes, atherosclerosis, pulmonary hypertension, ischemic heart diseases, and chronic kidney diseases.3 However, the mechanisms which involve free radicals in the mentioned dysfunctions are still not fully described. This is due to the short lifetime of free radicals of about 1–10 s for NO*4,5 and around 2 μs for O2*–6 and the fact that their reactivity complicates detecting and quantifying them within blood, cells, and tissues. Many electrochemical methods have been applied for free-radical sensing based on the redox reaction between biological molecules on an electrode surface and free radicals.7,8 A drawback is that the electrode surface potential can be reduced due to interactions with other electroactive organic or inorganic species.9 Spectrophotometric methods are beneficial due to their simplicity and low cost, but they are limited by sensitivity.10 Magnetic resonance-based methods have also been applied, which make use of spin labels which react with radicals to form stable radicals. However, these methods are relatively insensitive and thus require relatively large concentrations and work with cell ensembles.11−13
Besides these, many fluorescence-based probes have been developed for intracellular free-radical sensing. Most of these probes, however, are not specific to radicals but react with a wide variety of reactive species.14 For instance, the ethidium fluorescence technique also detects cytochrome C and H2O2.15,16 Additionally, these dyes react irreversibly with their target molecules. As a result, they measure the history of a sample rather than the current status. Since fluorescent dyes suffer from bleaching, it is also not possible to conduct long-term measurements.
Recently, diamond magnetometry with nitrogen vacancy (NV–) centers has been established, which offers a new way of sensing radicals.17 The NV– centers change their optical properties based on magnetic changes in their environment. Via a quantum effect, the magnetic signal is converted into an optical signal. Since optical signals can be read out much more sensitively than magnetic signals, this method has unprecedented sensitivity. The method is so sensitive that even the small magnetic signal of single electrons or nuclei can be detected.18−20 This technique has already been successfully applied to several applications in physics including the measurement of magnetic vortices,21 domain walls,22 magnetic nanostructures,23 or molecules on the diamond surface.24,25 Additionally, diamond magnetometry has already been used for several biological applications including imaging of spin-labeled cell slices, magnetosomes in bacteria, and metal-containing proteins.26−28 Here, we use a specific type of diamond magnetometry measurements called relaxometry or T1 measurements.25
T1 measurements reveal the magnetic noise surrounding the NV– center. An increase in radical concentration results in a decrease in T1.29,30 Such T1 measurements were already successfully applied for free-radical detection produced by chemical reactions under biologically relevant conditions.31 Recently, Morita et al. and Nie et al. have demonstrated free-radical detection in living cells with this method.32,33 Here, we applied this method for the first time to detect free-radical generation in human umbilical vein endothelial cells (HUVECs) under different shear stress conditions.
Materials and Methods
Fluorescent Nanodiamonds
All diamonds used in this work were fluorescent nanodiamond particles with an average hydrodynamic diameter of 70 nm supplied from Adamas Nanotechnologies, NC, USA. These particles are produced by the manufacturer via grinding (high pressure and high temperature) diamonds and contain approximately 500 nitrogen vacancy (NV–) centers per particle.34 NV– centers are the most popular type of diamond color centers. They are produced by replacing carbon atoms in the diamond lattice with nitrogen atoms and vacancies adjacent to them. The vacancies are created through irradiation, followed by annealing above 700 °C. NV– centers are excited at 490–560 nm and emitted in the red to near-infrared region (637–800 nm). Conveniently, there is relatively low auto-fluorescence from cells in this wavelength range. Since they are cleaned with oxidizing acids as the last step of their fabrication, their surface is oxygen-terminated. Many different chemical groups on the surface allow attaching biological entities such as proteins, enzymes, hormones, antigens, DNA, or drugs via both electrostatic and covalent interactions.35 Moreover, oxygen-terminated diamond shows excellent charge stability for shallow defects and small nanodiamonds.36 The zeta potential of these particles in DI water was observed to be ∼−20 mV.37 These fluorescent nanodiamonds (FNDs) are biocompatible38−40 and spontaneously internalized into cells, and their fluorescence is infinitely stable.41,42 FNDs have already been thoroughly characterized in earlier literature studies.37,43
Cell Culture and Seeding
HUVECs purchased from Lonza, CC-2519, Switzerland, were cultured in an endothelial cell growth basal medium (EBM-2) supplemented with an EGM-2 MV single Quot Kit and growth factors (Lonza). Cells were maintained at 37 °C with 5% CO2/95% air until passage 5 or 6. Before introducing the cells into the microfluidic device (ibidi), cells were thoroughly washed twice with phosphate-buffered saline (PBS) without Ca2+ or Mg2+ (Lonza) and removed from their culture surface using 0.5% trypsin (Invitrogen, USA) for 5 min at 37 °C. Prior to seeding cells, the interior walls of the channels were coated with 75 μg/mL fibronectin (ABIN377072, Germany) for 20 h at room temperature. After that, the channels were washed three times with fresh endothelial cell growth medium 2 (EGM2) and seeded with HUVECs at a concentration of 35,000 cells/cm2 to obtain confluency after 24 h.
Microfluidics and Shear Stress
In this study, we used commercially available ibidi μ-slides (LuerI 0.1) from ibidi GmbH, Germany. The channel was 50 mm in length, 10 mm in width, and 10 μm in height (Figure 1A). These sticky channels were bonded with (25 mm × 75 mm) glass coverslips. Before the experiment, the channel’s interior part was coated with 75 μg/mL fibronectin (ABIN377072) for 20 h at room temperature. To produce shear stress, the endothelial cell growth medium (EGM2) was passed through the channel by a peristaltic pump (New Era Pump, NE 9000G, USA), which was connected with the channel’s inlet and a reservoir through two 1.5 m long ibidi silicon tubings 1/8″. One tubing was connected with the reservoir, a T25 flask, and another one was connected with the channel’s inlet. The outlet was connected with the reservoir by a similar silicon tubing. The peristaltic pump received the liquid from the reservoir, passed it through the channel, and returned the liquid to the reservoir from the outlet (Figure 1c), causing a laminar flow. We varied the shear stress between 2 and 20 dyne/cm2 and investigated different times of exposure.
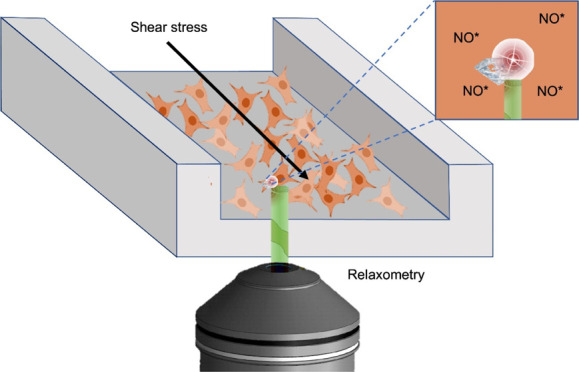
Figure 1.

Schematic representation of the conducted experiments in single HUVECs. (A) HUVECs were seeded in a microfluidic channel and incubated with the FND suspension (B). After 15 h of incubation, the FND suspension was replaced with a fresh medium. (C) Then, the channel was connected with the flow system and placed on the microscope stage for diamond magnetometry. Here, the free-radical generation was measured via T1 relaxation in single HUVECs before flow (D), during different flow conditions (E), and after flow (F).
To calculate the shear stress, we used formula (1)
| 1 |
Q = flow rate in cm3/s, η = viscosity of the Lonza EG medium (0.0075 dyne *s/cm2), h = channel height (cm), and w = channel width (cm).
The T1 values for each experiment were measured sequentially before flow, during flow, and after flow. The conventional methods measured the fluorescence intensity after completing the flow exposure phase.
Quantification of Cellular FND Uptake and Retention under Shear Stress
After HUVECs have reached confluency in the channel, a culture medium with the FND suspension was added (2 μg FNDs per mL of EGM2 growth medium). Then, we incubated for 15 h (the timing was chosen for practical reasons, but the uptake time can also be decreased) at 37 °C and 5% CO2. Subsequently, the FND suspension was replaced with a fresh medium, and the channel was connected with a peristaltic pump to produce the desired shear stress. After completing the experiment, cells were washed immediately two times with PBS, fixed with 3.7% paraformaldehyde for 4 min at room temperature, and washed again with PBS. The cells were then permeabilized using 0.5% Triton in PBS. To avoid nonspecific binding, we treated the samples with 5% bovine serum albumin in PBS (PBSA). After that, we used 2 μg/mL phalloidin FITC (Sigma-Aldrich, Zwijndrecht, The Netherlands) to label actin and 4 μg/mL DAPI in 1% PBSA to label the nucleus (Sigma-Aldrich, Zwijndrecht, The Netherlands). The samples were imaged using a Zeiss 780 confocal microscope (Zeiss, Sliedrecht, The Netherlands). 408 nm (0.8%) was chosen as the emission wavelength and 461 nm for collecting the fluorescence of DAPI. 488 nm (6%) and 525 nm were used for excitation of FITC and 561 nm (100%) for FNDs (collected at 650 nm). Here, we used an iLCI Plan-Neofluar 63×/1.3 Imm Korr DIC M27. The following settings for detection were selected: 424–485 (detector gain: 724.4, detector digital gain 1.2), 499–552 (detector gain: 809, detector digital gain 1.1), and 650–741 (detector gain: 992.6, detector digital gain 1). Images were analyzed to quantify the number of FNDs/cell with the 3D object counter plugin of FIJI. The angular orientation of cells with the flow direction was measured through the angle tool of the FIJI software.
Biocompatibility
Biocompatibility was demonstrated for other cells before this was not tested for this specific cell line and conditions. Thus, we performed a 2,5-diphenyl-2H-tetrazolium bromide (MTT) assay to confirm biocompatibility. To this end, HUVEC cells were seeded (120,000 cells/well) in clear flat-bottom 96-well plates and incubated until the confluency reached. Then, cells were incubated with 2 μg/mL FNDs. After 12 h incubation, 20 μL MTT solution (a 0.75 μg/mL final concentration) was added into each well. The plates were further incubated at 37 °C for 2 h.
After 2 h of incubation, subsequently, cells were washed with PBS and dissolved in 2-propanol. The absorbance at OD = 590 nm was determined using a Synergy HT microplate reader, BioSPX, USA. Untreated cells were used as a negative control. Cells treated with 2 and 5% dimethyl sulfoxide were used as a positive control. Data are available in Figure S5.
Relaxometry
For diamond uptake, we incubated the cells with 2 μg/mL FND suspension for 15 h inside the channel. At the end of incubation, cells were washed with a fresh medium and the channel was connected to a peristaltic pump. Then, the connected channel was placed in the focal point of the diamond magnetometer. We performed a confocal scan to find FNDs inside a single endothelial cell and measured T1 under static conditions, during flow, and after flow at room temperature.
During the T1 measurement, the NV– center was pumped with a laser pulse into the bright ground state. Then, we detected after varying times whether the NV– center was still there or returned to the darker equilibrium already. This process was shortened if there were radicals in the surrounding and can thus be used to quantify the radical concentration in the surrounding. T1 relaxation times are sensitive to magnetic noise and are equivalent to T1 in conventional magnetic resonance imaging but from nanoscale voxels. Since free radicals, as per definition, have a free electron spin, they cause a large signal in this measurement scheme.
These experiments were done by using a homemade magnetometry setup. This setup is similar to what is used in the field and has been described earlier.31−33 In principle, it is a confocal microscope with the ability to perform pulsing in varying time intervals and detecting at specific time points. We used a 100× magnification oil objective (Olympus, UPLSAPO 100X0). For this purpose, we used 5 μs long laser pulses (532 nm) separated by dark times (τ) between 200 ns and 10 ms. The detection was done using an avalanche photodiode (Excelitas, SPCM-AQRH) after passing through a 550 nm long-pass filter. To obtain a sufficient signal to noise ratio, we repeated the pulse sequence 10,000 times for each T1 measurement. Each T1 measurement took around 30 min. The laser power should be low enough to prevent damage in the cell. On the other hand, the power needs to be high enough to polarize the NV centers sufficiently. 50 μW (measured at the location of the sample) was found earlier to be a good compromise. To test the variability between particles/small aggregates of different sizes, we correlated the count emitted from each particle/aggregate with the measured T1 (see Figure S3).32,33
The data were analyzed using MatLab software version R2018b.
4-Amino-5-methylamino-2′,7′-difluorofluorescein Assay
4-Amino-5-methylamino-2′,7′-difluorofluorescein (DAF-FM) diacetate (Thermo Fisher Scientific, cat no D23844) is a NO* selective fluorescent dye. Here, we used it to measure intracellular NO* fluorescence intensity in HUVECs after shear stress and under static conditions. This dye remains nonfluorescent until it reacts with NO* to form a fluorescent benzotriazole. For the assay, a DAF-FM solution was prepared with the EGM2 culture medium at a concentration of 0.2 μg/mL (from DAF-FM stock solution). With this solution, HUVECs were treated immediately after completing the shear stress experiment for 20 min at 37 °C and 5% CO2. DAF-FM passively diffuses across cellular membranes. At the end of the treatment, cells were washed with a fresh medium and again incubated for 15 min to complete the intracellular DAF-FM de-esterification. During this process, DAF-FM diacetate is converted to the nonpermeable and nonfluorescent DAF-FM, which is converted to triazole in the presence of NO*. Fluorescence images were recorded with a Zeiss 780 using an excitation/emission range of 495/515 nm. The fluorescence intensity of intracellular NO* was quantified with the FIJI software.
Intracellular NO* was quantified from a standard curve which was prepared by using NO* solutions of known concentrations. Nonacetylated DAF-FM (Sigma-Aldrich, USA) was used as a fluorescent probe for NO*. NO* solutions with different concentrations were formed through spontaneous decomposition of spermine NONOate (ab144522, Abcam, UK). Spermine NONOate is stable in alkaline solutions, but at lower pH values, it spontaneously releases 2 mol of NO* per mole of the donor compound in a pH- and temperature-dependent manner. At room temperature and pH 7.4, the half-life of spermine NONOate is 230 min.
For the calibration, the stock solution of spermine NONOate (100 mM in 0.01 M NaOH) was dissolved in the EGM2 medium, containing 5 mM DAF-FM. The initial concentrations of four different spermine NONOate dilutions were 2 μM, 27.3 μM, 100 μM, and 1 mM. Every dilution was incubated at room temperature for 60 min, with samples being taken every 10 min. The samples from consecutive time points were loaded in the microfluidic channel, and their fluorescence intensity was recorded in triplicate using the same settings as for the experiments with cultured cells. The average fluorescence intensity was quantified with FIJI and correlated with theoretical NO* concentrations, calculated from the initial concentration of spermine NONOate and its half-life and incubation time. The resulting calibration curve covered the NO* concentrations, ranging from 0.1 to 279.8 μM.
Dihydroethidium Assay
Dihydroethidium (DHE) (Abcam) was used to detect intracellular superoxide levels. DHE enters the cells and is oxidized by O2*– superoxide to ethidium, which binds to DNA to produce bright red fluorescence. DHE has been widely used for fluorescence microscopy measurements of intracellular superoxide.44 In this study, DHE solution (2 μg/mL) was prepared with the EGM2 medium and added to HUVEC cells immediately after the shear stress experiment. Then, the cells were incubated for 10 min at 37 °C and 5% CO2. Subsequently, cells were washed with the ice-cold EGM2 medium, and 2D confocal images were taken with a Zeiss 780 confocal microscope (Zeiss, Sliedrecht, The Netherlands). The DHE excitation and emission wavelengths are 514 and 580 nm, respectively. The mean fluorescence intensity was quantified using FIJI software. Each experiment was repeated three times, and the number of cells per experiment was more than 50.
To quantify intracellular superoxide, we prepared a concentration versus fluorescence curve by using differently concentrated superoxide solutions with a fixed volume of DHE. Superoxide was generated by the chemical reaction between xanthin (Sigma, X7375) and xanthin oxidase (Sigma, X4376, bovine milk). Each superoxide solution was prepared in an Eppendorf tube in the confocal room and immediately poured into the microfluidic channel to take confocal images using the same settings used for the HUVEC cells. These images were assessed using the FIJI software to quantify the mean fluorescence intensity.
Statistical Analysis
Statistical analysis of all data was conducted by using GraphPad prism version 8. Significance was tested by using the one-way analysis of variance (ANOVA) test and Tukey post hoc test. Significance was tested compared to the static group and defined as ns p > 0.05, *p ≤ 0.05, **p ≤ 0.01, ***p ≤ 0.001, ****p ≤ 0.0001.
Results
Effect of Shear Stress on Retaining FNDs inside HUVECs
To determine FND uptake under static conditions and retaining inside the cells under flow, we incubated cells with the FND suspension for 15 h in both groups under static conditions. Then, the old medium was replaced with a fresh medium in both groups. The shear stress group was subsequently exposed to the desired shear stress. After flow exposure, both groups were fixed and stained. Representative images are shown in Figure 2A. Similar to what we have observed in previous work, FNDs appear to be located near the nucleus.45 A further analysis of this finding is shown in Figure S4. Figure 2C,D shows the number of FNDs per cell in the static and shear stress groups. Figure 2C shows the number of FNDs per cell after 30 min under different magnitudes of shear stress of 2, 10, and 20 dyne/cm2. The FND numbers after incubation under static conditions and under flow from 2 to 20 dyne/cm2 (mimicking conditions in veins in the lower shear stress regime and arteries in the higher shear stress regime) for 4 h and a flow of 2 dyne/cm2 for 4 h are quantified in Figure 2D.
Figure 2.

Confocal images of HUVECs with FNDs (red spots) in microfluidic channels under static and different shear stress conditions (A). White arrows indicate the flow direction during the shear stress experiments. The orientation angle between the cell’s long axis and the flow direction is shown in (B). Particle numbers after 30 min of exposure to 2, 10, and 20 dyne/cm2 are shown in (C) and those after exposure to shear stress between 2–20 and 2 dyne/cm2 for 4 h are shown in (D). The data are shown by a box and whisker plot, where upper and lower dots represent upper values from the upper quartile and lower values from the lower quartile, respectively. The middle line represents the median of the data. Whiskers show 10–90 percentile. In every experiment, FNDs/cell were quantified in 50 cells per group. Each experiment was repeated three independent times. Data were analyzed by using one-way ANOVA, followed by the Tukey post hoc test. The significance level was ****p < 0.0001.
Cells which were exposed to a shear stress of 2 and 10 dyne/cm2 for 30 min contained an equal average number of nanoparticles per cell to the static group. On the other hand, after 30 min at 20 dyne/cm2, significantly lower numbers of FNDs/cell, ****p < 0.0001, were found in Figure 2C than on the static group. A gradually increased flow between 2 and 20 dyne/cm2 and a flow of 2 dyne/cm2 for 4 h lead to an equal number of FNDs per cell compared to the static group. Next, we investigated the cell morphology. One important parameter is the orientation angle, the angle between the long axis of the cell and the direction of flow. In endothelial monolayers, the average orientation angle with respect to the flow direction is shown in Figure 2B.
This orientation angle experiment did not show significant differences between shear stress groups and the static group. Some investigations have found that actin redistribution and cell orientation occurred within 1–2 h,46−48 while others proved that the processes take much longer (8–24 h).49,50 Several reasons are responsible for different observations in different experiments, including species of origin, passage number, the substrate on which the cells are grown, confluency, and importantly media and sera that are employed.51
Effect of Shear Stress on Radical Generation
Long-Term Stress
The effect of shear stress on the overall radical concentration in HUVECs was evaluated based on the results of the T1 measurements. To enable detection of free radicals in a cell under shear stress, we performed T1 measurements. We first selected an FND in a single cell and recorded T1 before, during, and after the flow sequence. T1 values gradually decreased with increasing flow rate, which means that more free radicals are formed, as shown in Figure 3A1. There was a significant decrease in T1 (*p < 0.0233) at 20 dyne/cm2 compared with the static condition before flow. To exclude any influences the flow might have on particles themselves, we also measured FNDs without HUVEC cells as a control (see Figure 3A2). For these experiments, FNDs were immobilized on the surface by incubating the channels for 15 h with the 2 μg/mL FND solution. Then, the solution was replaced, and we applied a shear stress. In this case, T1 did not change in any of the flow conditions.
Figure 3.

Relaxation time (T1) curves with and without HUVECs under different flow rates are shown in (A). T1 gradually decreased when increasing the flow rate from 2 to 20 dyne/cm2 (A1). (A2) T1 for a control condition where we measured the response of an FND exposed to the same flow conditions without cells. In (A3), cells were exposed to 2 dyne/cm2 for 4 h. (B1) Intracellular nitric oxide (NO*) concentration under a static condition, 2–20 and 2 dyne/cm2 for 4 h (B2) Intracellular superoxide concentrations under a static condition, 2–20 dyne/cm2 and 2 dyne/cm2 for 4 h, are shown. (C,D) Confocal images of intracellular nitric oxide (green) and superoxide (red) in HUVECs under different flow conditions. The scale bar is 15 μm. For conventional DAF_FM and DHE assays, the data are shown by a box and whisker plot, where upper and lower dots represent upper values from the upper quartile and lower values from the lower quartile, respectively. The middle line represents the median of the data. Whiskers show 10–90 percentile. Each experiment was repeated three independent times. Significance was tested against the control group, and statistical analysis was done by a one-way ANOVA test, followed by the Tukey post hoc test (****p < 0.0001, *p < 0.05, **p < 0.01).
Additionally, we performed a control experiment to evaluate the effect of time. To this end, we exposed HUVECs to 2 dyne/cm2 for 4 h without changing the flow rate. Under these conditions, we did not observe any significant differences compared to the static condition, as presented in Figure 3A3. Representative raw data are shown in Figure S7.
These results were compared with outcomes of two conventional methods. DHE was used to evaluate the concentration of intracellular superoxide, whereas DAF-FM was used as a specific marker of intracellular nitric oxide.
In the case of shear stress between 2 and 20 dyne/cm2, the intracellular concentration of NO* increased significantly (****p < 0.0001), while the O2*– concentration decreased significantly (**p < 0.01) compared to the static controls. Here 2 dyne/cm2 for 4 h showed a decrease of NO* concentration and a significant increase of O2*– concentrations (****p < 0.0001) compared to the static variants (Figure 3B1,B2). In the physiological range of laminar shear stresses, superoxide production is reduced and vascular tone is maintained by increasing the nitric oxide concentration. In this present study (Figure 3B), we gradually increased shear stress after every 30 min on HUVECs from the venous to arterial range of 2–20 dyne/cm2. Cells gradually adapt under steadily increased shear stress by increasing NO* production52 and reduce superoxide levels. Prolonged shear stress of less than 4 dyne/cm2 is responsible for atherosclerosis due to overproduction of superoxide.2 In this study, 4 h at 2 dyne/cm2 significantly increased superoxide production and decreased nitric oxide production.
Short-Term Stress
While we measured long-term exposure to flow in the previous section, we here investigated exposure of just 30 min. Also in this section, we measured T1 before, during, and after flow. In the case of 2 and 10 dyne/cm2 for 30 min, T1 values decrease slightly during flow. However, after flow, T1 values recover to the original values. However, during 20 dyne/cm2, T1 values increased when exposing cells to flow and further increased after flow, as shown in Figure 4A, indicating a decrease in free-radical concentration inside cells.
Figure 4.

Free-radical generation after 30 min exposure to shear stresses of 2, 10, and 20 dyne/cm2. (A) T1 relaxation time in HUVECs before, during, and after flow to 2, 10, and 20 dyne/cm2. In (B1), intracellular nitric oxide (NO*) concentrations under static conditions and 2, 10, and 20 dyne/cm2 for 30 min are shown. (B2) Intracellular superoxide (O2•–) concentrations under static conditions and 2, 10, and 20 dyne/cm2 for 30 min. (C) Confocal images of cells stained for intracellular nitric oxide (green) and (D) intracellular O2•– (red). The scale bar is 15 μm. For conventional DAF_FM and DHE assays, the data are shown by box and whisker plots, where upper and lower dots represent upper values from the upper quartile and lower values from the lower quartile, respectively. The middle line represents the median of the data. Whiskers show 10–90 percentile. Each experiment was repeated three independent times. Significance was tested against the control group. Statistical analysis was done by a one-way ANOVA test, followed by the Tukey post hoc test; ns > 0.05, *p < 0.05, **p < 0.01, ***p < 0.001, ****p < 0.0001.
Here, we also compared with the conventional fluorescence assays. In Figure 4B,B1, we show that exposure of HUVECs with 2 dyne/cm2 increased the nitric oxide concentration significantly (****p < 0.0001) and 10 dyne/cm2 showed no significant difference compared to the static group, while a flow of 20 dyne/cm2 significantly decreased the NO* concentration (****p < 0.0001) compared to the static condition.
HUVECs under 2 and 10 dyne/cm2 for 30 min reduced the intracellular O2•– concentration significantly compared to the static conditions (****p < 0.0001), while 20 dyne/cm2 showed a significant increase (****p < 0.0001) (Figure 4B,B2). Oscillatory and disturbed shear stress increases superoxide production and causes atherosclerosis.49 In this study, a sudden atrial range of shear stress of 20 dyne/cm2 on HUVECs for 30 min increased superoxide production and reduced NO* production. A venous shear stress of 2 dyne/cm2 reduced superoxide production and increased the NO* levels and maintained the physiological conditions. On the other hand, 30 min of a sudden shear stress of 10 dyne/cm2 on HUVECS did not alter NO* production but significantly reduced superoxide levels.
Discussion
The most important finding of this paper is that FNDs are able to detect intracellular free-radical concentrations in real time in HUVECs under different magnitudes and durations of shear stress. While conventional methods reveal the history of the sample, our method allows to measure the current status. This is advantageous since it reveals more information about the dynamics of radical formation. Additionally, this allows to detect the radicals where they have been generated, while in conventional methods, the dyes might diffuse to a different location. On the other hand, revealing the history of the sample is advantageous, for instance, for the most short-lived species, since we do not need to detect them during their lifetime but only after they have reacted with the dye. Compared to conventional dyes, FNDs have the disadvantage of being less uniform. However, T1 provides nanoscale spatial resolution and allows long-term measurements from a specific cell. As a result, one can perform a measurement on a cell, make an intervention (adding shear stress in this case), and then measure the same cell with the same particle again. This allows to differentiate between biological variability and the effect from the intervention. In contrast, the conventional methods are from an ensemble of cells. It is also important to exclude other factors that might influence the measurements. We have shown that the influence of pH (between 6.4 and 8) and temperature (between 25 and 55 °C) is negligible in the relevant range here but might need to be considered if larger changes are expected.33 Additionally, our method is sensitive to the sum of radicals that are present, while conventional techniques are usually sensitive to either a specific radical or a large class of reactive molecules including radicals and nonradicals. This can be an advantage or disadvantage depending on the research question. If the overall redox status is of interest, it is clearly a downside that the method is not sensitive to the more abundant nonradical species. Another clear disadvantage of our method is that a relatively large diamond particle is needed for sensing. However, it needs to be mentioned that only a very small number of diamonds per cell (one for the measurement, but to speed up finding a particle, we typically use 5–10) are needed, while for dye-based methods, typically millions of molecules per cells are required.
We investigated real-time free-radical production in a single cell before, during, and after flow conditions under shear stress. We investigated conditions ranging from those typically found in veins to those in arteries (2, 10, and 20 dyne/cm2 for 30 min). We have also investigated how cells respond to shear stress between 2–20 and 2 dyne/cm2 for 4 h.
We found that the number of FNDs decreased significantly when HUVECs were subjected to the shear stress of 20 dyne/cm2. The observed phenomena could be related to the generation of extracellular vesicles (EVs). Shear stress in blood vessels is a well-known trigger for EV release from endothelial cells53,54 Hergenreider et al. reported that endothelial cells exposed to physiological arterial shear-stress levels (20 dyne/cm2) released EVs enriched in atheroprotective molecules.55 Andriola Silva et al. loaded cells with particles, which were then released into EVs under applied stress conditions. It has been shown that various particles, such as iron oxide and gold nanoparticles as well as quantum dots, were successfully encapsulated into EVs using this strategy.56 Therefore, we postulate that in our studies, some of the FNDs were excreted as the content of EVs formed in response to the elevated shear stress. Nevertheless, even under a higher flow, we were able to keep enough nanodiamond probes inside the cells to detect free radicals with T1 measurements.
Our studies show that different flow patterns may induce free-radical production to different extents. A shear stress of 2 dyne/cm2 for 30 min and 2–20 dyne/cm2 for 4 h increased the intracellular free-radical load. This experiment is comparable to an experiment in the literature where steadily increasing shear stress from 2 to 8 and 12 dyne/cm2 for 6 h showed a significant increase in NO* production in HUVECs.57 10 dyne/cm2 for 30 min did not show any significant difference in NO* concentration or overall radical load (determined by T1). This agrees with Wahyudi et al., who explored a low arterial shear stress (10 dyne/cm2) for 15 min on HUVECs and did not show significant differences in NO* concentration compared to a static group. A venous shear stress of 6 dyne/cm2 on the other hand significantly increased NO* production compared to the control group.58 This can be explained by a finding by Rita Alevriadou et al., who demonstrated that a shear stress of 10 dyne/cm2 activates antioxidants, such as glutathione reductase, glutathione peroxidase, and catalase.59 This resulted in a balance of intracellular free-radical concentration. On the other hand, a flow of 2 dyne/cm2 for 4 h reduced the intracellular NO* concentration; however, we do not see a significant change in T1 values. This difference can be explained by an increase in the concentration of other radicals or the specific cells/locations within the cell not being affected by the change. Cells exposed to a flow of 20 dyne/cm2 for 30 min reduced radical production during flow and even further after flow. On the other hand, we observed an increase in radical load when cells are exposed to a flow of 2–20 dyne/cm2 for 4 h, which was further confirmed by DAF-FM and DHE analysis. This and other studies have clearly shown that both the shear stress level and the duration of flow are important factors that can affect NO* generation. The same factors influence the superoxide production. Chiu et al. have shown that a shear stress of 20 dyne/cm2 led to an increase of intracellular superoxide level in ECs.60 The same conclusions can be driven based on our studies. Furthermore, the laminar flow above 20 dyne/cm2 for 15 min resulted in a 0.5- to 1.5-fold increase of intracellular superoxide.61 We have reported a decrease in the superoxide level during a gradual increase of shear stress level up to 20 dyne/cm2 for 4 h. Other authors have reported that a steady high shear stress (30 or 75 dyne/cm2 for 24 h) suppressed superoxide generation.62,63 However, these studies are all from large ensembles of cells measuring the history of the cells. In contrast, our technique provides real-time data from single cells.
Conclusions
Our aim was real-time detection of free-radical concentrations in HUVECs under different shear stress conditions. We measured the free-radical concentration before, during, and after flow. Our technique clearly showed different free-radical loads in HUVECs depending on the magnitude and duration of shear stress. Since our method offers real-time measurements, we can shine light on changes in radical loads over time. Further, we can investigate cells at a single-cell level with subcellular resolution during the entire course of the experiment. This new technique can be applied for detecting free-radical concentrations in shear stress-induced cardiovascular diseases such as atherosclerosis and thrombosis and can help in the development of the new medical treatments.
Acknowledgments
Fellowship A.Mo. acknowledges a Lembaga Pengelola Dana Pendidikan (LPDP) scholarship from the Republic of Indonesia. A.N. thanks the Graduate School of Medical Sciences University of Groningen for a PhD scholarship. R.Sc. is thankful for support via the ERC starting grant ERC-2016-StG-714289 and a VIDI grant (016.Vidi.189.002). V.G.D. was supported by a Marie Skłodowska-Curie scholarship (838494—MagnetoVirology) of the European Commission. Rokshana Sharmin is supported by the Bangabandhu Fellowship. The authors would like to specially thank Timara Kuiper for her skilled support regarding HUVEC culture. All imaging was performed at the UMCG Imaging and Microscopy Center (UMIC). The authors would also like to thank Klaas Sjollema for his help in setting up the imaging.
Supporting Information Available
The Supporting Information is available free of charge at https://pubs.acs.org/doi/10.1021/acssensors.1c01582.
Calibration data for nitric oxide and superoxide, fluorescence intensity corresponding to radical (NO* and O2–*) concentration, correlations between particle size and T1, data on the volume of FND aggregation and the distance of FNDs from the nucleus, data on viability of HUVECs after 12 h FND incubation, and maximum retention time of FNDs before exocytosis data (PDF)
Author Contributions
∥ R.S. and T.H. contributed equally.
The authors declare no competing financial interest.
Supplementary Material
References
- Sheikh S.; Rainger G. E.; Gale Z.; Rahman M.; Nash G. B. Exposure to fluid shear stress modulates the ability of endothelial cells to recruit neutrophils in response to tumor necrosis factor-alpha: a basis for local variations in vascular sensitivity to inflammation. Blood 2003, 102, 2828–2834. 10.1182/blood-2003-01-0080. [DOI] [PubMed] [Google Scholar]; Epub 2003 Jun 26. PMID: 12829609
- Malek A. M.; Alper S. L.; Izumo S. Hemodynamic shear stress and its role in atherosclerosis. JAMA 1999, 282, 2035–2042. 10.1001/jama.282.21.2035. [DOI] [PubMed] [Google Scholar]; PMID: 10591386
- Rajendran P.; Rengarajan T.; Thangavel J.; Nishigaki Y.; Sakthisekaran D.; Sethi G.; Nishigaki I. The Vascular Endothelium and Human Diseases. Int. J. Biol. Sci. 2013, 9, 1057–1069. 10.7150/ijbs.7502. [DOI] [PMC free article] [PubMed] [Google Scholar]
- Langer D. A.; Shah V. H. Nitric oxide and portal hypertension: interface of vasoreactivity and angiogenesis. J. Hepatol. 2006, 44, 209–216. 10.1016/j.jhep.2005.10.004. [DOI] [PubMed] [Google Scholar]; Epub 2005 Nov 4. PMID: 16297493
- Murphy M. P. Nitric oxide and cell death. Biochim. Biophys. Acta 1999, 1411, 401–414. 10.1016/s0005-2728(99)00029-8. [DOI] [PubMed] [Google Scholar]; PMID: 10320672
- Zhou M.; Yu Y.; Hu K.; Mirkin M. V. Nanoelectrochemical approach to detecting short-lived intermediates of electrocatalytic oxygen reduction. J. Am. Chem. Soc. 2015, 137, 6517–6523. 10.1021/ja512482n. [DOI] [PubMed] [Google Scholar]; Epub 2015 May 15. PMID: 25978070
- Endo K.; Miyasaka T.; Mochizuki S.; Aoyagi S.; Himi N.; Asahara H.; Tsujioka K.; Sakai K. Development of a superoxide sensor by immobilization of superoxide dismutase. Sens. Actuators, B 2002, 83, 30–34. 10.1016/S0925-4005(01)01024-3. [DOI] [Google Scholar]
- Scheller W.; Jin W.; Ehrentreich-Förster E.; Ge B.; Lisdat F.; Büttemeier R.; Wollenberger U.; Scheller F. W. Cytochrome C based superoxide sensor for in vivo application. Electroanalysis 1999, 11, 703–706. . [DOI] [Google Scholar]
- Duanghathaipornsuk S.; Farrell J. E.; Ana C. A. R.; Zelenay P.; Kim S. D. Detection Technologies for Reactive Oxygen Species: Fluorescence and Electrochemical Methods and Their Applications. Biosensors 2021, 11, 30.PMID: 33498809. PMCID: PMC7911324 10.3390/bios11020030. [DOI] [PMC free article] [PubMed] [Google Scholar]
- Wang Y.; Wang D.; Sun L.-H.; Xue P.; Wang M.-Q.; Lu Z.; Wang F.; Xia Q.; Xu M.-W.; Bao S.-J. Constructing high effective nano-Mn3(PO4)2-chitosan in situ electrochemical detection interface for superoxide anions released from living cell. Biosens. Bioelectron. 2019, 133, 133–140. 10.1016/j.bios.2019.03.029. [DOI] [PubMed] [Google Scholar]; Epub 2019 Mar 16. PMID: 30925362
- Towner R. A.; Garteiser P.; Bozza F.; Smith N.; Saunders D.; d’Avila J. C. P.; Magno F.; Oliveira M. F.; Ehrenshaft M.; Lupu F.; Silasi-Mansat R.; Ramirez D. C.; Gomez-Mejiba S. E.; Mason R. P.; Castro Faria-Neto H. C. In vivo detection of free radicals using molecular MRI and immuno-spin trapping in a mouse model for amyotrophic lateral sclerosis. Free Radic. Biol. Med. 2013, 65, 828–837. 10.1016/j.freeradbiomed.2013.08.172. [DOI] [PubMed] [Google Scholar]
- Towner R. A.; Smith N.; Saunders D.; De Souza P. C.; Henry L.; Lupu F.; Silasi-Mansat R.; Ehrenshaft M.; Mason R. P.; Gomez-Mejiba S. E.; Ramirez D. C. Combined molecular MRI and immuno-spin-trapping for in vivo detection of free radicals in orthotopic mouse GL261 gliomas. Biochim. Biophys. Acta, Mol. Basis Dis. 2013, 1832, 2153–2161. PMID: 23959048 DOI: 10.1016/j.bbadis.2013.08.004. [DOI] [PubMed] [Google Scholar]
- Kalyanaraman B.; Perez-Reyes E.; Mason R. P. Spin-trapping and direct electron spin resonance investigations of the redox metabolism of quinone anticancer drugs. Biochim. Biophys. Acta, Gen. Subj. 1980, 630, 119–130. 10.1016/0304-4165(80)90142-7. [DOI] [PubMed] [Google Scholar]
- Szychowski K. A.; Rybczyńska-Tkaczyk K.; Leja M. L.; Wójtowicz A. K. Tetrabromobisphenol A (TBBPA)-stimulated reactive oxygen species (ROS) production in cell-free model using the 2′, 7′-dichlorodihydrofluorescein diacetate (H 2 DCFDA) assay—limitations of method. Environ. Sci. Pollut. Res. 2016, 23, 12246–12252. 10.1007/s11356-016-6450-6. [DOI] [PMC free article] [PubMed] [Google Scholar]
- Gomes A.; Fernandes E.; Lima J. L. F. C. Fluorescence probes used for detection of reactive oxygen species. J. Biochem. Biophys. Methods 2005, 65, 45–80. 10.1016/j.jbbm.2005.10.003. [DOI] [PubMed] [Google Scholar]; Epub 2005 Nov 4. PMID: 16297980
- Georgiou C. D.; Papapostolou I.; Grintzalis K. Superoxide radical detection in cells, tissues, organisms (animals, plants, insects, microorganisms) and soils. Nat. Protoc. 2008, 3, 1679–1692. 10.1038/nprot.2008.155. [DOI] [PubMed] [Google Scholar]; PMID: 18846095
- Taylor J. M.; Cappellaro P.; Childress L.; Jiang L.; Budker D.; Hemmer P. R.; Yacoby A.; Walsworth R.; Lukin M. D. High-sensitivity diamond magnetometer with nanoscale resolution. Nat. Phys. 2008, 4, 810–816. 10.1038/nphys1075. [DOI] [Google Scholar]
- Grinolds M. S.; Hong S.; Maletinsky P.; Luan L.; Lukin M. D.; Walsworth R. L.; Yacoby A. Nanoscale magnetic imaging of a single electron spin under ambient conditions. Nat. Phys. 2013, 9, 215–219. 10.1038/nphys2543. [DOI] [Google Scholar]
- Cujia K. S.; Boss J. M.; Herb K.; Zopes J.; Degen C. L. Tracking the precession of single nuclear spins by weak measurements. Nature 2019, 571, 230–233. 10.1038/s41586-019-1334-9. [DOI] [PubMed] [Google Scholar]
- Mamin H. J.; Kim M.; Sherwood M. H.; Rettner C. T.; Ohno K.; Awschalom D. D.; Rugar D. Nanoscale nuclear magnetic resonance with a nitrogen-vacancy spin sensor. Science 2013, 339, 557–560. 10.1126/science.1231540. [DOI] [PubMed] [Google Scholar]; PMID: 23372008
- Thiel L.; Rohner D.; Ganzhorn M.; Appel P.; Neu E.; Müller B.; Kleiner R.; Koelle D.; Maletinsky P. Quantitative nanoscale vortex imaging using a cryogenic quantum magnetometer. Nat. Nanotechnol. 2016, 11, 677–681. 10.1038/NNANO.2016.63. [DOI] [PubMed] [Google Scholar]
- Juraschek D. M.; Meier Q. N.; Trassin M.; Trolier-McKinstry S. E.; Degen C. L.; Spaldin N. A.; Spaldin N. A. Dynamical Magnetic Field Accompanying the Motion of Ferroelectric Domain Walls. Phys. Rev. Lett. 2019, 123, 127601. 10.1103/PhysRevLett.123.127601. [DOI] [PubMed] [Google Scholar]
- Waxman A.; Schlussel Y.; Groswasser D.; Acosta V. M.; Bouchard L. S.; Budker D.; Folman R. Diamond magnetometry of superconducting thin films. Phys. Rev. B: Condens. Matter Mater. Phys. 2014, 89, 054509. 10.1103/physrevb.89.054509. [DOI] [Google Scholar]
- Loretz M.; Pezzagna S.; Meijer J.; Degen C. L. Nanoscale nuclear magnetic resonance with a 1.9-nm-deep nitrogen-vacancy sensor. Appl. Phys. Lett. 2014, 104, 033102. 10.1063/1.4862749. [DOI] [Google Scholar]
- Staudacher T.; Shi F.; Pezzagna S.; Meijer J.; Du J.; Meriles C. A.; Reinhard F.; Wrachtrup J. Nuclear magnetic resonance spectroscopy on a (5-nanometer)3 sample volume. Science 2013, 339, 561–563. 10.1126/science.1231675. [DOI] [PubMed] [Google Scholar]
- Ermakova A.; Pramanik G.; Cai J.-M.; Algara-Siller G.; Kaiser U.; Weil T.; Tzeng Y.-K.; Chang H. C.; McGuinness L. P.; Plenio M. B.; et al. Detection of a Few Metallo-Protein Molecules Using Color Centers in Nanodiamonds. Nano Lett. 2013, 13, 3305–3309. 10.1021/nl4015233. [DOI] [PubMed] [Google Scholar]
- Steinert S.; Ziem F.; Hall L. T.; Zappe A.; Schweikert M.; Götz N.; Aird A.; Balasubramanian G.; Hollenberg L.; Wrachtrup J. Magnetic spin imaging under ambient conditions with sub-cellular resolution. Nat. Commun. 2013, 4, 1607. 10.1038/ncomms2588. [DOI] [PubMed] [Google Scholar]
- Glenn D. R.; Lee K.; Park H.; Weissleder R.; Yacoby A.; Lukin M. D.; Lee H.; Walsworth R. L.; Connolly C. B. Single-cell magnetic imaging using a quantum diamond microscope. Nat. Methods 2015, 12, 736–738. 10.1038/nmeth.3449. [DOI] [PMC free article] [PubMed] [Google Scholar]
- Tetienne J.-P.; Hingant T.; Rondin L.; Cavaillès A.; Mayer L.; Dantelle G.; Gacoin T.; Wrachtrup J.; Roch J.-F.; Jacques V. Spin relaxometry of single nitrogen-vacancy defects in diamond nanocrystals for magnetic noise sensing. Phys. Rev. B: Condens. Matter Mater. Phys. 2013, 87, 235436. 10.1103/PhysRevB.87.235436. [DOI] [Google Scholar]
- Rendler T.; Neburkova J.; Zemek O.; Kotek J.; Zappe A.; Chu Z.; Cigler P.; Wrachtrup J. Optical imaging of localized chemical events using programmable diamond quantum nanosensors. Nat. Commun. 2017, 8, 14701. 10.1038/ncomms14701. [DOI] [PMC free article] [PubMed] [Google Scholar]
- Perona Martínez F.; Nusantara A. C.; Chipaux M.; Padamati S. K.; Schirhagl R. Nanodiamond Relaxometry-Based Detection of Free-Radical Species When Produced in Chemical Reactions in Biologically Relevant Conditions. ACS Sens. 2020, 5, 3862–3869. 10.1021/acssensors.0c01037. [DOI] [PMC free article] [PubMed] [Google Scholar]; Epub 2020 Dec 3. PMID: 33269596
- Morita A.; Nusantara A. C.; Martinez F. P. P.; Hamoh T.; Damle V. G.; van der Laan K. J.; Sigaeva A.; Vedelaar T.; Chang M.; Chipaux M.; Schirhagl R.. Quantum monitoring the metabolism of individual yeast mutant strain cells when aged, stressed or treated with antioxidant. 2020, arXiv:2007.16130. arXiv preprint arXiv:2007.16130. [Google Scholar]
- Nie L.; Nusantara A. C.; Damle V. G.; Sharmin R.; Evans E. P. P.; Hemelaar S. R.; Van der Laan K. J.; Li R.; Perona Martinez F. P.; Vedelaar T.; Chipaux M.; Schirhagl R. Quantum monitoring of cellular metabolic activities in single mitochondria. Sci. Adv. 2021, 7, eabf0573 10.1126/sciadv.abf0573. [DOI] [PMC free article] [PubMed] [Google Scholar]
- Shenderova O. A.; Shames A. I.; Nunn N. A.; Torelli M. D.; Vlasov I.; Zaitsev A. Review Article: Synthesis, properties, and applications of fluorescent diamond particles. J. Vac. Sci. Technol., B: Nanotechnol. Microelectron.: Mater., Process., Meas., Phenom. 2019, 37, 030802. 10.1116/1.5089898. [DOI] [PMC free article] [PubMed] [Google Scholar]
- Krueger A.; Lang D. Function is key: Recent Progress in the surface Modification of Nanodiamond. Adv. Funct. Mater. 2012, 22, 890–906. 10.1002/adfm.201102670. [DOI] [Google Scholar]
- Schirhagl R.; Chang K.; Loretz M.; Degen C. L. Nitrogen-vacancy centers in diamond: nanoscale sensors for physics and biology. Annu. Rev. Phys. Chem. 2014, 65, 83–105. Epub 2013 Nov 21. PMID: 24274702 10.1146/annurev-physchem-040513-103659. [DOI] [PubMed] [Google Scholar]
- Hemelaar S. R.; de Boer P.; Chipaux M.; Zuidema W.; Hamoh T.; Martinez F. P.; Nagl A.; Hoogenboom J. P.; Giepmans B. N. G.; Schirhagl R. Nanodiamonds as multi-purpose labels for microscopy. Sci. Rep. 2017, 7, 720. 10.1038/s41598-017-00797-2. [DOI] [PMC free article] [PubMed] [Google Scholar]; PMID: 28389652; PMCID: PMC5429637
- Schrand A. M.; Huang H.; Carlson C.; Schlager J. J.; O̅sawa E.; Hussain S. M.; Dai L. Are diamond nanoparticles cytotoxic?. J. Phys. Chem. B 2007, 111, 2–7. 10.1021/jp066387v. [DOI] [PubMed] [Google Scholar]; PMID: 17201422
- Mochalin V. N.; Shenderova O.; Ho D.; Gogotsi Y. The properties and applications of nanodiamonds. Nat. Nanotechnol. 2011, 7, 11–23. 10.1038/nnano.2011.209. [DOI] [PubMed] [Google Scholar]; PMID: 22179567
- Svenskaya Y.; Garello F.; Lengert E.; Kozlova A.; Verkhovskii R.; Bitonto V.; Ruggiero M. R.; German S.; Gorin D.; Terreno E. Biodegradable polyelectrolyte/magnetite capsules for MR imaging and magnetic targeting of tumors. Nanotheranostics 2021, 5, 362–377. 10.7150/ntno.59458. [DOI] [PMC free article] [PubMed] [Google Scholar]
- Fang C.-Y.; Vaijayanthimala V.; Cheng C.-A.; Yeh S.-H.; Chang C.-F.; Li C.-L.; Chang H.-C. The exocytosis of fluorescent nanodiamond and its use as a long-term cell tracker. Small 2011, 7, 3363–3370. 10.1002/smll.201101233. [DOI] [PubMed] [Google Scholar]; Epub 2011 Oct 14. PMID: 21997958
- Mohan N.; Chen C.-S.; Hsieh H.-H.; Wu Y.-C.; Chang H.-C. In vivo imaging and toxicity assessments of fluorescent nanodiamonds in Caenorhabditis elegans. Nano Lett. 2010, 10, 3692–3699. 10.1021/nl1021909. [DOI] [PubMed] [Google Scholar]; PMID: 20677785
- Morita A.; Martinez F. P. P.; Chipaux M.; Jamot N.; Hemelaar S. R.; van der Laan K. J.; Schirhagl R. Cell Uptake of Lipid-Coated Diamond. Part. Part. Syst. Char. 2019, 36, 1900116. 10.1002/ppsc.201900116. [DOI] [Google Scholar]
- Jones C. I. III; Han Z.; Presley T.; Varadharaj S.; Zweier J. L.; Ilangovan G.; Alevriadou B. R. Endothelial cell respiration is affected by the oxygen tension during shear exposure: role of mitochondrial peroxynitrite. Am. J. Physiol. Cell Physiol. 2008, 295, C180–C191. Epub 2008 May 14. PMID: 18480296; PMCID: PMC2493556 10.1152/ajpcell.00549.2007. [DOI] [PMC free article] [PubMed] [Google Scholar]
- van der Laan K. J.; Naulleau J.; Damle V. G.; Sigaeva A.; Jamot N.; Perona-Martinez F. P.; Chipaux M.; Schirhagl R. Toward using fluorescent nanodiamonds to study chronological aging in Saccharomyces cerevisiae. Anal. Chem. 2018, 90, 13506–13513. 10.1021/acs.analchem.8b03431. [DOI] [PubMed] [Google Scholar]
- Tzima E.; del Pozo A.; Shattil S. J.; Chien S.; Schwartz A. M. Activation of integrins in endothelial cells by fluid shear stress mediates Rhodependent cytoskeletal alignment. EMBO J. 2001, 20, 4639–4647. 10.1093/emboj/20.17.4639. [DOI] [PMC free article] [PubMed] [Google Scholar]
- Wojciak-Stothard B.; Ridley A. J. Shear stress-induced endothelial cell polarization is mediated by Rho and Rac but not Cdc42 or PI 3-kinases. J. Biol. Chem. 2003, 161, 429–439. 10.1083/jcb.200210135. [DOI] [PMC free article] [PubMed] [Google Scholar]; PMID: 12719476 PMCID: PMC2172912
- Ridley A. J.; Schwartz M. A.; Burridge K.; Firtel R. A.; Ginsberg M. H.; Borisy G.; Parsons J. T.; Horwitz A. R. Cell migration: integrating signals from front to back. Science 2003, 302, 1704–1709. 10.1126/science.1092053. [DOI] [PubMed] [Google Scholar]
- Mccue S.; Noria S.; Langille L. B. Shear-Induced Reorganization of Endothelial Cell Cytoskeleton and Adhesion Complexes. Trends Cardiovasc. Med. 2004, 14, 143–151. 10.1016/j.tcm.2004.02.003. [DOI] [PubMed] [Google Scholar]
- Lampugnani M. G.; Corada M.; Caveda L.; Breviario F.; Ayalon O.; Geiger B.; Dejana E. The molecular organization of endothelial cell to cell junctions: differential association of plakoglobin, h-catenin, and a-catenin with vascular endothelial cadherin (VE-cadherin). J. Cell Biol. 1995, 129, 203–217. 10.1083/jcb.129.1.203. [DOI] [PMC free article] [PubMed] [Google Scholar]
- Noria S.; Cowan D. B.; Gotlieb A. I.; Langille B. L. Transient and steady-state effects of shear stress on endothelial cell adherens junctions. Circ. Res. 1999, 85, 504–514. 10.1161/01.res.85.6.504. [DOI] [PubMed] [Google Scholar]
- Hwang J.; Saha A.; Boo Y. C.; Sorescu G. P.; McNally J. S.; Holland S. M.; Dikalov S.; Giddens D. P.; Griendling K. K.; Harrison D. G.; et al. Oscillatory Shear Stress Stimulates Endothelial Production of O2 from p47phox-dependent NAD(P)H Oxidases, Leading to Monocyte. J. Biol. Chem. 2003, 278, 47291–47298. 10.1074/jbc.m305150200. [DOI] [PubMed] [Google Scholar]
- Ridger V. C.; Boulanger C. M.; Angelillo-Scherrer A.; Badimon L.; Blanc-Brude O.; Bochaton-Piallat M. L.; Boilard E.; Buzas E. I.; Caporali A.; Dignat-George F.; et al. Microvesicles in vascular homeostasis and diseases. Thromb. Haemostasis 2017, 117, 1296–1316. 10.1160/TH16-12-0943. [DOI] [PubMed] [Google Scholar]
- Vion A.-C.; Ramkhelawon B.; Loyer X.; Chironi G.; Devue C.; Loirand G.; Tedgui A.; Lehoux S.; Boulanger C. M. Shear stress regulates endothelial microparticle release. Circ. Res. 2013, 112, 1323–1333. 10.1161/CIRCRESAHA.112.300818. [DOI] [PubMed] [Google Scholar]; Epub 2013 Mar 27. PMID: 23536307
- Hergenreider E.; Heydt S.; Tréguer K.; Boettger T.; Horrevoets A. J. G.; Zeiher A. M.; Scheffer M. P.; Frangakis A. S.; Yin X.; Mayr M.; et al. Atheroprotective communication between endothelial cells and smooth muscle cells through miRNAs. Nat. Cell Biol. 2012, 14, 249–256. 10.1038/ncb2441. [DOI] [PubMed] [Google Scholar]
- Andriola Silva A. K.; Di Corato R.; Pellegrino T.; Chat S.; Pugliese G.; Luciani N.; Gazeau F.; Wilhelm C. Cell-derived vesicles as a bioplatform for the encapsulation of theranostic nanomaterials. Nanoscale 2013, 5, 11374–11384. 10.1039/c3nr01541f. [DOI] [PubMed] [Google Scholar]; Epub 2013 Jul 5. PMID: 23827988
- Noris M.; Morigi M.; Donadelli R.; Aiello S.; Foppolo M.; Todeschini M.; Orisio S.; Remuzzi G.; Remuzzi A. Nitric oxide synthesis by cultured endothelial cells is modulated by flow conditions. Circ. Res. 1995, 76, 536–543. 10.1161/01.res.76.4.536. [DOI] [PubMed] [Google Scholar]; PMID: 7534657
- Wahyudi S.; Wardana; Widodo A. Shear Stress Analysis of Synthesis and Nitric Oxide Release from Huvecs Exposed to Supraphysiologic Glucose Mater. Sci. Eng. 2019, 494, 012060. 10.1088/1757-899X/494/1/012060. [DOI] [Google Scholar]
- Jones C. I. III; Zhu H.; Martin S. F.; Han Z.; Li Y.; Rita Alevriadou B. Regulation of antioxidants and phase 2 enzymes by shear-induced reactive oxygen species in endothelial cells. Ann. Biomed. Eng. 2007, 35, 683–693. 10.1007/s10439-007-9279-9. [DOI] [PubMed] [Google Scholar]; Epub 2007 Mar 6. PMID: 17340195
- Chiu J. J.; Wung B. S.; Shyy J. Y. J.; Hsieh H. J.; Wang D. L. Reactive oxygen species are involved in shear stress-induced intercellular adhesion molecule-1 expression in endothelial cells. Arterioscler. Thromb. Vasc. Biol. 1997, 17, 3570–3577. 10.1161/01.atv.17.12.3570. [DOI] [PubMed] [Google Scholar]; PMID: 9437207
- Goettsch C.; Goettsch W.; Brux M.; Haschke C.; Brunssen C.; Muller G.; Bornstein S. R.; Duerrschmidt N.; Wagner A. H.; Morawietz H. Arterial flow reduces oxidative stress via an antioxidant response element and Oct-1 binding site within the NADPH oxidase 4 promoter in endothelial cells. Basic Res. Cardiol. 2011, 106, 551–561. 10.1007/s00395-011-0170-3. [DOI] [PubMed] [Google Scholar]
- Mohan S.; Koyoma K.; Thangasamy A.; Nakano H.; Glickman R. D.; Mohan N. Low shear stress preferentially enhances IKK activity through selective sources of ROS for persistent activation of NF-kappa B in endothelial cells. Am. J. Physiol. Cell Physiol. 2007, 292, C362–C371. 10.1152/ajpcell.00535.2005. [DOI] [PubMed] [Google Scholar]
- White S. J.; Hayes E. M.; Lehoux S.; Jeremy J. Y.; Horrevoets A. J. G.; Newby A. C. Characterization of the differential response of endothelial cells exposed to normal and elevated laminar shear stress. J. Cell. Physiol. 2011, 226, 2841–2848. 10.1002/jcp.22629. [DOI] [PMC free article] [PubMed] [Google Scholar]
Associated Data
This section collects any data citations, data availability statements, or supplementary materials included in this article.