Figure 4.

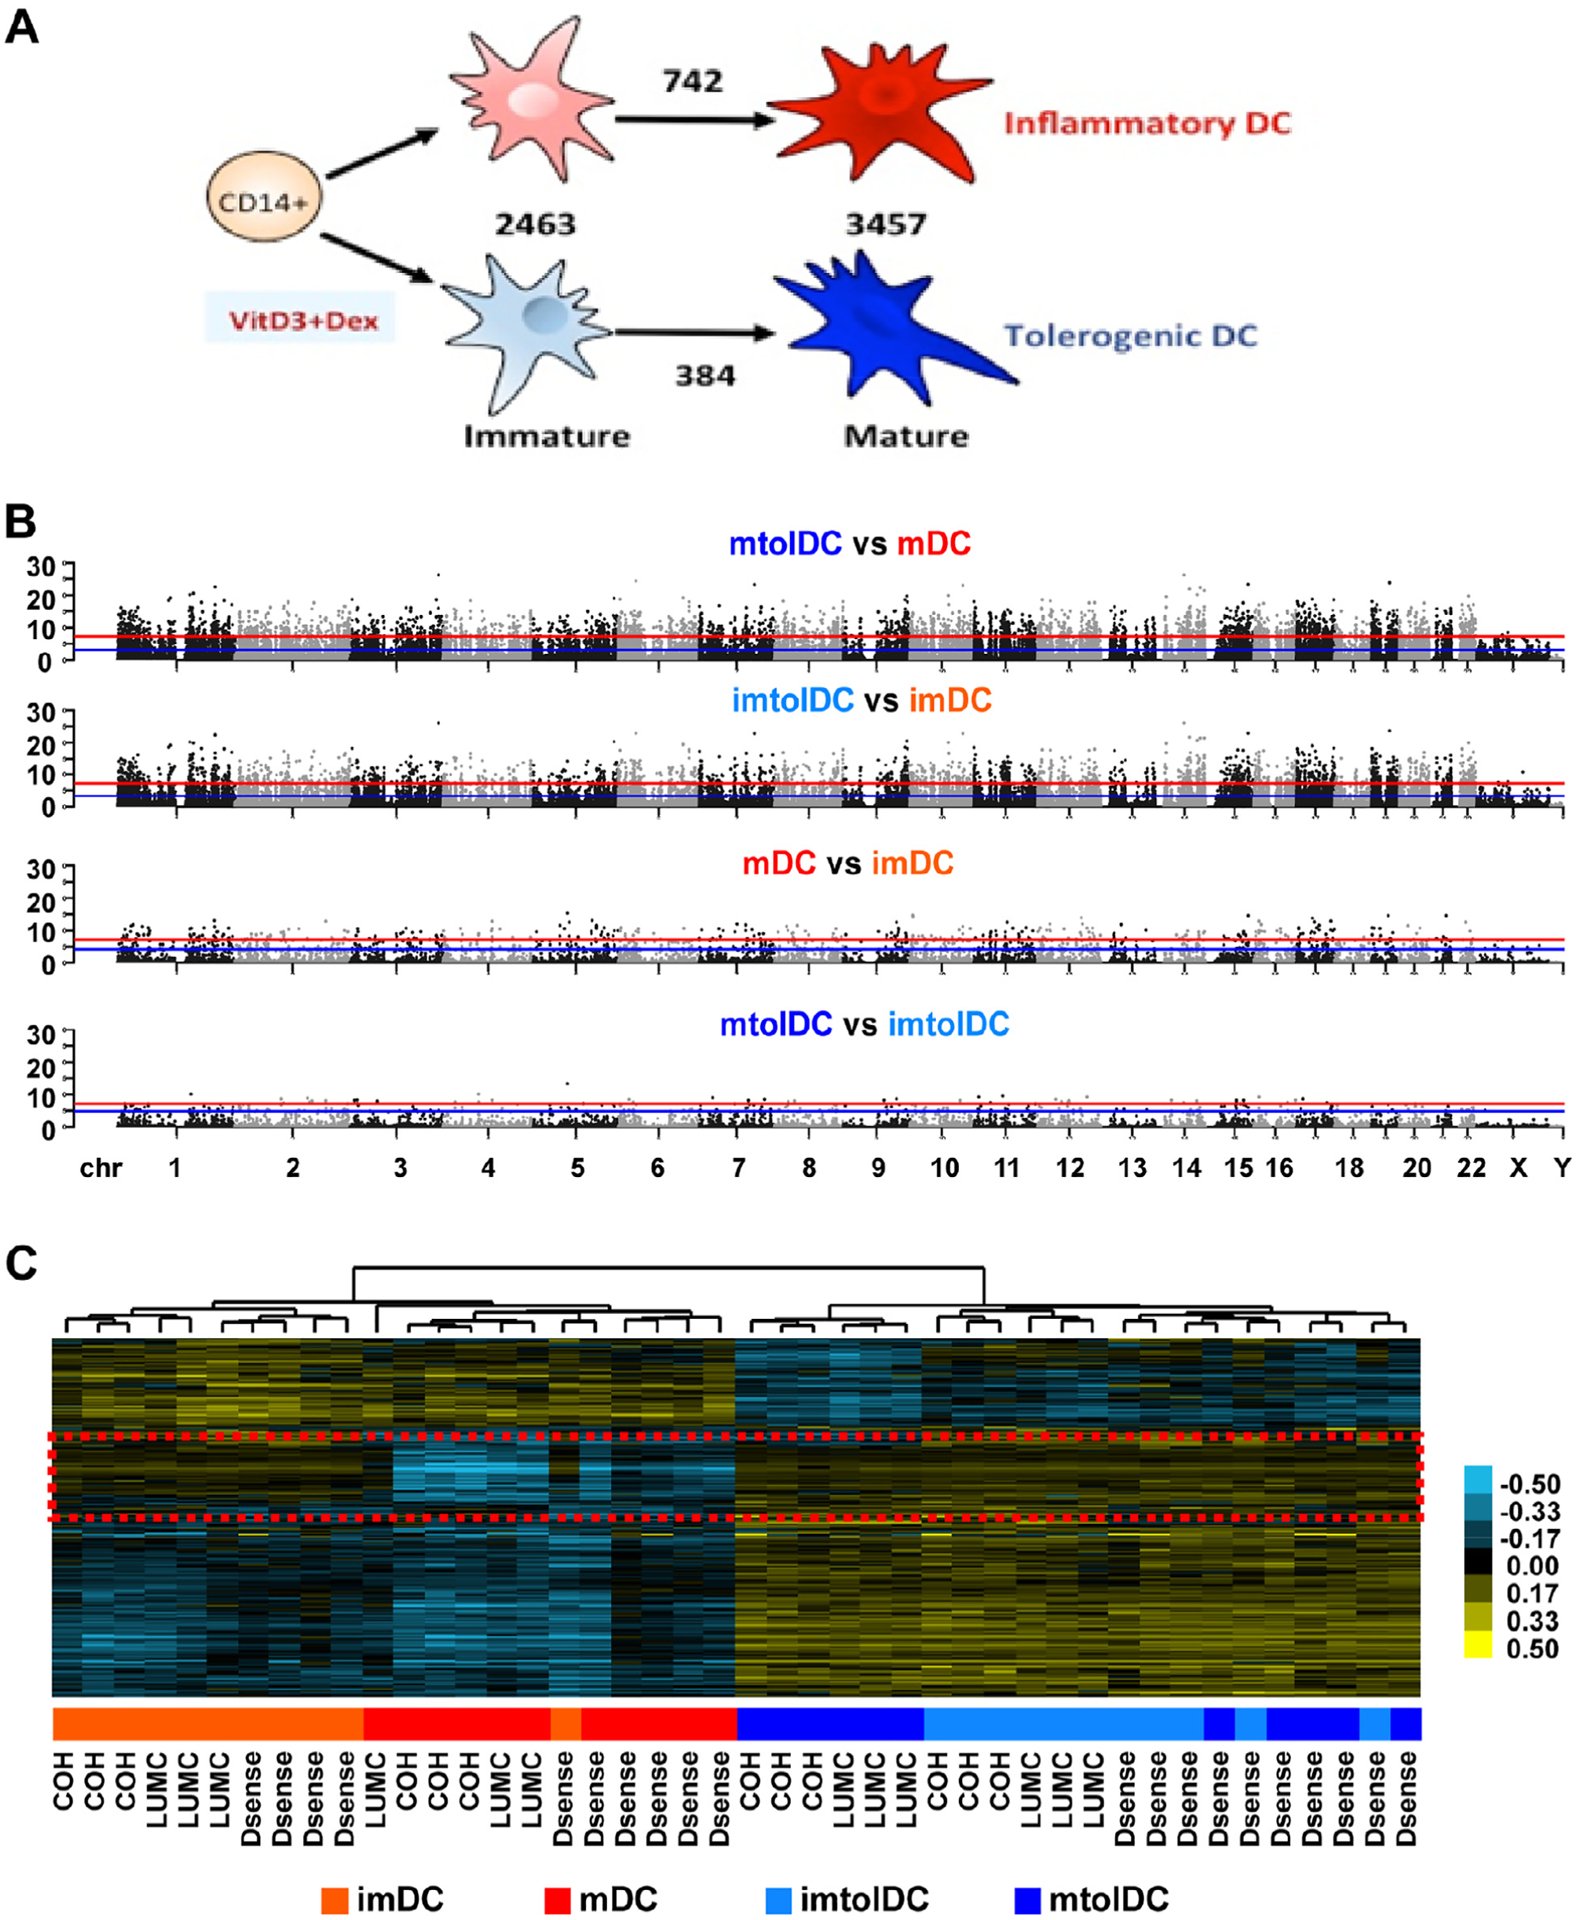
The differential DNA methylation profile of tolerogenic compared with inflammatory DCs is present at the immature state and is unaffected by location or T1D status. Genomic DNA was isolated at the immature and mature stages of DC production and subjected to DNA methylation profiling with Infinium MethylationEPIC arrays. Inflammatory imDCs are shown in light red, mDCs in dark red, imtolDCs in light blue and mtolDCs in dark blue. (A) Schematic representation of mDC versus tolDC culture and numbers of DMCs between different cell type comparisons. (B) Manhattan plots depicting the DNA methylation difference between different cell types, as indicated above the plot, across the human hg19 genome. Each dot represents one CpG, whose genomic location is represented by the x-axis and significance level in logarithm format by the y-axis. The red line represents Bonferroni-adjusted P 0.05, and the blue line represents FDR at 5%. Dots located above the lines are considered DMCs at corresponding confidence level. (C) Heatmap depicting all DMCs identified in at least one comparison shown in B after unsupervised hierarchical clustering analyses. Each row represents one DMC, and each column represents one sample. Blue indicates DNA methylation below the average of all samples, whereas yellow indicates DNA methylation above the average, with the intensity level shown in the color bar. Each sample’s group information is presented using a colored box below the heatmap, with color definitions indicated in the legend at the bottom of the panel and clinic locations where each sample was obtained indicated at the bottom of the heatmap. The red dashed box indicates a region of interest further analyzed in supplementary Table 3. Dex, dexamethasone; FDR, false discovery rate; imDC, immature DC; imtolDC, immature tolDC; mtolDC, mature tolDC.
