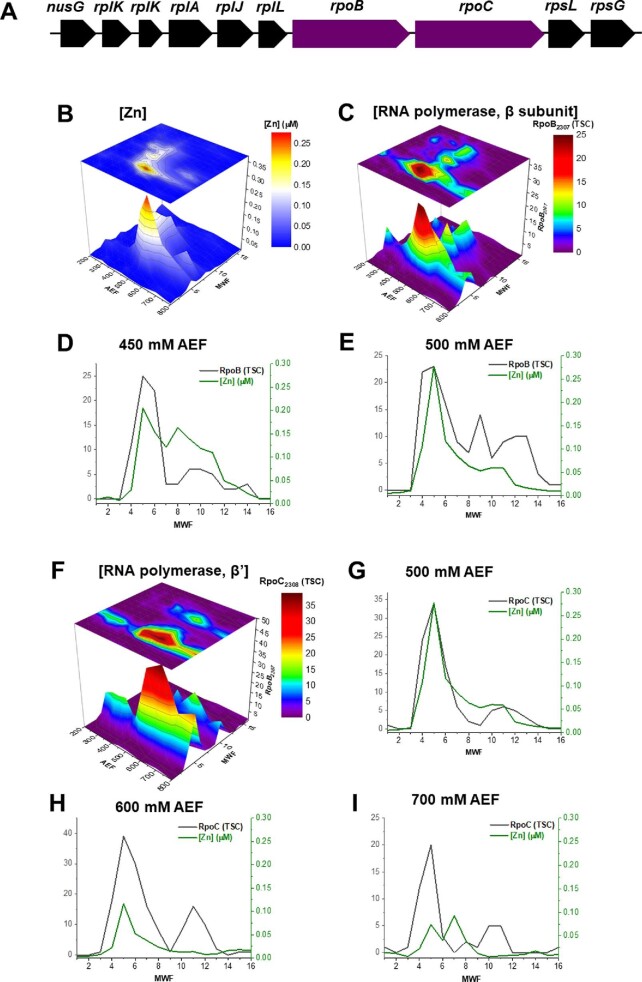
Fig. 2.
(A) Gene neighborhood diagram showing RpoB and RpoC being flanked by a series of ribosomal proteins. The following panels compare (B) the distribution of cytosolic Zn with (C) that of the distribution of RpoB in metalloproteome space. (D, E) Comparison of the distributions of RpoB and Zn at the 450 and 500 mM NaCl fractions. The distribution of RpoC in metalloproteome space (F) can also be compared with the distributions of the Zn in the cytosolic metalloproteome, within the 500, 600, and 700 mM NaCl fractions (G–I).

