

Abstract
Cyclic dinucleotide signaling systems are found ubiquitously throughout nature allowing organisms to rapidly and dynamically sense and respond to alterations in their environments. In recent years, the secondary messenger, cyclic di-(3’,5’)-adenosine monophosphate (c-di-AMP), has been identified as an essential signaling molecule in a diverse array of bacterial genera. We and others have shown that defects in c-di-AMP homeostasis result in severe physiological defects and virulence attenuation in many bacterial species. Despite significant advancements in the field, there is still a major gap in the understanding of the environmental and cellular factors that influence c-di-AMP dynamics due to a lack of tools to sensitively and rapidly monitor changes in c-di-AMP levels. To address this limitation, we describe here the development of a luciferase-based coupled enzyme assay that leverages the cyclic nucleotide phosphodiesterase, CnpB, for the sensitive and high throughput quantification of 3’3’-c-di-AMP. We also demonstrate the utility of this approach for the quantification of the cyclic oligonucleotide-based anti-phage signaling system (CBASS) effector, 3’3’-cGAMP. These findings establish CDA-Luc as a more affordable and sensitive alternative to conventional c-di-AMP detection tools with broad utility for the study of bacterial cyclic dinucleotide physiology.
Graphical Abstract

CDA-Luc: The M. tuberculosis cyclic dinucleotide phosphodiesterase, CnpB, is leveraged to establish
a coupled enzyme assay, which facilitates high throughput quantification of the bacterial signaling molecule 3’3’-c-di-AMP. This assay can be carried out in 96-well plate format and read out using a standard luminescence plate reader, replacing conventional LC-MS-based quantification assays.
INTRODUCTION
Cyclic dinucleotide (CDN) second messengers have emerged as conserved signaling molecules across all domains of life. In response to altered environmental cues, CDN levels dynamically fluctuate through regulated synthesis by cyclic dinucleotide synthases and degradation by phosphodiesterases (PDEs) [1,2]. In bacteria, cyclic dinucleotides regulate a myriad of biological processes including central metabolism, cell wall homeostasis, osmoregulation, biofilm formation, motility, virulence and anti-phage immunity by modulating the activity of a diverse suite of protein and riboswitch effectors, which collectively coordinate a cellular response [1–12]. Additionally, bacterial cyclic dinucleotides have also been shown to interface with receptors of the metazoan innate immune system where they activate pro-inflammatory cytokine and autophagy pathways to sterilize the host of offending microorganisms [13–19].
Among these nucleotide small molecules, cyclic di-(3’,5’)-adenosine monophosphate (3’3’-c-di-AMP, c-di-AMP or CDA) has been shown to play an essential role in regulating the lifestyles of a diverse range of clinically significant bacterial genera [10,20]. Within these bacterial species, cyclic di-AMP production is mediated by a conserved family of diadenylate cyclase (DAC) domain containing proteins, of which, five classes have been characterized to date [10]. Degradation of CDA is catalyzed by dedicated phosphodiesterase enzymes, which fall into two major classes: DHH-DHHA1 (aspartate-histidine-histidine) domain or HD (histidine-aspartate) domain containing proteins [10,21]. Although the mechanisms of CDA synthesis and degradation are quite conserved, the arsenal of c-di-AMP receptors appears to vary among bacterial species [10]. This may allow the output of c-di-AMP signaling systems to be tailored to the individual needs of specific bacteria.
Despite significant advancements in the understanding of the components of bacterial c-di-AMP signaling networks, a detailed understanding of the environmental and cellular cues that regulate CDA homeostasis are lacking. A few studies have attempted to answer this question, mostly through the use of genetic approaches [4,8,9,22,23]. These studies revealed a role for potassium and glutamate availability in the regulation of c-di-AMP synthesis, underscoring the importance of this molecule in maintaining osmotic balance [8,9,23]. Additionally, both DHH-DHHA1-type and HD-type phosphodiesterases have been shown to be inhibited by the alarmone (p)ppGpp, suggesting a link between amino acid starvation and cyclic di-AMP signaling [21,24]. Nevertheless, understanding of c-di-AMP regulation is still rudimentary and high-throughput, unbiased genetic and phenotypic screens to identify the factors that regulate CDA dynamics have not been performed.
Such studies are currently intractable due to the lack of tools to sensitively, affordably and rapidly quantify c-di-AMP levels. A sensitive liquid chromatography mass-spectrometry (LC-MS) based assay for CDA detection and quantification was previously described; however, mass-spectrometry based approaches are low throughput and require technical knowledge as well as access to expensive machinery [13,21]. RNA-aptamer based biosensors for c-di-AMP as well as other CDNs have been developed; unfortunately, these sensors typically have low affinities for their cognate CDNs (~3–30 μM for c-di-AMP) [25]. More recently, commercial enzyme immunoassays (EIAs) have become available for the quantification of several cyclic dinucleotide species. While these assays have reasonable throughput, they can be quite costly and have narrow dynamic ranges, which limits their utility in high-throughput screening campaigns. To address these limitations, here, we describe the development of a luciferase-based coupled-enzyme assay termed CDA-Luc to quantify 3’3’-c-di-AMP. This assay can be paired with conventional ATP detection assays to sensitively and affordably quantify c-di-AMP over a broad dynamic range and is likely to enable fundamental discoveries relating to c-di-AMP physiology.
RESULTS
Selection of a suitable 3’3’-c-di-AMP phosphodiesterase
Recently, a luciferase based coupled enzyme assay for quantification of the metazoan CDN 2’3’-cGAMP (cGAMP-Luc) was described [26]. This assay takes advantage of the mammalian phosphodiesterase ectonucleotide pyrophosphatase (ENPP1), which hydrolyzes 2’3’-cGAMP to GMP and AMP. Following cleavage, AMP is subsequently phosphorylated to ADP by the enzyme polyphosphate:AMP phosphotransferase (PAP). Next, the enzyme myokinase is utilized to phosphorylate ADP to ATP. Finally, the ATP produced by the coupled-enzyme assay can be quantified using a conventional ATP detection kit. We hypothesized that a similar approach could be utilized to develop a sensitive assay to quantitate 3’3’-c-di-AMP. Several classes of CDA phosphodiesterase have been identified to date; however, many of these enzymes are incompatible with this approach as they linearize c-di-AMP to 5’-pApA rather than separating the two fused nucleotides. In addition, many of these enzymes are integral membrane proteins, making them challenging to work with and difficult to produce in large quantities (Figure 1) [10]. Fortunately, a small group of soluble, AMP-producing CDA phosphodiesterases have been identified, of which the Mycobacterium tuberculosis PDE, cyclic nucleotide phosphodiesterase B (CnpB), has been best characterized [27–32]. Thus, we hypothesized that Mtb CnpB would be an optimal candidate for a coupled enzyme-based c-di-AMP quantification assay.
Figure 1. Mechanisms of 3’3’-c-di-AMP hydrolysis.

Overview of 3’3’-c-di-AMP hydrolysis by phosphodiesterases (PDEs). Group I PDEs hydrolyze 3’3’-c-di-AMP to the linear dinucleotide 5’-pApA. Group II PDEs hydrolyze 3’3’-c-di-AMP to 5’-AMP. Group II PDEs can also hydrolyze 5’-pApA to 5’-AMP.
Optimization of CnpB hydrolytic activity
We began by optimizing the in vitro reaction conditions in order to maximize CnpB hydrolytic activity. Recombinant hexahistidine-tagged CnpB was produced in E. coli and purified to apparent homogeneity in a single-step using Ni2+ affinity chromatography (Figure 2a). We next monitored the activity of CnpB towards bis-p-nitrophenyl phosphate (BNPP) a non-specific, colorimetric reporter substrate for phosphatase and phosphodiesterase enzymes. Consistent with previous reports, we observed no enzymatic activity in the absence of added metal cations (Figure 2b and c) [27–30]. We next tested CnpB activity against a panel of divalent metal ions. Among this array, CnpB activity was highest in the presence of Mn2+ and completely absent in the presence of Mg2+ (Figure 2b and c). Minor activity was observed with other metal cations including Co2+; however, as Mn2+ resulted in the highest activity, it was selected for all future assays. As some metal ions have been shown to interfere with downstream steps in the AMP detection assay, we next titrated MnCl2 in order to determine the minimal concentration required for full CnpB activity [26]. Based on these assays, we concluded that a minimum concentration of approximately 30 μM MnCl2 is required for optimal activity (Figure 2d). Finally, as phosphodiesterase activity is highly sensitive to pH, CnpB activity was monitored across a pH gradient (Figure 2e). Consistent with previous reports, CnpB activity was highest at alkaline pH with a pH optimum of approximately 8.5 (Figure 2e) [27–30]. Taken together, a buffer formulation of [Tris-Cl pH 8.5, 0.1 mM MnCl2, 100 mM NaCl] was selected for all future assays.
Figure 2. Optimization of CnpB hydrolytic activity.

(a) SDS-PAGE analysis of NiNTA purified M. tuberculosis CnpB. (b-e) BNPP hydrolysis activity of CnpB. (b) 500 nM CnpB was incubated with 0.2 mM BNPP in the presence and absence of 0.1 mM indicated metal ions for 5 minutes at 37°C and absorbance at 405 nm was recorded. (c) Increasing concentrations of CnpB were incubated with 0.2 mM BNPP in the presence and absence of 0.1 mM MnCl2 at 37°C and absorbance at 405 nm was monitored. (d) 15 nM CnpB was incubated with 0.2 mM BNPP and increasing concentrations of MnCl2 at at 37°C and absorbance at 405 nM was monitored. (e) 15 nM CnpB was incubated with 0.2 mM BNPP and 0.1 mM MnCl2 in pH 5–9.5 reaction buffer at 37°C and absorbance at 405 nm was monitored. In all panels, data are presented as mean ± standard deviation of n=3 replicates.
Analysis of CnpB 3’3’-c-di-AMP binding and hydrolysis
Having optimized the activity of CnpB using the mock-substrate BNPP, we next sought to directly monitor CnpB hydrolytic activity against 3’3’-c-di-AMP under these assay conditions. To that end, [32P]-labeled 3’3’-c-di-AMP was enzymatically synthesized and affinity purified to near homogeneity (Figure 3a). CnpB binding to 3’3’-c-di-AMP was confirmed by differential radial capillary action of ligand assay (DRaCALA). As a positive control, the mammalian c-di-AMP binding protein reductase controlling NF-κb (RECON) was employed, yielding a Kd of 68 nM [14]. In the absence of MnCl2, binding of 3’3’-c-di-AMP to CnpB was weak and non-saturating with a Kd > 17 μM (Figure 3b). Interestingly, addition of MnCl2 to the binding buffer appeared to enhance the affinity of CnpB towards CDA by five-fold with a Kd of approximately 3 μM (Figure 3b). These results were in agreement with the previously reported low micromolar Km of CnpB for 3’3’-c-di-AMP [27–30]. Additionally, these results support a role for Mn2+ in enhancing substrate binding in addition to increasing catalytic activity.
Figure 3. Analysis of CnpB 3’3’-c-di-AMP binding and hydrolysis.

(a) Thin layer chromatography (TLC) analysis of enzymatically synthesized [32P] 3’3’-c-di-AMP and [32P] ATP standard. Data are representative of several independent experiments. (b) DRaCALA analysis of 3’3’-c-di-AMP binding to RECON and CnpB in presence and absence of 0.1 mM MnCl2. data are presented as mean ± standard deviation of n=3 replicates. (c-d) TLC analysis of 3’3’-c-di-AMP hydrolysis by CnpB. (c) ~1 nM [32P] 3’3’-c-di-AMP was incubated with or without 25 μM CnpB in the presence and absence of 0.1 mM MnCl2 for 2 hours at 37°C. Samples were then treated with or without 0.1 U of Alkaline Phosphatase for 1 hour. Samples were then spotted onto TLC plates and separated. Data are representative of n=3 experiments. (d) 1 μM unlabeled 3’3’-c-di-AMP spiked with ~1 nM [32P] 3’3’-c-di-AMP was treated with or without 1 μM CnpB overnight at 37°C. Samples were then spotted onto TLC plates and separated. N=3 replicates are shown.
We next monitored the hydrolytic activity of CnpB by thin layer chromatography (TLC) analysis. We began by testing whether CnpB could cleave nanomolar concentrations of 3’3’-c-di-AMP to AMP, its previously reported product. Trace concentrations (~1 nM) of [32P] labeled c-di-AMP were incubated with CnpB in the presence and absence of MnCl2. After 2 hours, we observed complete hydrolysis of c-di-AMP to a product that migrated slightly slower than the [α−32P] ATP standard (Figure 3c). Interestingly, we also observed complete hydrolysis of CDA in the absence of MnCl2 under these assay conditions, perhaps because only trace quantities of substrate were used (Figure 3c). Addition of alkaline phosphatase completely converted the CnpB product to inorganic phosphate confirming that AMP and not 5’-pApA is indeed the reaction product (Figure 3c). Finally, in order for this approach to be suitable for quantification of 3’3’-c-di-AMP, CnpB must also be capable of completely hydrolyzing low micromolar concentrations of CDA. To test this, we incubated CnpB with 1 μM 3’3’-c-di-AMP spiked with 1 nM [32P] labeled c-di-AMP. After 24 hours, we observed complete hydrolysis of c-di-AMP to AMP with minimal degradation of AMP to adenosine and free inorganic phosphate (Figure 3d). Taken together, these data show that CnpB is capable of completely converting low nanomolar to low micromolar concentrations of CDA to AMP and suggest that this could be a viable approach for a c-di-AMP quantification assay.
Coupling of CnpB with commercially available AMP detection assays
Over the years, several commercial AMP detection assays have been formulated. One such class of assays utilizes luciferase activity as a read out for AMP levels. Of these, the AMP-Glo™ assay is one of the most commonly used. In the first reaction, AMP is converted to ADP by the enzyme PAP using polyphosphate as a substrate. In the next and final step, myokinase is coupled to luciferase. Thus, as ATP is produced by myokinase, it is subsequently utilized by luciferase to oxidize the luciferin substrate producing a luminescence signal (Figure 4a) [26]. Luciferase activity is proportional to the amount of ATP in the sample, enabling quantification. Thus, we began by coupling CnpB to the commercially available AMP-Glo™ assay. Promisingly, we were able to detect AMP produced by CnpB using this assay; however, consistent with previous findings, luciferase activity was not linear when plotted on a standard linear-linear plot greatly limiting the quantitative capabilities of this approach (Figure 4b) [26]. We observed similar non-linearity using purified AMP as the substrate suggesting that this problem is inherent to the assay itself and not the CnpB digestion step (Figure 4c). Interestingly, re-analysis of the data using a log-log plot resulted in a much more linear standard curve for both 3’3’-c-di-AMP and AMP with quantification limits of approximately 7.8 nM (Supplementary Figure 1a and b). In contrast, commercially available luciferase-based ATP detection kits displayed linear standard curves under both analysis methods (Figure 4d and e, Supplementary Figure 1c and d). These results suggest that it is indeed possible to sensitively quantify 3’3’-c-di-AMP using commercially available AMP detection kits with this alternative analysis method; however, the high costs associated with these kits greatly diminishes their utility for high throughput screening campaigns.
Figure 4. Detection of 3’3’-c-di-AMP using conventional AMP-Glo assay.

(a) Schematic overview of AMP and ATP detection methods. (b) Standard curve of CnpB hydrolyzed 3’3’-c-di-AMP using AMP-Glo™ assay. (c) Standard curve of AMP using AMP-Glo™ assay. (d) Standard curve of ATP using Cell Titer Glo® reagent. (e) Standard curve of ATP using Kinase Glo® reagent. In all panels, data are presented as mean ± standard deviation of n=3 replicates.
Development of CDA-Luciferase (CDA-Luc) Assay
Recently, a revised method for AMP-detection, termed AMP-Luc, was described and successfully employed for quantification of 2’3’-cGAMP [26]. Here, the reaction components remained the same as in the AMP-Glo™ assay, but the coupled steps in the assay were rearranged to allow complete conversion of AMP to ATP prior to ATP detection using a conventional luciferase-based ATP detection kit (Figure 5a). This is accomplished by coupling myokinase to PAP instead of luciferase as in the conventional assay. Second, the PAP and myokinase coupled step is allowed to proceed longer (up to three hours) to ensure complete conversion of the AMP to ATP. Simply, rearranging the steps in the assay in this way was shown to dramatically improve the quantitative capabilities of the assay. Encouraged by these findings, we hypothesized that we could couple CnpB with AMP-Luc to generate a robust and affordable method for 3’3’-c-di-AMP quantification. To that end, the enzyme PAP was expressed in E. coli and purified to near homogeneity using a single Ni2+ affinity purification step (Figure 5b and Supplementary Figure 2a). The activity of the purified PAP was confirmed by coupling the enzyme to commercially available myokinase and monitoring ATP production using the Kinase Glo® assay (Figure 5c). We next tested the ability of AMP-Luc to detect CnpB-digested 3’3’-c-di-AMP. Incubation of 3’3’-c-di-AMP with CnpB followed by detection with AMP-Luc resulted in a robust luciferase response that was abolished in the absence of either CDA or CnpB (Figure 5d). Notably, the resulting luminescence signal was stable for at least one hour after addition of the Kinase Glo® reagent, allowing for flexibility in assay design (Supplementary Figure 2b). Thus, these data suggest that the reconfigured AMP-Luc assay could be used to detect 3’3’-c-di-AMP using CnpB.
Figure 5. Quantification of 3’3’-c-di-AMP using CDA-Luc Assay.

(a) Schematic overview of CDA-Luc assay. (b) SDS-PAGE analysis of NiNTA purified A. johnsonii PAP. (c) Optimization of AMP-Luc assay. AMP was incubated with 2 μM PAP and 50 μg mL−1 of sodium hexametaphosphate (PolyP) with or without 1U myokinase for 3 hours followed by incubated with Kinase Glo® reagent for 10 minutes. (d) Z’ factor analysis of CDA-Luc Assay. 1 μM 3’3’-c-di-AMP was treated with or without CnpB overnight and AMP was detected using AMP-Luc assay. (e) Standard curve of AMP using AMP-Luc assay. (f) Standard curve of CnpB hydrolyzed 3’3’-c-di-AMP using AMP-Luc assay. In all panels, data are presented as mean ± standard deviation of n=3 (c, e-f) or n=12 (d) replicates.
We next examined the ability of this assay to quantify AMP. As expected, the AMP-Luc assay yielded a robust standard curve for both AMP and 3’3-c-di-AMP with quantification limits of 31.2 or 7.8 nM, depending on the analysis method (linear-linear vs log-log) (Figure 5e and f, Supplementary Figure 2c and d). Next, we compared the standard curve of 3’3’-c-di-AMP generated using CDA-Luc to the standard curve of pure ATP using Kinase-Glo®. This yielded largely overlapping standard curves with low nanomolar limits of quantification, suggesting that there is no further room for optimization of the CDA-Luc assay (Supplementary Figure 3a). Taken together, these data suggest that this approach is robustly quantitative for 3’3’-c-di-AMP. To be consistent with the nomenclature of preceding literature, we named this assay CDA-Luc [26].
Having optimized the CDA-Luc assay, we next sought to further characterize the limitations of the assay. As this assay relies on ATP-mediated oxidation of luciferin, we hypothesized that there would be an upper limit for c-di-AMP quantification based on the availability of luciferin substrate. To that end, we performed an extended c-di-AMP titration which yielded a standard curve that was linear up to 5 μM (Supplementary Figure 3b). CDA concentrations greater than 5 μM resulted in a departure from linearity. Because each cleaved c-di-AMP molecule yields two AMP molecules, these results were consistent with the 10 μM specification for ATP quantification by the Kinase Glo® reagent.
In addition to cleaving 3’3’-c-di-AMP, CnpB has also been shown to possess some hydrolytic activity towards 3’3’-c-di-GMP, albeit with markedly reduced affinity [27–29]. Many c-di-AMP producing bacteria also encode catalytic machinery for the production and degradation of c-di-GMP. Thus, we wanted to make sure that any GMP produced by hydrolysis of CDG would not interfere with CDA quantification by the CDA-Luc assay. To that end, we generated CDA standard curves in the presence and absence of a fixed (1 μM) concentration of GMP. This yielded overlapping standard curves with similar limits of quantification (Supplementary Figure 3c). Thus, although CnpB is capable of degrading c-di-GMP, its product GMP will not interfere with c-di-AMP quantification by the CDA-Luc assay.
Finally, we wanted to determine whether the CDA-Luc assay could successfully be employed under different buffer conditions. To do this, we previously described chemically defined minimal media for growth of Listeria monocytogenes [13,21]. Growth of L. monocytogenes in this medium enabled the identification of 3’3’-c-di-AMP by mass spectrometry analysis and has since been used by our lab and others to monitor the regulation of c-di-AMP homeostasis [13,21,22]. Thus, known concentrations of 3’3’-c-di-AMP were titrated into L. monocytogenes minimal media supplemented with streptomycin and subjected to digestion with CnpB followed by quantification by AMP-Luc. We observed robust linearity of the CDA-Luc assay in chemically defined media with a quantification limit of 7.8 nM, similar to the standard assay (Supplementary Figure 4a and b). In contrast, conditioned, defined minimal media from ΔdacAΔoppA L. monocytogenes deficient for endogenous c-di-AMP synthesis demonstrated only minor luminescence differences upon titration of pure 3’3’-c-di-AMP suggesting the presence of interferents in the sample (Supplementary Figure 4c) We also tested the performance of CDA-Luc in a commonly used lysis buffer, RIPA buffer. This yielded a mostly linear standard curve with a reduced quantification limit of approximately 62.5 nM, likely due to the presence of detergents in the lysis buffer (Supplementary Figure 4d). These results suggest that CDA-Luc can be employed under various buffer conditions but that interferents can be present in complex biological samples.
RECON enables affinity purification of c-di-AMP from biological samples in a manner compatible with CDA-Luc quantification
Although CDA-Luc is capable of monitoring c-di-AMP levels in chemically defined buffers, quantification of c-di-AMP from complex biological samples is hindered by biological interferents and large quantities of AMP, ADP, and ATP (ANPs), which interfere with the CDA-Luc assay. We and others have previously utilized CDN binding proteins for the purification of cyclic dinucleotides from complex mixtures [5,14,26,33,34]. Most bacterial and host c-di-AMP binding proteins have low micromolar affinities for CDA, limiting their utility for affinity purification as large quantities of recombinant protein would be required [5,10,17,19]. We recently identified a host 3’3’-c-di-AMP binding protein, RECON, which binds to c-di-AMP with a Kd of 68 nM (Figure 3b) [14]. We have also previously utilized RECON affinity purification (RECAP) to specifically capture [32P] labeled c-di-AMP from crude reaction mixtures containing ANPs and free inorganic phosphates (Figure 3a and Figure 6a and b) [33,34]. Thus, we hypothesized that RECAP could be employed as an upstream step to purify 3’3’-c-di-AMP prior to quantification using the CDA-Luc assay.
Figure 6. RECON enables affinity purification of c-di-AMP from biological samples.

(a) SDS-PAGE analysis of NiNTA purified murine RECON. (b) TLC analysis of 3’3’-c-di-AMP using RECON affinity purification. (c) CDA-Luc standard curve of 3’3’-c-di-AMP affinity purified using 2 μM RECON. Data are presented as mean ± standard deviation of n=3 replicates. (d) CDA-Luc standard curve of 3’3’-c-di-AMP affinity purified from L. monocytogenes minimal media using 10 μM RECON. Data are presented as mean ± standard deviation of n=3 replicates. (e) Conditioned minimal media derived from ΔdacAΔoppA L. monocytogenes was doped with known concentrations of pure 3’3’-c-di-AMP and subjected to RECAP prior to CDA-Luc analysis. Limit of quantification was determined to be 7.8 nM. Data are presented as mean ± standard deviation of n=4 replicates. (f) Quantification of intracellular 3’3’-c-di-AMP from lysates of various L. monocytogenes strains using RECON affinity purification and CDA-Luc. Dashed lines indicate the limit of quantification (BLQ denotes below the limit of quantification). Data are presented as mean ± standard deviation of n=4 replicates. (g) Quantification of secreted 3’3’-c-di-AMP from the growth medium of various L. monocytogenes strains using RECON affinity purification and CDA-Luc. Dashed lines indicate the limit of quantification (BLQ denotes below the limit of quantification). Data are presented as mean ± standard deviation of n=3 replicates.
Recombinant hexahistidine-tagged RECON was immobilized onto NiNTA agarose beads and incubated with samples containing known concentrations of 3’3’-c-di-AMP. Following washing, the RECON-CDA complexes were eluted from the beads using imidazole. The resulting supernatant was then boiled to remove the bound c-di-AMP, which was then quantified using CDA-Luc. Quantification of RECON-purified CDA by CDA-Luc resulted in a linear standard curve with a quantification limit of approximately 31.2 nM and a detection limit of 1.2 nM (Figure 6c). Although not tested here, we hypothesize that the quantification limit could be improved further by reducing the volume of elution buffer. We performed a similar analysis using c-di-AMP dissolved in L. monocytogenes chemically defined media. This approach yielded a standard curve with a quantification limit of 39 nM and a dynamic range of 5 nM – 5 μM (Figure 6d). We next sought to determine whether RECAP is able to extract c-di-AMP away from interferents generated from biological samples. Implementing RECAP on conditioned media doped with known concentrations of 3’3’-c-di-AMP as in supplementary figure 4c allowed for high fidelity recovery and detection of c-di-AMP (Figure 6e). Thus, RECAP allows for c-di-AMP quantification in a wide array of samples, even when interferents which disrupt the CDA-Luc assay are present.
Having established the utility of RECON affinity purification for CDA quantification, we next sought to monitor the intracellular and secreted levels of c-di-AMP from various L. monocytogenes strains with altered levels of c-di-AMP production, degradation, and/or secretion. As expected, we observed no c-di-AMP in a L.m. strain deficient for CDA production (ΔdacAΔoppA) (Figure 6f and 6g). Consistent with our previous findings, deficiency of both CDA phosphodiesterases (ΔpgpHΔpdeA) resulted in an approximately four-fold enhancement in both the intracellular and extracellular levels of c-di-AMP as compared to the wildtype (WT) strain (Figure 6f and 6g) [21]. Finally, depletion of TetR (tetR::Tn917), a negative regulator of multidrug resistant transporters that export c-di-AMP, augmented the levels of c-di-AMP secreted into the bacterial growth medium (Figure 6f and 6g). Interestingly, depletion of TetR did not affect intracellular levels of 3’3’-c-di-AMP. We believe that this is due to compensation for enhanced export by increased production and/or decreased degradation of CDA. Taken together, these data demonstrate that pairing of RECON affinity purification (RECAP) with the CDA-Luc assay can enable detection of c-di-AMP from complex biological samples.
Comparison of CDA-Luc to LC-MS
Having optimized and established the utility of CDA-Luc for quantification of 3’3’-c-di-AMP, we next wanted to compare it to the established gold standard for c-di-AMP quantification, LC-MS. To that end, we generated standard curves of known concentrations of c-di-AMP doped with an isotopically labeled internal standard and subjected them to LC-MS analysis. This yielded a robustly linear standard curve with a quantification limit of 50 nM and a dynamic range from 5 nM – 5 μM (Figure 7a and c). Consistent with our previous results, CDA-Luc performed similarly with a limit of quantification of 39 nM (Figure 7b and c). Collectively, these data establish CDA-Luc as a high throughput and affordable alternative to LC-MS based quantification of 3’3’-c-di-AMP without loss of sensitivity.
Figure 7. Comparison of CDA-Luc to Mass Spectrometry (LC-MS).

(a) LC-MS standard curve of 3’3’-c-di-AMP. Known concentrations of c-di-AMP were mixed with 500 nM of (C13 N15) isotopically labeled c-di-AMP (CDA*) and subjected to LC-MS analysis. One representative standard curve of n=1 replicates is shown. (b) CDA-Luc standard curve of 3’3’-c-di-AMP. Data are presented as mean ± standard deviation of n=3 replicates. (c) Plot of estimated [3’3’-c-di-AMP] by interpolation into the standard curve vs the actual concentration for LC-MS from (a) and CDA-Luc from (b).
Quantification of 3’3’-cGAMP using CDA-Luc
Recently, cyclic oligonucleotides have been shown to play an important signaling role in bacterial, innate anti-phage immunity. In this context, cyclic oligonucleotide second messengers are synthesized by cGAS/DncV-like nucleotidyltransferases (CD-NTases) upon infection with bacteriophage [2,11,12]. The resulting second messenger then activates a cognate effector protein culminating in abortive phage infection through the death of the infected cell, thereby protecting the greater bacterial community [2,11,12]. Among the cyclic oligonucleotide-based anti-phage signaling systems (CBASS), 3’3’-cGAMP synthesized by DncV has been the most well studied; nevertheless, the precise mechanisms that trigger 3’3’-cGAMP production remain poorly elucidated. Such studies would benefit from sensitive and affordable quantification tools. Interestingly, CnpB has been shown to possess hydrolytic activity against 3’3’-cGAMP [29]. Thus, we hypothesized that the CnpB-based CDA-Luc assay could also be utilized to quantify 3’3’-cGAMP. To that end, we first confirmed that CnpB could utilize 3’3’-cGAMP using a competitive BNPP hydrolysis assay. CnpB was incubated with BNPP in the presence of increasing concentrations of 3’3’-cGAMP and production of p-nitrophenol was monitored (Figure 8a). Consistently, we observed a dose-dependent decrease in the rate of BNPP hydrolysis in the presence of 3’3’-cGAMP (Figure 8a). Having confirmed utilization of 3’3’-cGAMP by CnpB, we next tested the ability of the CDA-Luc assay to quantify purified 3’3’-cGAMP. This analysis yielded a linear standard curve with a quantification limit of 62.5 nM and a detection limit of approximately 3 nM, in line with the limits of the ENPP1-based cGAMP-Luc assay (Figure 8b) [26]. Taken together, these data demonstrate the utility of CDA-Luc for the quantification of the CBASS second messenger 3’3’-cGAMP.
Figure 8. Quantification of 3’3’-cGAMP using CDA-Luc.
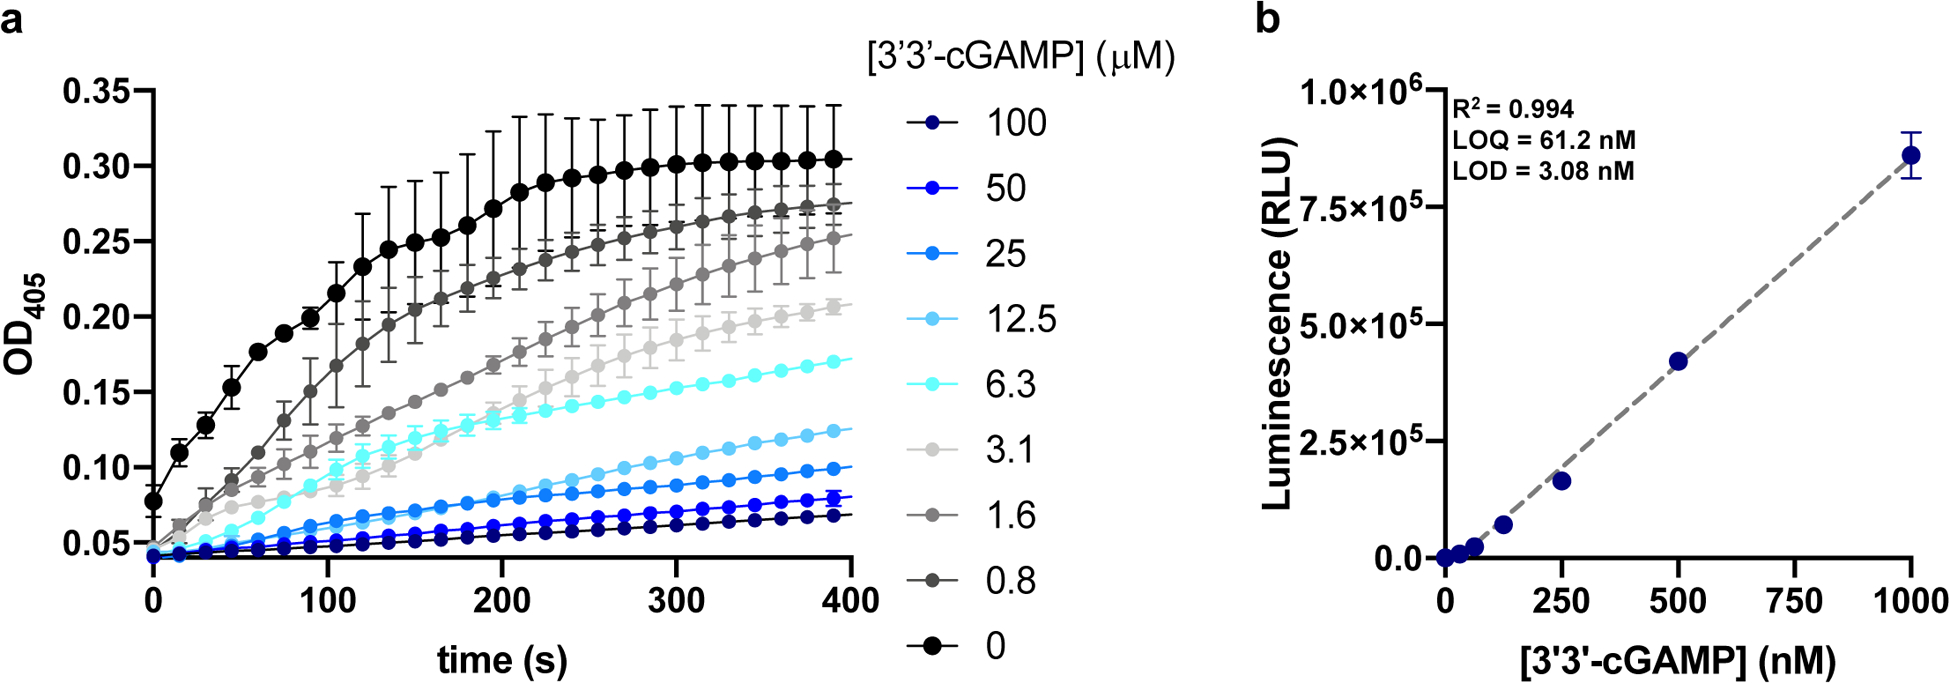
(a) 15 nM CnpB was incubated with 0.1 mM BNPP and 0.1 mM MnCl2 in pH 8.5 reaction buffer in the presence of increasing concentrations of 3’3’-cGAMP and absorbance at 405 nm was monitored. Data are presented as mean ± standard deviation of n=2 replicates. (b) Standard curve of CnpB hydrolyzed 3’3’-cGAMP using AMP-Luc assay. Data are presented as mean ± standard deviation of n=3 replicates.
Conclusion
In this study, we have developed a robustly quantitative, high throughput luminescence-based c-di-AMP detection method. We show that the unique ability of the M. tuberculosis phosphodiesterase CnpB to cleave CDA to AMP can be leveraged for the design of a highly sensitive and precise c-di-AMP quantification assay. CnpB can easily be paired with commercially available AMP detection kits to yield a moderately quantitative c-di-AMP detection method; however, rearrangement of the coupled steps greatly improved the quantitative capabilities of the assay yielding a dynamic range spanning four orders of magnitude while maintaining the general accessibility of this approach. We also show that the high affinity mammalian c-di-AMP binding protein, RECON, can be leveraged to purify c-di-AMP from complex biological mixtures, allowing this method to be used in diverse investigations. Thus, we anticipate that CDA-Luc can be readily employed to replace mass-spectrometry based measurements of c-di-AMP.
Over the last decade, cyclic di-AMP has emerged as a widespread secondary messenger among both environmental and pathogenic microbes [4–7,10]. In bacteria, c-di-AMP has been shown to regulate a number of diverse processes including central metabolism, cell wall homeostasis, osmoregulation, genome integrity, antibiotic resistance, biofilm formation, sporulation, and virulence among others [3–10,23]. These pleiotropic functions of cyclic di-AMP are mediated by a diverse suite of protein and ribonucleotide effectors. Because of these critical functions, c-di-AMP is unique amongst all other cyclic dinucleotides as it is both essential for many bacterial species as well as toxic at elevated concentrations; however, the molecular mechanisms involved in regulation of c-di-AMP synthesis and degradation are still poorly understood [10,20].
Several classes of cyclic di-AMP synthases have been identified to date with the DacA or CdaA family of diadenylate cyclases being the largest [10]. Structurally DacA consists of an N-terminal transmembrane domain and a catalytic C-terminal DAC domain. In many bacterial species, DacA is encoded in a three gene operon consisting of an extracytoplasmic regulatory protein, CdaR or YbbR, and the phosphoglucosamine mutase, GlmM, an enzyme involved in peptidoglycan biosynthesis, both of which have been shown to modulate the activity of DacA—providing evidence for crosstalk between cell wall biosynthesis and c-di-AMP signaling networks [10,35,36]. In addition to synthesis, degradation of c-di-AMP must be dynamically regulated in order to allow bacteria to sense and respond to alterations in their environment. In L. monocytogenes, two phosphodiesterases that cleave c-di-AMP to the linear dinucleotide pApA have been identified, PdeA and PgpH [3,21]. Structurally, PdeA is comprised of a membrane spanning N-terminus followed by a PAS domain, GGDEF domain, and catalytically active DHH-DHHA1 domain [3]. PgpH consists of an N-terminal extracellular domain followed by a seven-pass transmembrane domain reminiscent of G-protein coupled receptors and a C-terminal catalytic HD domain [21]. While these enzymes have somewhat redundant functions, biochemical studies revealed that PdeA is the dominant c-di-AMP hydrolase during intracellular bacterial growth; whereas, PgpH is the dominant hydrolase during broth culture [21]. It is likely that these enzymes, through their regulatory domains, respond to specific environmental or cellular cues as L. monocytogenes transitions from its environmental, saprophytic lifestyle to its pathogenic lifecycle. Thus, a detailed understanding of the factors that regulate c-di-AMP dynamics is of fundamental importance to the field.
Development of the first sensitive, high throughput c-di-AMP quantification tool will make these fundamental lines of inquiry tractable. We expect that pairing unbiased genomic and chemical screens with CDA-Luc measurements will uncover the key cellular and environmental factors that regulate c-di-AMP dynamics during infection and environmental growth. As cyclic di-AMP is both essential and toxic, high throughput drug screens using CDA-Luc to identify compounds that either target c-di-AMP cyclases or phosphodiesterases would have promising potential for the development of novel antimicrobial agents. Because CDA is also a potent inducer of host innate immune responses, PDE inhibitors could be especially promising as they would induce bacterial cell death while simultaneously boosting host, antibacterial inflammatory responses. Additionally, we also provide evidence that CDA-Luc can be used for the quantification of other bacterial CDN species, namely 3’3’-cGAMP. Although not tested here, we also expect that CDA-Luc could be used to quantify other AMP-containing 3’3’-CDNs including 3’3’-cUAMP. We anticipate that this will make CDA-Luc not only useful to the study of c-di-AMP signaling but also the newly discovered CBASS field. One caveat to CDA-Luc based measurements is that this approach, like mass-spectrometry and EIA, only allows population level measurements of c-di-AMP at a single time point following destruction of the biological sample. Thus, there is still a need for the development of reversible, continuous, single cell methods for in vivo quantification of c-di-AMP. Nevertheless, we anticipate that CDA-Luc will facilitate fundamental discoveries relating to c-di-AMP dynamics and physiology for years to come.
Experimental Section
Materials
ATP, [α−32P], 3000Ci/mmol 10mCi/ml, 250 μCi was obtained from PerkinElmer (cat. no. BLU003H250UC). 3’3’-c-di-AMP and 3’3’-cGAMP were obtained from Invivogen (cat. no. tlrl-nacda and cat. no. tlrl-nacga, respectively). AMP-Glo™ (cat. no. V5011), Cell Titer Glo® (cat. no. G7570), and Kinase Glo® (cat. no. V6712) reagents were obtained from Promega Corporation. Sodium Hexametaphosphate (polyphosphate) was obtained from Sigma-Aldrich (cat. no. 71600). Myokinase from rabbit muscle was obtained from Sigma-Aldrich (cat. no. M3003). RIPA buffer was purchased from ThermoFisher Scientific (cat. no. 89900).
Cloning
M. tuberculosis CnpB gene (Rv2837c) was amplified by PCR from Mtb H37Rv genomic DNA using the forward primer 5’-GAAATACCATATGACGACGATCGACCCAAGG and reverse primer 5’-GAATATCAAGCTTCTAACCAAGCGCCGCGC. The resulting PCR product was cloned into the NdeI /HindIII site of pET28b vector to generate an N-terminal His-tagged polypeptide. The resulting CnpB expression vector was confirmed by sequencing using the T7 and T7 Term universal primers (GENEWIZ).
Codon optimized PAP gene from A. johnsonii 210A (GenBank accession no. AB092983) was chemically synthesized (Integrated DNA Technologies). The gBlock™ was then PCR amplified using the forward primer 5’-GAGGAGCATATGGATACAGAGACTATCGCAAGTGC and reverse primer 5’-GAGGAGAAGCTTATCAGTGTCGCGGTCGGC. The resulting PCR product was cloned into the NdeI/HindIII site of pET20b vector to generate a C-terminal His-tagged polypeptide. The resulting PAP expression vector was confirmed by sequencing using the T7 and T7 Term universal primers (GENEWIZ).
Protein Expression and Purification
For expression of Mtb CnpB, plasmid encoding CnpB was transformed into LOBSTR (low background strain) BL21 (DE3) chemically competent E. coli. Overnight cultures of the resulting bacterial strains were used to inoculate 1.5 L of LB broth at a 1:100 dilution. Bacterial cultures were grown to OD600 0.6 at 37°C. The cultures were then cooled down to room temperature and protein expression was induced by the addition of 0.5 mM isopropyl β‐D‐1‐thiogalactopyranoside (IPTG) for 18 hours at 16°C. Bacteria were harvested by centrifugation at 9000 x g for 5 minutes, and the cell pellets were resuspending into 30 mL of Buffer A [50 mM Tris pH = 8.0, 500 mM NaCl, 20 mM Imidazole, 5 mM β-Mercaptoethanol (BME), and 1 mM phenylmethylsulfonyl fluoride (PMSF)] and cooled on ice for 30 minutes. Bacteria were lysed by sonication on ice and clarified by centrifugation at 40,000 x g for 30 minutes at 4°C. The resulting clarified lysate was bound to HisPur NiNTA Resin (Thermo Scientific). The resin was washed with 100 column volumes of buffer A and bound proteins were eluted in Buffer B [50 mM Tris-Cl pH = 8.0, 500 mM NaCl, 300 mM Imidazole, 5 mM β-Mercaptoethanol (BME), and 1 mM phenylmethylsulfonyl fluoride (PMSF)]. Eluates were assessed for purity by SDS-PAGE analysis. Proteins were concentrated using Vivaspin 6 (5000 MWCO) centrifugal concentrators and then buffer exchanged into storage buffer [50 mM Tris-Cl pH = 8.5, 100 mM NaCl] using PD-10 desalting columns (GE Healthcare). The desalted proteins were concentrated again using Vivaspin 6 (5000 MWCO) centrifugal concentrators, supplemented with glycerol (25%), snap frozen using liquid nitrogen, and stored at −80°C until use.
For expression of PAP, plasmid encoding PAP was transformed into LOBSTR (low background strain) BL21 (DE3) chemically competent E. coli. Overnight cultures of the resulting bacterial strains were used to inoculate 1.5 L of LB broth at a 1:100 dilution. Bacterial cultures were grown to OD600 0.4 at 37°C. The cultures were then cooled down to room temperature and protein expression was induced by the addition of 0.5 mM isopropyl β‐D‐1‐thiogalactopyranoside (IPTG) for 18 hours at 16°C. Bacteria were harvested by centrifugation at 9000 x g for 5 minutes, and the cell pellets were resuspending into 30 mL of Buffer A [50 mM Tris pH = 8.0, 500 mM NaCl, 20 mM Imidazole, 5 mM β-Mercaptoethanol (BME), and 1 mM phenylmethylsulfonyl fluoride (PMSF)] supplemented with 0.2 mg mL-1 Lysozyme and cooled on ice for 30 minutes. Bacteria were lysed by sonication on ice and clarified by centrifugation at 40,000 x g for 30 minutes at 4°C. The resulting clarified lysate was bound to HisPur NiNTA Resin (Thermo Scientific). The resin was washed with 100 column volumes of buffer A and bound proteins were eluted in Buffer B [50 mM Tris-Cl pH = 8.0, 500 mM NaCl, 300 mM Imidazole, 5 mM β-Mercaptoethanol (BME), and 1 mM phenylmethylsulfonyl fluoride (PMSF)]. Eluates were assessed for purity by SDS-PAGE analysis. Proteins were concentrated using Vivaspin 6 (5000 MWCO) centrifugal concentrators and then buffer exchanged into storage buffer [50 mM Tris-Cl pH = 8.5, 100 mM NaCl] using PD-10 desalting columns (GE Healthcare). The desalted proteins were concentrated again using Vivaspin 6 (5000 MWCO) centrifugal concentrators, aliquoted into PCR strip tubes, snap frozen using liquid nitrogen, and stored at −80°C until use.
For expression of RECON, plasmid encoding mRECON was transformed into Rosetta (DE3)pLysS chemically competent E. coli. Overnight cultures of the resulting bacterial strains were used to inoculate 1.5 L of LB broth at a 1:100 dilution. Bacterial cultures were grown to OD600 0.5 at 37°C. The cultures were then cooled down to room temperature and protein expression was induced by the addition of 0.5 mM isopropyl β‐D‐1‐thiogalactopyranoside (IPTG) for 18 hours at 16°C. Bacteria were harvested by centrifugation at 9000 x g for 5 minutes, and the cell pellets were resuspending into 30 mL of Buffer A [50 mM Tris pH = 8.0, 500 mM NaCl, 20 mM Imidazole, 5 mM β-Mercaptoethanol (BME), and 1 mM phenylmethylsulfonyl fluoride (PMSF)] and cooled on ice for 30 minutes. Bacteria were lysed by sonication on ice and clarified by centrifugation at 40,000 x g for 30 minutes at 4°C. The resulting clarified lysate was bound to HisPur NiNTA Resin (Thermo Scientific). The resin was washed with 100 column volumes of buffer A and bound proteins were eluted in Buffer B [50 mM Tris-Cl pH = 8.0, 500 mM NaCl, 300 mM Imidazole, 5 mM β-Mercaptoethanol (BME), and 1 mM phenylmethylsulfonyl fluoride (PMSF)]. Eluates were assessed for purity by SDS-PAGE analysis. Proteins were concentrated using Vivaspin 6 (5000 MWCO) centrifugal concentrators and then buffer exchanged into storage buffer [40 mM Tris pH 7.5, 100 mM NaCl, 20 mM MgCl2] using PD-10 desalting columns (GE Healthcare). The desalted proteins were concentrated again using Vivaspin 6 (5000 MWCO) centrifugal concentrators, supplemented with glycerol (25%), snap frozen using liquid nitrogen, and stored at −80°C until use.
BNPP Cleavage Assays
Unless otherwise noted, CnpB activity assays were carried out in clear polystyrene 96-well plates using assay buffer [50 mM Tris-Cl pH = 8.5, 100 mM NaCl] in 100 μL of assay buffer at 37°C. Indicated concentrations of CnpB and specified metal ions were diluted into assay buffer and reactions were initiated by the addition 0.2 mM BNPP. CnpB reaction rates were monitored by measuring the absorbance at 405 nm (OD405) using a plate reader (Synergy HTX multimode reader, BioTek Instruments).
Synthesis of [32P] 3’3’-c-di-AMP
Briefly, 1 μM of B. subtilis DisA and 1 μM α-[32P] ATP (Perkin-Elmer) (100 μL total reaction volume) was incubated in buffer [40 mM Tris pH 7.5, 100 mM NaCl, 20 mM MgCl2] at 37°C overnight. The following day, the reaction was spiked with an additional 1 μM DisA enzyme and incubated at 37°C for four hours. The reaction was terminated by boiling for 10 min at 95°C. The resulting crude [32P] 3’3’-c-di-AMP mixture was further purified using RECON affinity purification: 100 μM His-tagged mRECON was immobilized on HisPur Ni-NTA resin for 30 min on ice. The resin was washed twice with buffer and held on ice until use. The RECON resin was incubated with the crude [32P] 3’3’-c-di-AMP mixture for 30 minutes at room temperature. Following removal of the supernatant, the Ni-NTA resin was washed five times with ice cold buffer. 500 uL of buffer was added to the resin and the sample was incubated at 95°C for 10 minutes. The slurry was transferred to a minispin column and [32P] 3’3’-c-di-AMP was eluted by centrifugation. [32P] 3’3’-c-di-AMP was analyzed for purity by Thin Layer Chromatography (TLC) analysis using Polygram CEL300 PEI TLC plates (Machery-Nagel) in running buffer containing 1:1.5 (vol/vol) saturated (NH4)2SO4 and 1.5 M NaH2PO4 pH 3.6.
DRaCALA Binding Assays
Two-fold serial dilutions of CnpB in buffer [50 mM Tris-Cl pH = 8.5, 100 mM NaCl] with and without 0.1 mM MnCl2 were incubated with ~1 nM [32P] 3’3’-c-di-AMP for 10 minutes at 4°C. Samples were blotted onto nitrocellulose membranes and air dried for 15 minutes. Membranes were then exposed onto PhosphorImager screens (GE Healthcare) and developed using a Sapphire Biomolecular Imager (Azure Biosystems). Data were analyzed using Fiji/ImageJ software as previously described and graphed using GraphPad Prism 8 software.
[32P] 3’3’-c-di-AMP Hydrolysis Assays
Briefly, recombinant CnpB was incubated with radiolabeled 3’3’-c-di-AMP in buffer [50 mM Tris-Cl pH = 8.5, 100 mM NaCl] at 37°C. After indicated times, samples were dotted onto TLC plates and allowed to air dry for 5–10 minutes and then separated in TLC running buffer. TLC plates were then air dried for 30–60 minutes, exposed onto PhosphorImager screens (GE Healthcare) and developed using a Sapphire Biomolecular Imager (Azure Biosystems).
Quantification of 3’3’-c-di-AMP Using AMP-Glo™ Assay
3’3’-c-di-AMP standards were prepared by performing two-fold serial dilutions in buffer [50 mM Tris-Cl pH = 8.5, 100 mM NaCl]. 3’3’-c-di-AMP samples were supplemented with 0.1 mg mL−1 Bovine Serum Albumin, 1 mM DTT, 0.1 mM MnCl2, and 1 μM CnpB (final concentration) (100 μL total reaction volume). Samples were incubated overnight at 37°C. 24 hours later, 100 μL of AMP-Glo™ reagent I was added to each sample and incubated at room temperature for 2 hours. 50 μL of the resulting sample was transferred to a solid white 96-well plate (BioRad) and then incubated with 50 μL of AMP Detection Solution (equilibrated at room temperature for at least one hour) for one hour at room temperature. Luminescence was quantified using a plate reader (Synergy HTX multimode reader, BioTek Instruments) with an integration time of one second. Relative luminescence units (RLU) for each sample were background corrected by subtracting the RLU of the no 3’3’-c-di-AMP control. Standard curves were generated using default settings in GraphPad Prism software. Quantification and detection limits were calculated as previously described [26].
Quantification of 3’3’-c-di-AMP Using AMP-Luciferase Assay (CDA-Luc)
3’3’-c-di-AMP standards were prepared by performing two-fold serial dilutions in buffer [50 mM Tris-Cl pH = 8.5, 100 mM NaCl]. 3’3’-c-di-AMP samples dissolved in buffer [50 mM Tris-Cl pH = 8.5, 100 mM NaCl] were supplemented with 0.1 mg mL−1 Bovine Serum Albumin, 1 mM DTT, 0.1 mM MnCl2, and 1 μM CnpB (final concentration) (100 μL total reaction volume). Samples were incubated overnight at 37°C. 24 hours later, 100 μL of ATP generation solution [50 mM Tris-Cl pH = 8.5, 100 mM NaCl, 2 μM PAP, 50 μg mL−1 sodium hexametaphosphate, 2U myokinase, 0.1 mg mL−1 Bovine Serum Albumin, 1 mM DTT, 0.1 mM MgCl2] was added to each sample and incubated at room temperature for 3 hours. 50 μL of the resulting sample was transferred to a solid white 96-well plate (BioRad) and then incubated with 50 μL of Kinase Glo® reagent (equilibrated at room temperature for at least one hour). The plates were briefly centrifuged and incubated for at least ten minutes at room temperature. Luminescence was quantified using a plate reader (Synergy HTX multimode reader, BioTek Instruments) with an integration time of one second. Relative luminescence units (RLU) for each sample were background corrected by subtracting the RLU of the no 3’3’-c-di-AMP control. Standard curves were generated using default settings in GraphPad Prism 8 software. Concentrations of 3’3’-c-di-AMP in unknown samples was determined by interpolating into standard curves using GraphPad Prism 8 software. Quantification and detection limits were calculated as previously described [26].
RECON Affinity Purification
Listeria monocytogenes was back diluted into Listeria defined media at an OD 0.1 and grown for 24 hours shaking at 37°C [13,21]. The following day, 1 mL of overnight culture was spun at max speed in a microcentrifuge for 1 minute and supernatant and cell pellet were separated and saved for processing. The cell pellet was resuspended in 200 μL ice cold pulldown buffer [100uM Tris pH = 7.5 20 mM MgCl2 50mM NaCl] and lysed by sonication for 5 seconds at 25% power. Next, 800 μL of pulldown buffer and 1.3 μM (final concentration) of RECON bound to 20 μL of Ni-NTA beads were added to the sample and agitated for 15 minutes at room temperature to allow binding. The beads were then spun down and washed 3X with pulldown buffer. Subsequently, 150 μL of pulldown buffer with 500 mM Imidazole was added to the beads and agitated for 15 minutes at room temperature to release RECON. (Note: We have found that directly boiling the RECON-bead complexes can release interferents that affect downstream quantification. We recommend eluting the RECON-CDA complexes first, followed by boiling to release CDA.) Beads were spun down at max speed and supernatant added to a clean microcentrifuge tube. The supernatant was heated to 95°C for 10 minutes to denature RECON and release c-di-AMP then spun down at maximum speed to pellet the denatured protein. The supernatant was then processed to determine c-di-AMP concentration using the CDA-Luc protocol, as detailed above. Bacterial supernatant samples were processed identically except that 500 μL of supernatant was added to 500 μL of 2X pulldown buffer and 1.3 μM (final concentration) of RECON bound to 20 μL of Ni-NTA beads was used to bind c-di-AMP.
Supplementary Material
ACKNOWLEDGEMENTS
We thank all of the members of the Woodard lab for constructive comments throughout the course of this work. Graphics used in this work were generated using BioRender. The Sapphire Biomolecular Imager (Azure Biosystems) used for this work was supported by the Office of the Director of the National Institutes of Health under award S10OD026741. S.A.Z. was supported by the Seattle ARCS foundation as well as grants from the University of Washington/Fred Hutchinson Cancer Research Center Viral Pathogenesis Training Program (2T32AI083203), the University of Washington Medical Scientist Training Program (2T32GM007266), and a Ruth L. Kirschstein Predoctoral Fellowship (1F30CA239659-01A1). A.J.P was supported in part by a Public Health Service, National Research Service Award, T32GM007270, from the National Institute of General Medical Sciences. Research in the Woodward lab was supported by National Institutes of Health Grants 5R01AI139071-02, 1R21AI137758-01 and 1R21AI153820-01.
Footnotes
COMPETING INTERESTS
The authors declare no competing financial interests.
DATA AVAILABILITY
The datasets generated and/or analyzed during the current study are available from the corresponding author on reasonable request.
REFERENCES
- [1].Krasteva PV, Sondermann H, H, Nat. Chem. Biol 2017, 13, 350–359. [DOI] [PMC free article] [PubMed] [Google Scholar]
- [2].Zaver SA, Woodward JJ, J J, Curr. Opin. Cell Biol 2020, 63, 49–56. [DOI] [PMC free article] [PubMed] [Google Scholar]
- [3].Witte CE, Whiteley AT, Burke TP, Sauer JD, Portnoy DA, Woodward JJ, mBio 2013, 4, e00282–13. [DOI] [PMC free article] [PubMed] [Google Scholar]
- [4].Whiteley AT, Garelis NE, Peterson BN, Choi PH, Tong L, Woodward JJ, Portnoy DA, Mol. Microbiol 2017, 104, 212–233. [DOI] [PMC free article] [PubMed] [Google Scholar]
- [5].Sureka K, Choi PH, Precit M, Delince M, Pensinger DA, Huynh TN, Jurado AR, Goo YA, Sadilek M, Iavarone AT, Sauer J-D, Tong L, Woodward JJ, Cell 2014, 158, 1389–1401. [DOI] [PMC free article] [PubMed] [Google Scholar]
- [6].Huynh TN, Choi PH, Sureka K, Ledvina HE, Campillo J, Tong L, Woodward JJ, Mol. Microbiol 2016, 102, 233–243. [DOI] [PMC free article] [PubMed] [Google Scholar]
- [7].Townsley L, Yannarell SM, Huynh TN, Woodward JJ, Shank EA, mBio 2018, 9, e00341–18. [DOI] [PMC free article] [PubMed] [Google Scholar]
- [8].Gundlach J, Krüger L, Herzberg C, Turdiev A, Poehlein A, Tascón I, Weiss M, Hertel D, Daniel R, Hänelt I, Lee VT, Stülke J, J. Biol. Chem 2019, 294, 9605–9614. [DOI] [PMC free article] [PubMed] [Google Scholar]
- [9].Krüger L, Herzberg C, Warneke R, Poehlein A, Stautz J, Weiß M, Daniel R, Hänelt I, Stülke J, J. Bacteriol 2020, 202, e00138–20. [DOI] [PMC free article] [PubMed] [Google Scholar]
- [10].Stülke J, Krüger L, Annu. Rev. Microbiol 2020, 74, 159–179. [DOI] [PubMed] [Google Scholar]
- [11].Whiteley AT, Eaglesham JB, de Oliveira Mann CC, Lowey BR, Nieminen EA, Danilchanka O, King DS, Lee ASY, Mekalanos JJ, Kranzusch PJ, Nature 2019, 567, 194–199. [DOI] [PMC free article] [PubMed] [Google Scholar]
- [12].Cohen D, Melamed S, Millman A, Shulman G, Oppenheimer-Shaanan Y, Kacen A, Doron S, Amitai G, Sorek R, R. Nature 2019, 574, 691–695. [DOI] [PubMed] [Google Scholar]
- [13].Woodward JJ, Iavarone AT, Portnoy DA, Science 2010, 328, 1703–1705. [DOI] [PMC free article] [PubMed] [Google Scholar]
- [14].McFarland, Luo S, Ahmed-Qadri F, Zuck M, Thayer EF, Goo YA, Hybiske K, Tong L, Woodward JJ, Immunity 2017, 46, 433–445. [DOI] [PMC free article] [PubMed] [Google Scholar]
- [15].McFarland AP, Burke TP, Carletti AA, Glover RC, Tabakh H, Welch MD, Woodward JJ, MBio 2018, 9, e00526–18. [DOI] [PMC free article] [PubMed] [Google Scholar]
- [16].McWhirter SM, Barbalat R, Monroe KM, Fontana MF, Hyodo M, Joncker NT, Ishii KJ, Akira S, Colonna M, Chen ZJ, Fitzgerald KA, Hayakawa Y, Vance RE, J. Exp. Med 2009, 206, 1899–1911. [DOI] [PMC free article] [PubMed] [Google Scholar]
- [17].Burdette DL, Monroe KM, Sotelo-Troha K, Iwig JS, Eckert B, Hyodo M, Hayakawa Y, Vance RE, Nature 2011, 478, 515–518. [DOI] [PMC free article] [PubMed] [Google Scholar]
- [18].Gui X, Yang H, Li T, Tan X, Shi P, Li M, Du F, Chen ZJ, Nature 2019, 567, 262–266. [DOI] [PMC free article] [PubMed] [Google Scholar]
- [19].Parvatiyar K, Zhang Z, Teles RM, Ouyang S, Jiang Y, Iyer SS, Zaver SA, Schenk M, Zeng S, Zhong W, Liu ZJ, Modlin RL, Liu Y, Cheng G, Nat. Immunol 2012, 13, 1155–1161. [DOI] [PMC free article] [PubMed] [Google Scholar]
- [20].Huynh TN, Woodward JJ, Curr. Opin. Microbiol 2016, 30, 22–29. [DOI] [PMC free article] [PubMed] [Google Scholar]
- [21].Huynh TN, Luo S, Pensinger D, Sauer J-D, Tong L, Woodward JJ, Proc. Natl. Acad. Sci 2015, 112, E747–E756. [DOI] [PMC free article] [PubMed] [Google Scholar]
- [22].Whiteley AT, Pollock AJ, Portnoy DA, Cell Host Microbe 2015, 17, 788–798. [DOI] [PMC free article] [PubMed] [Google Scholar]
- [23].Pham HT, Nhiep NTH, Vu TNM, Huynh TN, Zhu Y, Huynh ALD, Chakrabortti A, Marcellin E, Lo R, Howard CB, Bansal N, Woodward JJ, Liang Z-X, Turner MS, PLoS Genet. 2018, 14, e1007574. [DOI] [PMC free article] [PubMed] [Google Scholar]
- [24].Corrigan RM, Bowman L, Willis AR, Kaever V, Gründling A, J. Biol. Chem 2015, 290, 5826–5839. [DOI] [PMC free article] [PubMed] [Google Scholar]
- [25].Kellenberger CA, Chen C, Whiteley AT, Portnoy DA, Hammond MC, J. Am. Chem. Soc 2015, 137, 6432–6435. [DOI] [PMC free article] [PubMed] [Google Scholar]
- [26].Mardjuki RE, Carozza JA, Li L, J. Biol. Chem 2020, 295, 4881–4892. [DOI] [PMC free article] [PubMed] [Google Scholar]
- [27].Yang J, Bai Y, Zhang Y, Gabrielle VD, Jin L, Bai G, Mol. Microbiol 2014, 93, 65–79. [DOI] [PMC free article] [PubMed] [Google Scholar]
- [28].Manikandan K, Sabareesh V, Singh N, Saigal K, Mechold U, Sinha KM, PLoS One 2014, 9 e86096. [DOI] [PMC free article] [PubMed] [Google Scholar]
- [29].He Q, Wang F, Liu S, Zhu D, Cong H, Gao F, Li B, Wang H, Lin Z, Liao J, Gu L, J. Biol. Chem 2016, 291 3668–3681. [DOI] [PMC free article] [PubMed] [Google Scholar]
- [30].Tang Q, Luo Y, Zheng C, Yin K, Ali MK, Li X, He J, Int. J. Biol. Sci 2015, 11, 813–824. [DOI] [PMC free article] [PubMed] [Google Scholar]
- [31].Drexler DJ, Müller M, Rojas-Cordova CA, Bandera AM, Witte G, Structure, 2017, 25, 1887–1897. [DOI] [PubMed] [Google Scholar]
- [32].Latoscha A, Drexler DJ, Al-Bassam MM, Bandera AM, Kaever V, Findlay KC, Witte G, Tschowri N, Proc. Natl. Acad. Sci 2020, 117, 7392–7400. [DOI] [PMC free article] [PubMed] [Google Scholar]
- [33].Pollock AJ, Zaver SA, Woodward JJ, Nat. Commun 2020, 11, 3533. [DOI] [PMC free article] [PubMed] [Google Scholar]
- [34].Luteijn RD, Zaver SA, Gowen BG, Wyman SK, Garelis NE, Onia L, McWhirter SM, Katibah GE, Corn JE, Woodward JJ, Raulet DH, Nature, 2019, 573, 434–438. [DOI] [PMC free article] [PubMed] [Google Scholar]
- [35].Gibhardt J, Heidemann JL, Bremenkamp R, Rosenberg J, Seifert R, Kaever V, Ficner R, Commichau FM, Environ. Microbiol 2020, 22, 2771–2791. [DOI] [PubMed] [Google Scholar]
- [36].Tosi T, Hoshiga F, Millership C, Singh R, Eldrid C, Patin D, Mengin-Lecreulx D, Thalassinos K, Freemont P, Gründling A, PLoS Pathog. 2019, 15, e1007537. [DOI] [PMC free article] [PubMed] [Google Scholar]
Associated Data
This section collects any data citations, data availability statements, or supplementary materials included in this article.
Supplementary Materials
Data Availability Statement
The datasets generated and/or analyzed during the current study are available from the corresponding author on reasonable request.