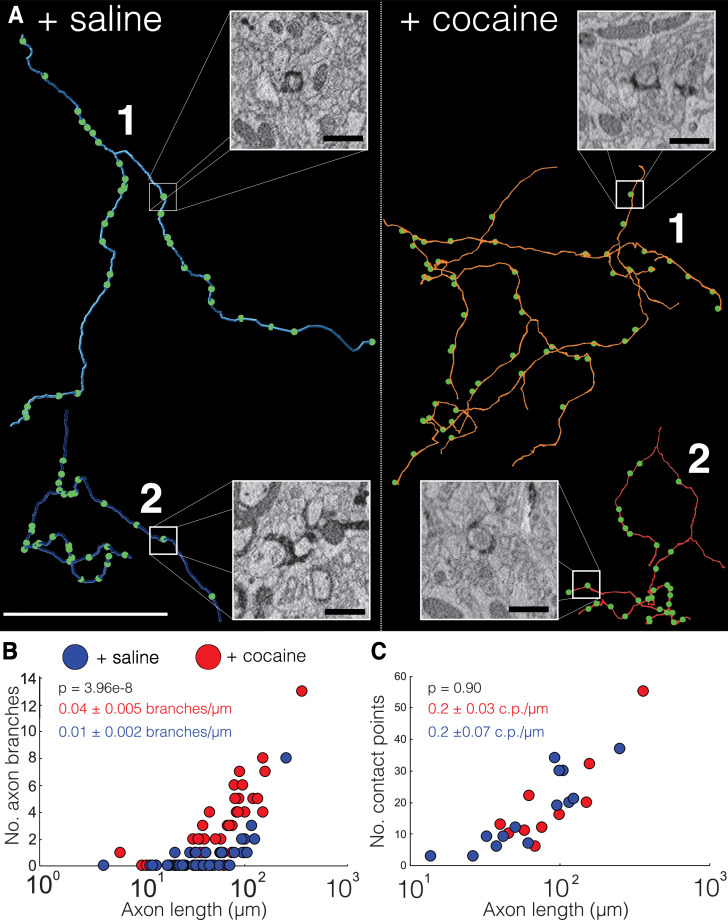
Figure 6. Cocaine increases branching of Apex2 dopamine axons in cocaine sensitized mice.
(A) Two representative reconstructions of dopaminergic (DA) axons each from saline- (left, blue) and cocaine- (right, red) treated mice. Green circles represent contact points (i.e., spinules) where other neurons interdigitate with the DA axon. Electron microscopy (EM) insets: four examples of contact points identified in 20 nm resolution datasets from control and cocaine datasets. (B) Scatter plot of the number of DA axons branches versus axon length (μm) (+saline: 0.01 ± 0.002 branches/µm length of axon, n = 44 axons, two mice; +cocaine: 0.04 ± 0.005 branches/µm length of axon, n = 41 axons, two mice. p = 3.96e-8. (C) Scatter plot of the number of contact points (i.e., ‘spinules’) versus axon length (µm) + saline: 0.2 ± 0.07 contact points (c.p.)/µm length of axon, n = 240 contact points over 14 axons, two mice; +cocaine: 0.2 ± 0.03 c.p./µm length of axon, n = 142 contact points over nine axons, two mice. p = 0.90). Data: mean ± SEM. p-Values: two-tailed Mann-Whitney U test. Scale bar = (A) reconstructions = 40 µm, EM insets = 1 µm.
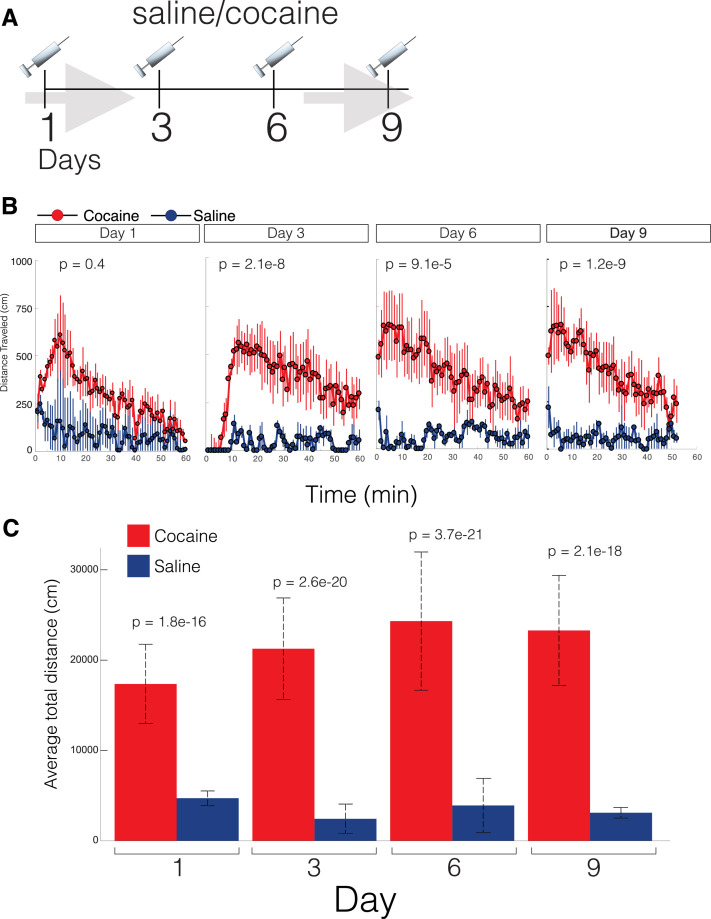
Figure 6—figure supplement 1. Cocaine-treated mice have increased locomotor activity.
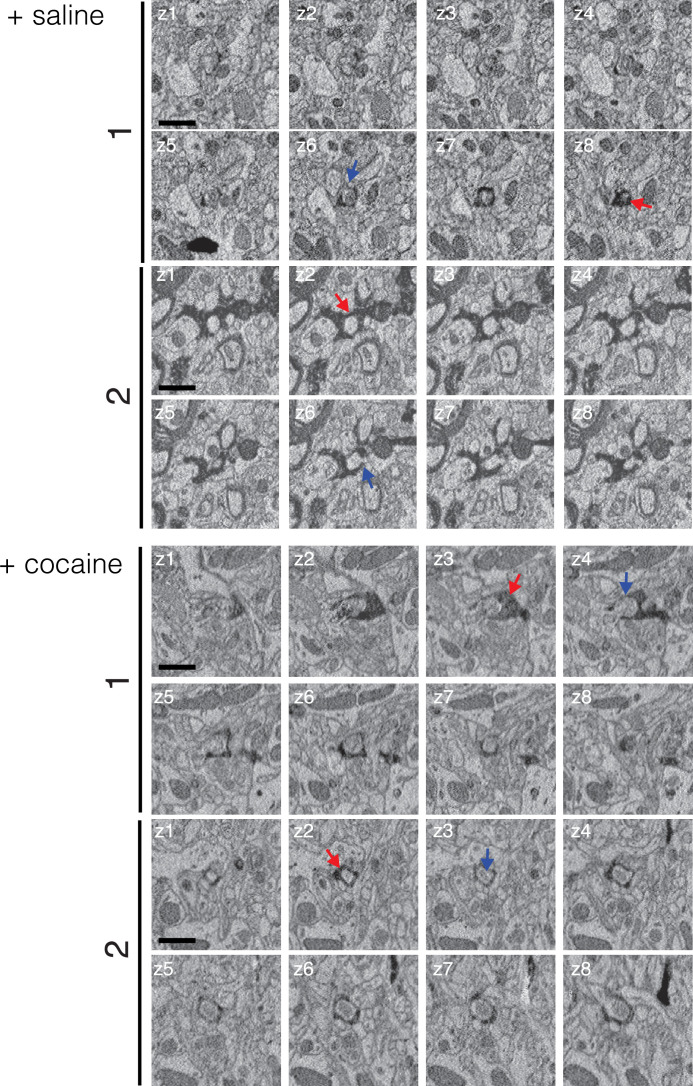
Figure 6—figure supplement 2. Contact points from control and cocaine 20 nm resolution datasets.
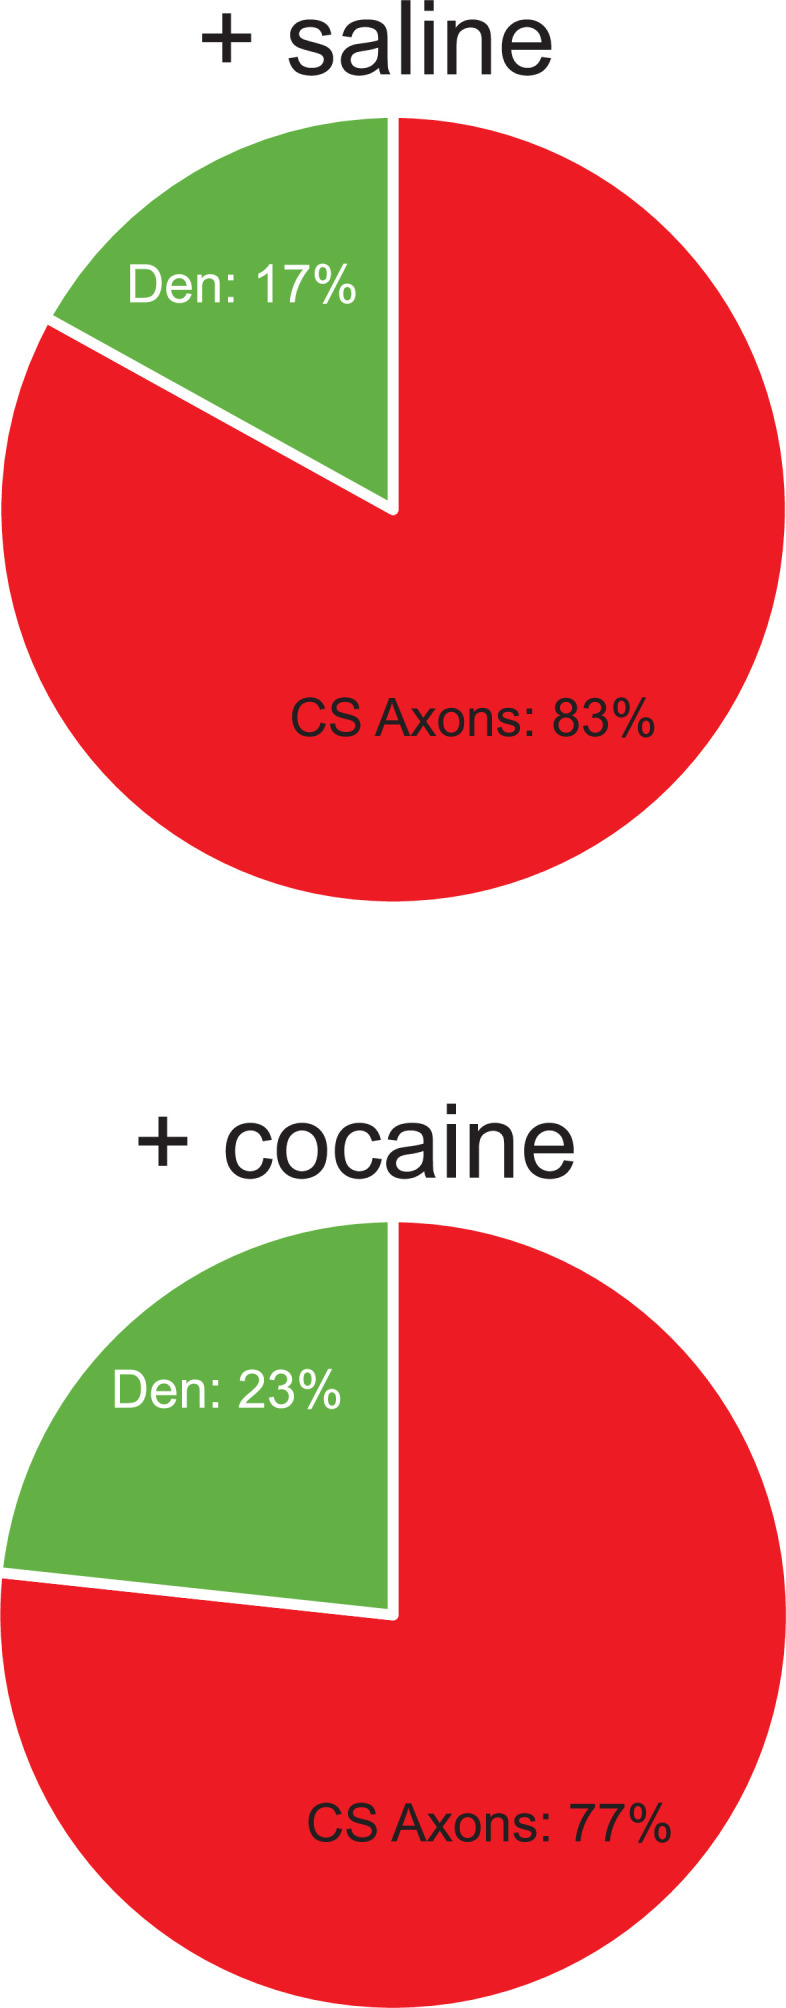
Figure 6—figure supplement 3. Cocaine does not change the proportion of dopamine targets.


