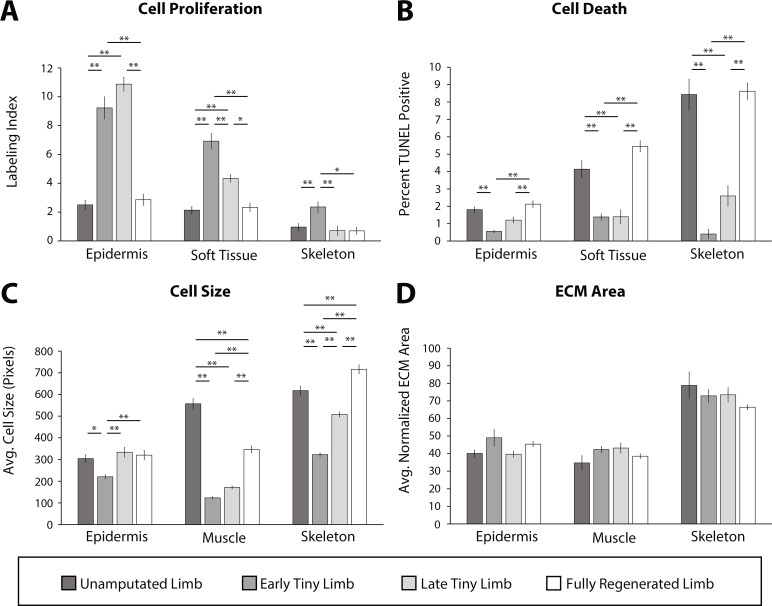
Figure 2. Tiny limb staged regenerates have increased proliferation, decreased cell death, and smaller cell sizes than uninjured or completely regenerated limbs.
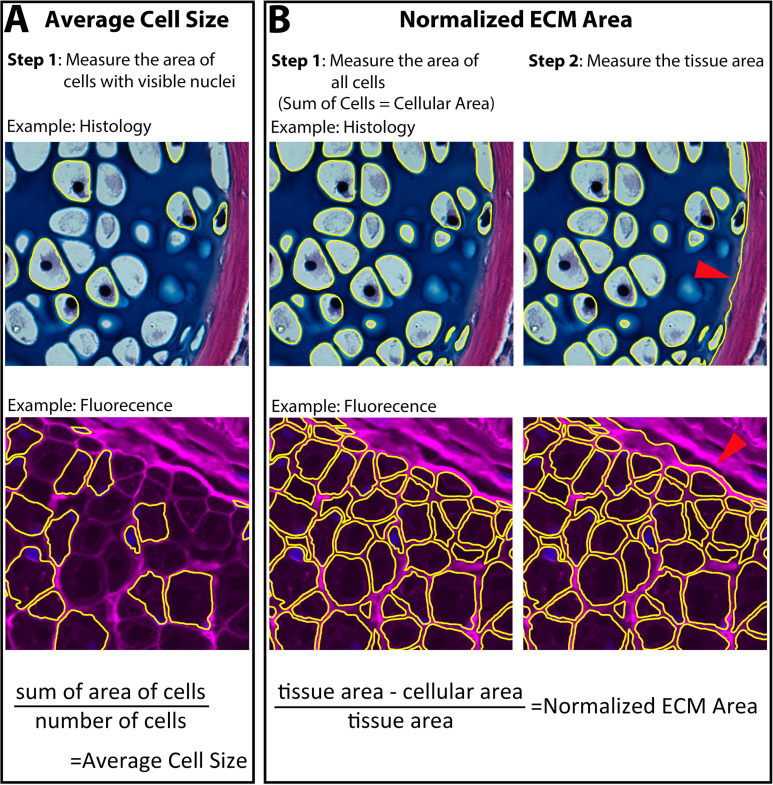
Transverse sections through the zeugopod of limbs at different stages of regeneration were analyzed for cell proliferation (A), cell death (B), cell size (C), and extracellular matrix (ECM) size (D). (A and B) Cell proliferation and death were analyzed in the epidermis, soft tissue, and skeletal elements. (A) Cell proliferation was analyzed by EdU labeling (n = 5). (B) Cell death was analyzed using TUNEL labeling (n = 4). (C and D) Cell and ECM size measurements were quantified in the epidermis, muscle, and skeletal elements. (C) Cell size was quantified using fluorescently tagged wheat germ agglutinin (plasma membrane) for epidermal and muscular analysis and Alcian blue staining (collagen) for skeletal analysis (n = 4). (D) ECM area was calculated by [(tissue area – cellular area)/tissue area] (n = 4). Error bars = SEM. p-Values calculated by ANOVA and the Tukey post hoc test. * = p < 0.05 ** = p < 0.005.


