. 2021 Nov 15;10:e68584. doi: 10.7554/eLife.68584

Figure 5. Host size correlates with the final size for the regenerated limb in the accessory limb model (ALM) assay.

(A) Blastemas with approximately 2 mm of stump tissue from large and small GFP+ donor animals were grafted onto a regenerative permissive environment, a wound site with a deviated limb nerve bundle, on large or small host animals. (B) Limb length and body length were measured on the GFP+ donor animals. (C) The regenerating grafted tissues were measured at 0 and 130 days post graft (DPG). Blastemas from large donors (dark gray) were grafted onto large (n = 7) and small (n = 9) host animals, and blastemas from small donors (light gray) were grafted onto large (n = 9) and small (n = 10) host animals. (D) The regenerating large (n = 10) and small (n = 20) animal donor limbs were measured at 15- and 145 days post amputation. Error bars = SEM. p-Values calculated by ANOVA and the Tukey post hoc test. * = p < 0.05 ** = p < 0.005.

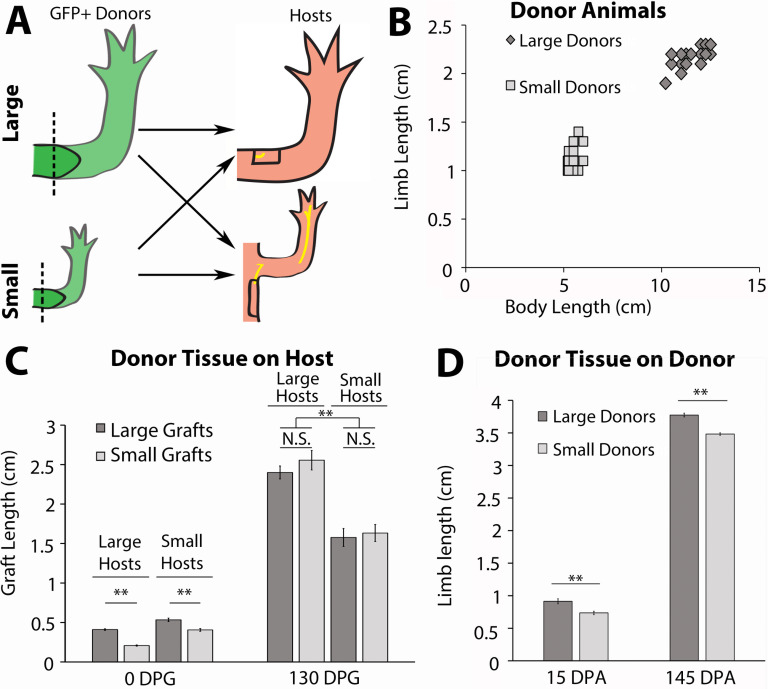
Figure 5.

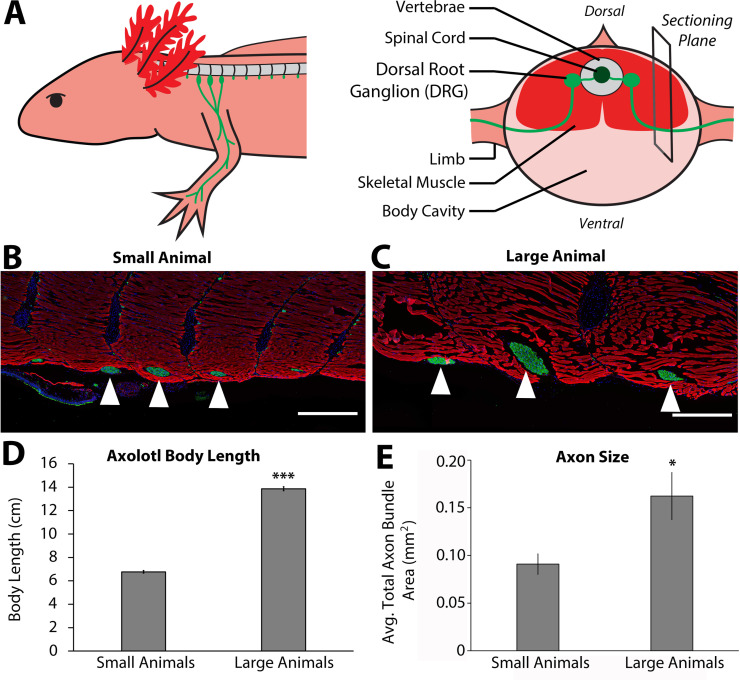
Figure 5—figure supplement 1. Size of nerve bundles in the peripheral nervous system correlate with animal size.

Figure 5—figure supplement 1.

(A) Three spinal dorsal root ganglia (DRGs) (3, 4, and 5, light green) extend through the spinal skeletal muscle (red) and enter the limb. The right panel shows that the sectioning plane for B and C is located at the point where the limb-bound axon bundles emerge from the skeletal muscle. (B–C) Representative immunofluorescent images of sections where the limb axon bundles (anti-acetylated tubulin antibodies – green) are emerging from the skeletal muscle (rhodamine phalloidin – red) and co-stained with DAPI (blue) in both small (n = 4, B) and large (n = 3, C) animals. Scale bars = 500 μm. White triangles indicate limb-bound axon bundles from DRGs 3, 4, and 5 (from left to right). (D) Body length, snout to tail tip was measured on small (n = 4) and large (n = 3) animals, and the average length is represented in the graph. (E) The cross-sectional area of the nerve bundles was quantified in millimeters squared, and the averages of the sum of the three axon bundles are represented in E. The large animals (n = 3) have a significantly larger cross-sectional area than the small animals (n = 4). Error bars = SEM. p-Values calculated by t-tests. * = p < 0.05 *** = p < 0.0005.
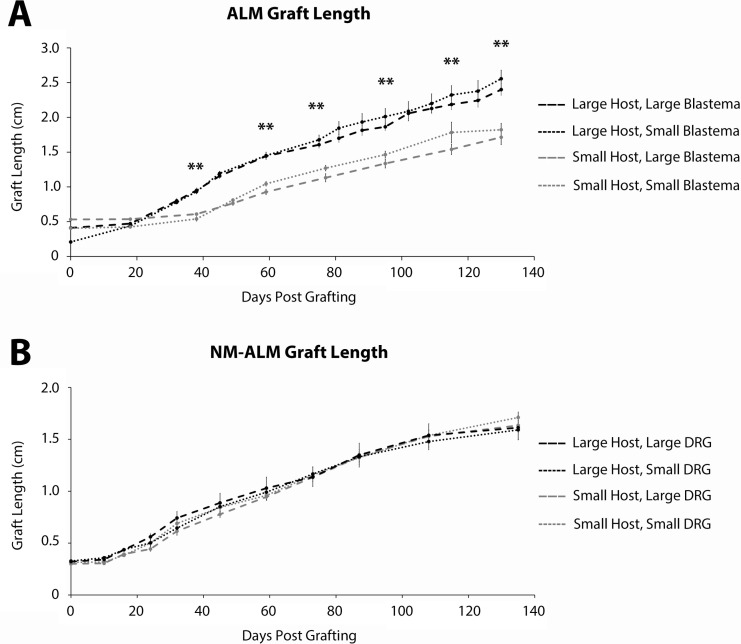
Figure 5—figure supplement 2. Growth of grafted limbs in accessory limb models (ALMs) and neural-modified ALMs (NM-ALMs).

Figure 5—figure supplement 2.

(A) The ectopic limbs on the large and small host animals, generated from large and small blastema donor animals via traditional ALM surgery, were measured over time from 0 to 130 days post grafting. (B) The ectopic limbs on the large and small host animals, generated from large and small dorsal root ganglia (DRG) donor animals via NM-ALM surgery, were measured over time from 0 to 135 days post grafting. Error bars = SEM. p-Values calculated by ANOVA and the Tukey post hoc test. ** = p < 0.005. Statistical comparisons were made between the limbs on the differently sized host animals.