Abstract
This study provides the first systematic analysis of the nuclear organization of the neural systems related to sleep and wake in the basal forebrain, diencephalon, midbrain, and pons of the river hippopotamus, one of the closest extant terrestrial relatives of the cetaceans. All nuclei involved in sleep regulation and control found in other mammals, including cetaceans, were present in the river hippopotamus, with no specific nuclei being absent, but novel features of the cholinergic system, including novel nuclei, were present. This qualitative similarity relates to the cholinergic, noradrenergic, serotonergic, and orexinergic systems and is extended to the γ-aminobutyric acid (GABA)ergic elements of these nuclei. Quantitative analysis reveals that the numbers of pontine cholinergic (259,578) and noradrenergic (127,752) neurons, and hypothalamic orexinergic neurons (68,398) are markedly higher than in other large-brained mammals. These features, along with novel cholinergic nuclei in the intralaminar nuclei of the dorsal thalamus and the ventral tegmental area of the midbrain, as well as a major expansion of the hypothalamic cholinergic nuclei and a large laterodorsal tegmental nucleus of the pons that has both parvocellular and magnocellular cholinergic neurons, indicates an unusual sleep phenomenology for the hippopotamus. Our observations indicate that the hippopotamus is likely to be a bihemispheric sleeper that expresses REM sleep. The novel features of the cholinergic system suggest the presence of an undescribed sleep state in the hippopotamus, as well as the possibility that this animal could, more rapidly than other mammals, switch cortical electroencephalographic activity from one state to another.
Keywords: hippopotami, Cetacea, Cetartiodactyla, mammalian sleep, unihemispheric sleep, brain evolution, RRID AB_2079751, RRID AB_10000323, RRID AB_91545, RRID AB_10000343, RRID AB_10000340, RRID AB_10000321
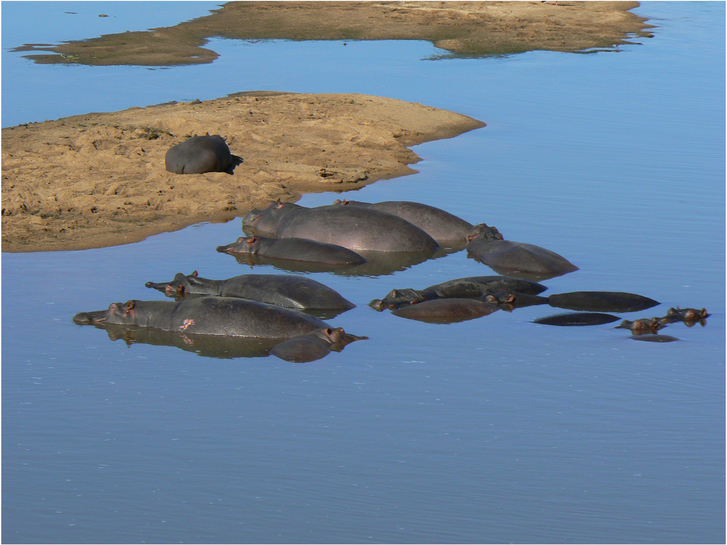
The river hippopotamus, Hippopotamus amphibius, is a species within the sister taxon to the cetaceans as determined in numerous phylogenetic studies (Boisserie et al., 2005; Price et al., 2005). At first this appears to be an unusual pairing, as cetaceans are completely aquatic carnivores, whereas the river hippopotamus is a semiaquatic herbivore (Kingdon, 2003). Nevertheless, due to this phylogenetic kinship with the cetaceans, the hippopotamus becomes a pivotal species in aiding our understanding of the evolution of the neural systems controlling unihemispheric sleep in cetaceans (Dell et al., 2012). Observational studies have noted that hippopotami appear to be able to sleep underwater but float to the water surface to breathe before re-submerging, apparently without waking up (Pacini and Harper, 2008; Lyamin et al., 2013). A behavioral study of hippopotamus sleep noted possible REM sleep when the animals were submerged and lay on the bottom of the pool for a period of up to 3 minutes (Lyamin et al., 2013). In addition, it was noted that a female hippopotamus with a calf could apparently sleep with both eyes open (Lyamin et al., 2013). The authors of the present study have noted that in the wild, hippopotami often sleep either completely on land, or partially submerged with their heads above water, although the laterality of the placement of the head, with one nostril out of the water and one underwater, is readily observed (Fig. 1). Unfortunately, no electrophysiological studies of sleep in the hippopotamus have been undertaken to date, but these would be of great interest in understanding when and how the cetacean-type sleep evolved (Lyamin et al., 2008).
Figure 1.
Photograph of a pod of wild river hippopotami sleeping in a river in the Kruger National Park, South Africa. Note that they appear to sleep both on the land, and partially immersed in the water, although behavioral studies in captivity indicate the possibility of them being able to sleep while fully submerged. [Color figure can be viewed in the online issue, which is available at wileyonlinelibrary.com.]
One way to begin to examine the evolution of cetacean-type sleep would be to investigate the neural systems controlling and regulating sleep. In recent studies of these systems in the harbor porpoise and minke whale (Dell et al., 2012, 2015, 2016a,b), it was noted that the systems involved in sleep control and regulation are very similar in appearance (this being the number and presence of homologous nuclei) in the cetaceans and other mammals in which these have been studied. These observations were extended to the inhibitory neurons that innervated these nuclei (Dell et al., 2016a,b). In fact, no particularly novel nuclei or inhibitory inputs that could be interpreted as being involved in the control or regulation of sleep were noted in either species of cetacean, or in an earlier study of the locus coeruleus complex of the bottlenose dolphin (Manger et al., 2003). What has been noted though is not a difference of quality (through the presence or absence of nuclei), but a difference in quantity, with greater numbers of orexinergic neurons being found in the cetacean hypothalamus (Dell et al., 2012, 2016b), lower densities of orexinergic boutons in the cerebral cortex of cetaceans compared with artiodactyls (Dell et al., 2015), and seemingly higher numbers of cholinergic and noradrenergic neurons in the pontine region of the cetacean brain than in other mammalian species (Dell et al., 2016a,b). Thus, the differences leading to the evolution of cetacean-type sleep might be based on quantitative differences, rather than qualitative differences, in the neural systems related to the regulation and control of sleep. Unfortunately, at this stage, this quantitative aspect of cetacean-type sleep needs further investigation, especially with closely related animals such as the hippopotami, to determine the validity of the hypothesis.
Thus, the present study provides a description of the nuclear organization of the cholinergic, catecholaminergic, serotonergic, and orexinergic systems associated with sleep control and regulation in the river hippopotamus. In addition, the distribution of the putative inhibitory neurons and terminal networks associated with these nuclei were examined by immunostaining for parvalbumin (PV), calbindin (CB), and calretinin (CR). Lastly, stereological analysis of neuronal numbers was undertaken for the pontine cholinergic and noradrenergic nuclei as well as the hypothalamic orexinergic neurons. The aim of this study was to provide a clearer understanding of the neural basis of cetacean sleep regulation and control as well as to hopefully provide insight into the evolution of cetacean-type sleep phenomenology.
MATERIALS AND METHODS
Specimens
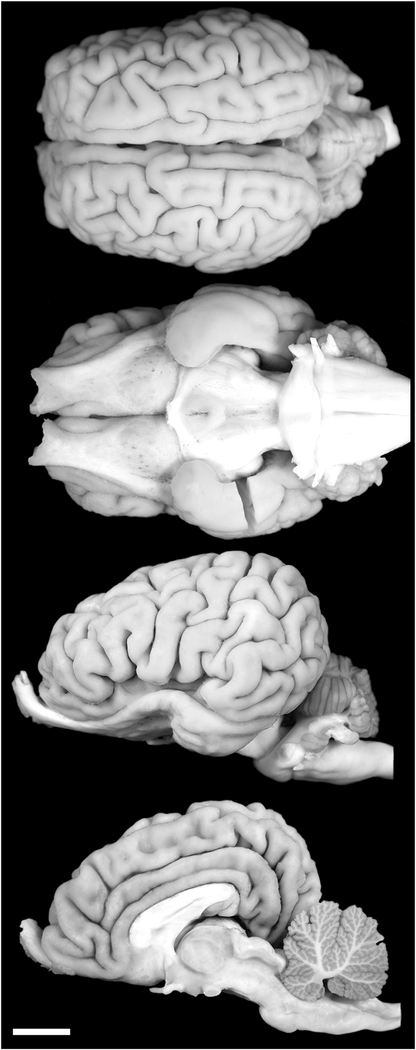
The brains from two adult hippopotami (H. amphibius) (brain masses 407.5 g [female] and 579.4 g [male]) were acquired from the Copenhagen Zoo, Denmark (Fig. 2). The animals were treated and used according to the guidelines of the University of Witwatersrand Animal Ethics Committee, which correspond with those of the National Institutes of Health for the care and use of animals in scientific experimentation. The animals were obtained after being euthanized with sodium pentobarbital (i.v) in line with management decisions of the zoo. Once dead, the heads of the animals were removed from the body and were perfused through the carotid arteries with a rinse of 0.9% saline (1 L/2-kg mass), followed by fixation with 4% paraformaldehyde in 0.1 M phosphate buffer (PB) (1 L/1-kg mass) (Manger et al., 2009). The brains were then removed from the skull and postfixed (in 4% paraformaldehyde in 0.1 M PB) for 72 hours at 4°C. The brains were transferred to a solution of 30% sucrose in 0.1 M PB at 4°C until they had equilibrated and then transferred to an antifreeze solution containing 30% glycerol, 30% ethylene glycol, 30% distilled water, and 10% 0.244 M PB. Once again the brains were allowed to equilibrate in the solution at 4°C and were then moved to a −20°C freezer for storage until sectioning.
Figure 2.
Photographs of the dorsal, ventral, lateral, and midsagittal views of the brain of the river hippopotamus. Scale bar = 2 cm.
Tissue selection and immunostaining
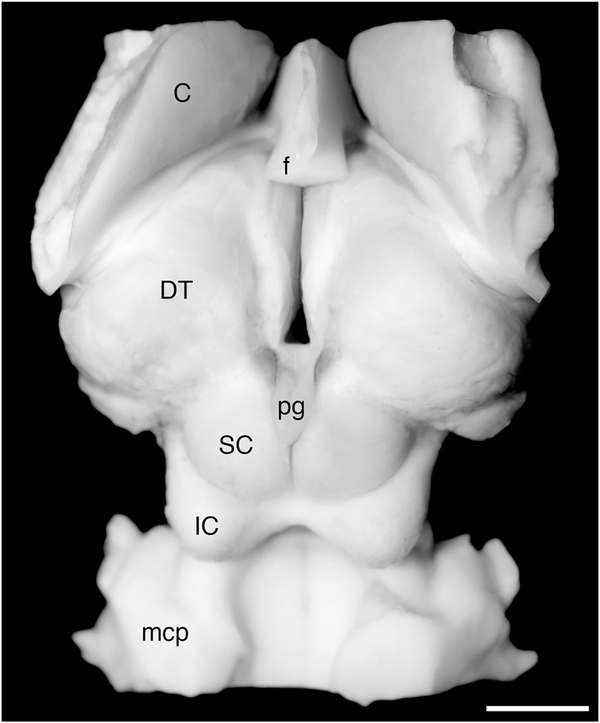
Prior to sectioning, both brains underwent magnetic resonance imaging (MRI) to reveal the general anatomy of the brain of the river hippopotamus (for the MRI protocol, see Manger et al., 2010, 2012; Maseko et al., 2011, 2012). As both specimens showed a similar anatomy (i.e., there was no obvious variance between the two specimens), we selected a single specimen (HA2, female, brain mass 407.5 g) to section for subsequent staining. The basal forebrain, diencephalon, and pons were dissected from the remainder of the brain as a single block of tissue (Fig. 3). This block of tissue was placed in 30% sucrose in 0.1 M PB at 4°C until it had equilibrated. The tissue was then frozen in crushed dry ice and mounted onto an aluminum stage that was attached to a freezing microtome modified to allow the sectioning of large tissue blocks. The entire tissue block was sectioned in the coronal plane, with a section thickness of 50 μm. A 1-in-11 series of sections was taken, and nine series were stained for Nissl substance, myelin, choline acetyltransferase (ChAT), tyrosine hydroxylase (TH), serotonin (5-HT), orexin (OxA), PV, CB, and CR; the remaining two series were placed back in antifreeze solution and returned to the freezer for future use. Sections used for Nissl, myelin, and immunohistochemical staining were treated as described in Dell et al. (2016a,b).
Figure 3.
Photograph of the dorsal aspect of the regions of the hippopotamus brain, extending from the basal forebrain to the pontomedullary junction, dissected and sectioned in the current study. C, caudate nucleus; DT, dorsal thalamus; f, fornix; IC, inferior colliculus; mcp, middle cerebellar peduncle; pg, pineal gland; SC. superior colliculus. Scale bar = 1 cm.
All sections were examined with a stereomicroscope, and the architectonic borders of the sections were traced according to the Nissl- and myelin-stained sections by using a camera lucida. The immunostained sections were then matched to the traced drawings, adjusted slightly for any differential shrinking of the stained sections, and immunopositive neurons were marked. The drawings were then scanned and redrawn using the Canvas 8 (Deneba, Miami, FL) drawing program.
Antibody characterization and specificity
The antibodies used and associated details are listed in the text and Table 1 of Dell et al. (2016a), except for the OxA antibody, for which details are provided in Dell et al. (2016b).
TABLE 1.
Stereological Parameters Used for Estimating Cell Numbers in the River Hippopotamus
| Nucleus examined | Counting frame size (μm) | Sampling grid size (μm) | Disector height (μm) | Cut thickness (μm) | Average mounted thickness (μm) | Vertical guard zones (top and bottom, μm) | Section interval | No. of sections | No. of sampling sites | Average CE (Gundersen m = 0) | Average CE (Gundersen m = 1) |
|---|---|---|---|---|---|---|---|---|---|---|---|
| LDT (ChAT+) | 200 × 200 | 200 × 200 | 15 | 50 | 36.3 | 5 | 11 | 21 | 2,680 | 0.04 | 0.03 |
| PPT (ChAT+) | 200 × 200 | 800 × 800 | 15 | 50 | 39.4 | 5 | 11 | 21 | 484 | 0.07 | 0.06 |
| LC (TH+) | 150 × 150 | 800 × 800 | 15 | 50 | 34.4 | 5 | 11 | 20 | 440 | 0.10 | 0.11 |
| Orexin (OxA+) | 200 × 200 | 800 × 800 | 15 | 50 | 26.3 | 5 | 11 | 25 | 463 | 0.10 | 0.10 |
Abbreviations: LDT, laterodorsal tegmental nucleus, PPT - pedunculopontine tegmental nucleus; LC, locus coeruleus complex; ChAT+, neurons immunopositive for choline acetyltransferase; TH+, neurons immunopositive for tyrosine hydroxylase; OxA+, neurons immunopositive for orexin-A.
Stereological analysis
The numbers of cholinergic immunopositive neurons (ChAT) in the laterodorsal tegmental nucleus (LDT) and pedunculopontine tegmental nucleus (PPT) as well as the number of noradrenergic immunopositive neurons (TH) in the locus coeruleus and the number of orexinergic immunopositive neurons (OxA) in the hypothalamus were determined with stereological techniques. An Olympus BX-60 light microscope equipped with a three-axis motorized stage, video camera, and integrated Stereo-Investigator software (MicroBrightField, Colchester, VT, Version 8.0) was used for the stereological counts. Independent pilot studies for the LDT, PPT, locus coeruleus, and hypothalamus were conducted on individual brain slices to optimize sampling parameters for cell counting (Table 1). Counting frames and grid sizes were optimized to achieve a mean coefficient of error of 10% or less (Gunderson and Jensen, 1987), and a guard zone of 5 μm was employed to avoid the introduction of errors due to sectioning artifacts (West et al., 1991). Section thickness was measured at every fifth sampling site, and the number of immunopositive neurons was counted in accordance with the principles of the optical fractionator method (West et al., 1991). In the PPT, hypothalamus, and locus coeruleus, a standardized stereological approach using simple random sampling was implemented with counting frames of 200 μm × 200 μm for the PPT and hypothalamus and 150 μm × 150 μm for the locus coeruleus. Corresponding grid sizes of 800 μm × 800 μm were used for the PPT, locus coeruleus, and hypothalamus (Table 1). Due to the relatively small size of the LDT nucleus, we used a modified unbiased stereological approach by performing exhaustive total counts using a counting frame and grid size of 200 μm × 200 μm. The optical fractionator method was used to computationally determine the number of ChAT+ neurons in the LDT and PPT as well as the number of TH+ neurons in the locus coeruleus and the OxA+ neurons in the hypothalamus using the following formula:
where N is the total estimated neuronal number, Q is the number of neurons counted, SSF is the section sampling fraction, ASF is the area subfraction (this was the ratio of the size of the counting frame to the size of the sampling grid), and TSF is the thickness subfraction (this was the ratio of the dissector height relative to cut section thickness) (Table 1). To determine the TSF, we used the average mounted section thickness calculated for each individual, subtracted the total vertical guard zones (10 μm) to give dissector height, and used the ratio of dissector height to cut section thickness (50 μm) to provide the TSF for each individual. The nucleator probe was used to estimate the mean volume and cross-sectional area of the immunopositive neurons, in conjunction with fractionator sampling (Gundersen, 1988).
RESULTS
The hippopotamus studied exhibited a range of nuclei involved in the regulation and initiation of the various phases of the sleep–wake cycle that were very similar to that observed in most mammals previously studied (Maseko et al., 2007; Dell et al., 2010, 2012, 2016a,b; Bhagwandin et al., 2013). This similarity extends to the locations of cell and terminal networks of the various γ-aminobutyric acid (GABA)ergic neurons examined (Bhagwandin et al., 2013; Dell et al., 2016a,b). Interestingly, in contrast to other mammals studied, including cetaceans, three unusual features of the cholinergic system were observed, these being supernumerary cholinergic neurons in the hypothalamus, cholinergic neurons in the intramedullary nuclear region of the dorsal thalamus, and cholinergic neurons in the ventral tegmental area.
Cholinergic nuclei of the basal forebrain and pons
Within the basal forebrain of the hippopotamus, we could readily identify four cholinergic nuclei, these being the medial septal nucleus, the diagonal band of Broca, the islands of Calleja/olfactory tubercle, and the nucleus basalis (Figs. (4 and 5A),B). The medial septal nucleus, located in the medial aspect of the septal nuclear complex, contained a high density of spherically shaped multipolar cholinergic neurons, but no specific dendritic orientation was noted (Fig. 6A). The diagonal band of Broca was located in the ventromedial aspect of the cerebral hemisphere, anterior to the hypothalamus. It contained a high density of spherically shaped, mostly bipolar neurons. The dendrites of these neurons showed no specific orientation, but these neurons were the largest neurons identified of the basal forebrain nuclei. The cholinergic neurons forming the islands of Calleja and olfactory tubercle were identified in the floor of the cerebral hemisphere, ventral to the nucleus accumbens yet rostral to the anterior commissure. These regions contained a moderate to high density of spherically shaped multipolar and bipolar neurons that showed no specific dendritic orientation. Clusters of cholinergic neurons in this region formed the islands of Calleja. The nucleus basalis was identified ventrolateral to the anterior commissure, anterior to the hypothalamus, and immediately dorsal to the olfactory tubercle (Fig. 5A). It contained a moderate density of oval-shaped bipolar and multipolar cholinergic neurons that showed no specific dendritic orientation.
Figure 4.
A–C: Diagrammatic reconstruction of a series of coronal sections through the basal forebrain of the river hippopotamus illustrating the location of neurons immunoreactive for choline acetyltransferase (ChAT; circles). Each symbol represents a single neuron. The outlines of the architectonic regions were drawn using Nissl and myelin stain, and immunoreactive neurons were marked on the drawings. A represents the most rostral section and C the most caudal. Each panel is approximately 2,200 μm apart. For abbreviations, see list. Scale bar = 5 mm in B (applies to A–C).
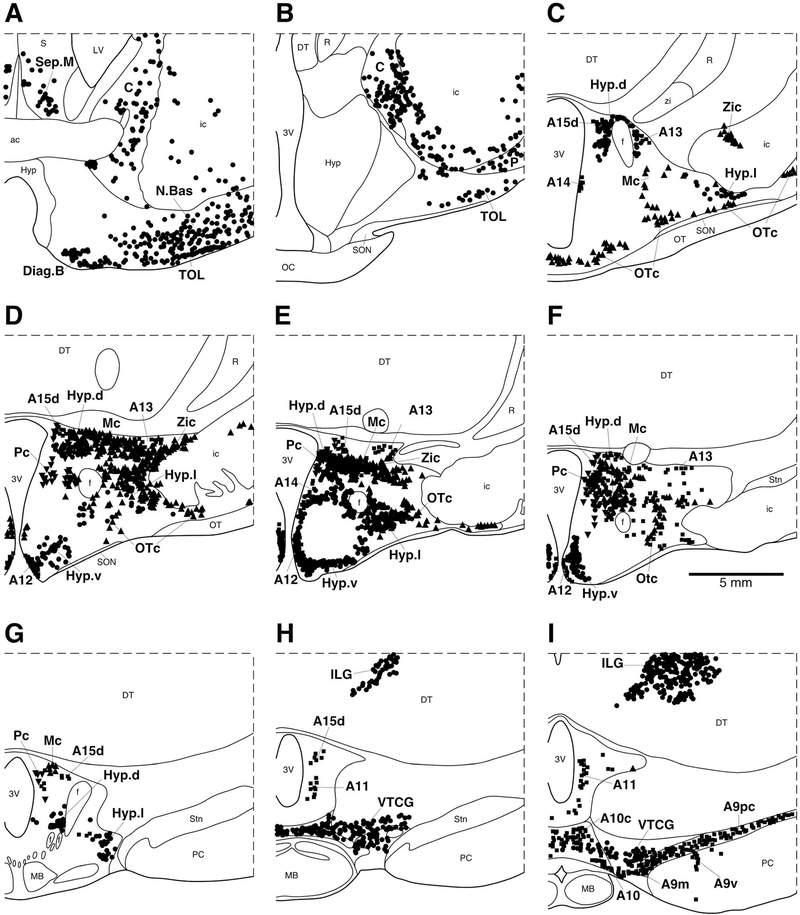
Figure 5.
A–I: Diagrammatic reconstruction of a series of coronal sections through the caudal aspect of the basal forebrain and diencephalon of the river hippopotamus illustrating the location of neurons immunoreactive for choline acetyltransferase (ChAT; circles), tyrosine hydroxylase (TH; squares) magnocellular orexinergic (OxA; triangles), and parvocellular orexinergic (OxA; inverted triangles). Each symbol represents a single neuron. The outlines of the architectonic regions were drawn using Nissl and myelin stain, and immunoreactive neurons were marked on the drawings. Note the presence of three unusual features of cholinergic nuclei in the dorsal thalamic intramedullary region, throughout the hypothalamus and in the ventral tegmental region. Panel A represents the most rostral section and I the most caudal. Each figurine is approximately 2,200 μm apart. For abbreviations, see list. Scale bar = 5 mm in F (applies to A–F).
Figure 6.
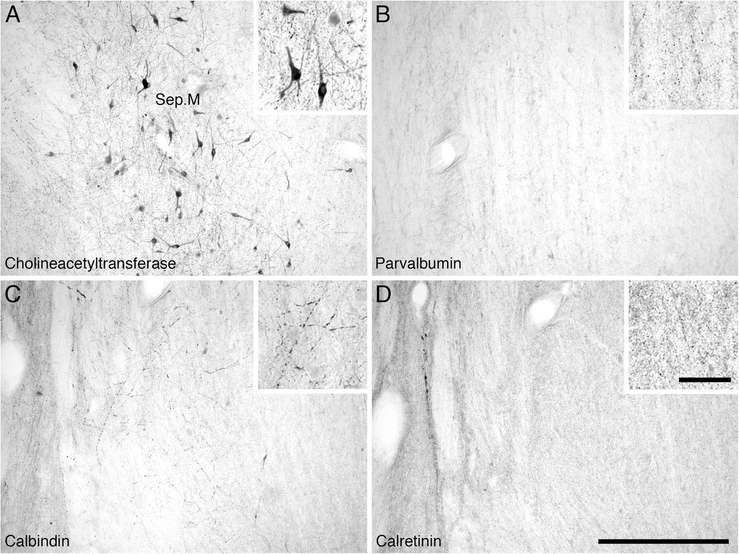
Low (main image) and high (inset) magnification photomicrographs of the medial septal nucleus (Sep.M) of the river hippopotamus. A: Neurons immunoreactive for choline acetyltransferase showing part of the medial septal nucleus (Sep.M). B: Parvalbumin immunoreactivity. Note the absence of parvalbumin-immunoreactive structures in this nucleus. C: Calbindin immunoreactivity. Note the moderate density of immunoreactive terminals and the occasional immunoreactive neuron. D: Calretinin immunoreactivity. Note the high density of immunoreactive terminals, but the absence of immunoreactive neurons. In all images medial is to the left and dorsal to the top. Scale bar = 500 μm in D (applies to A–D); 100 μm in inset to D (applies to all insets).
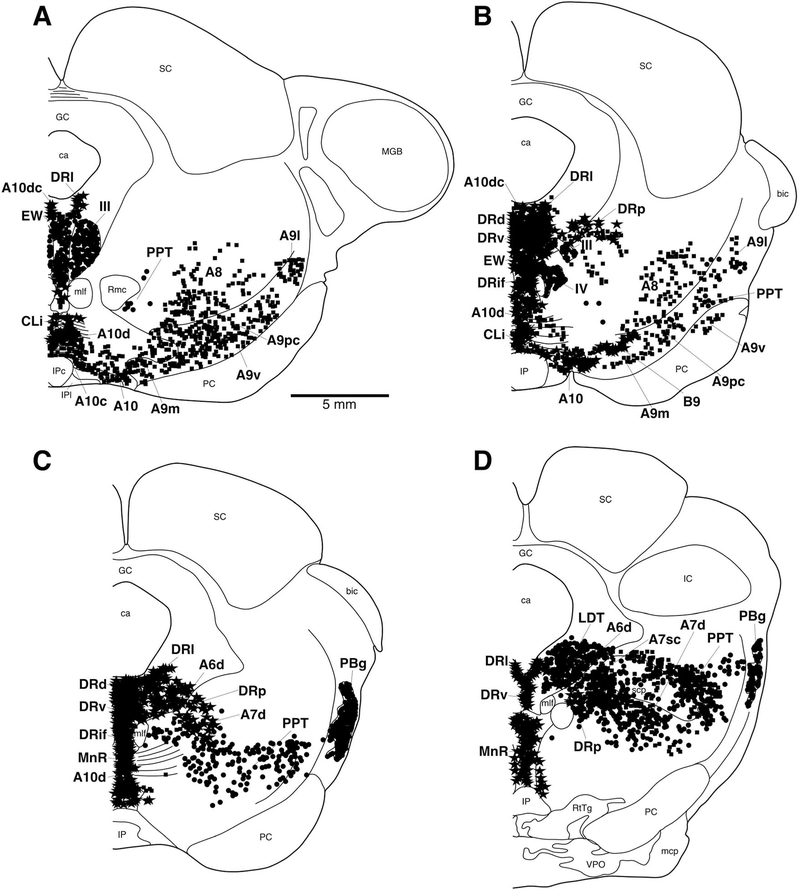
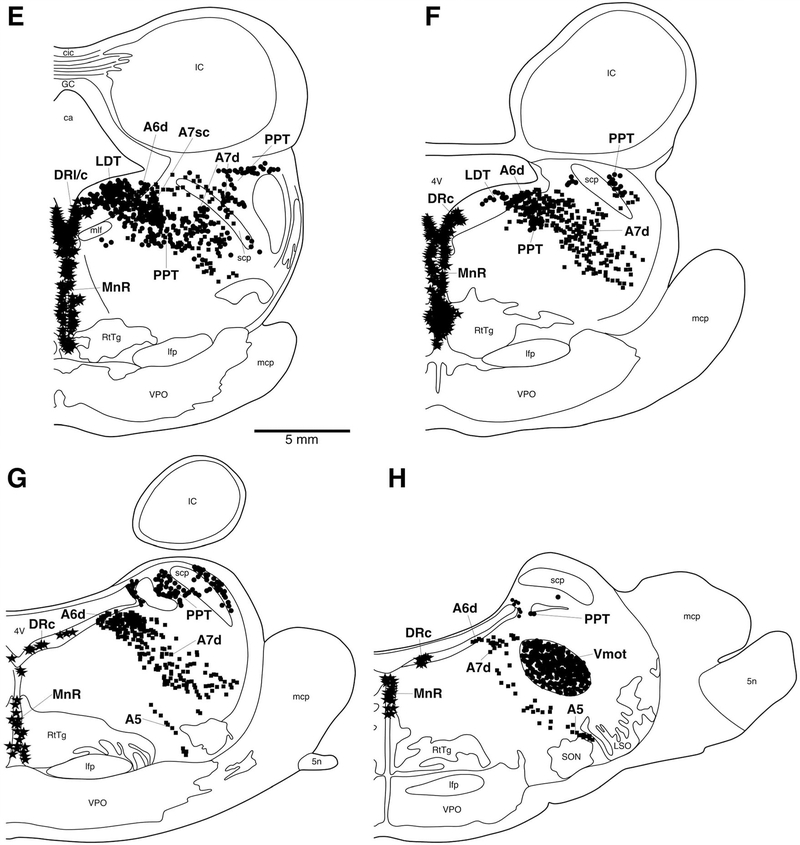
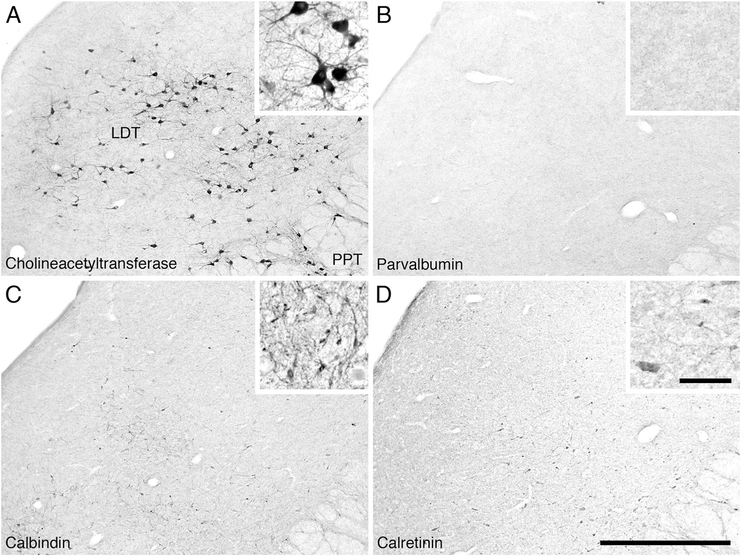
Within the pons of the river hippopotamus we were readily able to identify the PPT and LDT (Fig. 7). The PPT nucleus was found throughout the lateral pontine tegmentum with cells that often surrounded the superior cerebellar peduncle. A moderate to high density of multipolar cholinergic neurons that exhibited a variety of somal shapes but had no specific dendritic orientation was observed. Stereological analysis revealed that there were approximately 224,796 cholinergic neurons in the PPT. These neurons had a mean somal volume of 3,210.15 μm3 (± 2143.00 SD) and a mean surface area of 1,321.67 μm2 (± 681.30 SD) (Table 2). The LDT nucleus was identified in the lateroventral periaqueductal gray matter of the pons (Fig. 8A). A moderate to high density of ovoid shaped multipolar neurons with no specific somal orientation was observed. These multipolar neurons appeared to have two distinguishable sizes (Fig. 8A), which was confirmed with stereological analysis. Stereological analysis revealed a mean neuronal population estimate of 34,782 neurons within the LDT, with 20,636 neurons being classified as magnocellular and 14,146 neurons being classified as parvocellular. The magnocellular neurons had a mean somal volume of 4,523.70 μm3 (± 1,665.88 SD) and a mean surface area of 1,653.81 μm2 (± 456.20 SD), whereas the parvocellular neurons had a mean somal volume of 1,484.67 μm3 (± 956.17 SD) and a mean surface area of 735.56 μm2 (± 380.16 SD) (Table 2).
Figure 7.
A–H: Diagrammatic reconstruction of a series of coronal sections through the midbrain and pons of the river hippopotamus illustrating the location of neurons immunoreactive for choline acetyltransferase (ChAT; circles), tyrosine hydroxylase (TH; squares), and serotonergic (stars). Each symbol represents a single neuron. The outlines of the architectonic regions were drawn using Nissl and myelin stain, and immunoreactive neurons were marked on the drawings. Panel A represents the most rostral section and H the most caudal. Each figurine is approximately 2,200 μm apart. For abbreviations, see list. Scale bar = 5 mm in A and E (applies to A–H).
TABLE 2.
Stereological Results for Cell Numbers, Volume, and Area in the River Hippopotamus
| Nucleus examined | Total estimated population using mean section thickness | Average estimated cell volume (μm3) | Average estimated cell area (μm2) |
|---|---|---|---|
| LDT (ChAT+) | 34,782 | - | - |
| LDT (ChAT+) magnocellular | 20,636 | 4,523.70 | 1,653.81 |
| LDT (ChAT+) parvocellular | 14,146 | 1,484.67 | 735.56 |
| PPT (ChAT+) | 224,796 | 3,210.15 | 1,321.67 |
| LC (TH+) | 127,752 | 1,644.64 | 680.23 |
| Orexin (OxA+) all cells | 68,398 | - | - |
| Orexin (OxA+) magnocellular | 30,194 | 3,737.14 | 1,712.09 |
| Orexin (OxA+) parvocellular | 38,204 | 1,851.17 | 907.93 |
Abbreviations: LDT, laterodorsal tegmental nucleus; PPT, pedunculopontine tegmental nucleus; LC, locus coeruleus complex; ChAT+, neurons immunopositive for cholineacetyltransferase; TH+, neurons immunopositive for tyrosine hydroxylase;, OxA+, neurons immunopositive for orexin-A.
Figure 8.
Low (main image) and high (inset) magnification photomicrographs of the laterodorsal tegmental (LDT) and pedunculopontine tegmental (PPT) cholinergic nuclei in the pons of the river hippopotamus. A: Neurons immunoreactive for choline acetyltransferase showing the laterodorsal tegmental nucleus (LDT) and part of the pedunculopontine tegmental nucleus (PPT). B: Parvalbumin immunoreactivity. Note the absence of parvalbumin-immunoreactive structures in these nuclei. C: Calbindin immunoreactivity. Note the moderate density of cells and terminals in these nuclei. D: Calretinin immunoreactivity. Note the moderate density of cells and terminals in these nuclei. In all images medial is to the left and dorsal to the top. Scale bar = 1,000 μm in D (applies to A–d); 100 μm in inset to D (applies to all insets).
Expanded and novel cholinergic groups in the river hippopotamus
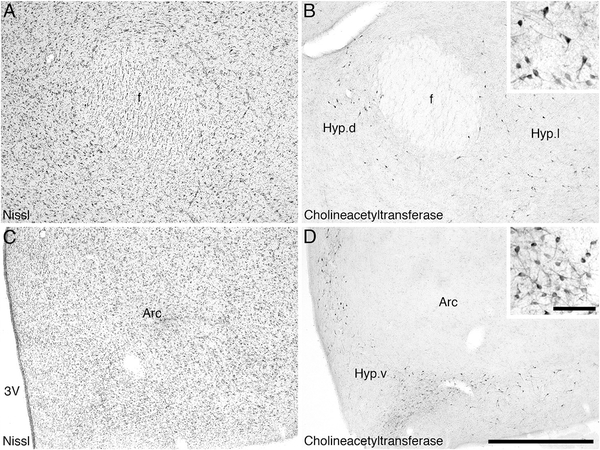
Three regions of apparent cholinergic specialization were observed in the regions of the hippopotamus brain examined in the current study. These were within the hypothalamus, the intramedullary nuclei of the dorsal thalamus, and the ventral tegmental area. Within the hypothalamus of the river hippopotamus, the three cholinergic nuclei typically found in Eutherian mammals were observed; however, in contrast to these cholinergic neurons being few in number and staining only palely for ChAT, there were a large number of neurons spread throughout much of the hypothalamus (Fig. 5C–G), and the immunostaining was quite intense (Fig. 9). Thus, the dorsal (Hyp.d), lateral (Hyp.l), and ventral (Hyp.v) hypothalamic cholinergic nuclei contained a far greater number of neurons, spread throughout a greater area of the hypothalamus, than normally seen in Eutherian mammals. The morphology of these neurons, being mostly oval-shaped and bipolar, was typical of that seen in other mammals.
Figure 9.
Low (main image) and high (inset) magnification photomicrographs showing the supernumerary choline acetyltransferase-immunoreactive neurons in the hypothalamus of the river hippopotamus. A: Nissl-stained section showing the perifornical region of the hypothalamus. B: Choline acetyltransferase-immunoreactive neurons of the dorsal (Hyp.d) and lateral (Hyp.l) hypothalamic cholinergic nuclei surrounding the fornix (f). C: Nissl-stained section of the ventromedial region of the river hippopotamus hypothalamus, showing the arcuate nucleus (Arc) and the third ventricle (3V). D: Supernumerary choline acetyltransferase-immunoreactive neurons of the ventral (Hyp.v) hypothalamic cholinergic nucleus. IN all images medial is to the left and dorsal to the top. Scale bar 1,000 μm in D (applies to A–D); 100 μm in inset to D (applies to both insets).
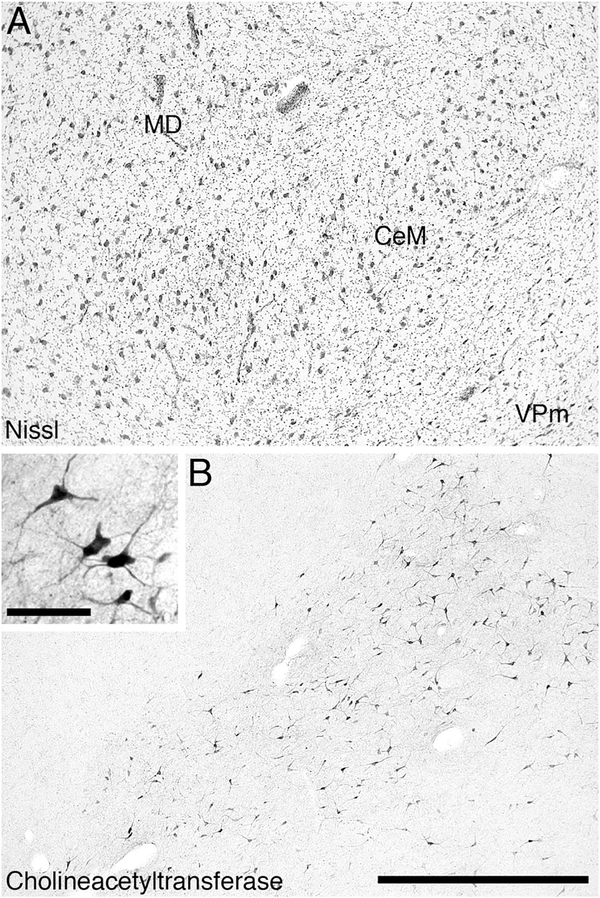
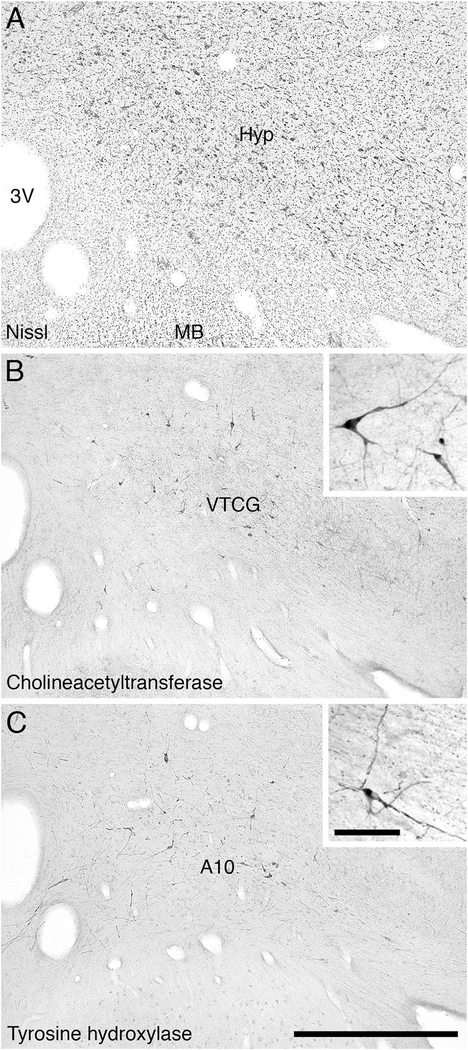
Within the dorsal thalamus of the river hippopotamus, cholinergic neurons were found in the region of the intralaminar nuclei, and specifically within the centre médian nucleus (Fig. 5H–I). We have termed this cluster of cholinergic neurons the intralaminar cholinergic group (ILG). These cholinergic neurons exhibited a variety of somal shapes, and were mostly multipolar, although the dendrites showed no specific orientation (Fig. 10). This is a novel cluster of cholinergic neurons, not previously observed in other mammals. The second novel cluster of cholinergic neurons was found overlapping with the most rostral portion of the ventral tegmental area of the river hippopotamus (Fig. 5H–I), which we term the ventral tegmental cholinergic group (VTCG). A moderately dense cluster of laterally spreading oval-shaped bipolar cholinergic neurons was observed in this region of the brain, immediately dorsal to the mammillary bodies (Fig. 11). The location of these neurons was coincident with the more rostral portions of the dopaminergic ventral tegmental area (A10) (Fig. 11C). Thus, in the river hippopotamus, we could identify three distinct specializations of the cholinergic system seemingly related to areas of the brain involved in arousal.
Figure 10.
Low (main image) and high (inset) magnification photomicrographs showing the choline acetyltransferase-immunoreactive neurons in the dorsal thalamus of the river hippopotamus. A: Nissl-stained section showing the mediodorsal nucleus (MD), the centre médian nucleus (CeM), and the medial ventral posterior nucleus (VPm). B: Choline acetyltransferase-immunoreactive neurons, with the intralaminar cholinergic group (ILG), lying within the CeM, but showing some spread into the VPm. In both images medial is to the left and dorsal to the top. Scale bar 1,000 μm in B (applies to A,B); 100 μm in inset to B.
Figure 11.
Low (main image) and high (inset) magnification photomicrographs showing the choline acetyltransferase-immunoreactive neurons in the ventral tegmental region of the river hippopotamus. A: Nissl-stained section showing the ventromedial portion of the hypothalamus (Hyp), the third ventricle (3V), and the mammillary body (MB). B: Choline acetyltransferase-immunoreactive neurons lying within the ventral tegmental area forming what we term the ventral tegmental cholinergic group (VTCG). C: Tyrosine hydroxylase-immunoreactive neurons of the ventral tegmental area (A10). In all images medial is to the left and dorsal to the top. Scale bar 1,000 μm in C (applies to A–C); 100 μm in inset to C (applies to both insets).
Putative catecholaminergic nuclei of the locus coeruleus complex
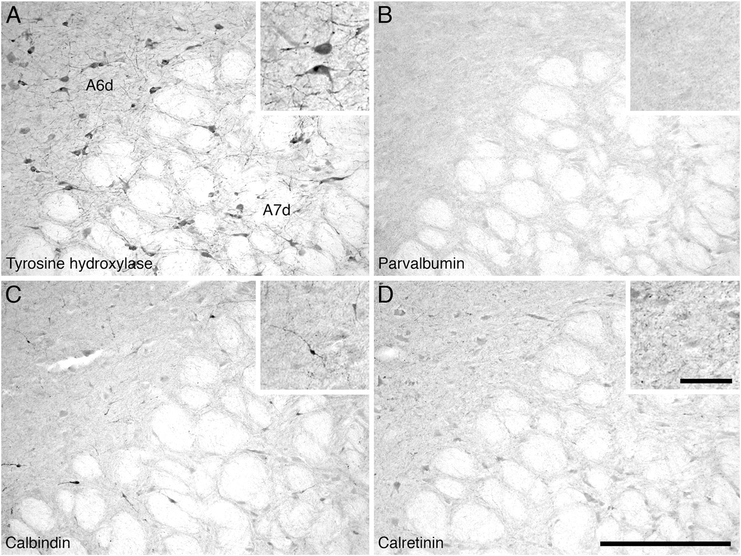
The locus coeruleus complex could be readily subdivided into four distinct clusters, the subcoeruleus compact (A7sc), the subcoeruleus diffuse (A7d), the locus coeruleus diffuse (A6d), and the fifth arcuate nucleus (A5) (Fig. 7C–H). No dorsal medial division of the locus coeruleus (A4) could be identified in the hippopotamus. The A7sc was located within the lateral portion of the pontine tegmentum, immediately adjacent to the periventricular gray matter. It contained a moderate to high density of TH-immunopositive oval-shaped bipolar and multipolar neurons that exhibited a mainly dorsolateral dendritic orientation. The A7sc neuronal population mainly consisted of bipolar neurons, and these neurons appeared smaller than those seen in the adjacent A6d. The A7d TH- immunopositive neurons were found throughout the pontine tegmentum anterior, medial and lateral to the trigeminal motor nucleus. Although the A7d is a continuation of the A7sc, the neuronal density of A7d decreased as neurons radiated away from the A7sc, but the overall neuronal density was still considered moderate. Although these neurons of the A7d showed no specific dendritic orientation, they neurons were mainly ovoid in shape and bipolar (Fig. 12A). The A6d nucleus was identified in the ventrolateral pontine periaqueductal gray matter in a similar region to the cholinergic LDT nucleus. The A6d nucleus contained a low density of TH-immunopositive neurons that were ovoid in shape and with both multipolar and bipolar types (Fig. 12A). The majority of these neurons were bipolar, and exhibited no specific dendritic orientation. A small number of TH-immunoreactive neurons ventral to the trigeminal motor nucleus formed the fifth arcuate nucleus (A5) (Fig. 7G–H). Stereological analysis revealed that the locus coeruleus complex as a whole contained approximately 127,752 neurons, with a mean somal volume of 1,644.64 μm3 (± 665.87 SD) and an average surface area of 680.23 μm2 (± 228.53 SD) (Table 2).
Figure 12.
Low (main image) and high (inset) magnification photomicrographs in the region of the diffuse division of the locus coeruleus (A6d) and the subcoeruleus diffuse division (A7d) of the locus coeruleus complex in the pons of the river hippopotamus. A: Neurons immunoreactive for tyrosine hydroxylase showing the diffuse portions of both the locus coeruleus (A6d) and subcoeruleus (A7d). Note the absence of structures immunoreactive for parvalbumin (B), the moderate density of calbindin structures (C), and the very low density of structures immunoreactive for calretinin (D) in these nuclei. In all images medial is to the left and dorsal to the top. Scale bar = 500 μm in D (applies to A–D); 100 μm in inset to D (applies to all insets).
Serotonergic nuclei of the dorsal raphe complex
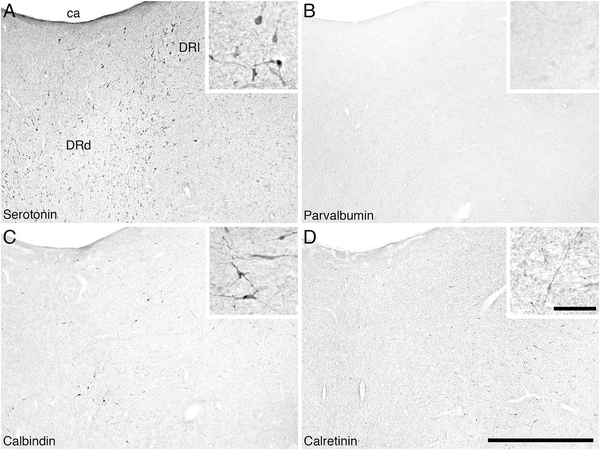
The neurons immunoreactive to the serotonin antibody, which formed the dorsal raphe complex, were located mostly within the periaqueductal gray matter close to the midline, but occasionally spreading further laterally and into the midbrain and pontine tegmentum, which is typical for mammals (Fig. 7). Six distinct divisions of the dorsal raphe complex could be identified: the interfascicular (DRif), ventral (DRv), dorsal (DRd), lateral (DRl), peripheral (DRp), and caudal (DRc) divisions. The DRif nucleus was located between the two medial longitudinal fasciculi. It contained a low to moderate density of oval bipolar neurons that had a dorsoventral dendritic orientation. The DRv nucleus was identified in the ventromedial region of the periaqueductal gray matter, immediately dorsal to the DRif. The DRv contained a moderate to high density of spherical multipolar and bipolar serotonergic neurons showing no specific dendritic orientation. The DRd was located dorsal to the DRv within the dorsomedial periaqueductal gray matter (Fig. 13A). The cell morphology and dendritic orientation of the DRd resembled that seen in the DRv, but no multipolar neurons were present. The DRl nucleus was found dorsolateral to the DRd within the periaqueductal gray matter (Fig. 13A). The serotonergic neurons of the DRl were observed in a moderate to high density and were identified as having larger multipolar neurons showing no specific dendritic orientation. The DRp nucleus was identified in the ventrolateral portion of the periaqueductal gray matter, with some neurons being found in the adjacent midbrain tegmentum (Fig. 7B,C). It contained a moderate to high density of oval-shaped bipolar and multipolar neurons, all displaying no specific dendritic orientation. The DRc nucleus was identified within the most rostral region of the periventricular gray matter, stretching across the midline. The neurons within this nucleus were similar to those of the DRl, the DRc appearing to form a caudal continuation of the DRl.
Figure 13.
Low (main image) and high (inset) magnification photomicrographs in the region of the dorsal raphe dorsal (DRd) and lateral (DRl) divisions of the dorsal raphe nuclear complex in the river hippopotamus. A: Neurons immunoreactive for serotonin showing the dorsal and lateral divisions of the dorsal raphe complex in close proximity to the cerebral aqueduct (ca). B: Parvalbumin immunoreactivity. Note the absence of parvalbumin-immunoreactive structures in these nuclei. C: Calbindin immunoreactivity. Note the moderate density of cells and terminals. D: Calretinin immunoreactivity. Note the moderate density of terminals, but lack of cells. In all images medial is to the left and dorsal to the top. Scale bar = 1,000 μm in D (applies to A–D); 100 μm in inset to D (applies to all insets).
Orexinergic nuclei of the hypothalamus
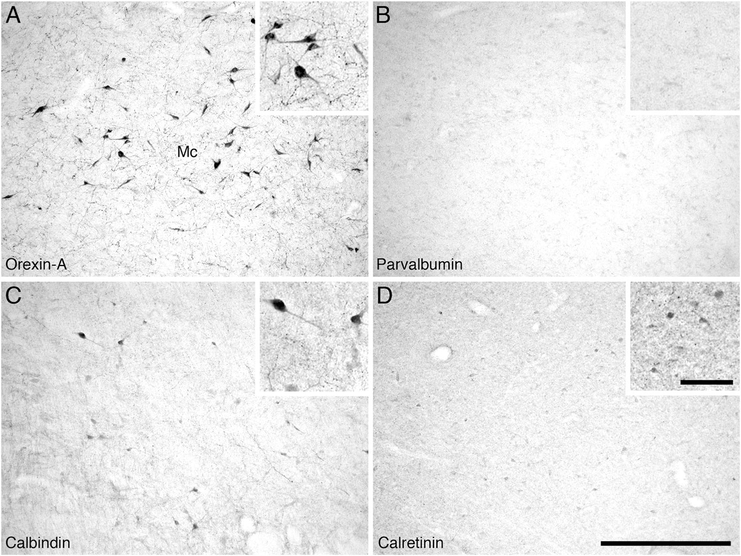
In Cetartiodactyls, the orexinergic neurons can be divided into a single medially located parvocellular cluster, along with three magnocellular clusters, the main, optic tract, and zona incerta clusters, based on distinguishable size and topographical differences (Dell et al., 2012). In this sense, the hippopotamus exhibits the same clustering of orexinergic neurons as in the other Cetartiodactyls (Fig. 5C–F). For the magnocellular clusters in the hippopotamus, the main cluster was located within the perifornical region and the lateral hypothalamus. It contained a moderate to high density of orexinergic neurons that were oval in shape and bipolar and multipolar in type, all of which showed no specific dendritic orientation (Fig. 14A). The orexinergic neurons forming the optic tract cluster were located in the lateral and ventral aspect of the hypothalamus, close to the dorsal edge of the optic tract. This cluster exhibited a moderate density of ovoid, bipolar, and multipolar orexinergic neurons with a rough mediolateral dendritic orientation, running parallel to the orientation of the optic tract. On occasion, these orexinergic neurons could be found up to 5 mm from the recognizable lateral edge of the hypothalamus, below the internal capsule (Fig. 5B–E). The orexinergic neurons forming the zona incerta cluster were located in the dorsolateral hypothalamus, sometimes extending out of the hypothalamus into the region of the zona incerta. This cluster contained a moderate density of ovoid, bipolar, and multipolar orexinergic neurons that showed no specific dendritic orientation. A stereological analysis revealed a mean population of 30,194 magnocellular orexinergic neurons with a mean somal volume of 3,737.14 μm3 (± 508.13 SD) and an average surface area of 1,712.09 μm2 (± 333.12 SD) (Table 2).
Figure 14.
Low (main image) and high (inset) magnification photomicrographs in the region of the main magnocellular orexinergic cluster (Mc) in the hypothalamus of the river hippopotamus. A: Neurons immunoreactive for orexin-A in the main cluster of the hypothalamus. B: Parvalbumin immunoreactivity. Note the absence of parvalbumin-immunoreactive structures in this hypothalamic region. C: Calbindin immunoreactivity. Note the moderate density of cells and terminals in this region of the hypothalamus. D: Calretinin immunoreactivity. Note the moderate density of cells and terminals in this region of the hypothalamus. In all images medial is to the left and dorsal to the top. Scale bar = 500 μm in D (applies to A–D); = 100 μm in inset to D (applies to all insets).
The cluster of parvocellular orexinergic neurons was located in the medial zone of the hypothalamus, between the fornix and the wall of the third ventricle (Fig. 5D–G). It contained a low to moderate density of ovoid bipolar neurons that exhibited no specific dendritic orientation. Stereological analysis revealed that there were approximately 38,204 of these parvocellular orexinergic neurons, and that they had a mean volume of 1,851.17 μm3 (± 605.11 SD) and a mean surface area of 907.93 μm2 (± 326.72 SD) (Table 2), making them about half the size of the magnocellular orexinergic neurons.
Neurons and terminal networks containing calcium binding proteins
Immunohistochemistry for the calcium binding proteins CB, CR, and PV was performed to label subtypes of GABAergic neurons that are active during different sleep–wake states and during transitions between these states (Siegel, 2004; Jones, 2007; Bhagwandin et al., 2013). The results described below, summarized in Table 3, detail the density of neurons and terminal networks immunopositive for CB, CR, and PV in relation to the sleep–wake-related nuclei associated with the cholinergic, catecholaminergic, serotonergic, and orexinergic systems as well as the thalamic reticular nucleus.
TABLE 3.
Density of Neurons and Terminal Networks of the Calcium Binding Proteins Calbindin (CB), Calretinin (CR), and Parvalbumin (PV) in Relation to Various Sleep–Wake Nuclei in the Brain of the River Hippopotamus1
| Calbindin |
Calretinin |
Parvalbumin |
||||
|---|---|---|---|---|---|---|
| Sleep-related nuclei | Neurons | Terminal networks | Neurons | Terminal networks | Neurons | Terminal networks |
| Cholinergic | ||||||
| Medial septal nucleus | + + | + + | − | + + + | − | − |
| Diagonal band of Broca | + + | + + + | + | + + | + | + + |
| Islands of Calleja and olfactory tubercle | + + | + + | + | + + | + | + |
| Nucleus basalis | + + | + + | + | + + | + | + |
| Pedunculopontine tegmental nucleus | + | + + | + + | + + + | + | + |
| Laterodorsal tegmental nucleus | + + | + + + | + + | + + + | + | + |
| Catecholaminergic | ||||||
| Compact subcoeruleus (A7sc) | + | + + | + + | + + | + | + |
| Diffuse subcoeruleus (A7d) | + | + | + | + + | + + | + + |
| Diffuse locus coeruleus (A6d) | + | + + | + | + + | − | + |
| Serotonergic | ||||||
| Dorsal raphe, interfascicular (DRif) | + | + + | + | + | + | + |
| Dorsal raphe, ventral (DRv) | + + | + + + | + | + + | − | + |
| Dorsal raphe, dorsal (DRd) | + + | + + | + | + | − | + |
| Dorsal raphe, lateral (DRl) | + + | + + | + + | + + | + | + |
| Dorsal raphe, peripheral (DRp) | + + | + + | + + | + + + | + | + |
| Dorsal raphe, caudal (DRc) | + + | + + + | + + | + + | + | + |
| Orexinergic | ||||||
| Main cluster | + + | + + | + + | + + | − | + |
| Optic tract cluster | + + | + + + | + + | + + + | + | + |
| Zona incerta cluster | + + | + + | + | + + + | + | + |
| Parvocellular cluster | + + + | + + + | + + | + + | + | + |
| Thalamic reticular nucleus | − | − | − | − | + + + | + + + |
−, absence; +, low density; ++, moderate density; + + +, high density.
Neurons and terminal networks containing calcium binding proteins in the basal forebrain and pontine cholinergic system
A moderate density of CB-immunopositive neurons coupled with a moderate-density CB-immunopositive terminal network was observed in the medial septal nucleus (Fig. 6C). The medial septal nucleus contained no CR-immunopositive neurons, but had a high density of CR+ terminal networks (Fig. 6D), and there was a complete absence of PV-immunopositive structures (Fig. 6B). A moderate density of CB-immunopositive neurons coupled with a high-density CB-immunopositive terminal network was identified in the diagonal band of Broca. Both the nucleus basalis and the islands of Calleja/olfactory tubercle contained a moderate density of CB-immunopositive neurons and moderately dense CB-immunopositive terminal networks. A low density of CR-immunopositive neurons coupled with a moderate-density CR-immunopositive terminal network was found in the diagonal band of Broca, the islands of Calleja/olfactory tubercle, and the nucleus basalis. A low density of PV-immunopositive neurons and low-density PV-immunopositive terminal networks were observed in the islands of Calleja/olfactory tubercle and the nucleus basalis. Although the diagonal band of Broca had a low PV-immunopositive neuronal density, it exhibited a moderate-density PV-immunopositive terminal network.
Within both the LDT and PPT, a low density of PV-immunopositive neurons and a low-density PV-immunopositive terminal network was observed (Fig. 8B). A low density of CB-immunopositive neurons and a moderately dense CB-immunopositive terminal network was observed in the PPT, whereas the LDT contained a moderate density of CB-immunopositive neurons coupled with a high-density CB-immunopositive terminal network (Fig. 8C). A moderate CR-immunopositive neuron density combined with a high-density CR-immunopositive terminal network was observed in both the PPT and LDT (Fig. 8D).
Neurons and terminal networks containing calcium binding proteins in the locus coeruleus complex
A low PV-immunopositive neuron and terminal network density was observed throughout the A7sc, while the A7d contained a moderate density of PV-immunopositive neurons and a moderate-density PV-immunopositive terminal network. No PV-immunopositive neurons were found in the A6d (Fig. 12B), but there was a low-density PV-immunopositive terminal network present. A low density of CB-immunopositive neurons were identified in both the A7sc and A6d, and this was combined with a moderate-density CB-immunopositive terminal network (Fig. 12C). The A7d exhibited a low density of CB-immunopositive neurons and a low-density CB-immunopositive terminal network. A moderate density of CR-immunopositive neurons with a moderately dense CB-immunopositive terminal network was identified in the A7sc. Both the A7d and A6d contained a low density of CR-immunopositive neurons coupled with moderately dense CR-immunopositive terminal networks (Fig. 12D).
Neurons and terminal networks containing calcium binding proteins in the dorsal raphe complex
Low densities of PV-immunopositive neurons and low-density PV immunopositive terminal networks were observed in the DRif, DRl, DRp, and DRc (Fig. 13B). No PV-immunopositive neurons were found in the DRv or the DRd, but low-density PV-immunopositive terminal networks were seen in both nuclei. A low density of CB-immunopositive neurons, coupled with a moderately dense CB-immunopositive terminal network, was found in the DRif. A moderate density of CB-immunopositive neurons was observed in the DRv and DRc, and this was coupled with a high-density CB-immunopositive terminal network in both divisions. A moderate density of CB-immunopositive neurons and a moderately dense CB-immunopositive terminal network were identified in the DRd, DRl, and DRp (Fig. 13C). Low densities of CR-immunopositive neurons and low-density CR-immunopositive terminal networks were identified in the DRif and DRd (Fig. 13D). The DRv also exhibited a low density of CR-immunopositive neurons, but it contained a moderately dense CR-immunopositive terminal network. The DRl and DRc exhibited a moderate density of CR-immunopositive neurons with a moderately dense CR-immunopositive terminal network, whereas in the DRp a moderate density of CR-immunopositive neurons coupled with a high-density CR-immunopositive terminal network was observed.
Neurons and terminal networks containing calcium binding proteins in the hypothalamic orexinergic complex
No PV-immunopositive neurons were located in the main cluster of orexinergic neurons, but a low-density PV-immunopositive terminal network was observed (Fig. 14B). A low density of PV-immunopositive neurons with low-density PV-immunopositive terminal networks was observed in the optic tract, zona incerta, and medial parvocellular orexinergic clusters. A moderate density of CB-immunopositive neurons and moderately dense CB-immunopositive terminal networks were observed in both the main and zona incerta clusters (Fig. 14C). A moderate density of CB-immunopositive neurons was also identified in the optic tract cluster, but this was coupled with a high-density CB-immunopositive terminal network. The medially located parvocellular cluster contained a high density of CB-immunopositive neurons and a high-density CB-immunopositive terminal network. A moderate density of CR-immunopositive neurons and a moderately dense CR-immunopositive terminal network were observed in the main cluster (Fig. 14D). A moderate density of CR-immunopositive neurons was identified in both the optic tract and parvocellular clusters, but the former contained a high-density CR-immunopositive terminal network whereas the latter displayed only a moderately dense CR-immunopositive terminal network. Although the zona incerta contained a low density of CR-immunopositive neurons, it displayed a high-density CR-immunopositive terminal network.
Neurons and terminal networks containing calcium binding proteins in thalamic reticular nucleus
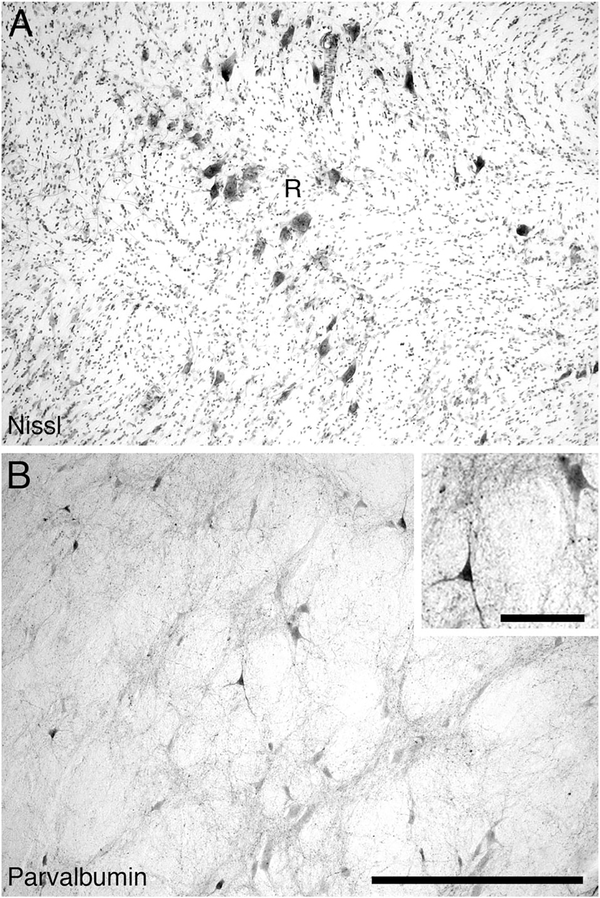
The thalamic reticular nucleus of the river hippopotamus occupied a position typical of mammals (Figs. (5 and 15)A). No CB- or CR-immunopositive neurons and/or terminal networks were seen in the thalamic reticular nucleus. In contrast, a moderate density of PV-immunopositive neurons and a high-density PV-immunopositive terminal network were located within the thalamic reticular nucleus (Fig. 15B).
Figure 15.
Low (main image) and high (inset) magnification photomicrographs of the thalamic reticular nucleus in the diencephalon of the river hippopotamus brain. A: Nissl stain showing the low density of neurons within the thalamic reticular nucleus. B: Parvalbumin immunoreactivity. Note the moderate density of parvalbumin-immunoreactive cells and the moderate density of the parvalbumin-immunoreactive terminal network. In both images medial is to the left and dorsal to the top. Scale bar = 500 μm in B (applies to A,B); 100 μm in inset to B.
DISCUSSION
The present study detailed the anatomy of the neural systems related to the control and regulation of sleep and wake in the river hippopotamus. As hippopotami are a sister taxon to cetaceans (Price et al., 2005), it was thought that examination of the hippopotamus brain may provide clues to the neural control and evolution of the unusual sleep phenomenology found in cetaceans (Lyamin et al., 2008). In many ways, the nuclear organization of the cholinergic, catecholaminergic, serotonergic, and orexinergic systems, from the basal forebrain through to the pons, was very similar to that seen in many other mammals (Manger et al., 2003; Bhagwandin et al., 2008; Kruger et al., 2010; Dell et al., 2010, 2012, 2013, 2016a,b; Calvey et al., 2013). Expression of the calcium binding proteins (PV, CB, and CR), mostly occurring in GABAergic neurons and terminal networks (but see Gritti et al., 2003), associated with the nuclei involved in the control and regulation of sleep was also similar in organization to that seen in other mammals (Bhagwandin et al., 2013; Dell et al., 2016a,b), although minor differences were noted.
In stark contrast to this general similarity to other mammals, four unusual features relating to the cholinergic system were observed in the river hippopotamus. Within the hippopotamus hypothalamus, seemingly supernumerary cholinergic neurons were present. Cholinergic neurons are normally found in three small distinct clusters in the Eutherian mammal hypothalamus (Woolf, 1991; Manger et al., 2002; Bux et al., 2010; Maseko et al., 2007; Dell et al., 2010; Patzke et al., 2014); thus the presence of a large number of cholinergic neurons forming very large clusters in the hippopotamus is a unique feature. The second unusual feature was the presence of two different size cholinergic neurons in the LDT of the pons. In most mammals the somata of the cholinergic neurons forming the LDT are all of similar size (Dell et al., 2010), but different neuronal soma sizes have been noted for the rock hyrax (Gravett et al., 2009). The third unusual feature was the presence of cholinergic neurons in the intralaminar nuclei of the dorsal thalamus, a feature not noted in any other mammalian species studied to date. The last unusual feature was the presence of cholinergic neurons in the ventral tegmental area of the midbrain, intermingled with the A10 dopaminergic neurons typical of this region, which is again a feature not previously observed in other mammals. These findings indicate that although the hippopotamus is closely related to cetaceans, the result of its independent evolutionary trajectory appears to have led to a specific and specialized neural morphology that is distinct from other mammals and may affect the manner in which it sleeps.
Similarities in the nuclear organization of the sleep-related neural systems across mammals
The cholinergic nuclei of the basal forebrain and pedunculopontine nucleus of the pons, the locus coeruleus complex, the dorsal raphe complex, and the hypothalamic orexinergic system in the river hippopotamus were similar, in terms of their nuclear organization and appearance, to these nuclei in cetaceans (Manger et al., 2003; Dell et al., 2012, 2016a,b) and other artiodactyls (Bux et al., 2010; Dell et al., 2012). Moreover, these sleep-associated neural systems in the river hippopotamus had an overall similarity to that seen in other terrestrial mammals (Maseko et al., 2007; Dell et al., 2010, Calvey et al., 2013), with the noted exception of the parvocellular orexinergic cluster seen only in cetartiodactyls (Dell et al., 2012, 2016a,b) and African elephants (Maseko et al., 2013). These qualitative similarities reiterate the point that the neural systems associated with sleep are strongly conserved across mammalian species despite significant differences in sleep phenomenology (Dell et al., 2016a,b).
Similarities of the GABAergic systems across mammals
In general, the river hippopotamus exhibited what appears to be a similar organization and density of neurons and terminal networks immunopositive for calcium binding proteins within the sleep-associated nuclei as seen in cetaceans and other mammals studied to date (Bhagwandin et al., 2013; Dell et al., 2016a,b). Interestingly, when differences from other mammals were observed in the river hippopotamus, these differences mostly resembled those seen in the minke whale (Dell et al., 2016b). The organization and density of CB-immunopositive neurons and terminal networks in the basal forebrain, locus coeruleus, and orexinergic system of the hippopotamus resembled those seen in the minke whale (Dell et al., 2016b). Similarly, within the hippopotamus, the organization and density of CR-immunopositive neurons and terminal networks in the LDT/PPT and the orexinergic system, as well as that of PV-immunopositive neurons and terminal networks in the basal forebrain and LDT/ PPT, corresponded to those seen in the minke whale (Dell et al., 2016b). Interestingly, the organization and density of CB-immunopositive neurons and terminal networks in the LDT/PPT, as well as those of CR-immunopositive neurons and terminal networks in the locus coeruleus complex of the river hippopotamus were similar to those seen in both odontocetes and mysticetes, all of which showed no resemblance to other mammal species studied (Bhagwandin et al., 2013; Dell et al., 2016a,b).
Although these observations may lead to the speculation that the interplay of these GABAergic neurons could provide the basis needed to understand unihemispheric slow-wave sleep (USWS), there were also differences between the hippopotamus and the cetaceans. It was noted that the hippopotamus had no CB- or CR-immunoreactive neurons or terminal networks within the thalamic reticular nucleus, which are present in the cetaceans and other mammals (Bhagwandin et al., 2013; Dell et al., 2016a,b); however, the PV-immunoreactive neurons and terminal networks within the thalamic reticular nucleus of the hippopotamus were identical to those seen in cetaceans and other mammals (Bhagwandin et al., 2013; Dell et al., 2016a,b). The basal forebrain of the hippopotamus contained a very low density of CB-immunopositive neurons, but had a high-density CR-immunopositive terminal network compared with cetaceans and other mammals previously studied (Bhagwandin et al., 2013; Dell et al., 2016a,b). This difference could possibly allow for increased local inhibitory circuitry within the basal forebrain and may allow for cortical activity to more rapidly switch from low-frequency to high-frequency activity (Kiss et al., 1997; Dringenberg and Olmstead, 2003; Gritti et al., 2003). Lastly, within the orexinergic region of the hypothalamus, the hippopotamus had a high density of PV-immunoreactive neurons, like those seen in the harbor porpoise (Dell et al., 2016a), and a high-density PV-immunoreactive terminal network, like that seen in the minke whale (Dell et al., 2016b). Thus, the representation of the various neuronal subtypes of the GABAergic system within the sleep-related nuclei in the hippopotamus shows a mixture of typically mammalian- and cetacean-like features, but one could conclude that overall, they display a complement of features specific to the hippopotamus.
Does the anatomy of the sleep-associated systems provide any clues as to how a hippopotamus might sleep?
Given their sister-group affinity to cetaceans and their semiaquatic lifestyle, it might be postulated that hippopotami represent a stage on the way to becoming fully aquatic cetaceans. In this sense, the brain and behavior of the hippopotami are thought to potentially partially reflect the trajectory of evolutionary changes that cetaceans underwent when returning to an aquatic habitat (Butti et al., 2014). However, as the last common ancestor of the hippopotamus and cetacean lineages was known to occur at least 50 million years ago, before cetaceans became fully aquatic (Thewissen, 1998), it is entirely possible that the hippopotamus brain morphology, physiology, and resultant behaviors, have undergone as many independent evolutionary changes as the cetacean brain has undergone.
Although no physiological studies of sleep in hippopotami have been undertaken, they are known to be able to sleep on land and either partially or fully submerged in water (Fig. 1), and appear to show signs of REM sleep (Pacini and Harper, 2008; Lyamin et al., 2013). As with most mammals, including cetaceans, the neural systems associated with sleep in the hippopotamus are mostly similar. In our earlier studies of the sleep-associated neural systems in cetaceans (Dell et al., 2012, 2015, 2016a,b), we proposed that a suite of quantitative changes in certain regions of the cetacean brain associated with the regulation and control of sleep and wake, rather than changes in qualitative features, is likely to account for the production of USWS and suppressed REM sleep, the sleep typically observed in odontocete cetaceans (Lyamin et al., 2008). These features included small telencephalic commissures, a large posterior commissure, supernumerary cholinergic and noradrenergic neurons in the pons, and an expanded peripheral division of the dorsal raphe nuclei. Here we examine whether this suite of features is applicable to the hippopotamus.
The three main telencephalic commissures (the anterior commissure, the corpus callosum, and the hippocampal commissure) in the hippopotamus brain do not appear to be reduced in size, as is seen in cetaceans. The anterior commissure of the hippopotamus (Fig. 5A) is of a size that would appear normal for a mammal. The cross-sectional area of the corpus callosum in both hippopotamus brains, at 1.3 and 2.4 cm2, places them well within the normal range observed for other mammals, with callosa substantially larger than cetaceans (Manger et al., 2010). The size of the hippocampus and the associated commissure, as well as the structure of the hippopotamus hippocampus, is also what would be expected for a typical mammal of their brain size (Patzke et al., 2015). Thus, unlike cetaceans, there is not a reduction in the size of the telencephalic commissures in the hippopotamus, arguing that it would be more difficult for the hippopotamus cerebral hemispheres to act as independent units, as seen during sleep in cetaceans. In addition to this, the size of the posterior commissure of the hippopotamus did not appear enlarged, as is seen in cetaceans (Lyamin et al., 2008; Dell et al., 2016a,b).
The numbers of cholinergic and noradrenergic neurons of the pontine region within the hippopotamus relate an interesting story. The hippopotamus was found to have 127,752 locus coeruleus neurons, whereas the large brained minke whale had 203,686 locus coeruleus neurons (Dell et al., 2016b), and the harbor porpoise, with a similar brain mass to the hippopotamus, had 122,878 locus coeruleus neurons (Dell et al., 2016a). In this sense, as with the cetaceans, the hippopotamus has substantially more neurons in the locus coeruleus than the human (which has around 22,000 locus coeruleus neurons; Mouton et al., 1994). In contrast, the hippopotamus has 34,782 cholinergic neurons in the LDT (20,363 magnocellular neurons and 14,146 parvocellular neurons), whereas the harbor porpoise has 15,642 LDT neurons and the minke whale only 13,320 LDT neurons (Dell et al., 2016a,b). Thus, the hippopotamus has a markedly larger number of LDT cholinergic neurons than the cetaceans. When these numbers are combined with the cholinergic neurons of the PPT (hippopotamus, 224,796; harbor porpoise, 111,134; minke whale, 260,922; Dell et al., 2016a,b), the hippopotamus rivals the larger brained minke whale and outstrips the harbor porpoise, which has a similar brain mass. Again, the hippopotamus, as with the cetaceans, has far greater numbers of cholinergic neurons in the pons than the human (which has around 20,000 for the LDT and PPT combined; Manaye et al., 1999). In this sense, the hippopotamus, like the cetaceans, has supernumerary cholinergic and noradrenergic neurons in the pons, but it does not appear to have the enlarged posterior commissure that would allow for significant contralateral ascending and homotopic projections of these neurons, as is postulated in cetaceans.
The last feature noted in the cetaceans that was unusual compared with other mammals was the enlarged peripheral division of the dorsal raphe serotonergic nuclear complex. This feature was implicated in the potential suppression of REM sleep in the cetaceans (Dell et al., 2016a,b). Such an expansion of this serotonergic nucleus was not noted in the hippopotamus in the present study, indicating that potential REM suppression, as seen in cetaceans (Lyamin et al., 2008), is not likely to occur in the hippopotamus during sleep, supporting the behavioral observations of Lyamin and colleagues (2013). Given this mix of features, and the habitat of the hippopotamus, it appears unlikely that the hippopotamus would sleep in a manner similar to the cetaceans; however, the unusual features of the cholinergic system in the hippopotamus raise the very interesting question of how hippopotami experience sleep and wake.
The hypothalamus of the hippopotamus has a clearly expanded cholinergic system, which occurs throughout the hypothalamus, but most specifically in the dorsal, lateral, and ventromedial regions. The cholinergic neurons within the dorsomedial hypothalamus have an important role in the control of food ingestion (Groessl et al., 2013), and as these neurons send projections to the lateral hypothalamus that contain orexinergic neurons involved in arousal during the sleep–wake cycle, these cholinergic neurons may have a large indirect effect on hippopotamus sleep and arousal (Datta and McLean, 2007; Dell et al., 2012; Groessl et al., 2013). The intralaminar nuclei of the dorsal thalamus are involved in the levels of arousal of cortical and subcortical areas and are functionally correlated with awareness (Steriade, 1997; van der Werf et al., 2002). Thus, the intralaminar cholinergic neurons found in the hippopotamus may be directly involved in the promotion and maintenance of arousal. Although the ventral tegmental area is synonymous with reward circuitry, it is also involved in locomotion, aggression, and appetitive behavior (Proshansky et al., 1974; Iversen and Koob, 1977; Swanson et al., 1981; Swanson, 1982). It is thus possible that these cholinergic neurons may act to increase the salience of rewards (such as food intake), by increasing the level of arousal at their target neurons. Lastly, not only does the hippopotamus have a very large number of LDT neurons, but the presence of parvocellular cholinergic neurons in the hippopotamus LDT is also of interest. As mentioned, the only other species in which such neurons have been observed is the rock hyrax (Gravett et al., 2009). Interestingly, the rock hyrax also exhibits a phase of sleep displaying a mixture of non-REM and REM features, not found in other mammals (Gravett et al., 2012).
The hippopotamus thus appears to have several converging features of the cholinergic system that indicate arousal to be a very prominent feature of normal brain function related to sleep and wake for these animals. This is clearly of interest in terms of the type of sleep experienced by the hippopotamus. If one were to speculate, the normal-sized telencephalic commissures and posterior commissure would indicate that hippopotami undergo bihemispheric sleep; however, the presence of the large numbers of pontine cholinergic neurons, the expanded hypothalamic cholinergic system, and the novel intralaminar and ventral tegmental neurons all indicate an animal that could be very easily aroused from slumber, or easily startled by an unexpected stimulus. This possibility is supported by the strong presence of CB- and CR-immunopositive structures in the basal forebrain of the hippopotamus—perhaps the activity patterns of the hippopotamus cerebral cortex can be altered very rapidly, for example, switching from slow-wave sleep to wake in a shorter time period than occurs in other mammals. The presence of the parvocellular cholinergic neurons in the LDT also indicates that there is potential for a sleep state that cannot be classified as either REM or non-REM in the hippopotamus. This series of speculations could be readily resolved by recording the physiological parameters of sleep in the hippopotamus, although this is a daunting technical and physical task. It would appear safe to conclude that the hippopotamus does not share a specific sleep physiology with the cetaceans, and, given its long independent evolutionary trajectory, is best considered to be its own very unusual Cetartiodactyl, rather than a stage on the way to becoming a cetacean.
ACKNOWLEDGMENTS
We thank the Copenhagen Zoo for allowing us to harvest the brains from the two hippopotami.
ROLE OF AUTHORS
All authors had full access to all of the data in the study and take responsibility for the integrity of the data and the accuracy of the data analysis. LAD, NP, MAS, MFB, JMS, and PRM conceptualized the study. MFB and PRM obtained the brains, and LAD, NP, and PRM did the immunohistochemical staining and reconstructions. LAD and MAS undertook the quantitative and statistical analysis of the data. LAD and PRM wrote the manuscript, and the remaining authors contributed to the editing and improvement of the early drafts of the manuscript.
Grant sponsor: the South African National Research Foundation Innovation scholarship (to L.D.); Grant sponsor: Society, Ecosystems and Change, SeaChange; Grant number: KFD2008051700002 (to P.R.M.); Grant sponsor: ISN-CAEN travel grant (to L.D.); Grant sponsor: Postdoc-Programme of the German Academic Exchange Service (DAAD) fellowship (to N.P.); Grant sponsor: IOER R&G grant from Des Moines University; Grant number: 12-13-03 (to M.A.S.); Grant sponsor: National Institutes of Health; Grant number: DA 2R01MH064109 (to J.M.S.); Grant sponsor: Department of Veterans Affairs (to J.M.S).
Abbreviations
- III
oculomotor nucleus
- IV
trochlear nucleus
- Vmot
trigeminal motor nucleus
- 3V
third ventricle
- 4V
fourth ventricle
- 5n
trigeminal nerve
- A5
fifth arcuate nucleus
- A6d
diffuse portion of locus coeruleus
- A7d
nucleus subcoeruleus, diffuse portion
- A7sc
nucleus subcoeruleus, compact portion
- A8
retrorubral nucleus
- A9pc
substantia nigra, pars compacta
- A9l
substantia nigra, lateral
- A9m
substantia nigra, medial
- A9v
substantia nigra, ventral
- A10
ventral tegmental area
- A10c
ventral tegmental area, central
- A10d
ventral tegmental area, dorsal
- A10dc
ventral tegmental area, dorsal caudal
- A11
caudal diencephalic group
- A12
tuberal cell group
- A13
zona incerta catecholaminergic nucleus
- A14
rostral periventricular nucleus
- A15d
anterior hypothalamic group, dorsal division
- Ac
anterior commissure
- B9
supralemniscal serotonergic nucleus
- bic
brachium of inferior colliculus
- C
caudate nucleus
- ca
cerebral aqueduct
- cic
commissure of the inferior colliculus
- CLi
caudal linear nucleus
- Diag.B
diagonal band of Broca
- DRc
dorsal raphe nucleus, caudal division
- DRd
dorsal raphe nucleus, dorsal division
- DRif
dorsal raphe nucleus, interfascicular division
- DRl
dorsal raphe nucleus, lateral division
- DRp
dorsal raphe nucleus, peripheral division
- DRv
dorsal raphe nucleus, ventral division
- DT
dorsal thalamus
- EW
Edinger–Westphal nucleus
- f
fornix
- GC
central gray matter
- Hyp
hypothalamus
- Hyp.d
dorsal hypothalamic cholinergic nucleus
- Hyp.l
lateral hypothalamic cholinergic nucleus
- Hyp.v
ventral hypothalamic cholinergic nucleus
- IC
inferior colliculus
- ic
internal capsule
- ILG
intralaminar cholinergic group
- IP
interpeduncular nucleus
- IPc
interpeduncular nucleus, central division
- IPl
interpeduncular nucleus, lateral division
- IS.CALL/TOL
islands of Calleja and olfactory tubercle
- LDT
laterodorsal tegmental nucleus
- lfp
longitudinal fasciculus of the pons
- lot
lateral olfactory tract
- LSO
lateral superior olivary nucleus
- LV
lateral ventricle
- MB
mammillary bodies
- Mc
main cluster of orexinergic neurons
- Mcp
middle cerebellar peduncle
- MGB
medial geniculate body
- mlf
medial longitudinal fasciculus
- MnR
median raphe nucleus
- N.Acc
nucleus accumbens
- N.Bas
nucleus basalis
- OC
optic chiasm
- OT
optic tract
- OTc
optic tract cluster of orexinergic neurons
- P
putamen nucleus
- PBg
parabigeminal nucleus
- PC
cerebral peduncle
- Pc
parvocellular cluster of orexinergic neurons
- PPT
pedunculopontine tegmental nucleus
- R
thalamic reticular nucleus
- Rmc
red nucleus, magnocellular division
- RtTg
reticulotegmental nucleus
- S
septal nuclear complex
- SC
superior colliculus
- scp
superior cerebellar peduncle
- Sep.L
lateral septal nucleus
- Sep.M
medial septal nucleus
- SON
supraoptic nucleus
- Son
superior olivary nucleus
- Stn
subthalamic nucleus
- TOL
olfactory tubercle
- VPO
ventral pontine nucleus
- VTCG
ventral tegmental cholinergic group
- zi
zona incerta
- Zic
zona incerta cluster of orexinergic neurons
Footnotes
CONFLICT OF INTEREST STATEMENT
The authors declare no conflicts of interest.
LITERATURE CITED
- Bhagwandin A, Fuxe K, Bennett NC, Manger PR. 2008. Nuclear organization and morphology of cholinergic, putative catecholaminergic and serotonergic neurons in the brains of two species of African mole-rat. J Chem Neuroanat 35:371–387. [DOI] [PubMed] [Google Scholar]
- Bhagwandin A, Gravett N, Bennett NC, Manger PR. 2013. Distribution of parvalbumin, calbindin and calretinin containing neurons and terminal networks in relation to sleep associated nuclei in the brain of the giant Zambian mole-rat (Fukomys mechowii). J Chem Neuroanat 52:69–79. [DOI] [PubMed] [Google Scholar]
- Boisserie JR, Likius A, Vignaud P, Brunet M. 2005. A new late Miocene hippopotamid from Toros-Menalla, Chad. J Vert Paleo 25:665–673. [Google Scholar]
- Butti C, Fordyce RE, Raghanti MA, Gu X, Bonar CJ, Wicinski BA, Wong EW, Roman J, Brake A, Eaves E, Spocter MA, Tang CY, Jacobs B, Sherwood CC, Hof PR. 2014. The cerebral cortex of the pygmy hippopotamus, Hexaprotodon liberiensis (Cetartiodactyla, Hippopotamidae): MRI, cytoarchitecture, and neuronal morphology. Anat Rec 297:670–700. [DOI] [PubMed] [Google Scholar]
- Bux F, Bhagwandin A, Fuxe K, Manger PR. 2010. Organization of cholinergic, putative catecholaminergic and serotonergic nuclei in the diencephalon, midbrain and pons of sub-adult male giraffes. J Chem Neuroanat 39:189–203. [DOI] [PubMed] [Google Scholar]
- Calvey T, Patzke N, Kaswera C, Gilissen E, Bennett NC, Manger PR. 2013. Nuclear organization of some immunohistochemically identifiable neural systems in three Afrotherian species—Potomogale velox, Amblysomus hottentotus and Petrodromus tetradactylus. J Chem Neuroanat 50–51:48–65. [DOI] [PubMed] [Google Scholar]
- Datta S, MacLean RR. 2007. Neurobiological mechanisms for the regulation of mammalian sleep-wake behavior: reinterpretation of historical evidence and inclusion of contemporary cellular and molecular evidence. Neurosci Biobehav Rev 31:775–824. [DOI] [PMC free article] [PubMed] [Google Scholar]
- Dell LA, Kruger JL, Bhagwandin A, Jillani NE, Pettigrew JD, Manger PR. 2010. Nuclear organization of cholinergic, putative catecholaminergic and serotonergic systems in the brains of two megachiropteran species. J Chem Neuroanat 40:177–195. [DOI] [PubMed] [Google Scholar]
- Dell LA, Patzke N, Bhagwandin A, Bux F, Fuxe K, Barber G, Siegel JM, Manger PR. 2012. Organization and number of orexinergic neurons in the hypothalamus of two species of Cetartiodactyla: A comparison of giraffe (Giraffa camelopardalis) and harbour porpoise (Phocoena phocoena). J Chem Neuroanat 44:98–109. [DOI] [PMC free article] [PubMed] [Google Scholar]
- Dell LA, Kruger JL, Pettigrew JD, Manger PR. 2013. Cellular location and major terminal networks of the orexinergic system in the brain of two megachiropterans. J Chem Neuroanat 53:64–71. [DOI] [PubMed] [Google Scholar]
- Dell LA, Spocter MA, Patzke N, Karlson KÆ, Alagaili AN, Bennett NC, Muhammed OB, Bertelsen MF, Siegel JM, Manger PR. 2015. Orexinergic bouton density is lower in the cerebral cortex of cetaceans compared to artiodactyls. J Chem Neuroanat 68:61–76. [DOI] [PMC free article] [PubMed] [Google Scholar]
- Dell LA, Patzke N, Spocter MA, Siegel JM, Manger PR. 2016a. Organization of the sleep related neural systems in the brain of the harbor porpoise (Phocoena phocoena). J Comp Neurol xxx:xxx–xxx. [DOI] [PMC free article] [PubMed] [Google Scholar]
- Dell LA, Karlsson KÆ, Patzke N, Spocter MA, Siegel JM, Manger PR. 2016b. Organization of the sleep related neural systems in the brain of the minke whale (Balaenoptera acutorostrata). J Comp Neurol DOI: 10.1002/cne.23931 [Epub ahead of print]. [DOI] [PMC free article] [PubMed] [Google Scholar]
- Dringenberg HC, Olmstead MC. 2003. Integrated contributions of the basal forebrain and thalamus to neocortical activation elicited by pedunculopontine tegmental stimulation in urethane-anesthetized rats. Neuroscience 119:839–853. [DOI] [PubMed] [Google Scholar]
- Gravett N, Bhagwandin A, Fuxe K, Manger PR. 2009. Nuclear organization and morphology of cholinergic, putative catecholaminergic and serotonergic neurons in the brain of the rock hyrax, Procavia capensis. J Chem Neuroanat 38: 57–74. [DOI] [PubMed] [Google Scholar]
- Gravett N, Bhagwandin A, Lyamin OI, Siegel JM, Manger PR. 2012. Sleep in the rock hyrax, Procavia capensis. Brain Behav Evol 79:155–169. [DOI] [PMC free article] [PubMed] [Google Scholar]
- Gritti I, Manns ID, Mainville L, Jones BE. 2003. Parvalbumin, calbindin, or calretinin in cortically projecting and GABAergic, cholinergic, or glutaminergic basal forebrain neurons of the rat. J Comp Neurol 458:11–31. [DOI] [PubMed] [Google Scholar]
- Groessl F, Jeong JH, Talmage DA, Role LW, Jo YH. 2013. Overnight fasting regulates inhibitory tone to cholinergic neurons of the dorsomedial nucleus of the hypothalamus. PLoS One 8:e60828. [DOI] [PMC free article] [PubMed] [Google Scholar]
- Gundersen HJ. 1988. The nucleator. J Microsc 151:3–21. [DOI] [PubMed] [Google Scholar]
- Gundersen HJ, Jensen EB. 1987. The efficiency of systematic sampling in stereology and its prediction. J Microsc 147:229–263. [DOI] [PubMed] [Google Scholar]
- Iversen SD, Koob GF. 1977. Behavioural implications of dopaminergic neurons in the mesolimbic system. Adv Biochem Psychopharmacol 16:209–214. [PubMed] [Google Scholar]
- Jones EG. 2007. The thalamus. Cambridge, UK: Cambridge University Press. [Google Scholar]
- Kingdon J 2003. Kingdon field guide to African mammals. Princeton, NJ: Princeton University Press. [Google Scholar]
- Kiss J, Magloczky Z, Somogyi J, Freund TF. 1997. Distribution of calretinin-containing neurons relative to other neurochemically identified cell types in the medial septum of the rat. Neuroscience 78:399–410. [DOI] [PubMed] [Google Scholar]
- Kruger JL, Dell LA, Bhagwandin A, Jillani NE, Pettigrew JD, Manger PR. 2010. Nuclear organization of cholinergic, putative catecholaminergic and serotonergic systems in the brains of five microchiropteran species. J Chem Neuroanat 40:210–222. [DOI] [PubMed] [Google Scholar]
- Lyamin OI, Manger PR, Ridgway SH, Mukhametov LM, Siegel JM. 2008. Cetacean sleep: an unusual form of mammalian sleep. Neurosci Biobehav Rev 32:1451–1484. [DOI] [PMC free article] [PubMed] [Google Scholar]
- Lyamin OI, Lapierre JL, Mukhametov LM 2013. Sleep in aquatic species. In: Kushida C, editor. The encyclopedia of sleep, vol 1. Waltham, MA: Academic Press. p. 57–62. [Google Scholar]
- Manaye KF, Zweig R, Wu D, Hersh LB, De Lacalle S, Saper CB, German DC. 1999. Quantification of cholinergic and select non-cholinergic mesopontine neuronal populations in the human brain. Neuroscience 89:759–770. [DOI] [PubMed] [Google Scholar]
- Manger PR, Fahringer HM, Pettigrew JD, Siegel JM. 2002. Distribution and morphology of cholinergic neurons in the brain of the monotremes as revealed by ChAT immunohistochemistry. Brain Behav Evol 60:275–297. [DOI] [PMC free article] [PubMed] [Google Scholar]
- Manger PR, Ridgway SH, Siegel JM. 2003. The locus coeruleus complex of the bottlenose dolphin (Tursiops truncatus) as revealed by tyrosine hydroxylase immunohistochemistry. J Sleep Res 12:149–155. [DOI] [PMC free article] [PubMed] [Google Scholar]
- Manger PR, Pillay P, Maseko B, Bhagwandin A, Gravett N, Moon D, Jillani N, Hemingway J. 2009. Acquisition of the brain of the African elephant (Loxodonta africana): perfusion-fixation and dissection. J Neurosci Methods 179:16–21. [DOI] [PubMed] [Google Scholar]
- Manger PR, Hemingway J, Haagensen M, Gilissen E. 2010. Cross-sectional area of the elephant corpus callosum: comparison to other Eutherian mammals. Neuroscience 167:815–824. [DOI] [PubMed] [Google Scholar]
- Manger PR, Prowse M, Haagensen M, Hemingway J. 2012. Quantitative analysis of neocortical gyrencephaly in African elephants (Loxodonta africana) and six species of cetaceans: comparison with other mammals. J Comp Neurol 520:2430–2439. [DOI] [PubMed] [Google Scholar]
- Maseko BC, Bourne JA, Manger PR. 2007. Distribution and morphology of cholinergic, putative catecholaminergic and serotonergic neurons in the brain of the Egyptian Rousette flying fox, Rousettus aegyptiacus. J Chem Neuroanat 34:108–127. [DOI] [PubMed] [Google Scholar]
- Maseko BC, Spocter MA, Haagensen M, Manger PR. 2011. Volumetric analysis of the African elephant ventricular system. Anat Rec 294:1412–1417. [DOI] [PubMed] [Google Scholar]
- Maseko BC, Spocter MA, Haagensen M, Manger PR. 2012. Elephants have relatively the largest cerebellum size of mammals. Anat Rec 295:661–672. [DOI] [PubMed] [Google Scholar]
- Maseko BC, Patzke N, Fuxe K, Manger PR. 2013. Architectural organization of the African elephant diencephalon and brainstem. Brain Behav Evol 82:83–128. [DOI] [PubMed] [Google Scholar]
- Mouton PR, Pakkenberg B, Gundersen HJG, Price DL. 1994. Absolute number and size of pigmented locus coeruleus neurons in young and aged individuals. J Chem Neuroanat 7:185–190. [DOI] [PubMed] [Google Scholar]
- Pacini N, Harper DM. 2008. Aquatic, semi-aquatic and riparian vertebrates. In: Dudgeon D, editor. Tropical stream ecology. London: Academic Press. p. 147–197. [Google Scholar]
- Patzke N, Bertelsen MF, Fuxe K, Manger PR. 2014. Nuclear organization of cholinergic, catecholaminergic, serotonergic and orexinergic systems in the brain of the Tasmanian devil (Sarcophilus harrisii). J Chem Neuroanat 61–62:94–106. [DOI] [PubMed] [Google Scholar]
- Patzke N, Spocter MA, Karlsson KÆ, Bertelsen MF, Haagensen M, Chawana R, Streicher S, Kaswera C, Gilissen E, Alagaili AN, Mohammed OB, Reep RL, Bennett NC, Siegel JM, Ihunwo AO, Manger PR. 2015. In contrast to many other mammals, cetaceans have relatively small hippocampi that appear to lack adult neurogenesis. Brain Struct Funct 220:361–383. [DOI] [PMC free article] [PubMed] [Google Scholar]
- Price SA, Bininda-Emonds OR, Gittleman JL. 2005. A complete phylogeny of the whales, dolphins and even-toed hoofed mammals (Cetartiodactyla). Biol Rev 80:445–473. [DOI] [PubMed] [Google Scholar]
- Proshansky C, Bandler RJ, Flynn JP. 1974. Elimination of hypothalamically elicited biting attack by unilateral lesion of the ventral midbrain tegmentum of cats. Brain Res 77: 309–313. [DOI] [PubMed] [Google Scholar]
- Siegel JM. 2004. The neurotransmitters of sleep. J Clin Psychiatr 65:4–7. [PMC free article] [PubMed] [Google Scholar]
- Steriade M 1997. Synchronized activities of coupled oscillators in the cerebral cortex and thalamus at different levels of vigilance. Cereb Cortex 7:583–604. [DOI] [PubMed] [Google Scholar]
- Swanson LW. 1982. The projections of the ventral tegmental area and adjacent regions: a combined fluorescent retrograde tracer and immunofluorescence study in the rat. Brain Res Bull 9:321–353. [DOI] [PubMed] [Google Scholar]
- Swanson LW, Sawchenko PE, Cowen WM. 1981. Evidence for collateral projections by neurons in Ammon’s horn, the dentate gyrus, and the subiculum: a multiple retrograde labeling study in the rat. J Neurosci 1:548–559. [DOI] [PMC free article] [PubMed] [Google Scholar]
- Thewissen JGM. 1998. The emergence of whales. Evolutionary patterns in the origin of Cetaceans (Advances in Vertebrate Paleobiology). New York: Plenum Press. [Google Scholar]
- van der Werf YS, Witter MP, Groenewegen HJ. 2002. The intralaminar and midline nuclei of the thalamus: anatomical and functional evidence for participation in processes of arousal and awareness. Brain Res Rev 39:107–140. [DOI] [PubMed] [Google Scholar]
- West MJ, Slomianka L, Gundersen HJ. 1991. Unbiased stereological estimation of the total number of neurons in the subdivisions of the rat hippocampus using the optical fractionator. Anat Rec 231:482–497. [DOI] [PubMed] [Google Scholar]
- Woolf NJ. 1991. Cholinergic systems in mammalian brain and spinal cord. Prog Neurobiol 37:475–524. [DOI] [PubMed] [Google Scholar]


