Abstract
Increasing interest in studies of prenatal human brain development, particularly using new single‐cell genomics and anatomical technologies to create cell atlases, creates a strong need for accurate and detailed anatomical reference atlases. In this study, we present two cellular‐resolution digital anatomical atlases for prenatal human brain at postconceptional weeks (PCW) 15 and 21. Both atlases were annotated on sequential Nissl‐stained sections covering brain‐wide structures on the basis of combined analysis of cytoarchitecture, acetylcholinesterase staining, and an extensive marker gene expression dataset. This high information content dataset allowed reliable and accurate demarcation of developing cortical and subcortical structures and their subdivisions. Furthermore, using the anatomical atlases as a guide, spatial expression of 37 and 5 genes from the brains, respectively, at PCW 15 and 21 was annotated, illustrating reliable marker genes for many developing brain structures. Finally, the present study uncovered several novel developmental features, such as the lack of an outer subventricular zone in the hippocampal formation and entorhinal cortex, and the apparent extension of both cortical (excitatory) and subcortical (inhibitory) progenitors into the prenatal olfactory bulb. These comprehensive atlases provide useful tools for visualization, segmentation, targeting, imaging, and interpretation of brain structures of prenatal human brain, and for guiding and interpreting the next generation of cell census and connectome studies.
Keywords: amygdala, brain development, cerebral cortex, ganglionic eminence, gene expression, hippocampal formation, thalamic nuclei
Detailed cellular resolution anatomical atlases are generated for prenatal human brains at postconceptional weeks (PCW) 15 and 21 based on combined analysis of Nissl preparation, acetylcholinesterase staining, and a lot of gene markers. Using the anatomical atlases as a guide, spatial expression of 37 and 5 genes (out of 43 genes) from the brains, respectively, at PCW 15 and 21 was annotated as molecular atlases. These atlases provide useful resource for visualization, segmentation, targeting, imaging, and interpretation of normal and abnormal human brain development.
1. INTRODUCTION
Anatomical brain atlases are essential tools for visualizing, integrating, and interpreting experimental data about brain structure, function, circuits, cell types, and structure‐function‐behavior relationships (Evans et al., 2012; Wang et al., 2020). We previously generated brain‐wide detailed microarray‐based transcriptomic atlases for the prenatal human brain at postconceptional weeks (PCW) 15, 16, and 21 (Miller et al., 2014), and single‐cell genomic studies are now increasingly profiling prenatal brains to define cellular diversity, developmental trajectories, and gene regulatory mechanisms (Eze et al., 2021; Fan et al., 2020; Nowakowski et al., 2017). To provide an anatomical and ontological framework for these prior and future studies of human brain development, here we aimed to create detailed and accurate reference atlases that densely sample the whole developing brain at PCW 15 and 21. These prenatal human brain atlases can also be important tools to guide increasing neuroimaging studies of prenatal human brains and developmental deficits and malformations (Kostović et al., 2019; Oishi, Chang, & Huang, 2019).
Two highly detailed comprehensive anatomical atlases are available for the adult human brain (Ding et al., 2016; Mai et al., 2016). Fewer anatomical references are available for developing human brains, and especially for prenatal stages. Only one series of prenatal human brain atlases is available, generated on a limited set of Nissl‐stained sections from different brain specimens (Bayer & Altman, 2003, 2005, 2006). While heroic efforts at the time, these atlases have relatively low sampling density, are limited to Nissl stain, and have much fewer structural annotations than the adult atlases. For example, only 15 and 13 coronal sections were annotated for the human brain atlases from prenatal weeks (PW) 13.5 and 17, respectively (Bayer & Altman, 2005). Furthermore, certain developmental stages, such as PW 15 and 16, are not available in this atlas series.
In this study, we aimed to create a plate‐based atlas with coverage of essentially all anatomical structures, a complete developmental structural ontology, and a high information content gene expression analysis that allows accurate structural delineation. Whole brain serial sectioning was performed on each brain, with interdigitated histochemistry and in situ hybridization (ISH) spanning the entire brain specimens, which were scanned at 1 μm/pixel resolution. We annotated representative Nissl‐stained coronal sections spanning the brain (46 sections for the PCW 15 brain and 81 sections for the PCW 21 brain) based on a combined analysis of cytoarchitecture, acetylcholinesterase (AChE) staining, and expression patterns of selected genes from the same brain. Annotations were also performed on a series of the ISH images that often delineate particular structures well (sections for 37 and 5 selected genes from the PCW 15 and 21 brains, respectively). Finally, these atlases are presented as freely accessible online interactive data resources (www.brain‐map.org or www.brainspan.org).
2. MATERIALS AND METHODS
2.1. Prenatal human brain specimens
Two postmortem human brain specimens at PCW 15 (male; Caucasian) and PCW 21 (female; Asian), respectively, were used for generation of anatomical and molecular atlases. Both specimens were procured from Laboratory of Developmental Biology at the University of Washington, Seattle, USA. All work was performed according to guidelines for the research use of human brain tissue and with approval by the Human Investigation Committees and Institutional Ethics Committees of University of Washington. Appropriate written informed consent was obtained and all available nonidentifying information was recorded for each specimen. The criteria for tissue selection include no known history of maternal drug or alcohol abuse, potential teratogenic events, or HIV1/2, HepB or HepC infection, and no neuropathological defects were observed in histological data derived from these tissues. Eligible tissue was also screened to ensure cytoarchitectural integrity (analysis of Nissl‐stained sections) and high RNA quality. Both brains met above criteria and showed normal appearance and high RNA quality with an average RNA integrity number of 8 and 9 for PCW 15 and 21, respectively. Both brains were bisected, and the left hemisphere was used for DNA microarray analysis (see Miller et al., 2014) and right hemisphere was used for histology and ISH stains. For the right hemisphere, two and four coronal slabs were cut for the PCW 15 and 21 brains, respectively, based on the size of the hemisphere. These slabs were frozen in isopentane chilled to −50°C and stored at −80°C until sectioning. Serial sectioning was performed through the whole hemisphere, slab by slab. Nissl, AChE, and ISH stains for 43 gene probes were carried out on sequential series of sections (see below). For both stages, sequential sections for Nissl and AChE stain were regularly spaced and flanked by series of ISH for marker genes. All histology and ISH sections were digitally scanned at 1.0 μm/pixel. To generate anatomical atlases for PCW 15 and 21 brains, 46 out of the 115, and 81 out of the 174 Nissl‐stained sequential sections were selected, respectively.
2.2. Nissl staining
After sectioning 20 μm‐thick sections in the coronal plane from an entire hemisphere of the specimens, slides were baked at 37°C for 1 to 5 days and were removed 5 to 15 min prior to staining. Sections were defatted with xylene or the xylene substitute Formula 83, and hydrated through a graded series containing 100, 95, 70, and 50% ethanol. After incubation in water, the sections were stained in 0.213% thionin, then differentiated, and dehydrated in water and a graded series containing 50, 70, 95, and 100% ethanol. Finally, the slides were incubated in xylene or xylene substitute Formula 83, and coverslipped with the mounting agent DPX. After drying, the slides were analyzed microscopically to ensure staining quality.
2.3. AChE staining
A modified AChE protocol was used to help delineate subcortical structures at high resolution. AChE staining was performed using a direct coloring thiocholine method combined with a methyl green nuclear counterstain to improve tissue visibility (Karnovsky & Roots, 1964). Glass slides with fresh‐frozen tissue sections were removed from 4°C, allowed to equilibrate to room temperature, fixed in 10% neutral buffered formalin, and washed briefly in ultra‐pure water. Sections were then incubated for 30 min in a solution of acetylthiocholine iodide, sodium citrate, cupric sulfate, and potassium ferricyanide in a 0.1 M sodium acetate buffer (pH 6.0), washed in 0.1 M Tris‐HCl buffer (pH 7.2), incubated with 0.5% diaminobenzidine in 0.1 M Tris‐HCl with 0.03% hydrogen peroxide. Slides were incubated in 0.2% methyl green, briefly dipped in 100% ethanol, cleared with Formula 83 and coverslipped with DPX.
2.4. ISH staining
A colorimetric, digoxigenin‐based method for labeling target mRNA was used to detect gene expression on human prenatal tissue sections with 43 selected genes (see Lein et al., 2007). These genes include canonical morphological and cell‐type markers and disease‐related genes associated with neocortical development. Gene selection was preferential toward data available through the Allen Developing Mouse Brain Atlas (Thompson et al., 2014), allowing a direct phylogenetic comparison of gene expression patterns between mouse and human. Gene lists and details of the ISH process are available online (http://help.brain‐map.org/display/devhumanbrain/Documentation). Gene list is also shown in the legend of Appendix 2.
2.5. Digital imaging and image processing
Digital imaging of the stained slides was done using a ScanScope XT (Aperio Technologies Inc., Vista, CA) with slide autoloader. The final resolution of the images was 1 μm/pixel. All images were databased and preprocessed, then subjected to quality control (QC) to ensure optimal focus and that no process artifacts were present on the slide images. Images that passed this initial QC were further assessed to ensure that the staining data were as expected. Once all QC criteria were met, images became available for annotation of anatomical structures.
2.6. Generation of whole‐brain structure ontology
To generate a unifying hierarchical ontology for both developing and adult human brains with each structure having a unique identification code, we first subdivided the brain into three major parts: forebrain, midbrain, and hindbrain. Under each major part, we created four main branches: gray matter, white matter, ventricles, and surface structures (e.g., cortical sulci and gyri). Under the gray matter branches two types of brain structures were separated: transient and permanent ones. Under the transient structures, we listed all structures that only appear during development and not exist in adult brain (see Table 1 for detailed transient structures). Under the permanent structures, we listed all structures that exist in both developing and adult brains (for details see Table 3 of Ding et al., 2016). Table 1 also lists abbreviations for the main brain structures shown in this study.
TABLE 1.
Abbreviations and ontology of brain structures*
| Transcriptome data available (A) | ||||
|---|---|---|---|---|
| Abbreviations | Ontology of brain structures | pcw 15 | pcw 16 | pcw 21 |
| F | Forebrain | |||
| FGM | grey matter of forebrain | |||
| FTS | transient structures of forebrain | |||
| SG | subpial granular zone | |||
| fSG | SG in frontal neocortex | A | ||
| pSG | SG in parietal neocortex | A | ||
| tSG | SG in temporal neocortex | A | A | |
| oSG | SG in occipital neocortex | A | ||
| iSG | SG in insular neocortex | A | ||
| cSG | SG in cingulate neocortex | A | ||
| peSG | SG in periallocortex | |||
| SGpc | SG in perirhinal cortex | A | ||
| SGpas | SG in parasubicular cortex | |||
| SGec | SG in entorhinal cortex | A | ||
| SGprs | SG in presubicular cortex | |||
| SGrs | SG in retrosplenial cortex | |||
| SGiag | SG in agranular insular cortex | |||
| alSG | SG in allocortex | |||
| SGhip | SG in hippocampal proper | |||
| SGsub | SG in subicular cortex | |||
| SGpir | SG in piriform cortex | |||
| MZ | marginal zone | |||
| fMZ | MZ in frontal neocortex | |||
| fMZfp | MZ in frontal polar cortex | A | A | A |
| fMZdl | MZ in dorsolateral prefrontal cortex | A | A | |
| fMZvl | MZ in ventrolateral prefrontal cortex | A | A | |
| fMZor | MZ in orbital frontal cortex | A | ||
| fMZm1 | MZ in posterior frontal cortex (motor cortex) | A | ||
| pMZ | MZ in parietal neocortex | |||
| pMZs1 | MZ in primary somatosensory cortex | A | A | |
| pMZdm | MZ in dorsomedial parietal cortex | A | ||
| pMZpd | MZ in posterodorsal (superior) parietal cortex | A | ||
| pMZpv | MZ in posteroventral (inferior) parietal cortex | A | A | A |
| tMZ | MZ in temporal neocortex | |||
| tMZsl | MZ in superolateral temporal cortex | A | A | A |
| tMZil | MZ in inferolateral temporal cortex | A | A | |
| tMZmt | MZ in medial temporal‐occipital cortex | A | A | A |
| tMZlt | MZ in lateral temporal‐occipital cortex | A | A | |
| tMZph | MZ in posterior parahippocampal cortex | A | A | |
| oMZ | MZ in occipital neocortex | |||
| oMZv1 | MZ in primary visual cortex | A | A | A |
| oMZdm | MZ in dorsomedial extrastriate cortex (V2) | A | A | A |
| oMZvm | MZ in ventromedial extrastriate cortex (VP) | A | A | |
| oMZml | MZ in midlateral extrastriate cortex (area 19) | A | A | |
| iMZ | MZ in insular neocortex | |||
| iMZdg | MZ in dysgranular insular neocortex | A | A | |
| iMZgr | MZ in granular insular neocortex | A | ||
| cMZ | MZ in cingulate neocortex | |||
| cMZr | MZ in rostral cingulate cortex | A | A | A |
| cMZc | MZ in caudal cingulate cortex | A | ||
| peMZ | MZ in periallocortex | |||
| MZpc | MZ in perirhinal cortex | A | A | A |
| MZpas | MZ in parasubicular cortex | |||
| MZec | MZ in entorhinal cortex | A | ||
| MZprs | MZ in presubicular cortex | |||
| MZrs | MZ in retrosplenial cortex | A | ||
| MZiag | MZ in agranular insular cortex | |||
| alMZ | MZ in allocortex | |||
| MZhip | MZ in hippocampal proper | |||
| MZsub | MZ in subicular cortex | |||
| MZpir | MZ in piriform cortex | |||
| CP | cortical plate | |||
| fCP | CP in frontal neocortex | |||
| fCPfp | CP in frontal polar cortex | A | A | A |
| fCPdm | CP in dorsomedial frontal cortex | A | A | |
| fCPdl | CP in dorsolateral prefrontal cortex | A | A | A |
| fCPvl | CP in ventrolateral prefrontal cortex | A | A | |
| fCPor | CP in orbital frontal cortex | A | A | A |
| fCPm1 | CP in posterior frontal cortex (motor cortex) | A | A | A |
| pCP | CP in parietal neocortex | |||
| pCPs1 | CP in primary somatosensory cortex | A | A | A |
| pCPdm | CP in dorsomedial parietal cortex (area 7m) | A | A | A |
| pCPpd | CP in posterosuperior (dorsal) parietal cortex | A | A | A |
| pCPpv | CP in posteroinferior (ventral) parietal cortex | A | A | A |
| tCP | CP in temporal neocortex | |||
| tCPdl | CP in dorsolateral temporal cortex | |||
| tCPa1 | CP in primary auditory cortex | A | A | |
| tCPsl | CP in superolateral temporal cortex | A | A | A |
| tCPps | CP in polysensory temporal cortex | |||
| tCPpi | CP in parainsualr temporal cortex | |||
| tCPvl | CP in ventrolateral temporal cortex | |||
| tCPml | CP in midlateral temporal cortex | A | ||
| tCPil | CP in inferolateral temporal cortex | A | A | A |
| tCPmi | CP in midinferior temporal cortex | A | ||
| tCP36 | CP in rostral midinferior temporal cortex (area 36) | A | A | |
| tCPtf | CP in caudal midinferior temporal cortex (area TF) | A | A | |
| tCPph | CP in posterior parahippocampal cortex | A | A | A |
| tCPmt | CP in medial temporal‐occipital cortex | A | A | A |
| tCPlt | CP in lateral temporal‐occipital cortex | A | A | |
| tCPtp | CP in temporal polar cortex | A | A | |
| oCP | CP in occipital neocortex | |||
| oCPpro | CP in area prostriata | |||
| oCPv1 | CP in primary visual cortex | A | A | A |
| oCPexs | CP in extrastriate cortex | |||
| oCPdm | CP in dorsomedial extrastriate cortex (V2d) | A | A | A |
| oCPvm | CP in ventromedial extrastriate cortex (VP) | A | A | A |
| oCPml | CP in midlateral extrastriate cortex (area 19) | A | A | |
| iCP | CP in insular neocortex | |||
| iCPdg | CP in dysgranular insular cortex | A | A | A |
| iCPgr | CP in granualr insular cortex | A | A | A |
| cCP | CP in cingulate neocortex | |||
| cCPr | CP in rostral cingulate cortex | A | A | A |
| cCPmi | CP in midcingulate cortex | A | ||
| cCPc | CP in caudal cingulate cortex | A | A | A |
| cCPsg | CP in subgenual (subcallosal) cingulate cortex | A | A | |
| peCP | CP in periallocortex | |||
| CPpc | CP in perirhinal cortex | |||
| CPpcr | CP in rostral perirhinal cortex | A | A | |
| CPpcc | CP in caudal perirhinal cortex | A | A | |
| CPpas | CP in parasubicular cortex | |||
| CPec | CP in entorhinal cortex | |||
| CPlec | CP in lateral (anterior) entorhinal cortex | |||
| CPmec | CP in medial (posterior) entorhinal cortex | |||
| CPprs | CP in presubicular cortex | |||
| CPrs | CP in retrosplenial cortex | A | A | |
| CPiag | CP in agranular insular cortex | |||
| alCP | CP in allocortex | |||
| CPhip | CP in hippocampal proper | |||
| CPhipr | CP in rostral hippocampus | A | A | |
| CPhipc | CP in caudal hippocampus | A | ||
| CPsub | CP in subicular cortex | |||
| CPsubr | CP in rostral subicular cortex | |||
| CPsubc | CP in caudal subicular cortex | A | ||
| CPpir | CP in piriform cortex | |||
| SP | subplate zone | |||
| fSP | SP in frontal neocortex | |||
| fSPfp | SP in frontal polar cortex | A | A | A |
| fSPdm | SP in dorsomedial frontal cortex | A | A | |
| fSPdl | SP in dorsolateral prefrontal cortex | A | A | A |
| fSPvl | SP in ventrolateral prefrontal cortex | A | A | |
| fSPor | SP in orbital frontal cortex | A | A | A |
| fSPm1 | SP in posteror frontal cortex (motor cortex) | A | A | A |
| pSP | SP in parietal neocortex | |||
| pSPs1 | SP in primary somatosensory cortex | A | A | A |
| pSPdm | SP in dorsomedial parietal cortex (area 7m) | A | A | A |
| pSPpd | SP in posterosuperior (dorsal) parietal cortex | A | A | A |
| pSPpv | SP in posteroinferior (ventral) parietal cortex | A | A | A |
| tSP | SP in temporal neocortex | |||
| tSPdl | SP in dorsolateral temporal cortex | |||
| tSPa1 | SP in primary auditory cortex | A | A | |
| tSPsl | SP in superolateral temporal cortex | A | A | A |
| tSPps | SP in polysensory temporal cortex | |||
| tSPpi | SP in parainsular temporal cortex | |||
| tSPvl | SP in ventrolateral temporal cortex | |||
| tSPml | SP in midlateral temporal cortex | A | A | |
| tSPil | SP in inferolateral temporal cortex | A | A | A |
| tSPmi | SP in midinferior temporal cortex | A | ||
| tSP36 | SP in rostral midinferior temporal cortex (area 36) | A | A | |
| tSPtf | SP in caudal midinferior temporal cortex (area TF) | A | A | |
| tSPph | SP in posterior parahippocampal cortex | A | A | |
| tSPmt | SP in medial temporal‐occipital cortex | A | A | |
| tSPlt | SP in lateral temporal‐occipital cortex | A | A | |
| tSPtp | SP in temporal polar cortex | A | ||
| oSP | SP in occipital neocortex | |||
| oSPpro | SP in area prostriata | |||
| oSPv1 | SP in primary visual cortex | A | A | A |
| oSPexs | SP in extrastriate cortex | |||
| oSPdm | SP in dorsomedial extrastriate cortex (V2d) | A | A | A |
| oSPvm | SP in ventromedial extrastriate cortex (VP) | A | A | A |
| oSPml | SP in midlateral extrastriate cortex (area 19) | A | A | |
| iSP | SP in insular neocortex | |||
| iSPdg | SP in dysgranular insular cortex | A | A | A |
| iSPgr | SP in granular insular cortex | A | A | A |
| cSP | SP in cingulate neocortex | |||
| cSPr | SP in rostral cingulate cortex | A | A | A |
| cSPmi | SP in midcingulate cortex | A | ||
| cSPc | SP in caudal cingulate cortex | A | A | A |
| cSPsg | SP in subgenual (subcallosal) cingulate cortex | A | A | |
| peSP | SP in periallocortex | |||
| SPpc | SP in perirhinal cortex | A | A | |
| SPpas | SP in parasubicular cortex | |||
| SPec | SP in entorhinal cortex | A | ||
| SPlec | SP in lateral (anterior) entorhinal cortex | |||
| SPmec | SP in medial (posterior) entorhinal cortex | |||
| SPprs | SP in presubicular cortex | |||
| SPrs | SP in retrosplenial cortex | |||
| SPiag | SP in agranular insular cortex | |||
| alSP | SP in allocortex | |||
| SPhip | SP in hippocampal proper | |||
| SPhipr | SP in rostral hippocampal proper | |||
| SPhipc | SP in caudal hippocampal proper | A | ||
| SPsub | SP in subicular cortex | |||
| SPsubr | SP in rostral subicular cortex | |||
| SPsubc | SP in caudal subicular cortex | A | ||
| SPpir | SP in piriform cortex | |||
| IZ | intermediate zone | |||
| fIZ | IZ in frontal neocortex | |||
| fIZfp | IZ in frontal polar cortex | A | A | A |
| fIZdm | IZ in dorsomedial frontal cortex | A | ||
| fIZdl | IZ in dorsolateral prefrontal cortex | A | ||
| fIZvl | IZ in ventrolateral prefrontal cortex | A | A | |
| fIZor | IZ in orbital frontal cortex | A | A | A |
| fIZm1 | IZ in posteror frontal cortex (motor cortex) | A | A | A |
| pIZ | IZ in parietal neocortex | |||
| pIZs1 | IZ in primary somatosensory cortex | A | A | A |
| pIZdm | IZ in dorsomedial parietal cortex (area 7m) | A | A | |
| pIZpd | IZ in posterosuperior (dorsal) parietal cortex | A | A | A |
| pIZpv | IZ in posteroinferior (ventral) parietal cortex | A | A | A |
| tIZ | IZ in temporal neocortex | |||
| tIZdl | IZ in dorsolateral temporal cortex | |||
| tIZa1 | IZ in primary auditory cortex | A | ||
| tIZsl | IZ in superolateral temporal cortex | A | A | A |
| tIZps | IZ in polysensory temporal cortex | |||
| tIZpi | IZ in parainsular temporal cortex | |||
| tIZvl | IZ in ventrolateral temporal cortex | |||
| tIZml | IZ in midlateral temporal cortex | A | ||
| tIZil | IZ in inferolateral temporal cortex | A | A | A |
| tIZmi | IZ in midinferior temporal cortex | |||
| tIZ36 | IZ in rostral midinferior temporal cortex (area 36) | |||
| tIZtf | IZ in caudal midinferior temporal cortex (area TF) | A | ||
| tIZph | IZ in posterior parahippocampal cortex | A | A | |
| tIZmt | IZ in medial temporal‐occipital cortex | A | A | |
| tIZlt | IZ in lateral temporal‐occipital cortex | A | ||
| tIZtp | IZ in temporal polar cortex | |||
| oIZ | IZ in occipital neocortex | |||
| oIZpro | IZ in area prostriata | |||
| oIZv1 | IZ in primary visual cortex | A | A | |
| oIZexs | IZ in extrastriate cortex | |||
| oIZdm | IZ in dorsomedial extrastriate cortex (V2) | A | A | A |
| oIZvm | IZ in ventromedial extrastriate cortex (VP) | |||
| oIZml | IZ in midlateral extrastriate cortex (area 19) | A | ||
| iIZ | IZ in insular neocortex | |||
| iIZdg | IZ in dysgranular insular cortex | A | A | A |
| iIZgr | IZ in granular insular cortex | A | A | A |
| cIZ | IZ in cingulate neocortex | |||
| cIZr | IZ in rostral cingulate cortex | A | A | A |
| cIZmi | IZ in midcingulate cortex | A | A | |
| cIZc | IZ in caudal cingulate cortex | A | A | A |
| cIZsg | IZ in subgenual (subcallosal) cingulate cortex | A | A | |
| peIZ | IZ in periallocortex | |||
| IZpc | IZ in perirhinal cortex | A | ||
| IZec | IZ in entorhinal cortex | |||
| IZlec | IZ in lateral (anterior) entorhinal cortex | |||
| IZmec | IZ in medial (posterior) entorhinal cortex | |||
| IZprs | IZ in presubicular cortex | |||
| IZrs | IZ in retrosplenial cortex | |||
| alIZ | IZ in allocortex | |||
| IZhip | IZ in hippocampal proper | |||
| IZsub | IZ in subicular cortex | |||
| SZ | subventricular zone | |||
| fSZ | SZ in frontal neocortex | |||
| fSZfp | SZ in frontal polar cortex | |||
| fSZfpo | outer SZ in frontal polar cortex | A | A | A |
| fSZfpi | inner SZ in frontal polar cortex | A | A | |
| fSZdm | SZ in dorsomedial frontal cortex | |||
| fSZdmo | outer SZ in dorsomedial frontal cortex | A | ||
| fSZdmi | inner SZ in dorsomedial frontal cortex | A | ||
| fSZdl | SZ in dorsolateral prefrontal cortex | |||
| fSZdlo | outer SZ in dorsolateral prefrontal cortex | A | A | A |
| fSZdli | inner SZ in dorsolateral prefrontal cortex | A | A | |
| fSZvl | SZ in ventrolateral prefrontal cortex | |||
| fSZvlo | outer SZ in ventrolateral prefrontal cortex | A | A | |
| fSZvli | inner SZ in ventrolateral prefrontal cortex | A | ||
| fSZor | SZ in orbital frontal cortex | |||
| fSZoro | outer SZ in orbital frontal cortex | A | A | A |
| fSZori | inner SZ in orbital frontal cortex | A | A | |
| fSZm1 | SZ in posteror frontal cortex (motor cortex) | |||
| fSZm1o | outer SZ in posteror frontal cortex (motor cortex) | A | A | A |
| fSZm1i | inner SZ in posteror frontal cortex (motor cortex) | A | A | |
| pSZ | SZ in parietal neocortex | |||
| pSZs1 | SZ in primary somatosensory cortex | |||
| pSZs1o | outer SZ in primary somatosensory cortex | A | A | A |
| pSZs1i | inner SZ in primary somatosensory cortex | A | A | A |
| pSZdm | SZ in dorsomedial parietal cortex (area 7m) | |||
| pSZdmo | outer SZ in dorsomedial parietal cortex (area 7m) | A | A | A |
| pSZdmi | inner SZ in dorsomedial parietal cortex (area 7m) | A | A | |
| pSZpd | SZ in posterosuperior (dorsal) parietal cortex | |||
| pSZpdo | outer SZ in posterosuperior (dorsal) parietal cortex | A | A | A |
| pSZpdi | inner SZ in posterosuperior (dorsal) parietal cortex | A | A | A |
| pSZpv | SZ in posteroinferior (ventral) parietal cortex | |||
| pSZpvo | outer SZ in posteroinferior (ventral) parietal cortex | A | A | A |
| pSZpvi | inner SZ in posteroinferior (ventral) parietal cortex | A | A | A |
| tSZ | SZ in temporal neocortex | |||
| tSZdl | SZ in dorsolateral temporal cortex | |||
| tSZa1 | SZ in primary auditory cortex | |||
| tSZa1o | outer SZ in primary auditory cortex | A | ||
| tSZa1i | inner SZ in primary auditory cortex | |||
| tSZsl | SZ in superolateral temporal cortex | |||
| tSZslo | outer SZ in superolateral temporal cortex | A | A | |
| tSZsli | inner SZ in superolateral temporal cortex | A | A | |
| tSZps | SZ in polysensory temporal cortex | |||
| tSZpso | outer SZ in polysensory temporal cortex | |||
| tSZpsi | inner SZ in polysensory temporal cortex | |||
| tSZpi | SZ in parainsular temporal cortex | |||
| tSZvl | SZ in ventrolateral temporal cortex | |||
| tSZml | SZ in midlateral temporal cortex | |||
| tSZmlo | outer SZ in midlateral temporal cortex | A | ||
| tSZmli | inner SZ in midlateral temporal cortex | A | ||
| tSZil | SZ in inferolateral temporal cortex | |||
| tSZilo | outer SZ in inferolateral temporal cortex | A | A | A |
| tSZili | inner SZ in inferolateral temporal cortex | A | A | A |
| tSZmi | SZ in midinferior temporal cortex | |||
| tSZ36 | SZ in rostral midinferior temporal cortex (area 36) | |||
| tSZ36o | outer SZ in rostral midinferior temporal cortex (area 36) | |||
| tSZ36i | inner SZ in rostral midinferior temporal cortex (area 36) | |||
| tSZtf | SZ in caudal midinferior temporal cortex (area TF) | |||
| tSZtfo | outer SZ in caudal midinferior temporal cortex (area TF) | A | ||
| tSZtfi | inner SZ in caudal midinferior temporal cortex (area TF) | A | ||
| tSZph | SZ in posterior parahippocampal cortex | A | ||
| tSZpho | outer SZ in posterior parahippocampal cortex | A | ||
| tSZphi | inner SZ in posterior parahippocampal cortex | A | ||
| tSZmt | SZ in medial temporal‐occipital cortex | A | ||
| tSZmto | outer SZ in medial temporal‐occipital cortex | A | A | |
| tSZmti | inner SZ in medial temporal‐occipital cortex | A | A | |
| tSZlt | SZ in lateral temporal‐occipital cortex | |||
| tSZlto | outer SZ in lateral temporal‐occipital cortex | A | A | |
| tSZlti | inner SZ in lateral temporal‐occipital cortex | A | A | |
| tSZtp | SZ in temporal polar cortex | |||
| oSZ | SZ in occipital neocortex | |||
| oSZpro | SZ in area prostriata | |||
| oSZv1 | SZ in primary visual cortex | |||
| oSZv1o | outer SZ in primary visual cortex | A | A | A |
| oSZv1i | inner SZ in primary visual cortex | A | A | A |
| oSZexs | SZ in extrastriate cortex | |||
| oSZdm | SZ in dorsomedial extrastriate cortex (V2) | |||
| oSZdmo | outer SZ in dorsomedial extrastriate cortex | A | A | A |
| oSZdmi | inner SZ in dorsomedial extrastriate cortex | A | A | A |
| oSZvm | SZ in ventromedial extrastriate cortex (VP) | |||
| oSZvmo | outer SZ in ventromedial extrastriate cortex | A | A | A |
| oSZvmi | inner SZ in ventromedial extrastriate cortex | A | A | A |
| oSZml | SZ in midlateral extrastriate cortex (area 19) | |||
| oSZmlo | outer SZ in midlateral extrastriate cortex | A | A | |
| oSZmli | inner SZ in midlateral extrastriate cortex | A | A | |
| cSZ | SZ in cingulate neocortex | |||
| cSZr | SZ in rostral cingulate cortex | A | A | A |
| cSZmi | SZ in midcingulate cortex | A | A | |
| cSZc | SZ in caudal cingulate cortex | A | A | A |
| cSZsg | SZ in subgenual cingulate cortex | A | A | |
| peSZ | SZ in periallocortex | |||
| seSZ | SZ in septal region | |||
| VZ | ventricular zone | |||
| fVZ | VZ in frontal neocortex | |||
| fVZfp | VZ in frontal polar cortex | A | A | A |
| fVZdm | VZ in dorsomedial frontal cortex | A | A | |
| fVZdl | VZ in dorsolateral prefrontal cortex | A | A | |
| fVZvl | VZ in ventrolateral prefrontal cortex | A | A | |
| fVZor | VZ in orbital frontal cortex | A | A | A |
| fVZm1 | VZ in posteror frontal cortex (motor cortex) | A | A | A |
| pVZ | VZ in parietal neocortex | |||
| pVZs1 | VZ in primary somatosensory cortex | A | A | A |
| pVZdm | VZ in dorsomedial parietal cortex (area 7m) | A | A | |
| pVZpd | VZ in posterosuperior (dorsal) parietal cortex | A | A | A |
| pVZpv | VZ in posteroinferior (ventral) parietal cortex | A | A | A |
| tVZ | VZ in temporal neocortex | |||
| tVZdl | VZ in dorsolateral temporal cortex | |||
| tVZa1 | VZ in primary auditory cortex | |||
| tVZsl | VZ in superolateral temporal cortex | A | ||
| tVZps | VZ in polysensory temporal cortex | |||
| tVZpi | VZ in parainsular temporal cortex | |||
| tVZvl | VZ in ventrolateral temporal cortex | |||
| tVZml | VZ in midlateral temporal cortex | A | ||
| tVZil | VZ in inferolateral temporal cortex | A | A | A |
| tVZmi | VZ in midinferior temporal cortex | |||
| tVZ36 | VZ in rostral midinferior temporal cortex (area 36) | |||
| tVZtf | VZ in caudal midinferior temporal cortex (area TF) | A | ||
| tVZph | VZ in posterior parahippocampal cortex | A | A | A |
| tVZmt | VZ in medial temporal‐occipital cortex | A | A | A |
| tVZlt | VZ in lateral temporal‐occipital cortex | A | A | |
| tVZtp | VZ in temporal polar cortex | |||
| oVZ | VZ in occipital neocortex | |||
| oVZpro | VZ in area prostriata | |||
| oVZv1 | VZ in primary visual cortex | A | A | A |
| oVZexs | VZ in extrastriate cortex | |||
| oVZdm | VZ in dorsomedial extrastriate cortex (V2) | A | A | A |
| oVZvm | VZ in ventromedial extrastriate cortex (VP) | A | A | A |
| oVZml | VZ in midlateral extrastriate cortex (area 19) | A | A | |
| cVZ | VZ in cingulate neocortex | |||
| cVZr | VZ in rostral cingulate neocortex | A | A | A |
| cVZmi | VZ in midcingulate neocortex | A | A | |
| cVZc | VZ in caudal cingulate neocortex | A | A | A |
| cVZsg | VZ in subgenual cingulate neocortex | A | A | |
| peVZ | VZ in periallocortex | |||
| VZpc | VZ in perirhinal cortex | |||
| VZpcr | VZ in rostral perirhinal cortex | |||
| VZpcc | VZ in caudal perirhinal cortex | |||
| VZec | VZ in entorhinal cortex | |||
| VZmec | VZ in medial (posterior) entorhinal cortex | A | ||
| VZlec | VZ in lateral (anterior) entorhinal cortex | |||
| VZprs | VZ in presubicular cortex | |||
| VZprsr | VZ in rostral presubicular cortex | |||
| VZprsc | VZ in caudal presubicular cortex | |||
| VZrs | VZ in retrosplenial cortex | |||
| alVZ | VZ in allocortex | |||
| VZhip | VZ in hippocampal proper | |||
| VZhipr | VZ in rostal hippocampal proper | |||
| VZhipc | VZ in caudal hippocampal proper | A | ||
| VZsub | VZ in subicular cortex | |||
| VZsubr | VZ in rostral subicular cortex | |||
| VZsubc | VZ in caudal subicular cortex | A | ||
| OF | outer fiber zone in neocortex | |||
| IF | inner fiber zone in neocortex | |||
| GE | ganglionic eminence (VZ in basal nuclei) | A | ||
| SCB | striatal‐cortical boundary (subpallium‐pallium boundary) | |||
| LGE | lateral ganglionic eminence | A | A | A |
| LGEo | outer portion of lateral ganglionic eminence (SZ) | A | A | |
| LGEi | inner portion of lateral ganglionic eminence (VZ) | A | A | |
| LGEVZ | LGE‐VZ border region | A | A | |
| LMGE | MGE‐Lateral region | A | A | |
| MGE | medial ganglionic eminence | A | A | A |
| MGEo | outer portion of medial ganglionic eminence (SZ) | A | A | |
| MGEi | inner portion of medial ganglionic eminence (VZ) | A | A | |
| CGE | caudal ganglionic eminence | A | A | |
| CGEo | outer portion of caudal ganglionic eminence (SZ) | |||
| CGEi | inner portion of caudal ganglionic eminence (VZ) | |||
| seVZ | VZ in septal region | A | A | |
| scVZ | VZ in subcallosal region | A | A | |
| paVZ | VZ in postamygdaloid region | A | ||
| thVZ | VZ in thalamic region | A | ||
| hyVZ | VZ in hypothalamic portion | A | ||
| RMS | rostral migratory stream | A | A | A |
| RMSv | vertical portion of rostral migratory stream | |||
| RMSvv | VZ part of RMSv | |||
| RMSvg | GE part of RMSv | |||
| RMSvs | SZ part of RMSv | |||
| RMSh | horizontal portion of rostral migratory stream | |||
| RMShv | VZ part of RMSh | |||
| RMShg | GE part of RMSh | |||
| RMShs | SZ part of RMSh | |||
| CalS | callosal sling | A | ||
| DHTC | dentatohippocampal transient cell zone | |||
| DNS | dentate neuroepithelial stem cell zone | |||
| IPTC | interpallidal transient cell zone | |||
| OlfP | olfactory peduncle | |||
| PFG | perifornical gray zone | |||
| PPL | primordial plexiform layer | |||
| ScG | subcallosal gray zone | |||
| TCete | transient cell zone in external capsule | |||
| TCexc | transient cell zone in extreme capsule | |||
| LMS | lateral migratory stream | |||
| VMS | ventral migratory stream | |||
| DMS | dorsal migratory stream | |||
| SMS | septal migratory stream | |||
| SCS | striatal‐cortical sulcus | |||
| CAS | caudal amygdaloid stream | |||
| FPS | permanent structures of forebrain | |||
| Tel | telencephalon (for more details see table 3 in Ding et al. J Comp Neurol, 2016) | |||
| Cx | cerebral cortex | |||
| NCx | neocortex | |||
| FCx | frontal neocortex | |||
| PFC | prefrontal cortex | A | ||
| A10 (FP) | frontal polar cortex | |||
| DFC | dorsolateral prefrontal cortex | |||
| VFC | ventrolateral prefrontal cortex | |||
| OFC | orbital frontal cortex | A | ||
| M1C (A4, M1) | primary motor cortex | A | ||
| PMC (A6) | premortor cortex | A | ||
| PCx | parietal neocortex | |||
| S1C (S1) | primary somatosensory cortex | |||
| SPC | superior parietal cortex | |||
| IPC | inferior parietal cortex | A | ||
| TCx | temporal neocortex | |||
| DLTC | dorsolateral temporal cortex | A | ||
| VLTC | ventrolateral temporal cortex | |||
| PPHC | posterior parahippocampal cortex | |||
| A37 | medial temporal‐occipital cortex | |||
| A38 (TP) | temporal polar cortex | |||
| Ocx | occipital neocortex | |||
| V1C (V1) | primary visual cortex (striate cortex) | |||
| ESOC | extrastriate occipital cortex | |||
| V2 | parastriate cortex | |||
| PSC (A19) | peristriate cortex | |||
| ICx | insular neocortex | |||
| Idg | dysgranular insular cortex | |||
| Ig | granular insular cortex | |||
| CCx | cingulate cortex | |||
| MFC (ACC) | medial frontal cortex (rostral cingulate cortex, areas 32, 24 and 25) | A | A | |
| MCC | midcingulate cortex (area 24mi) | |||
| PCC | caudal cingulate cortex (areas 23 and 31) | |||
| PACx | periallocortex | |||
| PArCx | periarchicortex | |||
| A35 | perirhinal cortex (area 35) | A | A | |
| EC | entorhinal cortex | |||
| LEC | lateral entorhinal cortex | A | A | A |
| MEC | medial entorhinal cortex | A | A | |
| PaS | parasubicular cortex | A | ||
| PrS | presubicular cortex | A | ||
| RSC (RS) | retrosplenial cortex (areas 29 and 30) | |||
| PPCx | peripaleocortex | |||
| Iag | agranular insular cortex | A | A | |
| FI | frontal agranular insular cortex | |||
| TI | temporal agranular insular cortex | |||
| ACx | allocortex | |||
| ArCx | archicortex | |||
| DG | dentate gyrus | A | A | A |
| Hipp | hippocampal proper (CA1‐4) | A | A | A |
| Sub | subicular cortex | |||
| S | subiculum | A | A | |
| ProS | prosubiculum | A | ||
| IG | indusium griseum | |||
| PalCx | paleocortex | |||
| OB | olfactory bulb | A | ||
| AON | anterior olfactory nucleus | |||
| OT | olfactory tubercle | A | A | A |
| Pir | piriform cortex | A | A | A |
| LOA | lateral olfactory area | |||
| PEA | piriform‐entorhinal‐amygdaloid area | |||
| CN | cerebral nuclei | |||
| AMY | amygdaloid complex | A | ||
| AAA | anterior amygdaloid area | |||
| CEN | central nuclear group | A | A | |
| CMN | corticomedial nuclear group | |||
| Co | cortical amygdaloid nucleus | |||
| CoA | anterior cortical nucleus | A | A | A |
| CoP | posterior cortical nucleus | A | ||
| Me | medial nucleus | A | A | |
| AHA | amygdalohippocampal area | |||
| BLN | basolateral nuclear group | |||
| La | lateral nucleus of amygdala | A | A | A |
| BL | basolateral nucleus of amygdala | A | A | A |
| BM | basomedial nucleus of amygdala | A | A | A |
| INA | intercalated nucleus of amygdala | A | A | |
| ATA | amygdaloid transition area | |||
| ASTA | amygdalostriatal transition area | A | A | |
| ACTA | amygdalocortical transition area | |||
| EXA | extended amygdala | |||
| BNST | bed nucleus of stria terminalis | A | A | A |
| BN | basal nuclei (basal ganglia) | |||
| STR | striatum | |||
| Ca | caudate nucleus | A | A | A |
| Pu | putamen | A | A | A |
| NAC | nucleus accumbens | A | A | A |
| GP | globus pallidus | |||
| GPe | external segment of globus pallidus | A | A | A |
| GPi | internal segment of globus pallidus | A | A | A |
| VeP | ventral pallidus | A | A | |
| Cla | claustrum | A | A | A |
| BF | basal forebrain | |||
| SEP | septal nuclei | |||
| MSN | medial septal nucleus | A | A | A |
| LSN | lateral septal nucleus | A | A | A |
| BNM | basal nucleus of Meynert | A | A | A |
| NDB | nucleus of diagonal band | A | A | A |
| SI | substantia innominata | |||
| Die | diencephalon (for more details see table 3 in Ding et al. J Comp Neurol, 2016) | |||
| THM | Thalamus | |||
| DTH | dorsal thalamus | |||
| ANC | anterior nuclear complex of thalamus | A | ||
| AD | anterior dorsal nucleus of thalamus | A | A | |
| AV | anterior ventral nucleus of thalamus | A | A | |
| AM | anterior medial nucleus of thalamus | A | ||
| LD | lateral dorsal nucleus of thalamus | A | A | |
| MNC | medial nuclear complex of thalamus | |||
| MD | mediodorsal nucleus of thalamus | A | A | A |
| Re | Reuniens nucleus | A | ||
| LNC | lateral nuclear complex of thalamus | |||
| VA | vental anterior nucleus of thalamus | A | A | A |
| VL | vental lateral nucleus of thalamus | A | A | |
| VP | vental posterior nucleus of thalamus | |||
| VPM | vental posterior medial nucleus of thalamus | A | A | |
| VPL | vental posterior lateral nucleus of thalamus | A | A | |
| VPI | vental posterior inferior nucleus of thalamus | A | A | |
| VM | ventral medial nucleus of thalamus | A | ||
| LP | lateral posterior nucleus of thalamus | A | A | |
| Pul | pulvinar of thalamus | A | A | A |
| PoN | posterior nuclear complex of thalamus | |||
| LG | lateral geniculate nucleus | |||
| DLG | dorsal lateral geniculate nucleus | A | A | A |
| PG (VLG) | pregeniculate nucleus | |||
| MG | medial geniculate nucleus | A | A | A |
| LSG | limitans/suprageniculate nucleus | A | A | |
| PIL | posterior intralaminar nucleus | |||
| Po | posterior nucleus of thalamus | |||
| ILN | intralaminar nuclear complex of thalamus | |||
| Fa | fasciculosus nucleus of thalamus | |||
| PC | paracentral nucleus of thalamus | |||
| CL | central lateral nucleus of thalamus | |||
| CeM | central medial nucleus of thalamus | |||
| Pf | parafascicular nucleus of thalamus | A | A | A |
| CM | centromedian nucleus of thalamus | A | A | A |
| SPf | subparafascicular nucleus of thalamus | A | A | |
| MiN | midline nuclear comlex | A | ||
| PeVA | periventricular area of thalamus | |||
| IMD | intermediodorsal nucleus of thalamus | |||
| ETH | epithalamus | |||
| HN | habenular nucleus | |||
| MHN | medial habenular nucleus | A | A | A |
| LHN | lateral habenular nucleus | A | A | A |
| PaV | paraventricular nucleus of thalamus | A | A | A |
| Pin | pineal body | A | ||
| VTH | ventral thalamus | |||
| FF | nucleus of the field of Forel | |||
| ZI | zona incerta | A | A | |
| R | reticular nucleus of thalamus | A | A | A |
| SubTH | subthalamus | |||
| STH | subthalamic nucleus | A | A | |
| HTH | hypothalamus | |||
| MnPO | median preoptic nucleus | |||
| PeV | periventricular nucleus | A | ||
| MPN | medial preoptic nucleus | A | ||
| SCN | suprachiasmatic nucleus | |||
| SO | supraoptic nucleus | A | A | |
| AHN | anterior hypothalamic nucleus | A | A | A |
| PV | paraventricular nucleus of hypothalamus | A | ||
| DHA | dorsal hypothalamic area | |||
| TM | tuberomammillary nucleus | |||
| DMH | dorsomedial hypothalamic nucleus | A | A | A |
| VMH | ventromedial hypothalamic nucleus | A | A | A |
| Arc | arcuate nucleus of hypothalamus | A | A | A |
| ME | median eminence | |||
| LT | lateral tuberal nucleus | A | ||
| PMH | posteromedial hypothalamic nucleus | |||
| PMN | premammillary nucleus | |||
| PHN | posterior hypothalamic nucleus | A | A | |
| SUM | supramammillary nucleus | |||
| MM | medial mammillary nucleus | A | A | |
| LM | lateral mammillary nucleus | |||
| LHA | lateral hypothalamic area | A | A | A |
| PeF | perifornical nucleus | |||
| FWM | white matter of forebrain (for details see table 3 in Ding et al. J Comp Neurol, 2016) | |||
| FV | ventricles of forebrain | |||
| LV | lateral ventricle | |||
| 3V | third ventricle | |||
| FSS | surface structures of forebrain (for details see table 3 in Ding et al. J Comp Neurol, 2016) | |||
| M | Midbrain | |||
| MGM | grey matter of midbrain | |||
| MTS | transient structures of midbrain | |||
| MNM | mesencephalic neuromere (mesomere) | |||
| MZM | marginal zone of midbrain | |||
| IZM | intermediate (mantle) zone of midbrain | |||
| IZMro | roof plate of midbrain | |||
| IZMal | alar plate (tectal zone) of midbrain | |||
| IZMba | basal plate of midbrain | |||
| IZMfl | floor plate of midbrain | |||
| VZM | ventricular (matrix) zone of midbrain | |||
| MPS | permanent structures of midbrain (for more details see table 3 in Ding et al. J Comp Neurol, 2016) | |||
| PTR | pretectal region | |||
| PTN | pretectal nuclear complex | A | A | A |
| MTg | midbrain tegmentum | |||
| EW | Edinger‐Westphal nucleus | A | ||
| 3N | oculomotor nucleus | A | A | |
| 4N | trochlear nucleus | |||
| MRF | midbrain reticular formation | A | A | |
| CnF | cuneiform nucleus | |||
| PTg | pedunculotegmental nucleus | A | A | |
| IP | interpeduncular nucleus | A | ||
| RN | red nucleus | A | A | A |
| SN | substantia nigra | A | A | A |
| PBP | parabrachial pigmented nucleus | |||
| VTA | ventral tegmental area | A | A | |
| PAG | periaqueductal gray substance | A | A | |
| DR | dorsal raphe nucleus | A | A | |
| InC | interstitial nucleus of Cajal | |||
| PrC | precommissural nucleus | A | ||
| MTc | midbrain tectum | |||
| SC | superior colliculus | A | A | |
| IC | inferior colliculus | A | A | A |
| PBG | parabigeminal nucleus | A | A | |
| MWM | white matter of midbrain (for details see table 3 in Ding et al. J Comp Neurol, 2016) | |||
| MV | ventricle of midbrain | |||
| Aq | cerebral aqueduct | |||
| MSS | surface structures of midbrain (for details see table 3 in Ding et al. J Comp Neurol, 2016) | |||
| H | Hindbrain | |||
| HGM | grey matter of hindbrain | |||
| HTS | transient structures of hindbrain | |||
| CBT | transient zones of cerebellar cortex | |||
| VeT | transient zones of cerebellar vermis | |||
| VeTe | external granular (germinal) zone of the vermis | |||
| VeTm | marginal zone of the vermis | |||
| VeTp | Purkinje cell zone of the vermis | |||
| VeTi | inner granular cell zone of the vermis | |||
| VeTv | ventricular (germinal) zone of the vermis | |||
| PRVT | transient zones of cerebellar paravermis | |||
| PRVTe | external granular (germinal) zone of the paravermis | |||
| PRVTm | marginal zone of the paravermis | |||
| PRVTp | Purkinje cell zone of the paravermis | |||
| PRVTi | inner granular cell zone of the paravermis | |||
| PRVTv | ventricular (germinal) zone of the paravermis | |||
| CbLT | transient zones of cerebellar lateral hemisphere | |||
| CbLTe | external granular (germinal) zone of lateral hemisphere | |||
| CbLTm | marginal zone of lateral hemisphere | |||
| CbLTp | Purkinje cell zone of lateral hemisphere | |||
| CbLTi | inner granular cell zone of lateral hemisphere | |||
| CbLTv | ventricular (germinal) zone of lateral hemisphere | |||
| CbFT | transient zones of cerebellar flocculus | |||
| CbFTe | external granular (germinal) zone of flocculus | |||
| CbFTm | marginal zone of flocculus | |||
| CbFTp | Purkinje cell zone of flocculus | |||
| CbFTi | inner granular cell zone of flocculus | |||
| CbFTv | ventricular (germinal) zone of flocculus | |||
| TGCbN | transient glia cell group of cerebellar deep nucleus | |||
| CbP | cerebellar plate | |||
| MZCbP | marginal (subpial stream) zone of cerebellar plate | |||
| IZCbP | intermediate (mantle) zone of cerebellar plate | |||
| NTZ | nuclear transitory zone of cerebellar plate | |||
| CTZ | cortical transitory zone of cerebellar plate | |||
| VZCbP | ventricular (neuroepithelial) zone of cerebellar plate | |||
| CbS | cerebellar swelling | |||
| CbSi | internal cerebellar swelling | |||
| CbSe | external cerebellar swelling | |||
| HNM | hindbrain neuromeres | |||
| RhIS | rhombencephalic isthmus | |||
| RhA | rhombomere A | |||
| Rh1 | rhombomere 1 | |||
| Rh2 | rhombomere 2 | |||
| Rh3 | rhombomere 3 | |||
| RhB | rhombomere B | |||
| Rh4 | rhombomere 4 | |||
| RhC | rhombomere C | |||
| Rh5 | rhombomere 5 | |||
| Rh6 | rhombomere 6 | |||
| Rh7 | rhombomere 7 | |||
| RhD | rhombomere D | |||
| Rh8 | rhombomere 8 | |||
| RhL | rhombic lip | |||
| URL | upper (rostral) rhombic lip | A | A | |
| EGL | external granular (germinal) layer of upper rhombic lip | A | A | |
| LRL | lower (caudal) rhombic lip | A | A | |
| EGLL | external granular (germinal) layer of lower rhombic lip | A | ||
| TCC | transient cell columns in pons | |||
| MCCP | medial cell column of pons | |||
| ICCP | intermediate cell column of pons | |||
| LCCP | lateral cell column of pons | |||
| TPC | transient Purkinje cell clusters | A | ||
| PkA | cluster A of Purkinje cells | |||
| PkB | cluster B of Purkinje cells | |||
| PkC | cluster C of Purkinje cells | |||
| PkD | cluster D of Purkinje cells | |||
| PkE | cluster E of Purkinje cells | |||
| PkF | cluster F of Purkinje cells | |||
| PkG | cluster G of Purkinje cells | |||
| PkH | cluster H of Purkinje cells | |||
| MSH | migratory streams in hindbrain | |||
| REMS | rostral (anterior) extramural migratory stream | A | ||
| CEMS | caudal (posterior) extramural migratory stream | A | A | |
| ImMS | intramural migratory stream | |||
| MZH | marginal zone of hindbrain | |||
| MZCb | marginal zone of cerebellum | |||
| MZPn | marginal zone of pons | |||
| MZMo | marginal zone of medulla oblongata | |||
| IZH | intermediate (mantle) zone of hindbrain | |||
| IZHal | alar plate of intermediate zone of hindbrain | |||
| IZHba | basal plate of intermediate zone of hindbrain | |||
| IZHfl | floor plate of intermediate zone of hindbrain | |||
| IZHro | roof plate of intermediate zone of hindbrain | |||
| VZH | ventricular (matrix) zone in hindbrain | |||
| VZCb | ventricular (matrix) zone of cerebellum | A | ||
| VZPn | ventricular (matrix) zone of pons | A | ||
| VZMo | ventricular (matrix) zone of medulla | |||
| PnFlx | pontine flexures | |||
| CrSlp | cranial (metacephalic) slope | |||
| CaSlp | caudal (myelencephalic) slope | |||
| PnbB | pontobulbar body | A | A | |
| RhGv | rhombic grooves | |||
| HPS | permanent structures of hindbrain (for more details see table 3 in Ding et al. J Comp Neurol, 2016) | |||
| Met | metencephalom | |||
| CB | cerebellum | |||
| CBC | cerebellar cortex | |||
| CBV | cerebellar vermis | A | A | |
| CBPV | paravermis of cerebellum | A | A | |
| CBL | lateral hemisphere of cerebellum | A | A | |
| CbDN | cerebellar deep nuclei | |||
| DT | dentate nucleus | A | A | |
| InP | interpositus nucleus | A | ||
| Fas | fastigial nucleus | |||
| Pn | pons | |||
| PN | pontine nucleus | A | A | |
| Mo5 | motor nucleus of trigeminal nerve | A | A | |
| Pr5 | principal sensory nucleus of trigeminal nerve | A | A | |
| 6N | abducens nucleus | A | A | |
| 7N | facial nucleus | A | A | |
| 8Co | cochlear nuclei | A | A | |
| MSO | medial superior olive | A | A | |
| SOC | superior olivary complex | |||
| TrZ | nucleus of trapezoid body | |||
| PnRa | Raphe pontis nucleus | |||
| MnR | median raphe nucleus | |||
| PnG | pontine gamma nucleus | |||
| PB | parabrachial nuclei | |||
| LPB | lateral parabrachial nucleus | A | A | |
| MPB | medial parabrachial nucleus | A | A | |
| RtTg | reticulotegmental nucleus | A | A | |
| NC | nucleus coeruleus | A | A | |
| LLN | nuclei of lateral lemniscus | |||
| DTg | dorsal tegmental nucleus | |||
| LDTg | laterodorsal tegmental nucleus | |||
| PnRF | pontine reticular formation | |||
| Mo | myelencephalon (medulla oblongata) | |||
| Sp5 | spinal trigeminal nucleus | A | A | |
| 8Ve | vestibular nuclei | A | A | |
| Sol | solitary nucleus | A | A | |
| Psol | parasolitary nucelus | A | ||
| 10N | vagal nucleus | A | A | |
| 12N | hypoglossal nucleus | A | A | |
| Amb | ambiguus nucleus | |||
| PrH | prepositus hypoglossal nucleus | A | ||
| MoRa | raphe nuclei in medulla oblongata | |||
| ROb | raphe obscurus nucleus | A | ||
| RMg | raphe magnus nucleus | A | A | |
| IO | inferior olive | A | A | |
| InM | intercalated nucleus of medulla | A | ||
| MoRF | medullary reticular formation | A | ||
| RVRG | rostral ventral respiratory cell group | A | ||
| LRt | lateral reticular nucleus | A | ||
| ECu | external cuneate nucleus | |||
| Cu | cuneate nucleus | A | ||
| Gr | gracile nucleus | A | ||
| HWM | white matter of hindbrain (for details see table 3 in Ding et al. J Comp Neurol, 2016) | |||
| HV | ventricles of hindbrain | |||
| 4V | fourth ventricle | |||
| cec | central canal of medulla oblongata | |||
| HSS | surface structures of hindbrain (for details see table 3 in Ding et al. J Comp Neurol, 2016) | |||
Lists all transient structures and main permanent structures used in the present study. For complete and detailed list of permanent brain structures, see Ding et al. J Comp Neurol, 2016.
2.7. Creation of prenatal human brain atlases
For the specimen at PCW 15, a total of 115 Nissl‐stained sections were produced at 1.04 mm spacing. For annotation 46 slides were chosen, including 23 from slab 1 (∼1 mm sampling density for the first 7 Nissl‐stained levels, ∼0.5 mm for the remaining 16 ones), and 22 from slab two (∼0.5 mm sampling density for the first 16 Nissl‐stained levels, ∼1 mm for the remaining 6 ones), and a single additional section effectively between slabs one and two. For the specimen at PCW 21, four slabs were generated due to its larger size than the PCW15 brain. Each of these four slabs were sectioned into 174 Nissl‐stained sections with 3 per 1.2 mm. A total of 81‐stained levels were chosen for annotation for anatomical atlas of this stage including 13 from slab 1 (∼1.2 mm sampling density), 32 from slab 2 (∼0.5 mm sampling density), 22 from slab 3 (∼0.5 mm sampling density for the first 16, ∼1.2 mm sampling density for the remaining 6), and 14 from slab 4 (∼1.2 mm sampling density). These particular sections were chosen to represent the anatomy with a frequency that corresponded with the structural complexity of the regions contained at that plane of section. In very frontal and occipital regions, for example, it is not necessary to densely sample cortical regions that are large and do not change much from section‐to‐section. In contrast, in middle regions containing many small subcortical regions the sampling density was increased to match that complexity and not miss any small structures (i.e., more Nissl‐stained sections were chosen for annotation). The position of each chosen section in a given slab was marked.
Annotation of the present brain atlases was performed similarly to that of our digital adult human brain atlas (Ding et al., 2016). Briefly, annotation drawings were done on printouts of the Nissl‐stained sections and then digitally scanned. Digital cartographic translation of expert‐delineated Nissl printouts was performed using Adobe Creative Suite 5. The resulting vector graphics were then converted to Scalable Vector Graphics (SVG). Each polygon was then associated with a structure from the ontology (see Table 1). Collating polygons in this way allows the flexibility to create various presentation modes (e.g., with or without colorization and transparency). The brain structures were colorized to assist users with identifying structures across different sections (see Appendices 1 and 3). Gross ontological groups (“parents”) were assigned hues from a range of the color spectrum. Each structure within a given parent group (“child”) was given a variation of the parent hue according to its relative cellular contrast in Nissl stain. The following general principle was applied: the higher the density, the deeper the shade (i.e., addition of black to hue); the lower the density, the deeper the tint (i.e., addition of white to hue). Large parent groups (e.g., thalamus) were assigned uniformly light variations of their principal hues to provide a visually subtle, cohesive backdrop for component substructures, which often exhibit a range of relative cellular contrasts (reflected by shades and tints). To create gene expression atlases for PCW 15 and 21 brains, we applied annotations from the anatomical atlases for each age onto the interleaved coronal ISH sections for 37 (PCW15) and 5 (PCW21) genes out of 43 (see Appendices 2 and 4). The workflow for generation of the prenatal human brain atlases is similar to the one described in our adult human brain atlas (Ding et al., 2016) and is briefly summarized in Figure 1.
FIGURE 1.
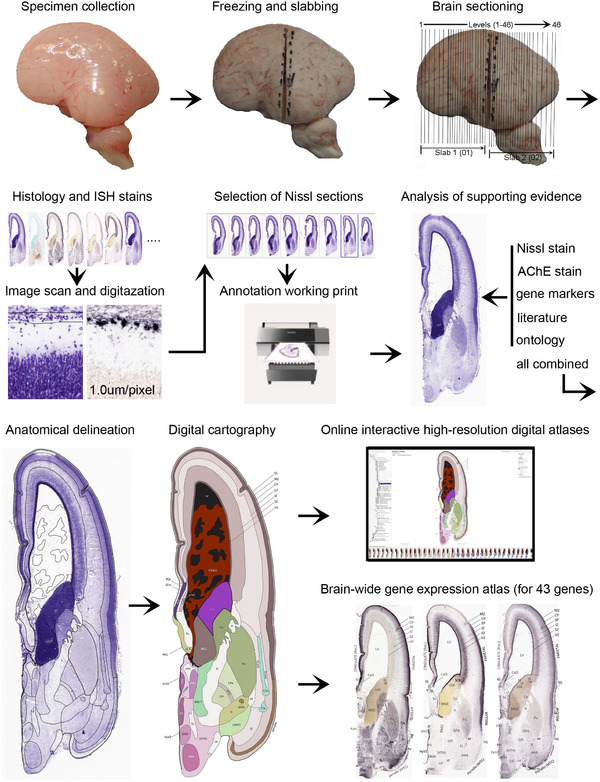
Workflow for atlas generation
3. RESULTS
3.1. Structural annotation of histological and molecular prenatal human brain datasets
To generate accurate and detailed anatomical brain atlases, we performed both histological stains (Nissl and AChE) and ISH for 43 gene probes on sequential sets of coronal cryosections from right hemisphere of two midgestation brains (PCW 15 and 21). With the anatomical atlases as a guide, we also annotated the spatial expression of 37 and 5 genes in the brain at PCW 15 and 21, respectively; these are treated as prenatal molecular brain atlases. The anatomical and molecular atlases for the brain at PCW 15 are presented in Appendices 1 and 2, respectively. The similarly generated anatomical and molecular atlases for the brain at PCW 21 are presented in Appendices 3 and 4. All appendices have online links for cellular resolution histology and ISH images (1.0 μm/pixel). Example plates of annotated anatomical atlases from the two brains are shown in Figure 2 (where a and b designate PCW 15 and PCW 21, respectively). Delineation of anatomical boundaries of different cortical layers and brain regions are detailed below with emphasis mainly on the brain at PCW 15 although some major molecular features from the brain at PCW 21 are also described for comparison.
FIGURE 2.
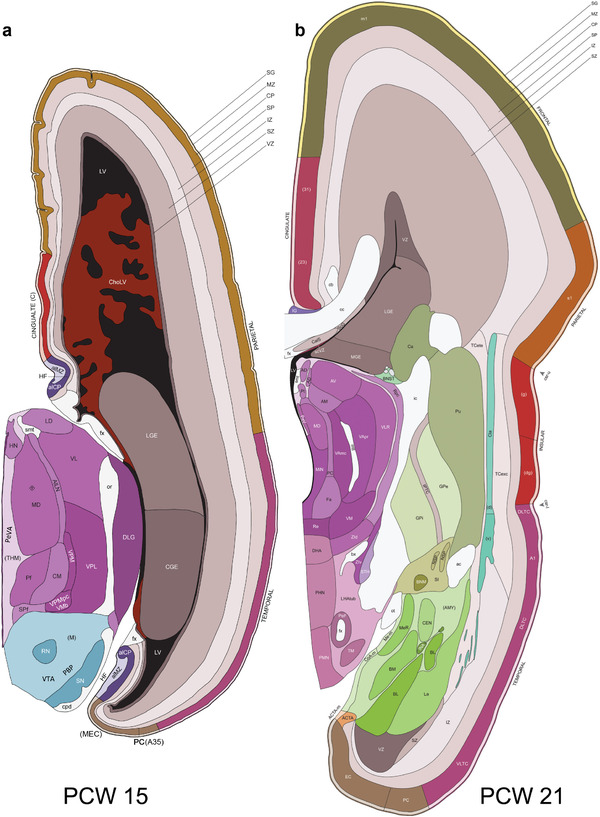
Example of anatomical atlas plates from PCW 15 (a) and 21 (b) brains
3.2. Delineation of prenatal neocortical layers
PCW 15. In Nissl preparations, seven neocortical layers can be generally identified. For example, from the pia to the lateral ventricle (LV) of the medial occipital cortex, these layers include the subpial granular zone (SG), marginal zone (MZ), cortical plate (CP), subplate (SP), intermediate zone (IZ), subventricular zone (SZ), and ventricular zone (VZ) (Figure 3a). The SZ can be further subdivided into less densely packed outer and more densely packed inner parts (SZo and SZi, respectively) with SZi adjoining VZ, which is the most densely packed zone near the LV (Figure 3a). However, evidence for the existence of two subdivisions of the SP is not observed although the two portions were reported for human brains at PCW 13 and 14 (Kostovic & Rakic, 1990). At PCW15, the outer fiber zone (OF) begins to appear in the outermost part of the SZo, deep to the IZ. The OF is positive for AChE staining (see the AChE plates in Appendix 1). To confirm and accurately to delineate the developing neocortical layers, we analyzed the large set of ISH data described above and found that many genes display layer‐specific expression patterns. For instance, in the medial occipital/visual cortex (Figure 3), PAX6 and TBR2 (EOMES) are selectively expressed in the proliferative zones VZ and SZ with strongest PAX6 and TBR2 expression in VZ and deepest SZ (SZd), respectively (Figure 3b and c). SZd was sometimes termed as the border zone (BZ) between SZ and VZ. Interestingly, inner part of the VZ (VZi, near LV) does not show TBR2 expression (Figure 3c). VIM, SOX2, and FABP7 are also dominantly expressed in VZ and SZ (VZ > SZ) but with weak expression in CP (Figure 3d, g, and h). In contrast, GRIK2 and SATB2 are selectively expressed in the postmitotic zones IZ/OF, SP, and CP. Specifically, GRIK2 is dominantly expressed in SP and deep CP with weak expression in IZ while SATB2 is mainly expressed in IZ/OF with weak expression in SP and CP (Figure 3e and f). Some genes (e.g., ENC1) are strongly expressed in both proliferative (VZ, SZ) and postmitotic (CP) zones (Figure 3i).
FIGURE 3.
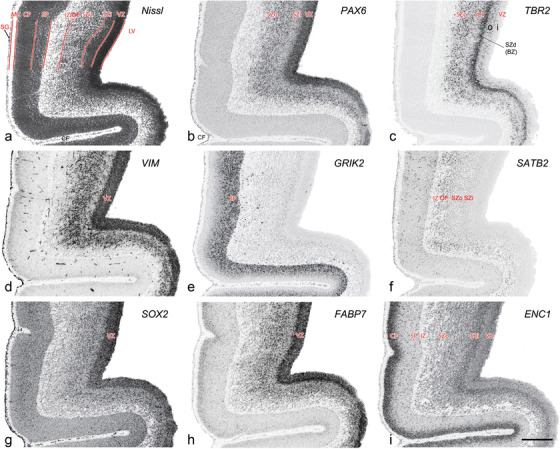
Molecular marker expression in medial occipital cortex at PCW15. (a) A Nissl‐stained section showing the lamination of the cortex near the calcarine fissure (CF). (b‐i) Expression patterns of PAX6 (b), TBR2 (c), VIM (d), GRIK2 (e), SATB2 (f), SOX2 (g), FABP7 (h), and ENC1 (i). Note that a dense zone of TBR2 expression at the border between SZi and VZ is termed as deep SZ zone (SZd) or border zone (BZ). The thickness ratio of SZo to VZ is about 3:1. SG, subpial granular zone; MZ, marginal zone; CP, cortical plate; SP, subplate; IZ, intermediate zone; OF, outer fiber zone; SZ, subventricular zone; SZo and SZi, outer and inner SZ; VZ, ventricular zone; LV, lateral ventricle. These terms apply to main text and all related figures below. Scale bar: 400 μm in (i) for all panels
To examine whether more anterior neocortical regions display similar or different laminar organization, we investigated the same set of genes expressed in the dorsomedial frontal neocortex (Figure 4). In this region, all the cortical layers are visible with relatively thick SP compared to CP (Figure 4a). Compared to the occipital region, the existence of the OF in the frontal cortex is more visible and thicker. The OF contains many radially oriented SZ cells (Figure 4a) and is, thus, included in the outermost part of SZo in the present atlas (i.e., the OF is not annotated separately from the SZo in Appendix 1). In the frontal cortex, VIM, SOX2, PAX6, and TBR2 have similar expression patterns as in the occipital cortex (e.g., Figure 4a‐c). Compared to the occipital cortex, FABP7 shows stronger expression in CP (Figure 4d) although expression in other zones is comparable to the occipital cortex. LMO4 is selectively expressed in the CP (Figure 4e) while this expression in the occipital cortex is not obvious (see Appendix 2). GRIK2 display strong expression in CP, SP, and IZ of frontal cortex (Figure 4g), while it is mainly expressed in SP of occipital cortex (Figure 3e). SATB2 in the frontal cortex has strong expression in CP, SP, IZ, and OF (Figure 4h), while only the OF has strong expression in the occipital cortex. In addition, ETV1 expression appears in the deep CP (Figure 4f), but is not detected in the occipital cortex (not shown). The differential gene expression could reflect differential maturation across the cortex as well as regional differences. Additional data on later stages are needed to address this issue. Finally, it is noted that the inner fiber zone (IF), which is a cell‐sparse zone located between SZo and SZi (see Figure 5a), is not clearly distinguishable in most of the neocortical regions at PCW 15 (e.g., Figure 4a) except in the middle lateral region (mainly parietal cortex, see the Nissl plates in Appendix 1).
FIGURE 4.
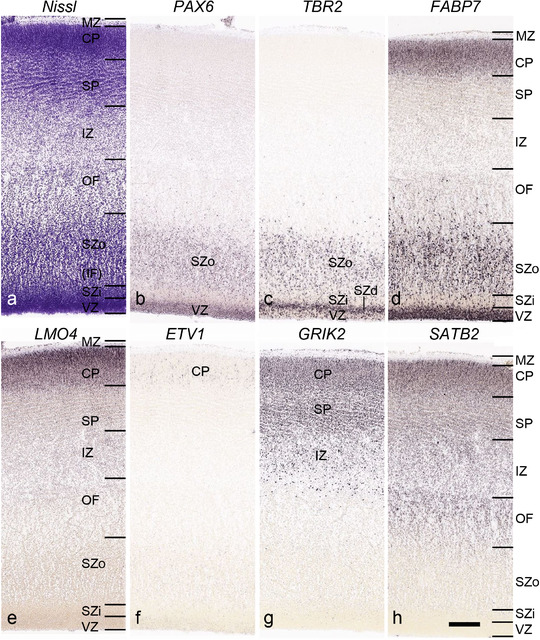
Gene expression in medial frontal cortex at PCW 15. (a) Nissl‐stained section showing the laminar organization of the cortex. (b‐h) Expression patterns of PAX6 (b), TBR2 (c), FABP7 (d), LMO4 (e), ETV1 (f), GRIK2 (g), and SATB2 (h). Note that the thickness ratio of SZo to VZ is about 5:1. Scale bar: 330 μm in (h) for all panels
FIGURE 5.
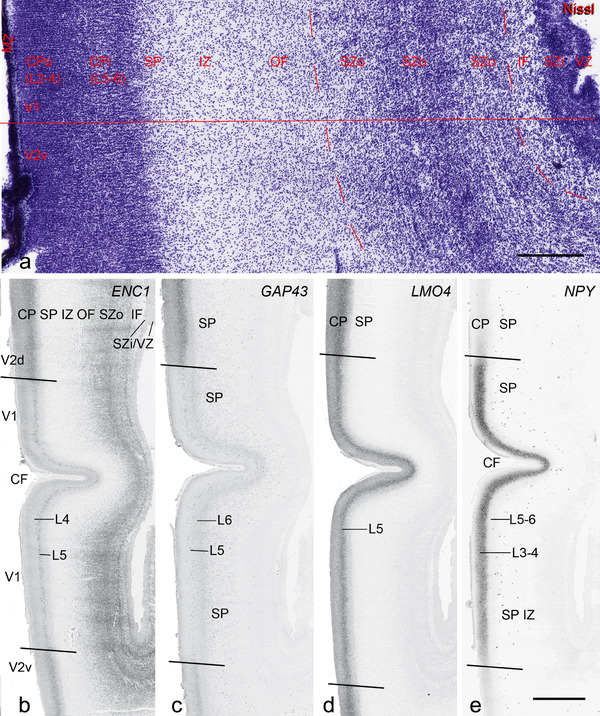
Cytoarchitecture and gene expression in the medial occipital cortex at PCW 21. (a) A Nissl‐stained section showing the lamination of the cortex. CPo (future layers 2 to 4) and CPi (future layers 5 and 6) can be appreciated but differentiation between V1 and V2 (here V2v) is not yet clear in Nissl preparations. Inner fiber zone (IF) can be identified as a cell‐less zone between SZi and SZo. (b‐e) Expression patterns of ENC1 (b), GAP43 (c), LMO4 (d), and NPY(e). Note the obvious difference of the gene expression patterns between V1 and the dorsal and ventral V2 (V2d and V2v, respectively). Scale bars: 400 μm in (a); 1600 μm in (b) for panels (b‐e)
PCW 21. On Nissl‐stained sections, all the cortical layers that appeared at PCW 15 can be identified at PCW21, although changes in their relative thickness are observed. In the occipital/visual cortex, the thickness of CP and SZo is greatly increased and outer and inner CP (CPo and CPi) are distinguishable (Figure 5a). A major feature of the neocortex at PCW 21 is the clear presence of the IF across all neocortical regions (e.g., Figure 5a). The IF was reported to be immunoreactive to SLIT‐ROBO Rho GTPase activating protein 1 (see Molnár & Clowry, 2012). Some callosal fibers may contribute to this IF zone since the callosal fibers appear to extend in this zone from medial to lateral aspects (see Nissl plates in Appendices 1 and 3). Tangential migrating cortical interneurons, which are derived from the ganglionic eminence (GE), are mainly located in this zone before invading the CP. At PCW 21, NPY expression is mainly located in the SP of all neocortical regions and in the middle CP layers (future layers 3 and 4) of V1 (Figure 5e). Strong PAX6, TRB2, and VIM expression is restricted in the proliferative zones (SZo, SZi, and VZ) of the neocortex, similar to the findings from PCW 15. The OF and IF at PCW 21 still contain a lot of SZo cells and, thus, are included in the SZ (SZo) in our atlas plates (Appendix 3). SST is an additional marker for the SP at PCW21 (Appendix 4).
3.3. Delineation of prenatal neocortical areas
PCW 15. On Nissl‐stained sections, obvious differences among neocortical regions were not observed at PCW 15. However, an anterior‐posterior (A‐P) gradient of gene expression in neocortex was observed. For instance, LMO4 displays strong expression in the CP of frontal and temporal cortices with gradually weaker expression in parietal and occipital cortices (Figure 6a and b). In contrast, NPY expression in the CP is stronger in temporal (Figure 6c) and occipital cortices than in parietal (Figure 6c) and frontal (Figure 6d) cortices. NPY expression in the SP also shows regional difference with relatively stronger expression in posterior and lateral neocortex and weaker expression in anterior and medial neocortex (Figure 6c and d). In addition, NTRK2 shows weak expression in the SP and CPi of frontal neocortex but gradually stronger expression in parietal, temporal, and occipital cortices, and is strongest in occipital neocortex (see Appendix 2). A‐P differences in FABP7, LMO4, GRIK2, and SATB2 expression in different layers also occur between dorsomedial frontal and occipital cortices (compare Figure 3, 4). However, primary sensory (V1, A1 [primary auditory] and S1 [somatosensory]) cortices and primary motor cortex (M1) are not distinguishable from adjoining areas at PCW 15. The cingulate cortex can be identified based on its differential expression patterns of genes, such as ETV1, ENC1, and LMO4, from adjoining regions (see Appendix 2). Therefore, frontal, parietal, temporal, occipital, and cingulate cortices can be roughly identified at PCW 15.
FIGURE 6.
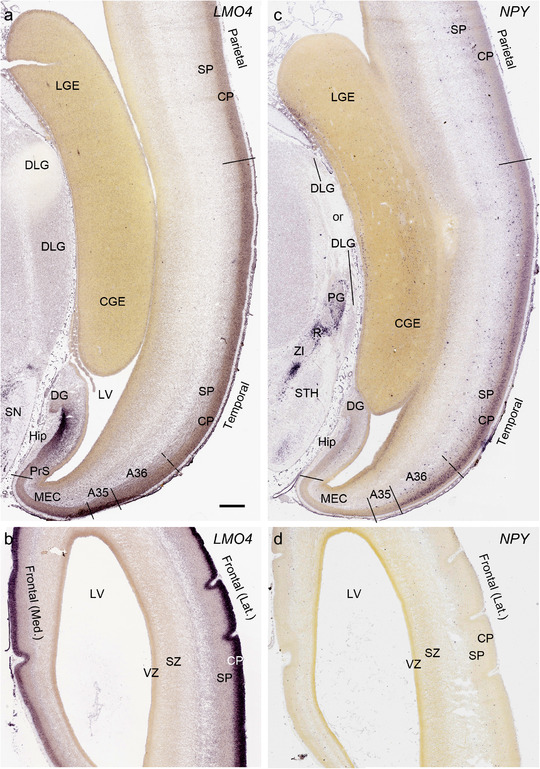
Differential gene expression across neocortex at PCW15. (a,b) Expression of LMO4 in parietal, temporal (a), and frontal (b) cortices. Note the strong expression in the hippocampus (Hip). (c,d) Differential expression of NPY in parietal, temporal (c), and frontal (d) cortices. NPY is also expressed in the pregeniculate (PG) and reticular thalamic (R) nuclei. DLG, dorsal lateral geniculate nucleus; SN, substantia nigra; ZI, zona incerta; STH, subthalamic nucleus. Scale bar: 790 μm in (a) for all panels
PCW 21. In addition to the identified major neocortical regions described above, one important feature at PCW 21 is that V1 can be distinguished from the secondary visual cortex (V2) on ENC1‐, GAP43‐, LMO4‐, and NPY‐ISH sections (Figure 5b‐e) although the borders are not yet discernable based on Nissl staining (Figure 5a). Generally, the former three genes are much less expressed in V1 than in V2 (Figure 5b‐d), while NPY is strongly expressed in the deep CP of V1 compared to V2 (Figure 5e). However, A1 and S1 cannot be well distinguished from adjoining cortices. Subtle difference between M1 and S1 appears at PCW 21, for example, on ENC1‐, PLXNA2‐, NRGN‐, and ETV1‐ISH sections. These gene markers clearly display layer 5 of the neocortex. As M1 has a well‐developed and thicker layer 5 than S1, which shows a weaker layer 5, the border between M1 and S1 can be roughly established at PCW 21 (see Appendix 4). Similarly, the cingulate cortex can be identified at PCW 21 more easily than at PCW 15 based on the expression patterns of ETV1, ENC1, LMO4, PLXNA2, and NRGN (see Appendix 4). For example, ETV1 and NRGN are strongly expressed in both anterior and posterior cingulate cortex but only weakly in the adjoining neocortex (see Appendix 4). Finally, the dysgranular and granular insular cortex (Idg and Ig, respectively) can also be identified at PCW 21 based on Nissl stain, gene expression patterns, and its relationship with the claustrum, located deep to the insular cortex and displaying strong GRIK2 and LMO4 expression.
3.4. Delineation of the layers in prenatal allocortex and periallocortex
In contrast to the neocortex, which typically has six well‐defined cortical layers, the allocortex, which includes the hippocampal formation (HF or archicortex) and olfactory cortices (mainly the piriform cortex, Pir), generally displays three major layers in mature cortex. As in the mature brain, the prenatal Pir is a three‐layered, easily identified structure, and as such is not further described in this study. The HF in this study mainly contains the hippocampus [dentate gyrus [DG] and hippocampal subfields (CA1‐4)] and the subicular cortex [prosubiculum (ProS) and subiculum proper (S)]. The cortical region located between allocortex and neocortex is usually termed periallocortex which includes peripaleocortex and periarchicortex. The former mainly includes agranular insular cortex (Iag) and agranular temporal insular cortex (area TI) while the latter includes entorhinal cortex (EC), perirhinal cortex (PC or area 35), presubiculum (PrS), parasubiculum (PaS), and retrosplenial cortex (RSC: areas 29 and 30) (see Table 1 and Ding et al., 2016). The periallocortex has more than three layers (4 to 6 or 7 layers) and these layers are usually not equivalent to the neocortical layers. Note that other related terms were also used in literature. For example, subicular complex was used to include ProS, S, PrS, and PaS (e.g., Ding, 2013). The medial temporal cortex (MTC) was used to contain PrS, PaS, EC, and PC (i.e., area 35) (similar to periarchicortex without RSC). The following description mainly focuses on the HF and MTC.
PCW15. On Nissl preparations, the typical laminar organization of the HF is obvious at this stage (Figure 7a). Many genes show clear expression patterns in distinct layers or sublayers of the HF. The expression patterns of 16 genes are shown as examples (Figure 7b‐p). Specifically, the CP of the HF (i.e., hippocampal plate) expresses FADS2, FOXP1, ETV1, and SYNGAP1 in its full thickness, while the inner CP (CPi) expresses additional genes such as FEZF2, NRTK2, NRGN, and SHANK3. FABP7, FADS2, and NTRK2 are strongly expressed in the VZi while strong expression of VIM is seen throughout the VZ. Interestingly, TBR2 expression appears to concentrate at SZi/VZo border or SZd. The SP expresses GRIK2, while GAP43, FOXG1, and ENC1 are strongly expressed in the SZi, CP, and SP, but weakly in IZ. In the MZ, strong expression was found for GAP43 (Figure 7c), ERBB4, DCX, RELN, and CALB2 (see Appendix 2). Interestingly, SZo is not identified in the HF and MTC. As shown in Figure 8, only the thinner VZ and SZi, but not the thicker SZo, extend from temporal neocortex into the MTC and HF. The SZi is recognizable by lower expression of TBR2 (Figure 8a) and VIM (Figure 8b) compared to the VZ and SZo. The existence of SZi in the MTC and HF are also revealed by the strong expression of TBR2 in the SZd (Figure 8a).
FIGURE 7.
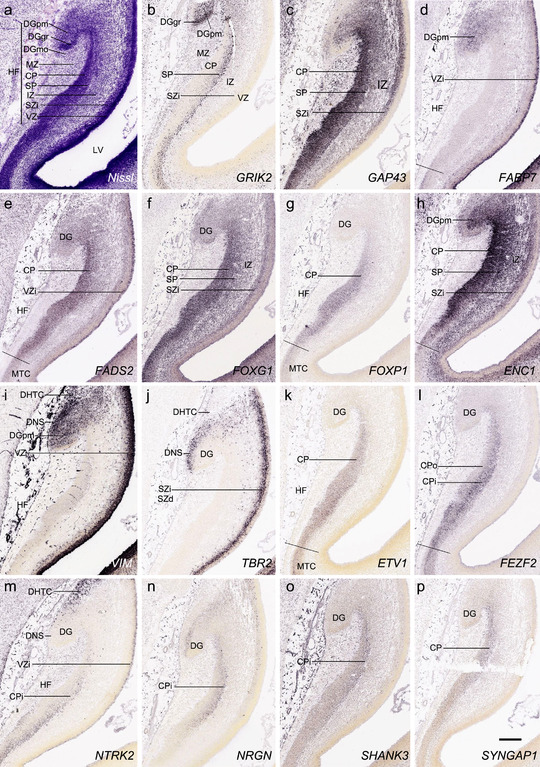
Gene expression in hippocampal formation (HF) at PCW15. (a) A Nissl‐stained section showing the laminar organization of the HF. (b‐p) Expression patterns of 15 genes as indicated in (b‐p). Note the layer‐specific gene expression in HF and the expression of VIM (i) and NTRK2 (m) in the migrating dentate‐hippocampal transient cells (DHTC). VZi, inner VZ; DG, dentate gyrus; DGmo, DGgc and DGpm, molecular, granular, and polymorphic layers (zones) of the DG. Scale bar: 400 μm in (p) for all panels
FIGURE 8.
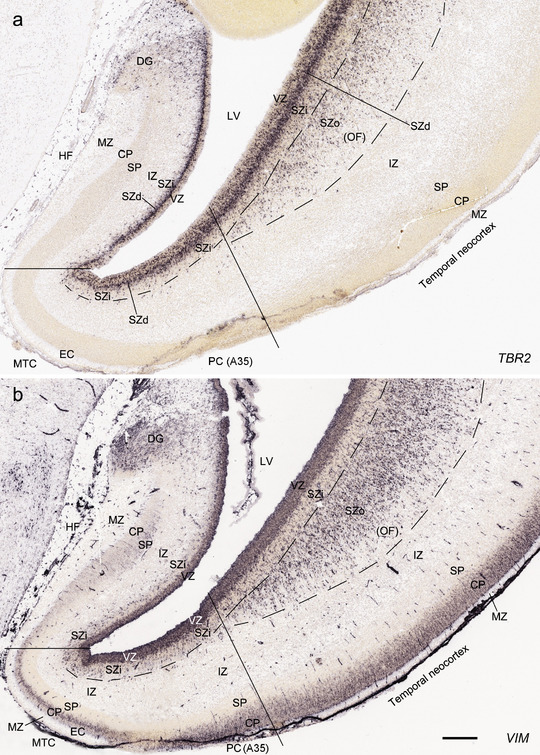
Comparison of the layers in allocortex, periallocortex, and neocortex at PCW 15. TBR2 (a) and VIM (b) are expressed in the VZ and SZi of these three types of cortex as well as in the SZo of the neocortex. Note that the SZo in the temporal neocortex does not extend into periallocortex [mainly entorhinal cortex (EC) and perirhinal cortex (PC)] and hippocampal formation (HF). VIM is also strongly expressed in the CP of the neocortex and PC (i.e., area 35) but weakly in the CP of the EC (b). Scale bar: 400 μm in (b) for (a, b)
PCW 21. All the layers of the HF and MTC seen at PCW 15 can be identified on Nissl‐stained and ISH sections at PCW 21. These layers include MZ, CP, SP, IZ, SZi, and VZ (Figure 9a). Layer‐specific gene expression is also observed. SOX2, FOXG1, ENC1, GAP43, NTRK2, SHANK3, SYNGAP1, LBX1, LHX2, NRGN, LMO4, DCX (see Appendix 4), and NES (Figure 9a) are strongly expressed in the CP while FOXP1 and CNTNAP2 expression (Figure 9c) are strongly expressed in the inner CP (CPi). RELN is expressed in MZ (Figure 9b), and NPY, SST, PLXNA2 (see Appendix 4), and GRIK2 (Figure 9d) in SP. Finally, PAX6 is lightly expressed in SZi (Figure 9e) and SOX2, VIM (not shown), and GFAP strongly in VZ (Figure 9f). The thick SZo does not extend from the temporal neocortex into the MTC and HF, as demonstrated using SZo markers such as FABP7 (not shown), NES, PAX6, TBR2, and VIM (Figure 9a and e; 10a and d). In the MTC, ETV1 and NRXN1 are also mostly expressed in layers 5–6 of the EC (Figure 11a‐c). In contrast, GRIK2 and LMO4 are mainly expressed in layers 2–3 of the EC with relatively lower expression in L5‐6 (Figure 11d and e).
FIGURE 9.
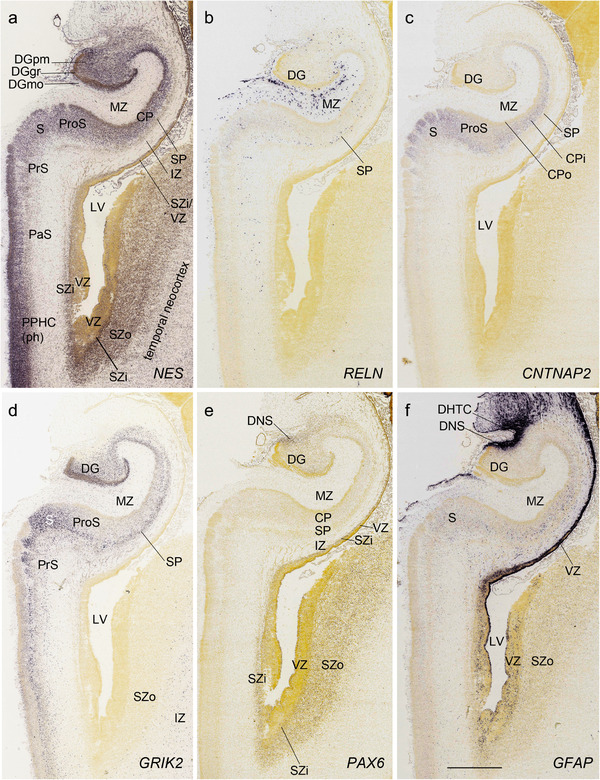
Layer‐selective gene expression in the hippocampus at PCW 21. (a) NES expression in the CP but not the SP of the hippocampus. (b) RELN expression in the MZ and SP of the hippocampus and DGmo. (c, d) CNTNAP2 (c) and GRIK2 (d) expression in the inner CP (CPi) of the hippocampus and superficial layers of the subiculum (S). (e) PAX6 expression in the SZi of the hippocampus and both SZi and SZo of the temporal neocortex as well as in the DNS. (f) GFAP expression in the VZ of the hippocampus and DNS of the DG. Scale bar: 1590 μm in (f) for all panels
FIGURE 10.
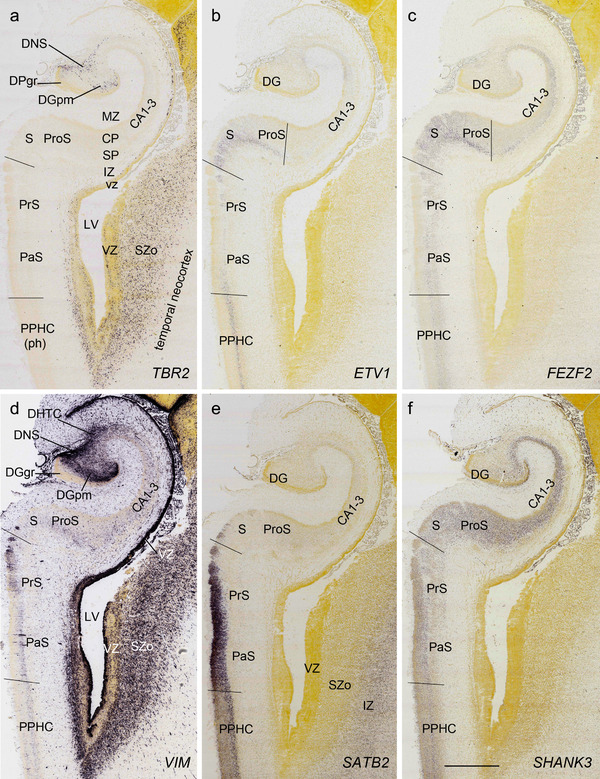
Region‐selective gene expression in the HF at PCW 21. (a) TBR2 expression in the DNS and DGpm. Strong TBR2 expression is also seen in the SZo of the temporal neocortex. (b,c) ETV1 (b) and FEZF2 (c) expression in the subiculum (S) and deep prosubiculum (ProS). FEZF2 is also expressed in the deep CP of the hippocampus (CA1‐3). (d) Strong VIM expression in DNS, DHTC, DGpm, and VZ of the hippocampus as well as in the VZ and SZo of the temporal neocortex. (e) Strong SATB2 expression in the presubiculum (PrS) and parasubiculum (PaS) as well as in the IZ of the temporal neocortex. (f) Strong SHANK3 expression in the CP of the hippocampus. Scale bar: 1590 μm in (f) for all panels
FIGURE 11.
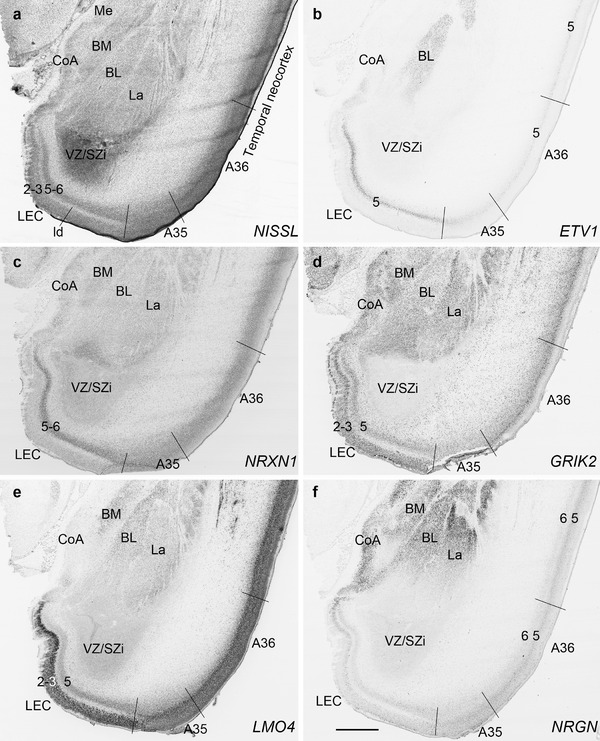
Gene expression in lateral entorhinal cortex (LEC), perirhinal area 35 (A35), and amygdala at PCW 21. (a) A Nissl‐stained section showing the cytoarchitecture in the LEC, A35, and amygdaloid nuclei. (b‐f) Expression patterns of ETV1 (b), NRXN1 (c), GRIK2 (d), LMO4 (e), and NRGN (f) in the LEC, A35, and amygdaloid nuclei. Note that the borders of A35 with LEC and temporal neocortical area 36 (A36) can be identified based on gene expression difference. A35 displays overall lower expression of ETV1 (b), NRXN1 (c), and GRIK2 (d) than LEC and A36. Subtle difference could also be noted at the border between A36 and more dorsally located temporal cortex with less expression of ETV1 (b), GRIK2 (d), and NRGN (f) in A36. Scale bar: 1590 μm in (f) for all panels
In summary, a striking feature of the HF and MTC appears to be its lack of SZo, which is one of the thickest neocortical layers at PCW15 and 21. The thickness of SZo in temporal neocortex is dramatically reduced toward the border with the PC (Figure 8) and the SZo is not observed in the MTC and HF (Figures 8, 9, 10). At PCW 21, the VZ and SZi extend from the temporal neocortex into the HF with gradually narrowing of their thickness towards the DG (Figures 9, 10).
3.5. Delineation of the subregions in prenatal allocortex and periallocortex
PCW 15. To investigate whether regional difference can be distinguished in the prenatal allocortex and periallocortex, we analyzed and compared gene expression patterns in different regions of the HF and MTC, and between the MTC and neocortex. At PCW 15, the granular layer of the DG (DGgr) is recognizable from the remaining HF (Figure 7a and b). The polymorphic layer of the DG (DGpm) can also be roughly identified in GRIK2, GAP43, FABP7, and ENC1‐ ISH sections (Figure 7b‐d and h). However, subfields CA1‐3 are not yet distinguishable within the HF although the boundary between the HF and MTC is appreciable (Figure 7d, e, g, h, k, and l). Interestingly, strong VIM and TBR2 expression is observed in the so‐called dentate neuroepithelial stem cell zone (DNS; see Nelson et al., 2020) while VIM and NTRK2 are strongly expressed in another transient zone called dentate‐hippocampal transient cell zone (DHTC), which is located immediately dorsal to the DNS (Figure 7i and m). The boundaries between the MTC and neocortex are identifiable based on expression patterns of some genes in addition to the lack of SZo in the MTC. For instance, SATB2 displays strong expression in the entire CP and IZ and moderate expression in the SP of the insular and temporal neocortex (Figure 12a and b). In contrast, strong SATB2 expression is only seen in the IZ and CPi (layers 5–6) of the lateral EC (LEC; Figure 12a) and in layer 5 of the medial EC (MEC; Figure 12b and the inset in b).
FIGURE 12.
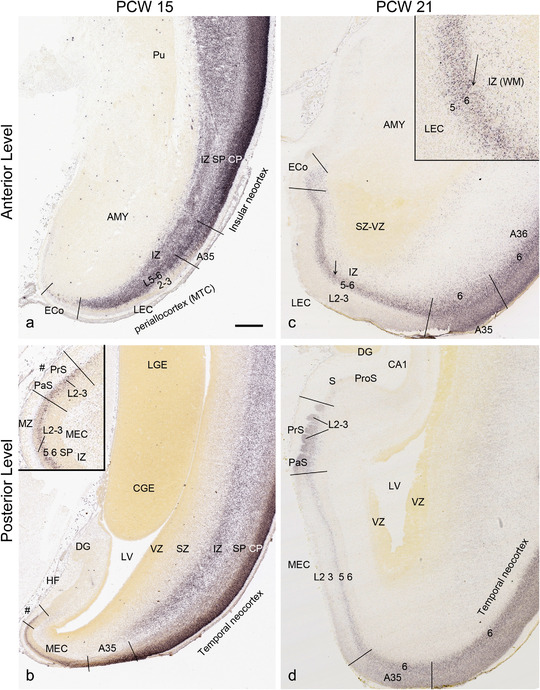
Identification of lateral and medial entorhinal cortex at PCW 15 and 21. (a, b) Lateral (a) and medial (b) entorhinal cortex (LEC and MEC, respectively) identified on SATB2‐stained section at PCW15. The inset in (b) is a higher power view of the MEC (#s indicate the same location). (c, d) LEC (c) and MEC (d) identified on SATB2‐stained section at PCW21. The inset in (c) is a higher power view of the LEC (the arrows indicate the same location). SATB2 expression is seen in both layers 5 and 6 of the LEC, including the olfactory part (ECo) (c), but only in layer 5 of the MEC (d). At both PCW 15 and 21, strong SATB2 expression is seen in layer 5 of the MEC and layers 2–3 of the presubiculum (PrS) and parasubiculum (PaS). Pu, putamen; AMY, amygdala; LGE and CGE, lateral and caudal ganglion eminence. Scale bar: 790 μm in (a) for all panels
In addition, differential gene expression patterns in LEC versus MEC can also be identified. For example, strong expression of NTRK2 (Figure 13a), GRIK2 (Figure 13b), ETV1 (Figure 13c), and GAP43 (Figure 13d) is observed in layer 2 of the LEC, which is located anteriorly at the level of the amygdala. In contrast, ETV1 (Figure 13e) and NTRK2 (Figure 13h) are not expressed in layer 2 of the MEC, which is at the posterior levels and adjoins the HF. Layer 2 in both LEC and MEC expresses GAP43 (Figure 13d and g) and areas 35 (A35) and 36 (A36) extend along both LEC and MEC. The borders of A35 with the EC and A36 can also be appreciated at both anterior (Figure 13a‐d) and posterior (Figure 13e‐h) levels based on combined gene expression patterns. At the anterior level, for example, GRIK2 is strongly and weakly expressed in layers 2–3 of the LEC and A35, respectively (Figure 13b) and the reverse is true for ETV1 expression (Figure 13c). At the posterior level, clear and faint CNTNAP2 expression is observed in layer 2 of the MEC and A35, respectively (Figure 13f). The border between A35 and A36 can be identified based on ETV1 expression since strong and faint expression exists in A35 and A36, respectively (Figure 13e). In contrast, the border between A36 and the laterally adjoining temporal cortex is relatively difficult to be placed. However, subtle expression difference exists in the density and intensity of certain genes. For instance, the density and intensity of ETV1 expression is lower in A36 than in the lateral neocortex (Figure 13e).
FIGURE 13.
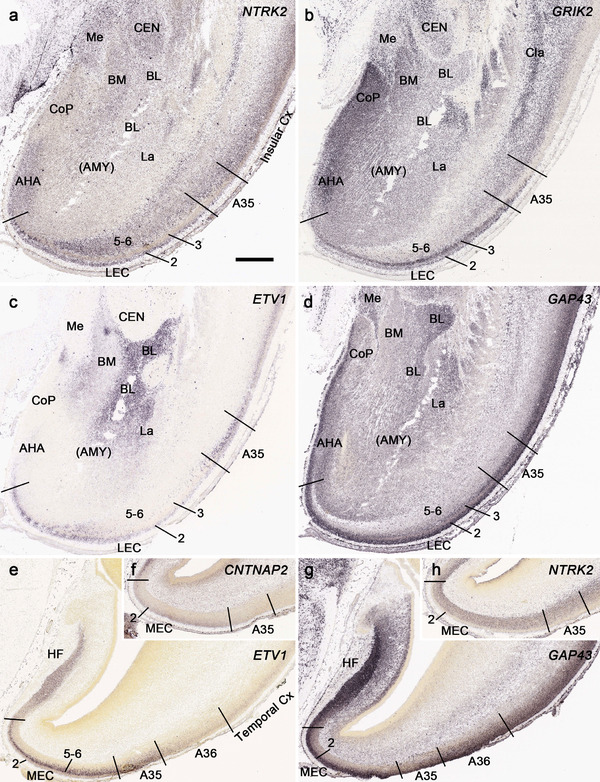
Identification of LEC, MEC, and areas 35 and 36 at PCW15. The borders of these four areas can be identified based on combined gene expression patterns. Strong expression of NTRK2 (a), GRIK2 (b), ETV1 (c), and GAP43 (d) is observed in layer 2 of the LEC. In contrast, ETV1 (e) and NTRK2 (h) are not expressed in layer 2 of the MEC. Layer 2 in both LEC and MEC expresses GAP43 (d, g). The borders of A35 with the EC (LEC and MEC) and A36 can also be appreciated on the base of combined gene expression patterns. At the anterior level (a‐d), GRIK2 is strongly and weakly expressed in layers 2–3 of the LEC and A35, respectively (b) and the reverse is true for ETV1 expression (c). At the posterior level (e‐h), clear and faint CNTNAP2 expression is observed in layer 2 of the MEC and A35, respectively (f). The border between A35 and A36 can be identified based on ETV1 expression since strong and faint expression exists in A35 and A36, respectively (e). The density and intensity of ETV1 expression is lower in A36 than in the lateral neocortex (e)
PCW 21. Regional differences within the HF are clear at PCW 21. For instance, the subiculum (S) strongly expresses CNTNAP2, GRIK2 (Figure 9c and d), ETV1, and FEZF2 (Figure 10b and c) while adjoining HF regions (e.g., ProS, CA1‐3) display very low expression of these genes. Alternatively, some genes, such as TBR2 and VIM, show strong expression in the DGpm and DNS but not or little expression in other HF regions (Figure 10a and d). The DNS also strongly expresses PAX 6, GFAP (Figure 9e and f), SOX2, and NTRK2 while the DHTC express strong GFAP, weaker VIM, SOX2, and NTRK2, and no or low TBR2 and PAX6 (see Appendix 4). The regional difference between MTC and neocortex at PCW 21 is even more obvious than that at PCW 15 (Figure 12c and d). LEC and MEC have strong SATB2 expression in layers 5–6 and layer 5, respectively (Figure 12c and d). In the PrS and PaS, strong SATB2 expression is seen in the superficial rather than deep layers (Figure 12d). In contrast, no SATB2 expression is observed in the subiculum and hippocampus (Figure 12d). The borders of A35 with the LEC and A36 can be identified based on the relatively weaker expression of ETV1, NRXN1, and GRIK2 in A35 compared to the LEC and A36 (Figure 11a‐d). The border between A36 and the lateral temporal neocortex can also be roughly determined based on the relatively weaker expression of ETV1, GRIK2, and NRGN in A36 than in the temporal cortex (Figure 11b, d, and f).
3.6. Delineation of cerebral nuclei
PCW 15. Strong gene expression was found in specific cerebral nuclei and these are helpful in their delineation. For example, CALB2 expression is observed in the medial (Me), anterior cortical (CoA), and parts of the lateral (La) nuclei of the amygdala (Figure 14a). Other such regional expression patterns are NPY, SST, FOXG1, and DLX1 in the bed nucleus of terminalis (BNST); ETV1 expression in the external part of globus pallidus (GPe), and basolateral nucleus (BL; Figure 13c) of the amygdala; NTRK2, GRIK2 (Figure 13a and b), and SST expression in central nucleus (CEN) of the amygdala; FOXP1 and NPY expression in caudate nucleus (Ca) and putamen (Pu); GRIK2 (Figure 13b) and LMO4 expression in claustrum; NKX2.1 and ZIC1 expression in GPe; and RELN and LMO4 expression in GPi. In addition, ZIC1 is strongly expressed in septal nucleus (SEP) and basal nucleus of Meynert (BNM). It should also be pointed out that strong transient expression of CALB2 (Figure 14a) and PAX6 is observed in the space between the GPe and GPi. We refer to this zone as interpallidal transient cell zone (IPTC; Figure 14a). CALB2 is also expressed in the transient cells located between GPe and Pu (Figure 14a). Expression of all above mentioned genes is shown in Appendix 2.
FIGURE 14.
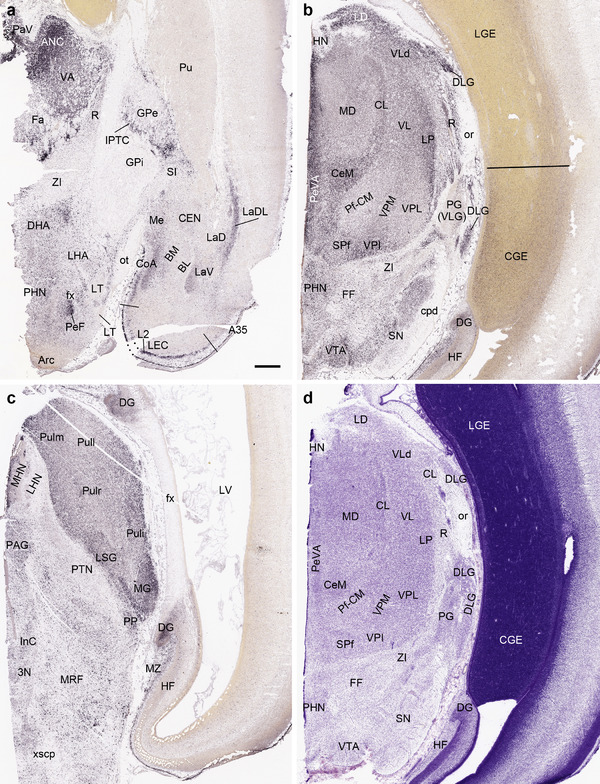
CALB2 expression in the brain at PCW 15. (a) CALB2 expression in the anterior thalamic region, basal ganglion, amygdala, and lateral entorhinal cortex (LEC). Note the strong CALB2 expression in anterior thalamic nuclear complex (ANC), medial hypothalamic region, anterior cortical nucleus of the amygdala (CoA), interpallidal transient cell zone (IPTC), and layer 2 of the LEC. (b) CALB2 expression in middle thalamic region, midbrain, and caudal ganglionic eminence (CGE). Strong CALB2 expression is seen in the lateral dorsal nucleus (LD), ventral lateral nucleus (VL), dorsal lateral geniculate nucleus (DLG), central medial nucleus (CeM), and subparafascicular nucleus (SPf) of the thalamus as well as in the ventral tegmental area (VTA) and CGE. Note the much stronger expression of CALB2 in CGE than in LGE. (c) CALB2 expression in posterior thalamic region, midbrain, and HF. Note the strong CALB2 expression in the pulvinar (Pul), medial geniculate nucleus (MG), limitans/suprageniculate nucleus (LSG), medial habenular nucleus (MHN), and the dentate gyrus (DG). (d) A Nissl‐stained section adjacent to (b) showing the cytoarchitecture of the thalamic regions. It is not easy to identify the different thalamic nuclei in Nissl‐stained sections. In contrast, this is much easier in the CALB2 ISH section (b). Scale bar: 800 μm in (a) for all panels
PCW 21. In Nissl preparations, the major subdivisions of the amygdala can be identified (Figure 11a). In ISH sections, ETV1 is mostly expressed in the BL, while NRXN1, GRIK2, LMO4, and NRGN are expressed in the BM, BL, and La with various intensity in each subdivision (Figure 11c‐f). Strong GRIK2 and NRGN expression is also observed in the anterior cortical nucleus of the amygdala (CoA; Figure 11d and f). Gene expression patterns in other cerebral nuclei are similar to those at PCW 15 (see Figure 14).
3.7. Delineation of the thalamic and hypothalamic nuclei
Delineation of the thalamic nuclei at PCW 15 and 21 is mainly based on multiple region‐specific gene markers, such as CALB2 (Figures 14 and 15), CNTNAP2, PLXNA2, GRIK2, ETV1, NTRK2, ZIC1, and ENC1 (see Appendices 2 and 4) as well as AChE staining (Figure 16). CALB2 is expressed in many thalamic nuclei, including paraventricular (PaV), central medial (CeM), central lateral (CL), lateral dorsal (LD), ventral anterior (VA), ventral lateral (VL), reticular (R), subparafascicular (SPf), medial geniculate (MG), posterior intralaminar (PIL), limitans‐suprageniculate (LSG), and lateral posterior (LP) nuclei, as well as anterior nuclear complex (ANC; mainly AV and AM), pulvinar (Pul), and dorsal lateral geniculate nucleus (DLG) (Figure 14a‐c; 15a‐g). Strong expression of CNTNAP2 occurs in mediodorsal (MD), centromedian (CM), habenular (HN) nuclei, and DLG of the thalamus, and PLXNA2 expression in CM, parafascicular (Pf), and ventral posterior lateral (VPL) nuclei. In addition, ZIC1 is a reliable marker for ANC, PaV, DLG, LD, Pul and medial HN (MHN) while NRGN, SOX2, ZIC1, and ETV1 are strongly expressed in MHN (see Appendices 2 and 4). As shown in Figure 14b and d, gene expression patterns are more helpful in the delineation of the thalamic nuclei than Nissl. For instance, strong and weak CALB2 expression, respectively, in DLG and PG (VLG) allows an easy differentiation of the two structures (Figure 14b) whereas this is difficult in Nissl‐stained sections (Figure 14d). Interestingly, we observe a region that is the likely equivalent of the mouse PIL (Wang et al., 2020) in terms of its topographical relationship with adjoining regions and molecular signature. As in mouse, the PIL adjoins MG, SPf, posterior thalamic nucleus (Po), VPM, LSG, peripeduncular nucleus (PP), and pretectal nucleus (PTN) and has strong expression of CALB2, GRIK2, LHX2, NRGN, and NTRK2 (see Appendices 2 and 4). Finally, it should be mentioned that AChE is a useful marker for the identification of the MD at PCW 15 (Figure 16a) and 21 (Figure 16b and c) and of the ventral posterior medial nucleus (VPM) and its parvocellular part (VPMpc) at PCW21 (Figure 16c).
FIGURE 15.
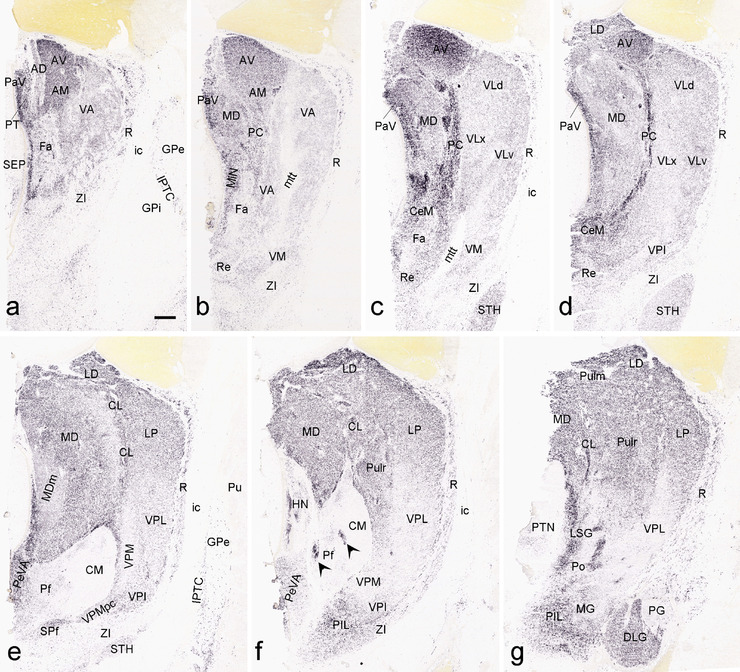
CALB2 expression in the thalamus at PCW 21. (a‐g) Sequential sections showing CALB2 expression in the anterior ventral (AV) and anteromedial (AM) thalamic nuclei, paraventricular nucleus (PaV), midline nuclear complex (MiN), ventral anterior nucleus (VA), ventral lateral nucleus (VL), centromedian nucleus (CeM), reuniens nucleus (Re), and paracentral nucleus (PC) (a‐d). Clear CALB2 expression is also seen in the mediodorsal nucleus (MD), ventromedial nucleus (VM), lateral dorsal nucleus (LD), central lateral nucleus (CL), habenular nucleus (HN), periventricular area (PeVA), subparafascicular nucleus (SPf), lateral posterior nucleus (LP), pulvinar (Pul), dorsal lateral geniculate nucleus (DLG), and limitans/suprageniculate nuclei (LSG) (c‐g). In contrast, faint CALB2 expression is observed in ventral posterior lateral (VPL), ventral posterior medial (VPM), parafascicular nucleus (Pf), central medial nucleus (CM), pregeniculate nucleus (PG), and zona incerta (ZI) (e‐f). Note the CALB2 expression in the patches within Pf/CM (f). Note also the CALB2 expression in the subthalamic nucleus (STH; c‐e) and interpallidal transient cell zone (IPTC; a). Strong CALB2 expression is also found in a region that appears to be equivalent to mouse posterior intralaminar nucleus (PIL). Scale bar: 800 μm in (a) for all panels
FIGURE 16.
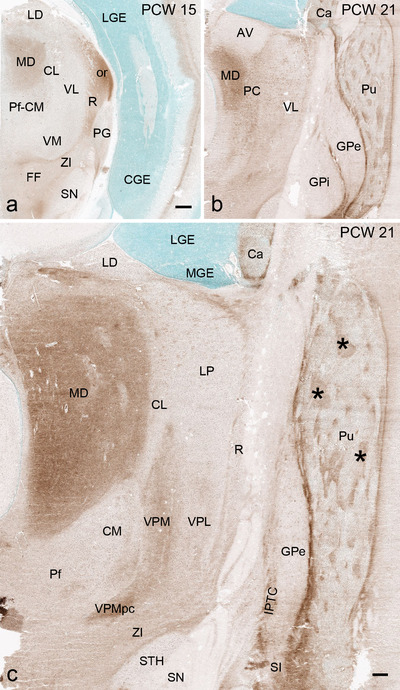
AChE staining patterns in the thalamus and basal ganglia. (a) AChE staining showing its enriched expression in the mediodorsal thalamic nucleus (MD) and some fiber regions such as optic radiation (or) at PCW 15. (b,c) AChE staining showing its enriched expression in the MD and two subdivisions of ventroposterior medial nucleus (VPM and VPMpc) as well as in the patches (*) of the putamen (Pu), substantia innominata (SI), and some fiber regions such as interpallidal transient cell zone (IPTC). Scale bars: 800 μm in (a) for (a‐b); 400 μm in (c)
Genes with regional expression in hypothalamus at PCW 15 and 21 includes CALB2, which has strong expression in the ventromedial nucleus (VMH), perifascicular nucleus (PeF), and posterior hypothalamic nucleus (PHN) (Figure 14a and b), and SST, which is expressed in the dorsomedial nucleus (DMH), paraventricular nucleus (PV), and lateral hypothalamic region (LH) (see Appendices 2 and 4). Other genes with region‐specific expression include GRIK2 in DMH; DLX1 in anterior hypothalamic nucleus (AHN); ZIC1 in suprachiasmatic nucleus (SCN) and PeF; FOXG1 in medial preoptic nucleus (MPN); LMO4 and RELN in the PV; NKX2.1, CDH4, and NTRK2 in VMH, and NRXN1 in PHN and arcuate nucleus (Arc) (see Appendices 2 and 4).
3.8. Delineation of cerebellum and major brainstem structures
Cerebellar cortex at PCW 15 displays an immature shape with clear and thick external granular layer (EGL) and upper rhombic lip (URL) superficially, while deep cerebellar nuclei (CbDN) have formed in the center of the cerebellum (Figure 17a‐j). The EGL has strong expression of PAX6 (Figure 17b and c) and ZIC1 while ERBB4 and GRIK2 are mainly expressed underneath the EGL (Figure 17h). The URL contains strong ZIC1 and TBR2 expression (Figure 17j). CbDN shows strong expression of GAP43, CALB2, NRNX1, ERBB4 in the fastigial (Fas), interpositus (InP), and dentate (DT) nuclei (Figure 17e‐h), while GRIK2 is mainly expressed in DT (Figure 17i). These results are consistent with patterns observed in the mouse (e.g., Figure 17n‐q). It should be noted that RELN is not expressed in CbDN but present in surrounding cerebellar regions (Figure 18e and f). In addition, some genes are mostly expressed in EGL of the vermis (e.g., SST) while others are strongly expressed in transient Purkinje cell clusters (TPC) (e.g., CNTNAP2 and NRXN1; see Appendix 2).
FIGURE 17.
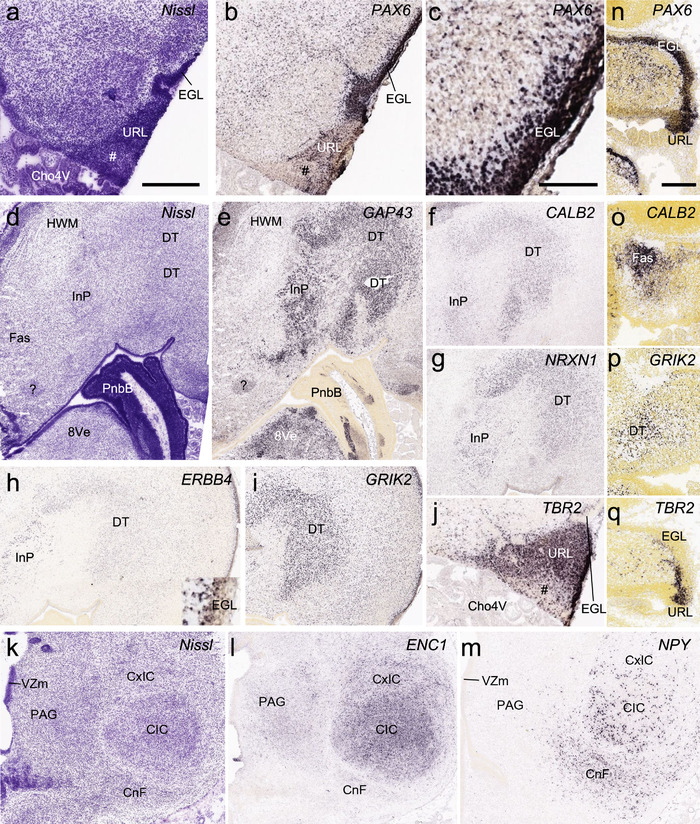
Cytoarchitecture and gene expression of the cerebellum and inferior colliculus. (a‐l) From human brain at PCW 15; (n‐q) from mouse brain at E15.5. (a) A Nissl‐stain section showing the cytoarchitecture of the upper rhombic lip (URL) and external granular layer (EGL). This sectioning level is at about the level 40 of the atlas plates (see Appendix 1). (b, c) Low (b) and higher (c) power views of the PAX6 expression in EGL. (d) A Nissl‐stain section showing the cytoarchitecture of the cerebellar deep nuclei (CbDN), which include fastigial nucleus (Fas), interpositus nucleus (InP), and dentate nucleus (DT), and the pontobulbar body (PnbB), which is located at the junction of the cerebellum and pons. (e‐i) Expression of GAP43 (e), CALB2 (f), NRXN1 (g), ERBB4 (h), and GRIK2 (i) in the CbDN. Note that ERBB4 and GRIK2 are also strongly expressed in the region underneath the EGL (h, i). The inset in (h) is a higher power view of the EGL. (j) TBR2 expression in the URL. The URL appears to have two parts with the less TBR2 expression part indicated by #. (K) A Nissl‐stain section showing the cytoarchitecture of inferior colliculus (IC) and periaqueduct gray (PAG). (l, m) Expression of ENC1 (l) and NPY (m) in the IC regions. (n‐q) Comparative expression of PAX6 (n), CALB2 (o), GRIK2 (p), and TBR2 (q) in the cerebellum at E15.5 (on sagittal sections). Scale bars: 400 μm in (a) for (a‐m; except c); 100 μm in (c); 220 μm in (n) for (n‐q)
FIGURE 18.
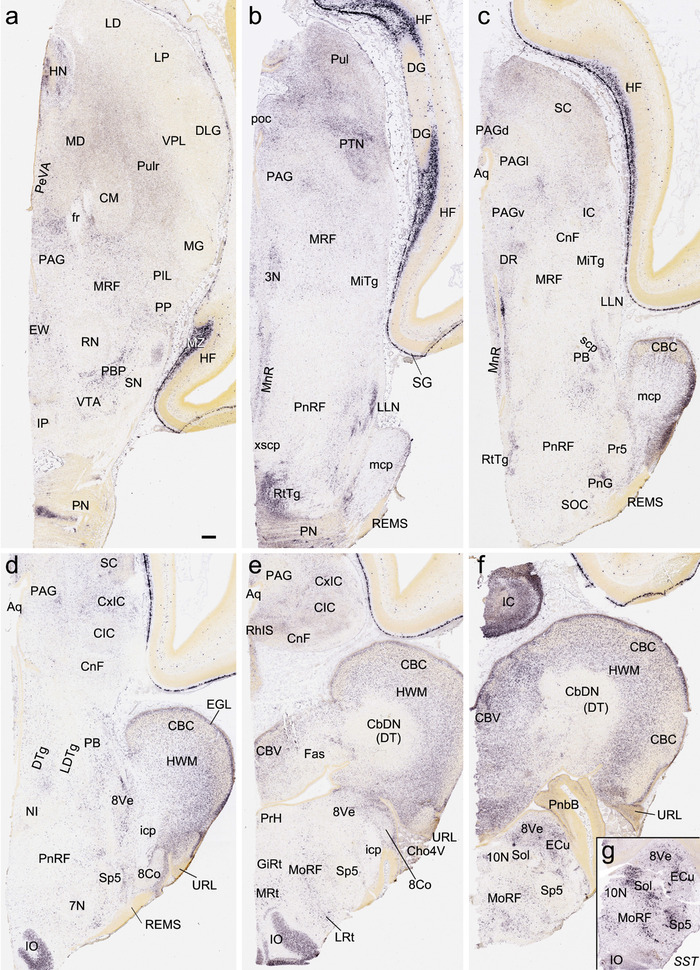
Gene expression in the brainstem and cerebellum at PCW 15. (a‐f) RELN expression in brainstem nuclei and cerebellar cortex (CBC). Note the negative expression in cerebellar deep nuclei (CbDN) and strong expression in the hindbrain white matter (HWM). Note also the strong RELN expression in marginal zone (MZ in a) of the hippocampus and subpial granular zone (SG in b) of the cortex. (g) SST expression in the medullar nuclei. Scale bars: 400 μm in (a) for all panels. Abbreviations: 3N, oculomotor nucleus; 7N, facial nucleus; 8Co, cochlear nucleus; 8Ve, vestibular nucleus; 10N, vagal nucleus; Aq, aqueduct; CBV, cerebellar vermis; Cho4V, choroid plexus of fourth ventricle; CM, centromedian nucleus; CnF, cuneiform nucleus; CxIC, cortex of inferior colliculus; DR, dorsal raphe nucleus; DTg, dorsal tegmental nucleus; ECu, external cuneate nucleus; EW, Edinger–Westphal nucleus; GiRt, gigantocellular reticular nucleus; HN, habenular nucleus; icp, inferior cerebellar peduncle; IO, inferior olive; IP, interpeduncular nucleus; LDTg, dorsolateral tegmental nucleus; LLN, nucleus of lateral lemniscus; LP, lateroposterior nucleus; LRt, lateral reticular nucleus; mcp, middle cerebellar peduncle; MiTg, microcellular tegmental nucleus; MnR, median raphe nucleus; MoRF, medullar reticular formation; MRF, midbrain reticular formation; MRt, medial reticular nucleus; NI, nucleus incertus; PB, parabrachial nucleus; PBP, parabrachial pigmented nucleus; PeVA, periventricular area; PIL, posterior intralaminar nucleus; PN, pontine nucleus; PnG, pontine gamma nucleus; PnRF, pontine reticular formation; poc, posterior commissure; PP, peripeduncular nucleus; Pr5, principal sensory nucleus of the trigeminal nerve; PrH, prepositus hypoglossal nucleus; PTN, pretectal nucleus; Pulr, rostral pulvinar; REMS, rostral extramural migration system; RhIS, rhombencephalic isthmus; RN, red nucleus; RtTg, reticular tegmental nucleus; scp, superior cerebellar peduncle; SN, substantia nigra; SOC, superior olivary complex; Sol, solitary nucleus; Sp5, spinal trigeminal nucleus; VPL, ventroposterior lateral nucleus; xscp, decussation of superior cerebellar peduncle
In the midbrain, a rough lamination in the superior colliculus (SC) has formed at PCW15 with FOXP1 and VIM expressed in the inferior gray layer (InG). VIM is also expressed in the periaqueductal gray region (PAG) (see Appendix 2). In the inferior colliculus (IC), central IC nucleus (Figure 17k) has strong expression of ENC1 (Figure 17l), NRGN, and NPY, the latter being also strongly expressed in the cuneiform nucleus (CnF; Figure 17m). The cortical (or external) IC (CxIC) displays expression of RELN (Figure 18c‐e). The red nucleus (RN) shows strong expression of CNTNAP2, GRIK2, and NTRK2, while the substantia nigra (SN) strongly expresses ENC1 and FABP7. In addition, the parabrachial pigmented nucleus (PBP) located between RN and SN has strong RELN expression (Figure 18a). RELN is also strongly expressed in the median raphe nucleus (MnR) and the oculomotor nucleus (3N) (Figure 18b and c). In the lower brainstem (pons and medulla), ZIC1, RELN, and SST are strongly expressed in the vestibular nuclei (8Ve) and external cuneate nucleus (ECu) (Figure 18f and g) while ENC1, ETV1, FOXP1, and PLXNA2 (see Appendix 2) are expressed strongly in the inferior olive (IO). RELN is strongly expressed in the reticulotegmental nucleus (RtTg), lateral lemniscus nucleus (LLN), IO, and medullary reticular formation (MoRF) (Figure 18b, d, e, and f). VIM expression is found in 3N, Edinger‐Westphal nucleus (EW), and abducens nucleus (6N) (see Appendix 2). Finally, the pretectal nuclear complex (PTN) contains strong expression of RELN (Figure 18b), FABP7, and NPY (see Appendix 2).
3.9. Delineation of the ganglionic eminence subdivisions
The GE mainly consists of three major parts, MGE, LGE, and CGE (Hansen et al., 2013; Ma et al., 2013). In this study, the boundary between GE and adjoining cortical regions can be clearly identified with the gene markers TBR2 and DLX2 or DLX1. TBR2 (i.e., EOMES) reveals no expression in GE but strong expression in cortical regions, while the reverse pattern is seen for DLX2 and DLX1 (Figure 19a, b, g, and h). Complementary expression patterns of NKX2‐1 and ERBB4 are observed in MGE and LGE, making it easy to distinguish them (Figure 19d and e). The border between LGE and CGE is not sharp but CGE has much stronger expression of CALB2 than LGE (Figure 14b), and the reverse patterns occurs for ERBB4 (CGE < LGE; Figure 20a‐c). Therefore, in this study, the LGE‐CGE border was placed based on complementary expression of CALB2 and ERBB4. This border has been shown previously on the basis of COUP‐TFII expression (Alzu'bi, Lindsay, Harkin et al., 2017; Reinchisi et al., 2012), and we find that the pattern of CALB2 is similar to that of COUP‐TFII. The sulcus located between the striatum (GE) and the cortex, termed here striatal‐cortical sulcus (SCS; indicated by arrows in Figure 19a‐c, g‐i), does not appear to be a reliable landmark for the striatal‐cortical border. As shown in Figure 19, the NTRK2‐enriched striatal‐cortical boundary (SCB, or subpallial–pallial or pallial–subpallial boundary, see Carney et al., 2009; Puelles et al., 2000; Figure 19c and i) is located at the striatal side at PCW 15 (Figure 19a‐c), while at PCW 21 it is at the cortical side (Figure 19g‐i). Also, the SCB is enriched with CALB2, DLX2, ERBB4, PAX6, and DLX1 (Figure 19b, e, f, and h).
FIGURE 19.
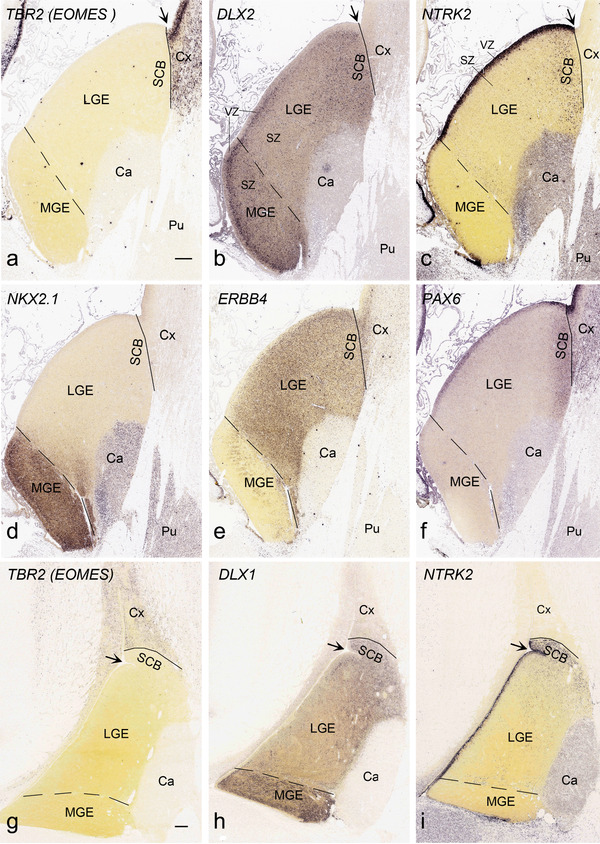
Identification of lateral and medial ganglionic eminence (LGE and MGE) and striatal‐cortical border (SCB). Solid and dashed lines indicate the striatal‐cortical border and MGE‐LGE border, respectively. VZ and SZ are ventricular and subventricular zones of the GE, respectively. (a‐f) Gene expression in the GE and neocortex at PCW 15. TBR2 (a) and DLX2 (b) is expressed in the SZ/VZ of the cortex (Cx) and GE (LGE and MGE), respectively. NTRK2 (c) and PAX6 (f) are mostly expressed in the VZ of the LGE and SCB. NKX2.1 (d) and ERBB4 (e) are mainly expressed in SZ/VZ of MGE and LGE, respectively. Note DLX2 and ERBB4 expression also exists in SCB. (g‐i) Gene expression in the GE and neocortex at PCW 21. Expression patterns of TBR2 (g), DLX1 (h), NTRK2 (i), as well as DLX2, NKX2.1, ERBB4, and PAX6 (not shown) are similar to those at PCW 15. Surprisingly, the striatal‐cortical sulcus (SCS, indicated by arrows) is not a reliable landmark for the striatal‐cortical border. Thus, the SCB, as marked by rich NTRK2 expression, is located at the striatal side at PCW 15 (c), while at PCW 21 it is located at the cortical side (i). Scale bars: 400 μm in (a) for (a‐f); 400 μm in (g) for (g‐i)
FIGURE 20.
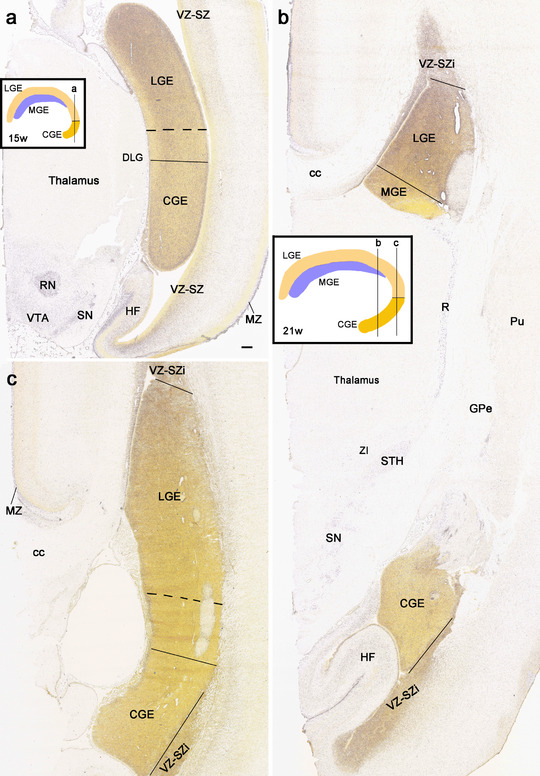
Determination of the border between lateral and caudal ganglionic eminence (LGE and CGE). The diagrams in the insets in (a) and (b) show the locations of the sections displayed in (a) and (b, c), respectively. In general, LGE shows much stronger expression of ERBB4 than CGE at both PCW 15 (a) and 21 (b, c). However, the border is not clear‐cut since the expression displays clear gradient. The transition zone between the LGE and CGE is identified between the solid and dashed lines based on the expression of ERBB4 (a, c) and CALB2 (much stronger in CGE than in LGE; see Figure 14b). In this study, the LGE‐CGE border is placed at the solid lines (a, c) to be conservative for the CGE. Note the ERBB4 expression in the red nucleus (RN in a), substantia nigra (SN in a, b), and ventral tegmental area (VTA in a) of the midbrain, and in the reticular thalamic nucleus (R), subthalamic nucleus (STH), and zona incerta (ZI) of the thalamus (b). ERBB4 is also expressed in the marginal zone (MZ) and ventricular‐subventricular zone (VZ‐SZ or VZ‐SZi) of the cortex (a‐c). Scale bar: 400 μm in (a) for (a‐c)
In general, gene expression in the GE of the prenatal human brains is heterogenous with some gene expression in different zones within the GE. In MGE, for instance, distinct gene expression between its VZ or inner part and SZ or outer part and among different regions of the SZ is observed. Specifically, some genes are expressed in both VZ and SZ (e.g., NES, VIM, and NKX2‐1, see Figure 19d) with others exclusively or dominantly in SZ (e.g., DCX, DLX5, DLX1, and DLX2; see Figure 19b and h) or VZ (e.g., VIM, NTRK2, and PAX6; see Figure 19c, f, and i). In LGE, heterogenous gene expression in its VZ and SZ is also observed for genes such as FABP7, DLX2, NTRK2, ERBB4, and DLX1 (Figure 19b, c, e, h, and I, and 20a–c). Within the SZ of both LGE and MGE, region‐dominant or complementary gene expression is visible, with stronger expression of DCX, DLX1, and DLX5 in the inner portion of the SZ than in the outer portion and a reverse expression pattern for ERBB4, NES, and VIM (see Appendix 2).
3.10. Gene expression in olfactory bulb and anterior olfactory nucleus
At PCW 15, the olfactory bulb (OB) has obvious but immature lamination. From its outer to inner aspects, these layers include olfactory nerve (ON), glomerulus (GL), mitral cell (MC), and granular cell (GC), SZ, and VZ (Figure 21a‐p). An incipient external plexus layer (ep) is also observed between GL and MC but the internal plexus layer is not well defined. A number of genes show a strong expression in GL (VIM, NTRK2, FADS2, SOX10, and LMO4), MC (TBR2, GRIK2, LBX1, NTRK2, RELN, TBR1, LHX2, GAP43, DCX, DLX1, DLX5, NES, SYNGAP1, MECP2, SHANK3, FEZF2, CNTNAP2, GFAP, CDH4, and LMO4), GC (DCX, FEZF2, LBX1, DLX1, SHANK3, CNTNAP2, and LHX2), SZ (CALB2, DCX, PAX6, and ZIC1), and VZ (VIM, TBR2, PAX6, FABP7, LHX2, FADS2, FOXG1, LBX1, ZIC1, ETV1, and CDH4). The SZ and VZ is part of the proliferative rostral migratory system (RMS). Note that the dorsal but not ventral walls of the VZ in the RMS strongly expresses TBR2 (Figure 21p). Interestingly, in addition to the OB lamination there exist patches within the OB (marked with # in Figure 21) that are positive for ENC1, GRIK2, LBX1, TBR1, LHX2, MECP2, CDH4, FEZF2, DCX, LMO4, PLXNA2, NKX2.1, FADS2, and GAP43, and negative for TBR2, RELN, CALB2, PAX6, ZIC1, and DLX1 (Figure 21).
FIGURE 21.
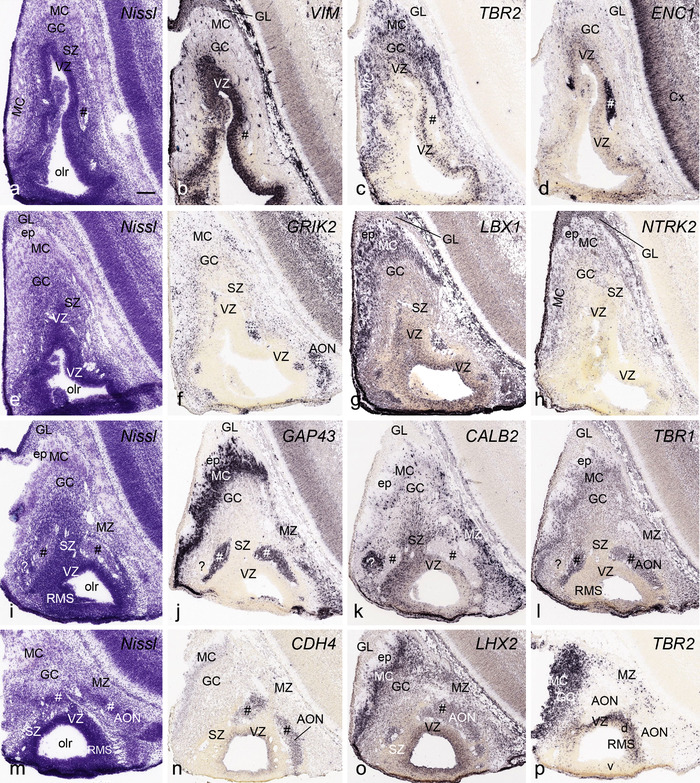
Cytoarchitecture and gene expression of olfactory bulb (OB) and anterior olfactory nucleus (AON) at PCW 15. The sections were shown from one rostral level (a‐d), two intermediate levels (e‐h and i‐l), and one caudal level (m‐p) with different stains indicated on each panel. OB, rostral migratory stream (RMS) and AON can be identified at PCW15. Some patches in OB and AON (identified by #) express ENC1, GRIK2, LBX1, GAP43, TBR1, CDH4, and LHX2 but not CALB2. Note that the dorsal but not ventral walls of the VZ of RMS strongly expresses TBR2 (panel p) whereas the whole VZ of RMS contains strong expression of VIM, LBX1, and LHX2. One patch (? in i‐l) in AON appears to have a very different expression profile. MC, mitral cells; GC, granular cells; GL, glomerular layer; ep, external plexus layer; olr, olfactory recess. Bar: 200 μm in (a) for all panels
The anterior olfactory nucleus (AON) is featured by strong expression of ENC1, GRIK2, LBX1, GAP43, TBR1, CDH4, LHX2, and MECP2 (Figure 21f, g, j, l, n, and o). The AON shows no expression of PLXNA2, LMO4, TBR2, CALB2, and RELN (e.g., Figures 21k and p). Small patches are often seen in OB that have a pattern similar to that of the AON (e.g., Figure 21c‐g). The gene expression patterns observed in OB and AON at PCW 15 are comparable to those at PCW 21 (Figure 22).
FIGURE 22.
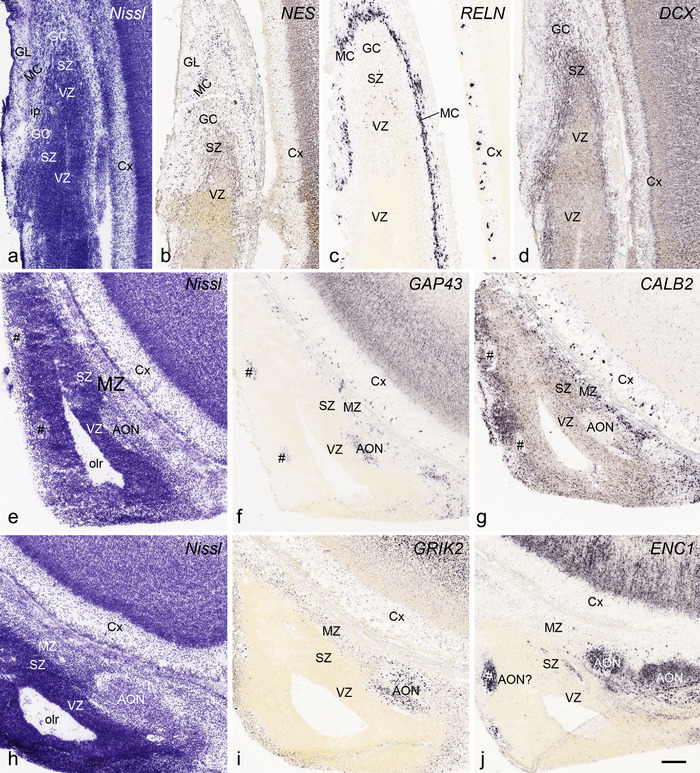
Cytoarchitecture and gene expression of olfactory bulb (OB) and anterior olfactory nucleus (AON) at PCW 21. The sections were shown from rostral (a‐c), intermediate (d‐g), and caudal (h‐j) levels with different stains indicated on each panel. The layers of OB and internal plexus layer (ip) can be clearly identified at PCW 21. As at PCW15, AON strongly expresses GAP43, GRIK2, and ENC1 but negative for CALB2. Note the scattered patches (#s in e‐g) which express marker genes for AON (e.g., GAP43 and ENC1). Scale bar: 200 μm in (j) for all panels
3.11. Brain‐wide detailed anatomical and molecular atlases for prenatal human brains
Based on combined analysis of Nissl and AChE histology as well as laminar and regional gene expression patterns described above, anatomical boundaries of different cortical regions and subcortical nuclei can be accurately delineated on Nissl‐stained sections. In this study, 46 and 81 selected Nissl‐stained sequential coronal sections at PCW 15 and 21, respectively, were annotated in detail to generate two brain‐wide anatomical atlases. The anatomical atlases for the brains at PCW 15 and 21 are presented in Appendices 1 and 3, respectively, with online links to high‐resolution images. In these atlases, all cortical layers and many subcortical structures and their subdivisions are accurately demarcated based on cytoarchitecture and gene expression patterns. Furthermore, allocortex (HF and olfactory cortex), periallocortex (MTC and Iag), and their subdivisions are annotated. However, for neocortex only major cortical regions (e.g., frontal, parietal, temporal, occipital, and insular cortices) could be roughly identified at PCW 15 as molecular makers did not reveal detailed regional patterns at this age although more detailed cortical segmentation could be generated for the brain at PCW 21. Finally, using the anatomical atlases as a guide, we have also annotated spatial expression of 37 and 5 genes from the brains at PCW 15 and 21, producing two brain‐wide molecular atlases, which are presented in Appendices 2 and 4, with online links to high‐resolution images. Although the expression of 38 genes from the brain at PCW 21 was not annotated the online links to their sequential high‐resolution ISH images are presented in Appendix 4. Therefore, spatial mapping of these genes can be achieved by users using the detailed anatomical atlas (Appendix 3) as a guide, the ISH data and Nissl‐stained sections used for the anatomical atlas being derived from the same brain hemisphere.
3.12. Highly interactive digital atlases for web users
The prenatal brain atlases presented in this study were used to make interactive digital resources (Figure 23), and are publicly accessible through the Allen Institute web portal: www.brain‐map.org or directly at the BrainSpan project portal: www.brainspan.org/static/atlas. The atlases may be of interest to diverse groups including students and educators as resources of detailed anatomy of the prenatal human brains. For basic anatomy, the location, shape, and relationship of general structures such as forebrain, midbrain, and hindbrain, as well as cerebral cortex, thalamus, hypothalamus, amygdala, hippocampus, cerebellum, and brainstem, can be easily elucidated simply by using the ontology tree (Figure 23, left column). For medical students and neuroscience professionals, deeper systematic learning and teaching of human brain development can be conveniently achieved via the menu and different tools (Figure 23, inset, thumbnails and right column). In particular, one can search or choose any specific brain region and learn its topographic location, subdivisions, cyto‐, and chemoarchitectures. One can also choose specific A‐P levels and study which structures occurs on these planes. As needs dictate, structures can be recolorized prior to printing plates using the menu (Figure 23, inset). The ontology itself serves as an essentially complete index of brain structures and their relationships (Figure 23, left column; Table 1).
FIGURE 23.
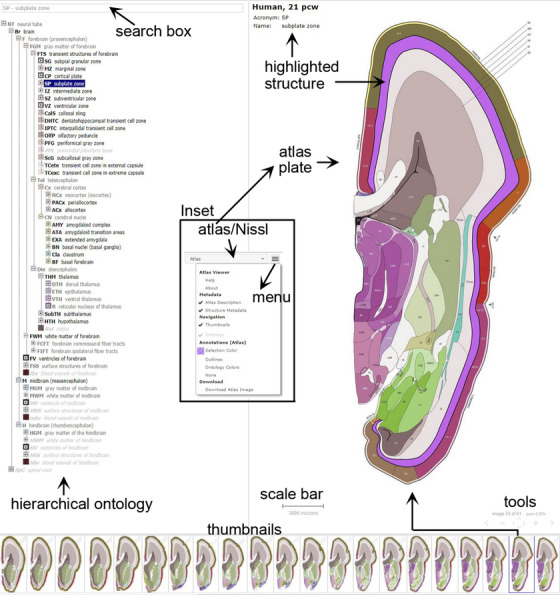
Interactive web‐based digital atlases for prenatal human brains at PCW 15 and 21. Tools are provided to explore, search, adjust, and download the atlas plates and related structures. These tools include a hierarchical ontology browser and search box (left column), thumbnails (bottom), segmented atlas plates (right column), and atlas menu (Inset), which is placed at the top right corner of the browser and can be used to toggle between Nissl and annotated plates as well as many other functions
4. DISCUSSION
Anatomical atlases are essential resources as for the research community, providing a detailed mapping and synthesis of knowledge about brain structure and function. Although detailed modern high‐resolution human brain atlases are available for adult brains (Ding et al., 2016; Mai et al., 2016), similar atlases for prenatal human brain have not been produced. To our knowledge, only one series of anatomical prenatal human brain atlases is available, generated on limited Nissl‐stained sections from different prenatal ages (Bayer & Altman, 2003, 2005, 2006). In addition, anatomical delineation in these developmental brain atlases was based only on cytoarchitecture (Nissl staining), and annotation was not complete enough to create a brain‐wide hierarchical structural ontology. In the present study, we have created detailed anatomical atlases for prenatal human brain at PCW 15 and 21, aiming to advance the state of the field through dense whole‐brain sampling, high information content histological and gene expression analysis, developmental ontology creation, and generation of web‐based interactive tools. This reference atlas was used to guide a large‐scale microarray‐based transcriptomic project, available as a complementary developmental gene expression resource (Miller et al., 2014; https://www.brainspan.org/lcm/search/index.html; see Table 1 for the regions with transcriptomic data). Thus, these atlases should be valuable tools to guide newer efforts to map cell types and developing circuitry in the developing human brain, both as anatomical and gene expression resources.
A major design principle of the atlas was to use highly informative histological and gene expression datasets from the same brain specimen to guide anatomical demarcation across the entire brain at PCW 15 and 21. As demonstrated above, the combined analysis of Nissl‐based cytoarchitecture, AChE staining features, and spatial expression patterns of 43 genes by ISH allowed an accurate delineation of brain structures. This information was used to annotate Nissl‐stained sections, but also to annotate the gene expression images and illustrate the high utility of individual genes as markers of developing brain structures. Together, these atlases provide a reference for midgestational human brain development and can be used to annotate other timepoints in this period. For example, we used the anatomical atlas for the brain at PCW 15 (Appendix 1) to guide a dense transcriptomic atlas of the PCW 16 brain, which was effective due to its similar cortical lamination and subcortical structures (see Miller et al., 2014). The anatomical atlas for the brain at PCW 21 (Appendix 3) was similarly created and could be applied to the human brains at ages close to PCW 21 (e.g., PCW 19–24). With guidance of these anatomical atlases, spatial expression of 37 and 5 genes was annotated to generate two brain‐wide molecular atlases, which are presented in Appendices 2 and 4, respectively.
In general, this study reveals many developmental features of human brain structures that are similar to rodent as well as some human‐specific or dominant developmental features. Many of the latter features have been reviewed in detail recently (e.g., Kostović et al., 2019; Molnár et al., 2019), including thick SP, very thick SZo (enriched with intermediate progenitor cells), large extent of SP8 and COUP‐TFI expression overlap in the VZ, and an extended period of interneuronal generation and migration from the GE into the cerebral cortex in human compared to mouse. In addition, some migratory routes of interneurons were reported in human but not in mouse (Alzu'bi, Lindsay, Kerwin et al., 2017; Alzu'bi & Clowry, 2019; Paredes et al., 2016; Rubin et al. 2010). In this study, we have observed additional human features not observed in other species. In addition to typical scattered expression in the SP, for instance, strong expression of NPY is found in the CP of the V1 at PCW 21 (Figure 5e). This was not reported in mouse (e.g., Thompson et al., 2014) and monkey (Bakken et al., 2016). Another example is the existence of CALB2 positive patches within the Pf‐CM (Figure 15f), which were also not found in monkey and mouse (data available in the Allen Brain Atlas). The third example is that strong CALB2 expression is seen in the DLG at PCW 15 and 21 (e.g., Appendix 2) but not in mouse DLG at all prenatal stages (Allen datasets). In postnatal mice, CALB2 expression in the DLG was only observed at P14 (Allen datasets). Finally, it should be point out that the DLG at both PCW 15 and 21 is not yet laminated as in adult and, thus, the two subdivisions (magnocellular and parvocellular parts) of the DLG are not visible at these two stages (see Appendices 1 and 3).
Several interesting developmental features of prenatal human brain also emerged from our analysis. First, we found that the prenatal HF and EC lack the outer subventricular zone (SZo) that is prominent in developing human neocortex and thought to drive the differential expansion of supragranular layers in primate evolution. The SZo is the major site of supragranular neuron production in the macaque monkey neocortex (Lukaszewicz et al., 2005), and is also present (albeit smaller) in rodents, where common gene expression in SZo and supragranular neurons suggests they are generated from SZo (Nieto et al., 2004; Tarabykin et al., 2001; Zimmer et al., 2004). The thicker SZo in human compared to mouse is also consistent with single‐cell transcriptomic findings of increased number, diversity, and phenotypic specialization of supragranular neurons (Berg et al., 2021; Ortega et al., 2018). Histologically, the HF and EC obviously lack equivalent supragranular neurons in layers 2 and 3 of the neocortex (Bakken et al., 2016; Ding et al., 2009; Ding & van Hoesen, 2015). While layers 2 and 3 exist in the EC, the neurons in these two layers are not equivalent to those in the neocortex. For example, layer 2 neurons in the neocortex are very small round and ovoid neurons, while those in the EC are usually very large stellate or pyramidal neurons (Braak & Braak, 1991; Ding et al., 2009; Ding & van Hoesen, 2010). Gene expression and connectivity patterns of layers 2 and 3 in the HF and EC are also different from the neocortex (e.g., Bakken et al., 2016; Ding et al., 2020; Yao et al., 2021). Pathologically, layer 2 neurons in the EC are among the earliest neurons with tau lesions in aging and Alzheimer's disease (AD) populations (Arnold et al., 1991; Braak & Braak, 1991; Ding & van Hoesen, 2010). However, this is not true for layers 2 and 3 neurons in the neocortex, which are affected at later stages of AD (Arnold et al., 1991; Braak & Braak, 1991). Therefore, our findings suggest that layers 2 and 3 neurons in the PrS, PaS, and EC are not likely produced from SZo and instead may directly originate from the SZi. As a previous study suggested, the hippocampal neurons are generated in the VZ while MTC neurons are generated in the VZ and SZ (SZi) with the latter generating the superficial neurons located in lamina principalis externa (Nowakowski & Rakic, 1981).
We found evidence for compartmentalization of the GE in developing human cortex, similar to multiple progenitor domains that have been reported in mouse GE (Flames et al., 2007). In addition to the three well‐known subdivisions of the GE (MGE, LGE, CGE), each subdivision can be further divided into VZ and SZ parts that continue at the SCB with cortical VZ and SZ, respectively. The VZ and SZ of the GE displayed differential gene expression within each GE subdivision, and cross over between GE subdivisions (Figure 19). Moreover, complex gene expression patterns within the VZ and SZ of specific GE subdivisions in human were also clearly evident. For example, NTRK2 is predominantly expressed in the VZ of CGE and LGE; furthermore, within the LGE, NTRK2 expression in the VZ is generally stronger in lateral LGE (and SCB) than in medial LGE (see Appendix 2). Gene expression in the SZ of LGE is also not homogeneous. For instance, FABP7 expression in the SZ of the LGE is stronger in lateral than medial parts (see Appendix 2), while NKX2.1 expression is seen in the most medial but not lateral parts of the SZ in addition to strong expression in MGE. Interestingly, ERBB4 expression displays both A‐P and M‐L difference in the SZ of the LGE. Specifically, ERBB4 is much more strongly expressed in the SZ of the laterocaudal part of the LGE (including SCB) compared to the mediorostral part (see Appendix 2). Finally, SST, NPY, VIM, FABP7, and ERBB4 expression is also compartmentalized in MGE (see Appendix 2). These observations likely represent a combination of parcellation of progenitor zones and developmental gradients across the GE.
ERBB4 expression in the GE is significantly different between human and rodents. Previous studies in rat and mouse reported that ERBB4 is mostly expressed in the SZ of MGE (i.e., not in LGE and CGE) (Fox & Kornblum, 2005; Yau et al., 2003). Rodent ERBB4 is mainly expressed in MGE‐derived GABAergic interneurons migrating to the cerebral cortex, and this expression was reported to be important in this tangential migration (Li et al., 2012; Rakić et al., 2015; Villar‐Cerviño et al., 2015). In contrast, we found in human that ERBB4 is strikingly enriched in LGE rather than MGE. This raises the possibility that human LGE generates cortical interneurons that express ERBB4 and migrate tangentially through the SZ and VZ (see Appendix 2). Alternatively, this may simply reflect a species difference in ERBB4 expression such that OB‐bound interneurons from the LGE now express ERBB4, or that ERBB4‐expressing interneurons are mostly generated in MGE as in rodents, but they are immediately channeled to LGE in human. In any event, these findings in human suggest that there may be significant differences in MGE and LGE across species, and that at a minimum ERBB4 expression and function are not conserved across species.
Another interesting observation was that markers of both cortical and striatal progenitors extend into the RMS. In mouse, the RMS is a pathway mostly consisting of interneurons migrating from LGE and SCB to OB (e.g., Bandler et al., 2017; Kohwi et al., 2005). Glutamatergic neurons also migrate in the RMS, but the source of these neurons has not been clear. In mice, these excitatory neurons derive from NGN2‐expressing progenitors (Winpenny et al., 2011), and excitatory lineage markers NGN2, PAX6, and TBR2 are all expressed in the dorsal wall of the RMS (RMS‐d) but also in the SCB region. TBR2, strongly expressed in developing cortical VZ and SZ, is a marker for excitatory neuronal precursors (Englund et al, 2005; Hevner, 2019). Here, we found that TBR2 is strongly expressed in the developing cortical VZ and SZ and in the RMS‐d (Figure 21p), but not the SCB region (Figure 19a and g). These findings suggest that the TBR2‐expressing VZ and SZ of the neocortex extends rostrally into the OB via the RMS‐d, and that excitatory neurons in OB likely originate from the ventral cortical wall rather than from the subpallial–pallial region or SCB region, both during development (this study) and into adulthood (Brill et al., 2009).
Single‐cell genomic profiling has become a powerful tool to define cell types (BICCN, 2020; Hodge et al., 2019; Yao et al., 2021) and developmental trajectories, and has begun to be applied in prenatal human brain development (Eze et al., 2021; Fan et al., 2020; Nowakowski et al., 2017). Whole‐brain anatomical and molecular atlases, such as those presented here, are important resources to help guide these new cell census efforts and other high‐throughput anatomical and connectional efforts in the future. The joint analysis of histology and molecular parcellation creates a needed framework for establishing the cellular and spatial basis of brain development and circuit formation, and a structured ontological framework for defining brain structures across development to adulthood.
CONFLICT OF INTEREST
The authors declare that there are no potential sources of conflict of interest.
AUTHOR CONTRIBUTION
SLD and ESL designed the atlas project; SLD generated the anatomical ontology, analyzed histological, and gene expression data and delineated all anatomical boundaries and spatial gene expression. JJR, PL, and BACF performed atlas cartography; KAS led the ISH experiment; IAG, SLD, and ND contributed to specimen processing; TAD, NHK, FL, AS, and LN performed web visualization and application; KB, RAD, AE, TAL, JN, JP, RR, MS, and NVS provided technical support; YW, SLD, JJR, PL, and BACF prepared appendix figures; SLD prepared the figures for the main text; SMS managed the project; AB managed and led the histological pipeline and team; JWP, JGH, ARJ, MJH, PRH, AB, and ESL provided overall supervision. ESL and MJH procured the NIH grant; SLD and ESL wrote the manuscript; all authors had full access to all the data and read the manuscript.
PATIENT CONSENT STATEMENT
Appropriate written informed consent was obtained and all available nonidentifying information was recorded for each specimen.
PERMISSION TO REPRODUCE MATERIAL FROM OTHER SOURCES
We did not reproduce material from other sources.
PEER REVIEW
The peer review history for this article is available at https://publons.com/publon/10.1002/cne.25243.
ACKNOWLEDGMENTS
We thank the Allen Institute founders, P.G. Allen, and J. Allen, for their vision, encouragement, and support. We are also grateful for the technical support of the staff members in the Allen Institute who are not part of the authorship of this article. The project described was supported by award numbers RC2MH089921 to ESL and MJH from the National Institute of Mental Health. Its contents are solely the responsibility of the authors and do not necessarily represent the official views of the National Institutes of Health and the National Institute of Mental Health.
APPENDIX 1 1. Anatomical atlas plates for the prenatal human brain at PCW 15
1.1.
Forty‐six plates with matching histological (Nissl‐ or AChE‐stained) sections are displayed in anterior‐to‐posterior (A‐P) order. The A‐P positions of 46 atlas plates (levels 1–46) and the locations of the two slabs as well as the codes for A‐P levels, stains, slabs, and the section number in each slab are indicated in the Inset on top of the first page of the atlas plates. For example, Level 1 (01−015) represents the 15th section of the slab 1, which is atlas plate 1 (i.e., Level 1), and AChE‐01‐054 represents the 54th section of the slab 1, which is AChE‐stained and adjacent to plate 2 [Level 2 (01‐053)]. The parcellation and subdivisions of different brain regions as well as the parent–daughter relationship and abbreviation of each structure are detailed in Table 1 (for transient structures) and in our adult human brain atlas (Ding et al., 2016; for permanent structures). Note that all annotated brain structures and their abbreviation in this atlas can be searched in the interactive window of the online version of this atlas (www.brainspan.org or http://brainspan.org/static/atlas).
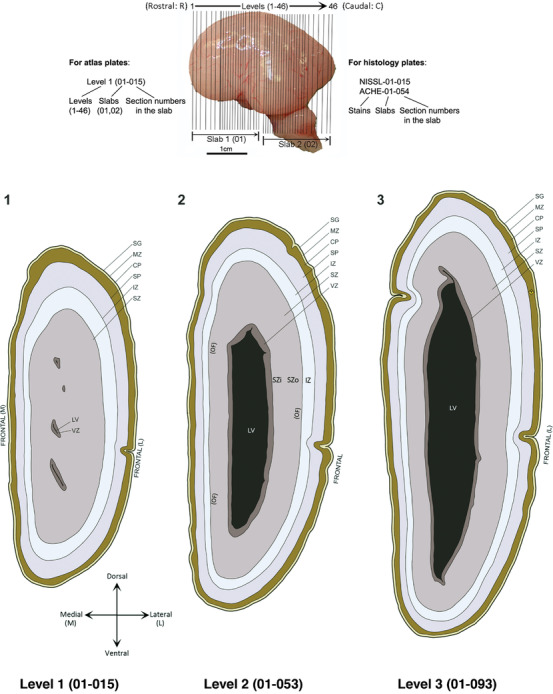
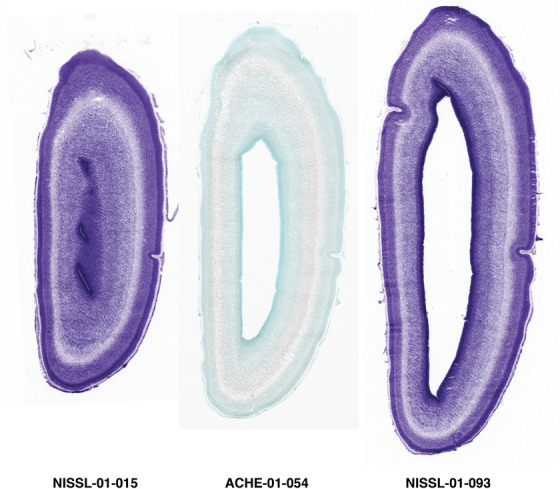
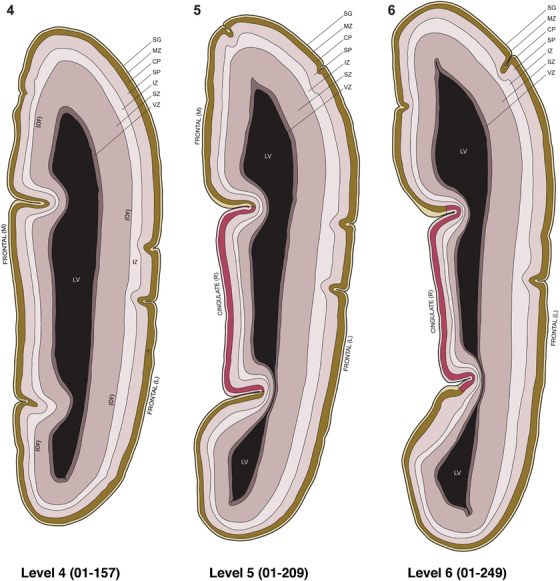
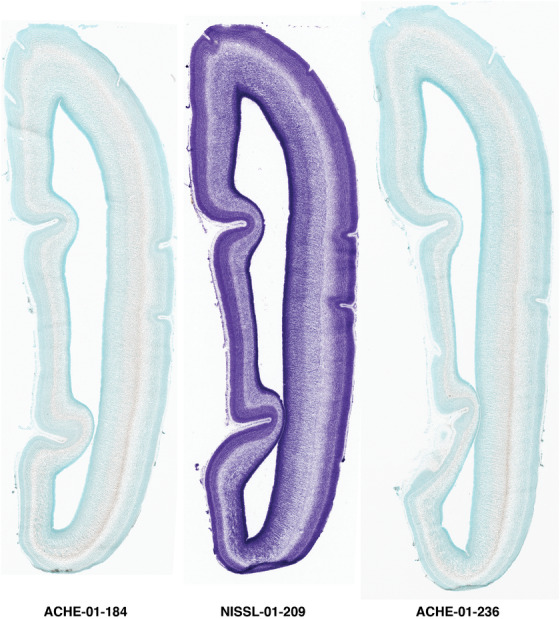
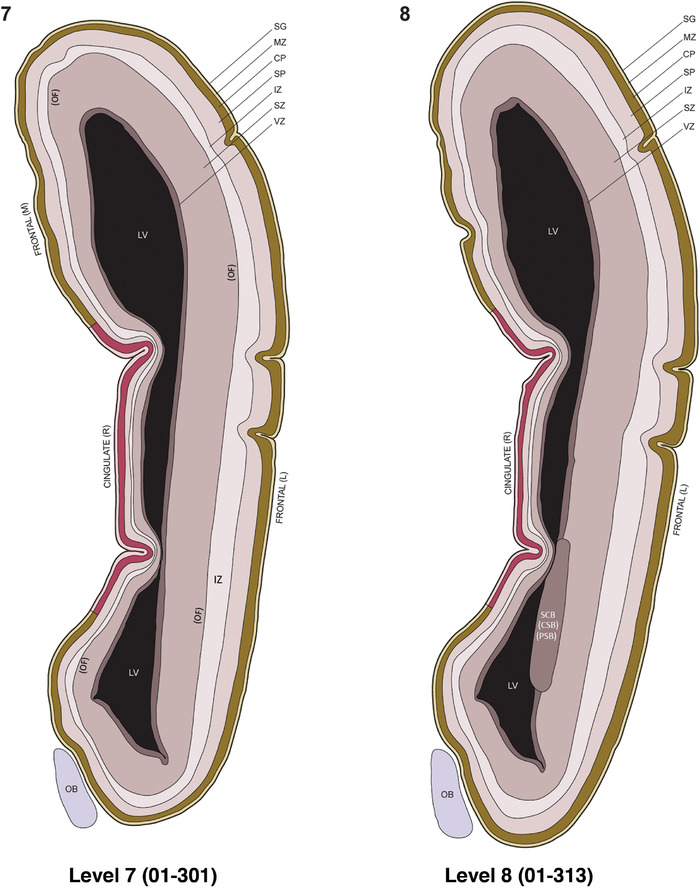
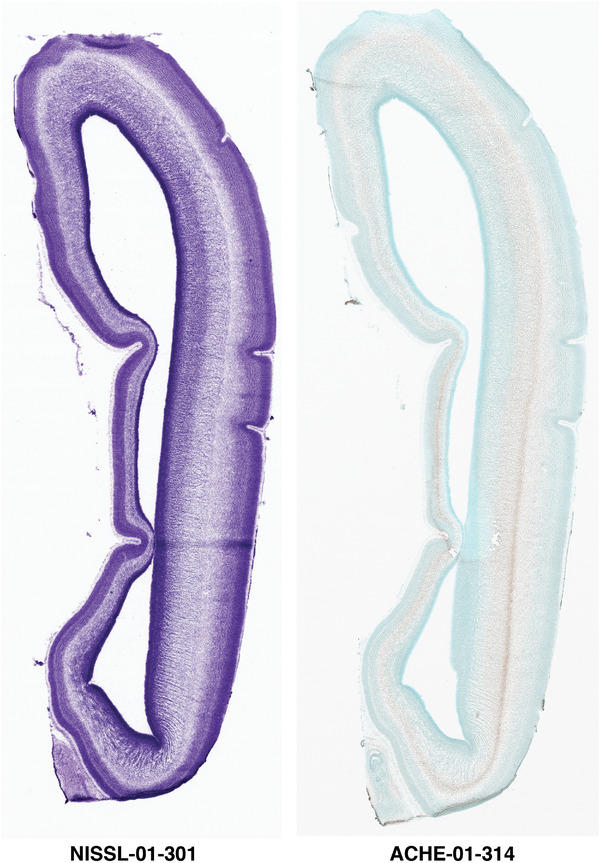
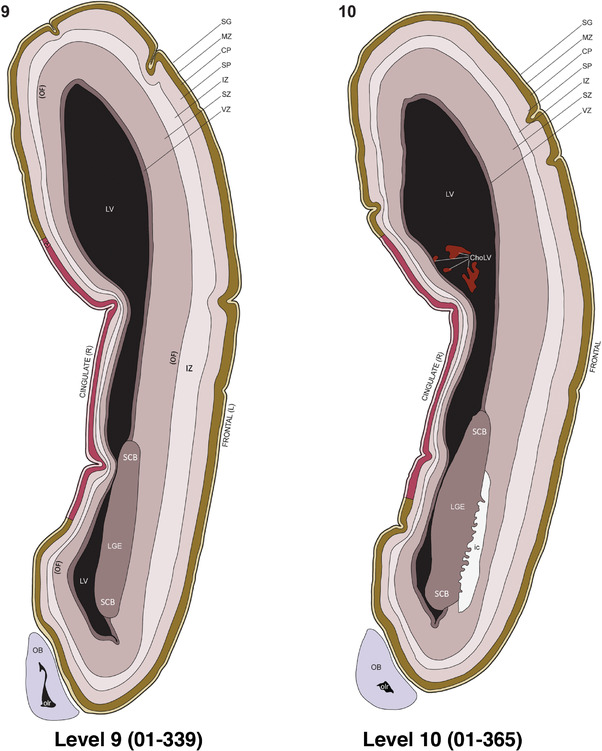
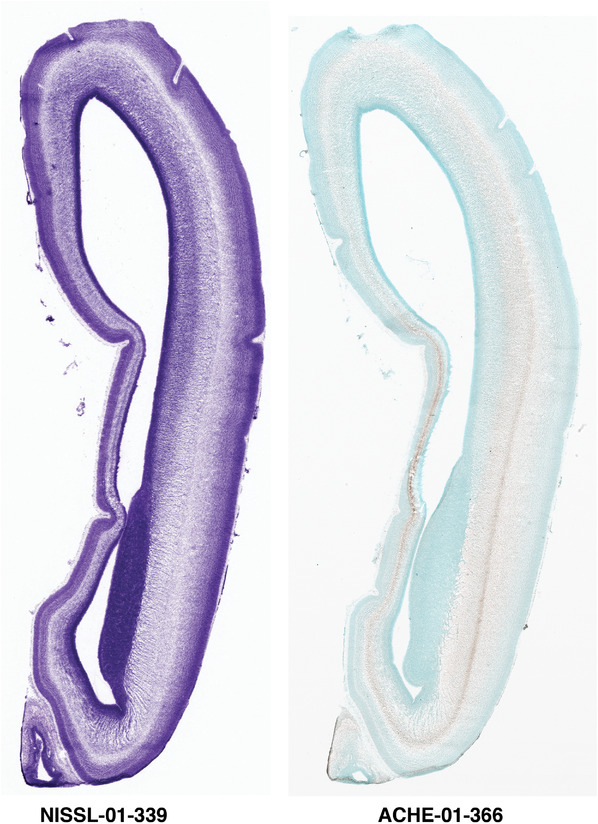
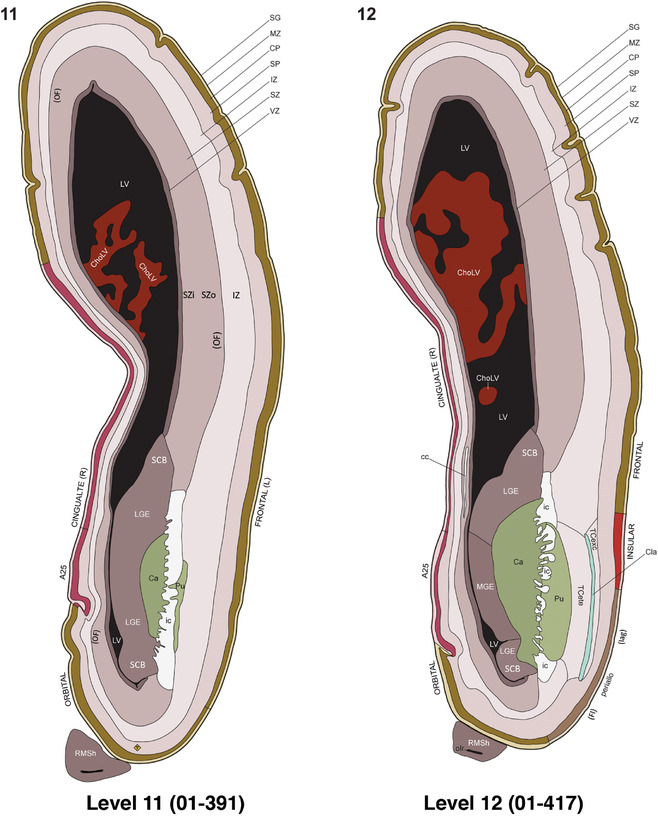
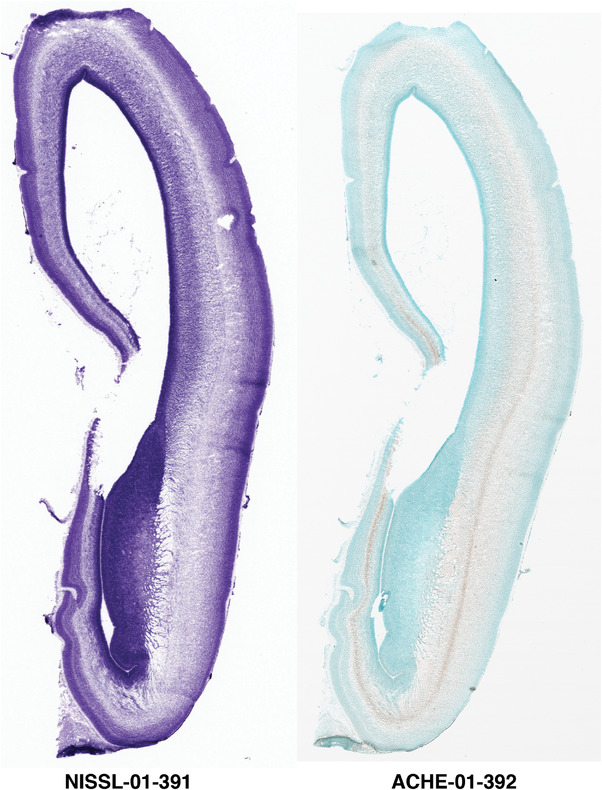
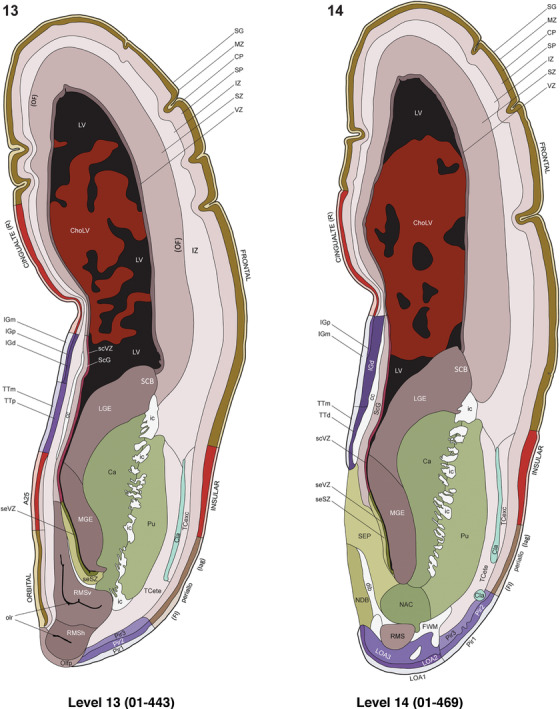
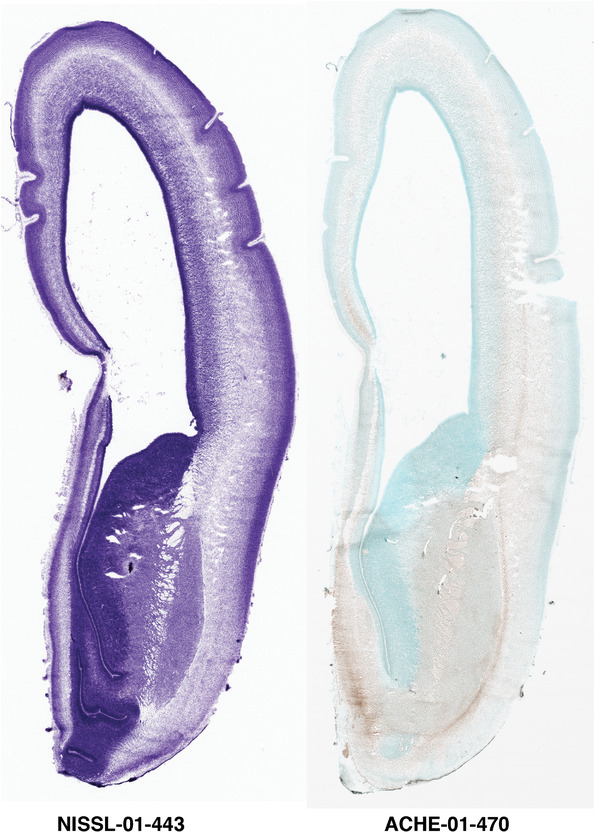
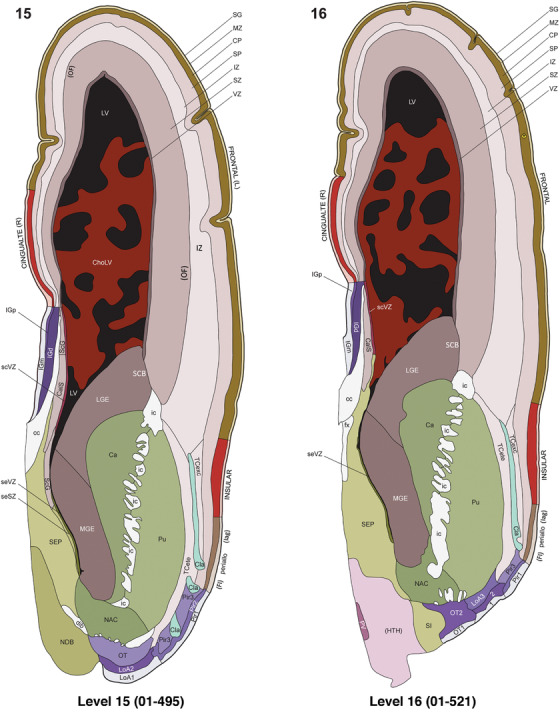
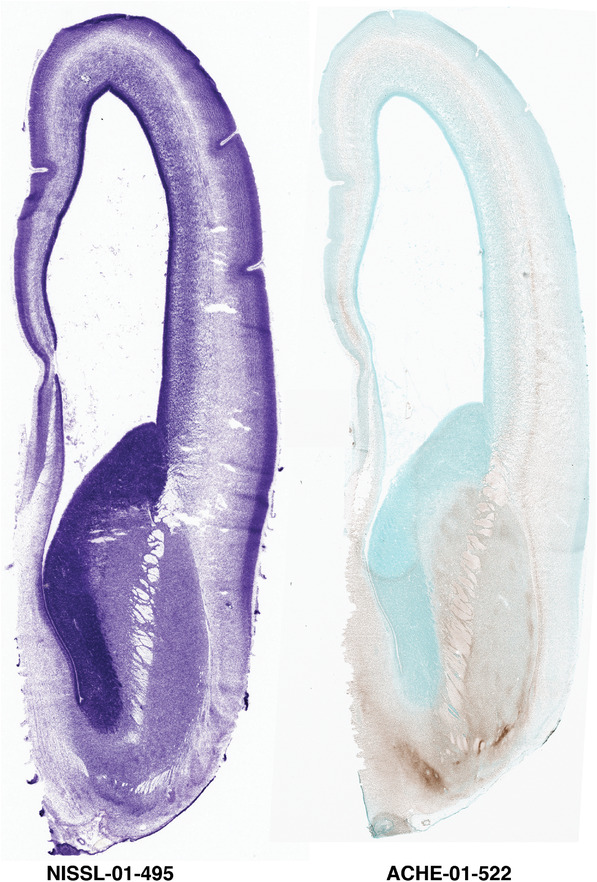
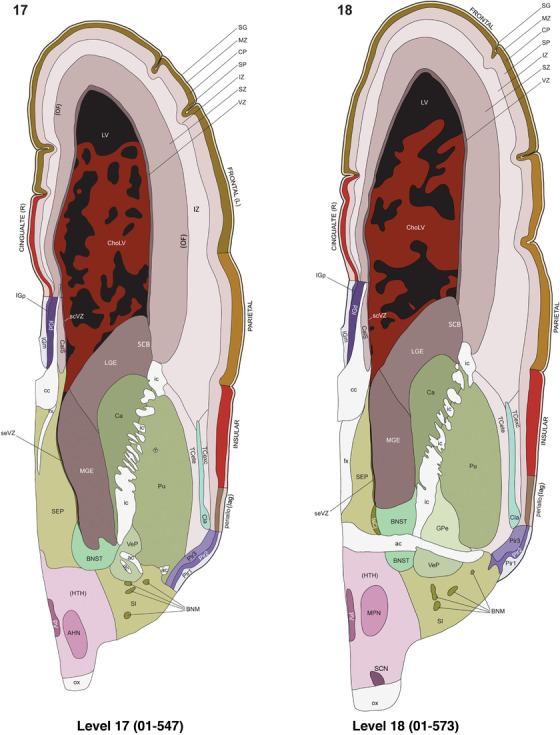
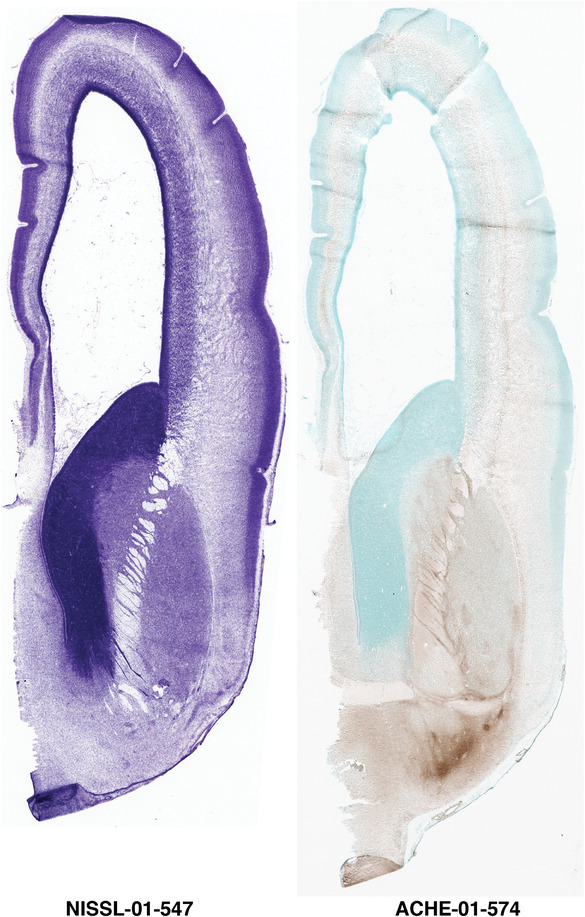
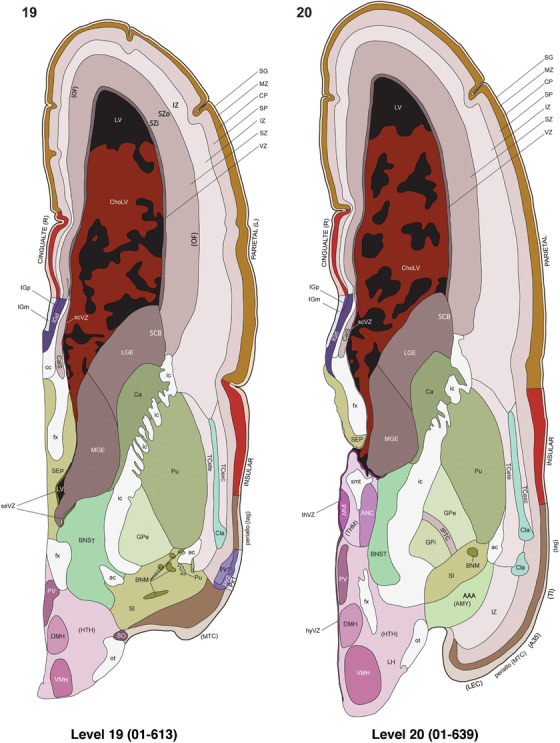
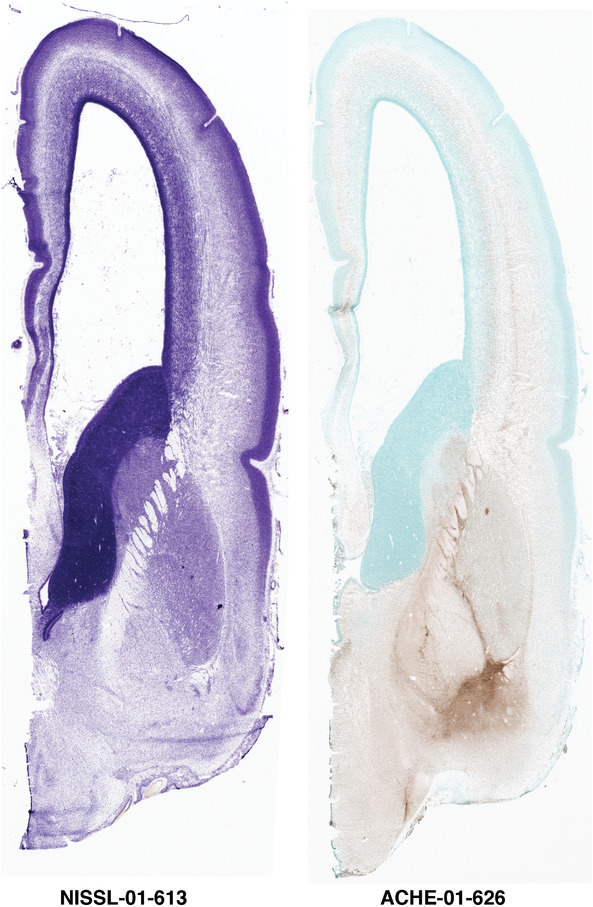
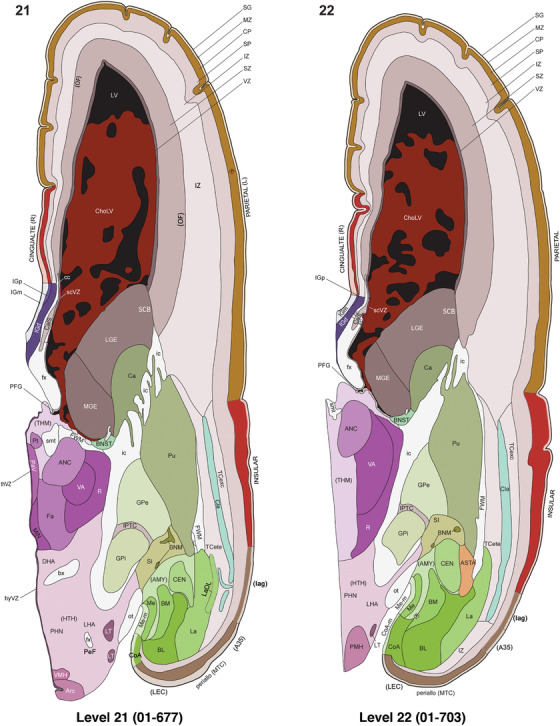
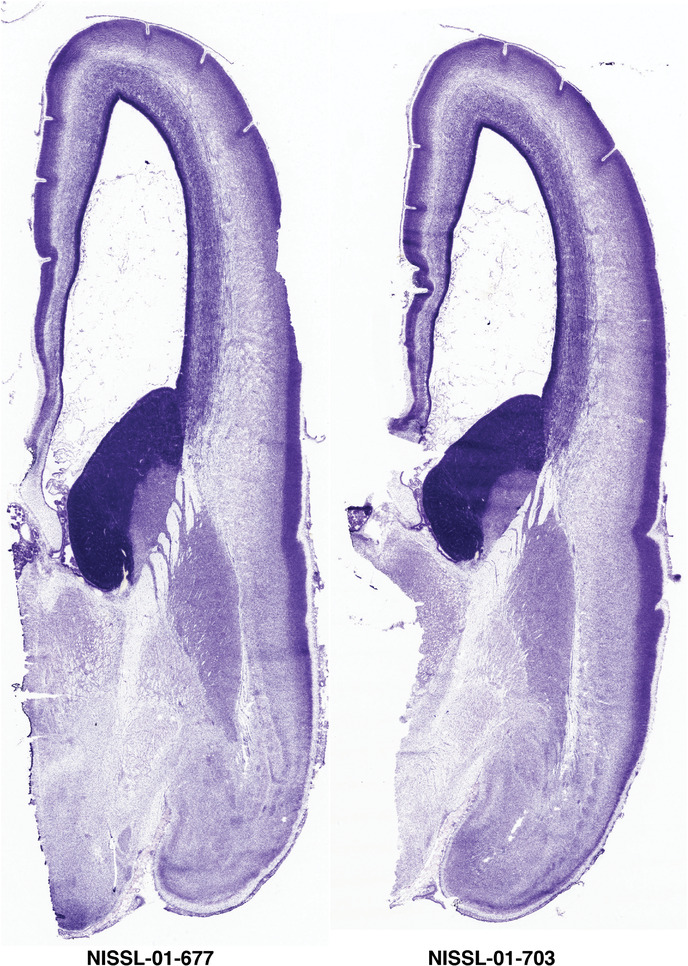
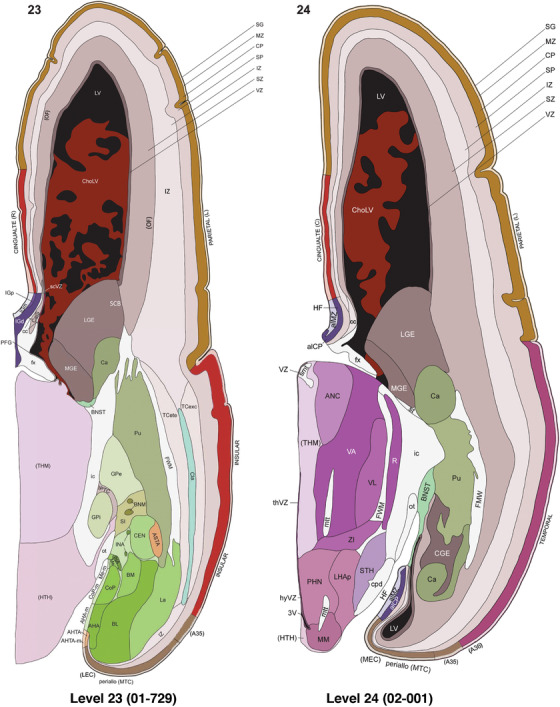
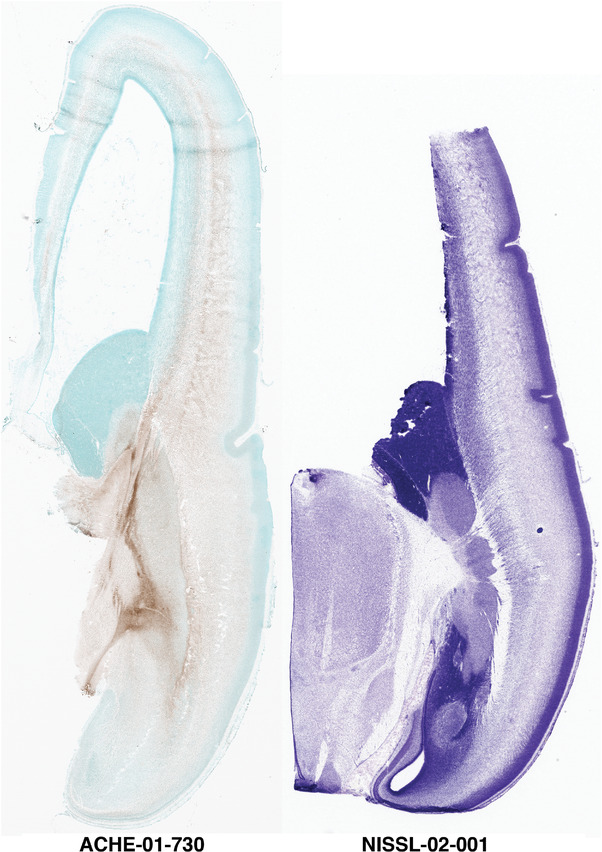
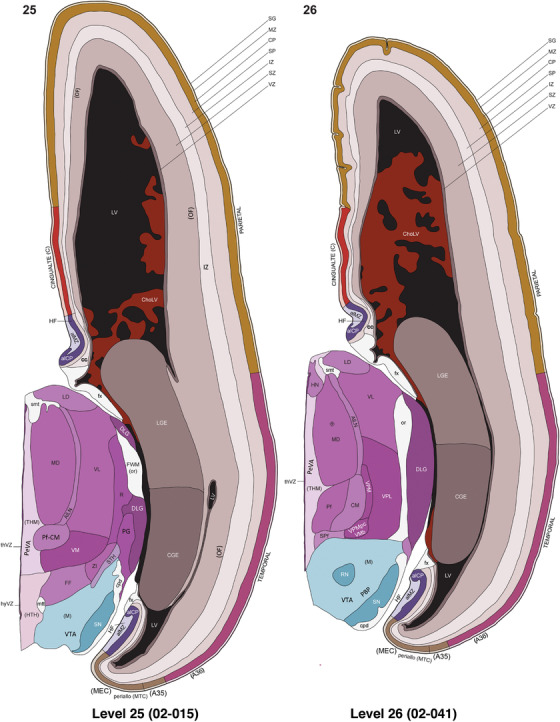
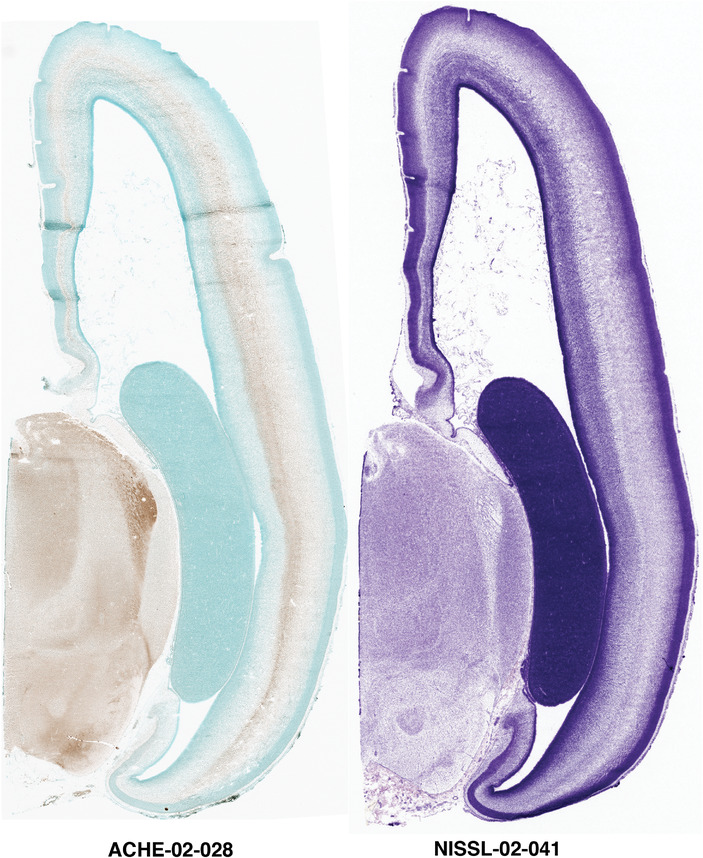
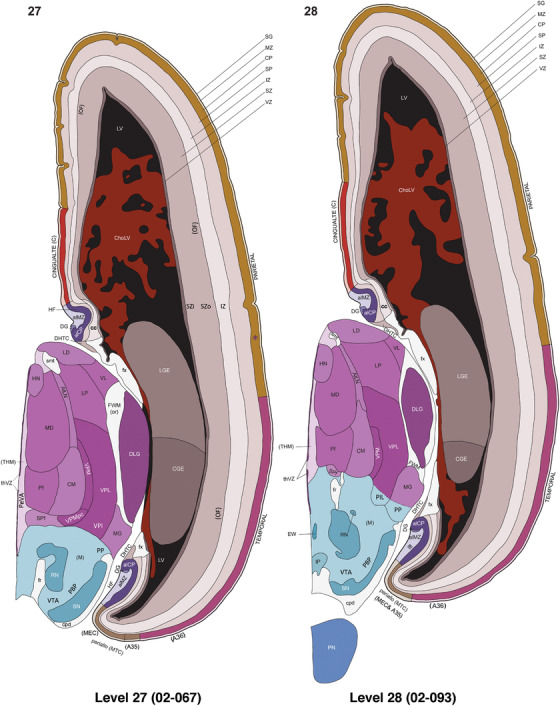
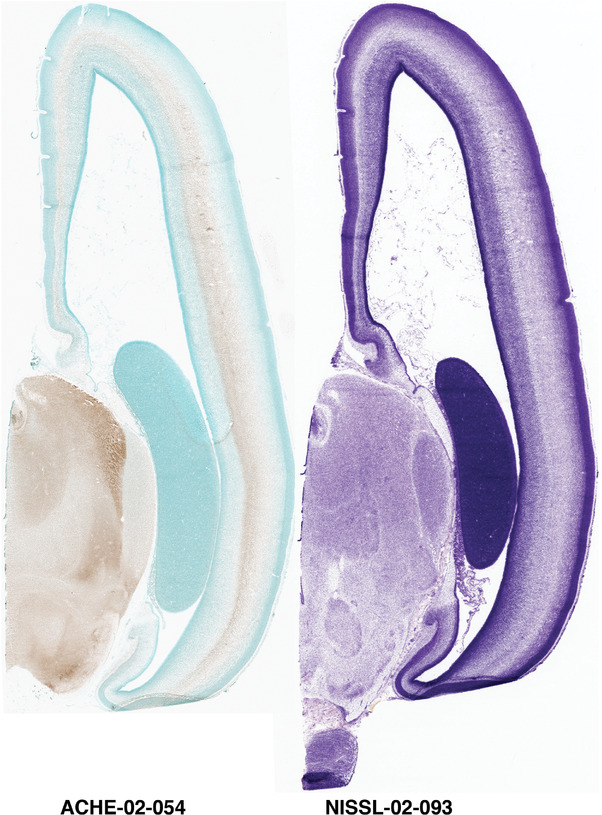
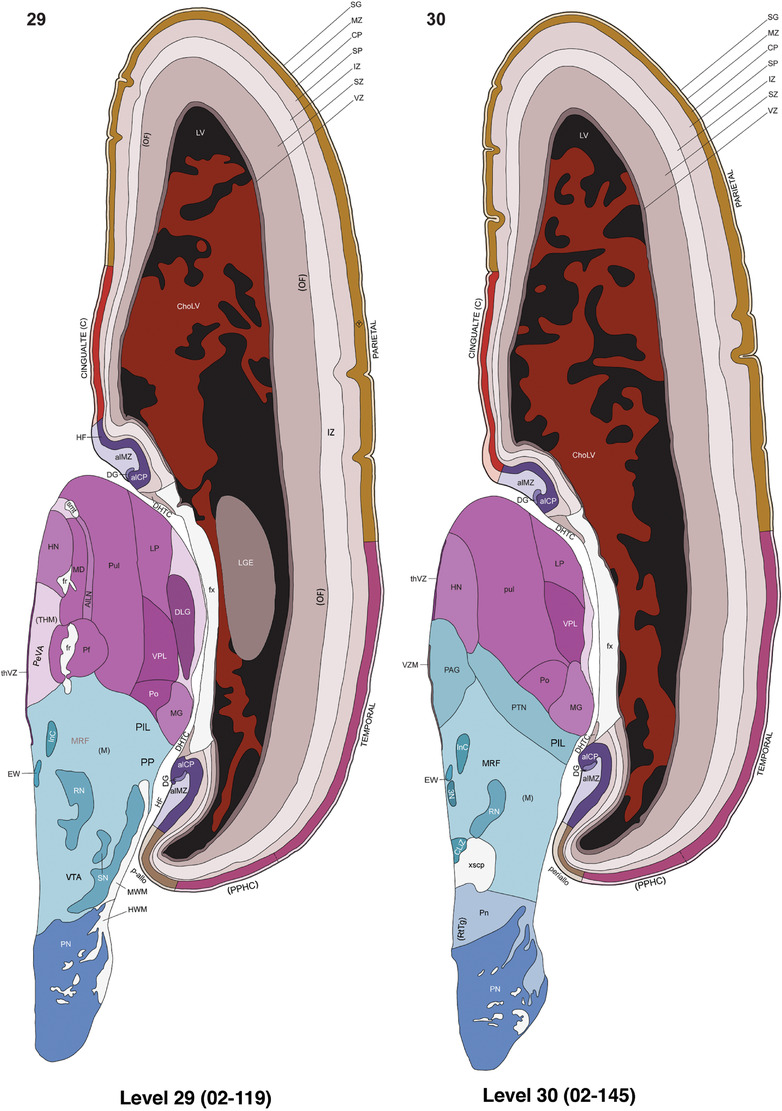
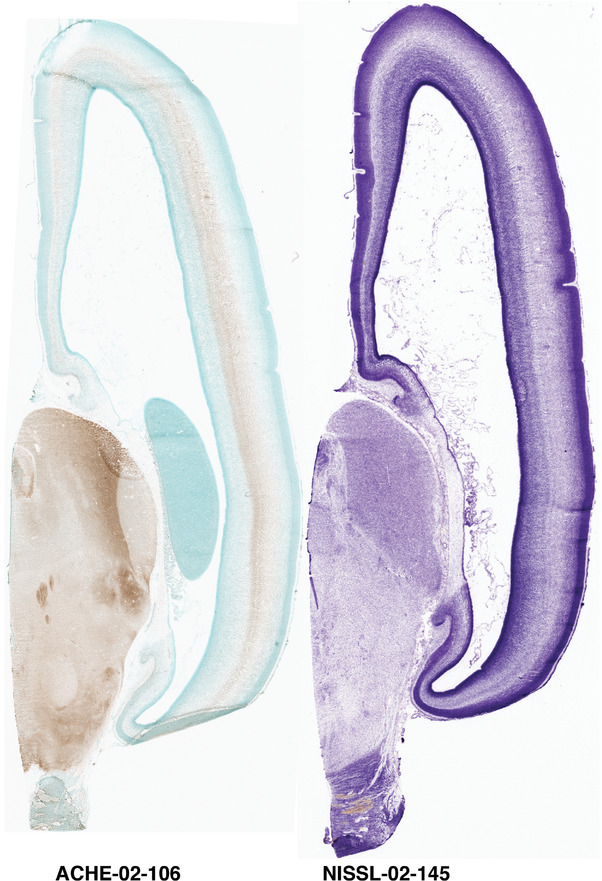
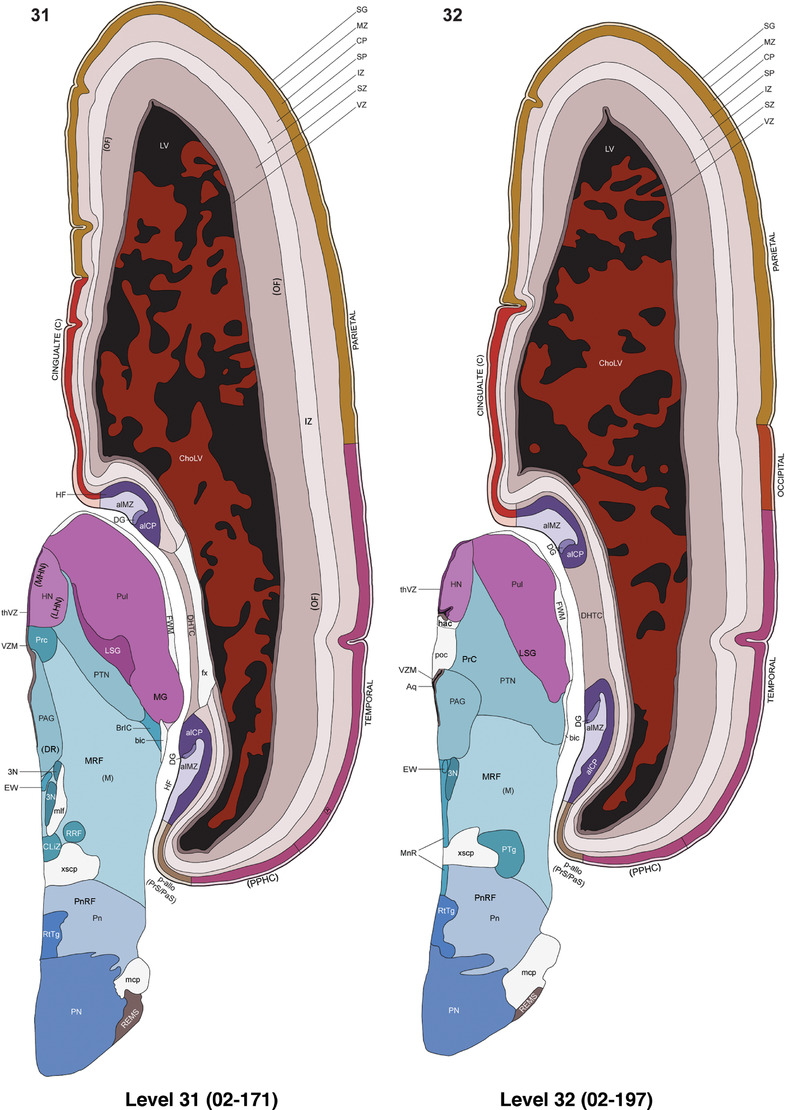
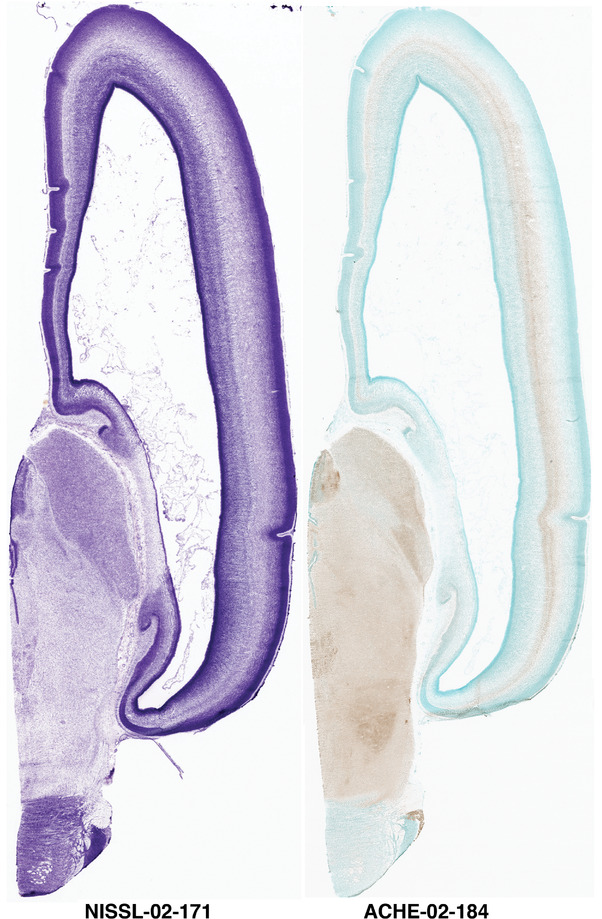
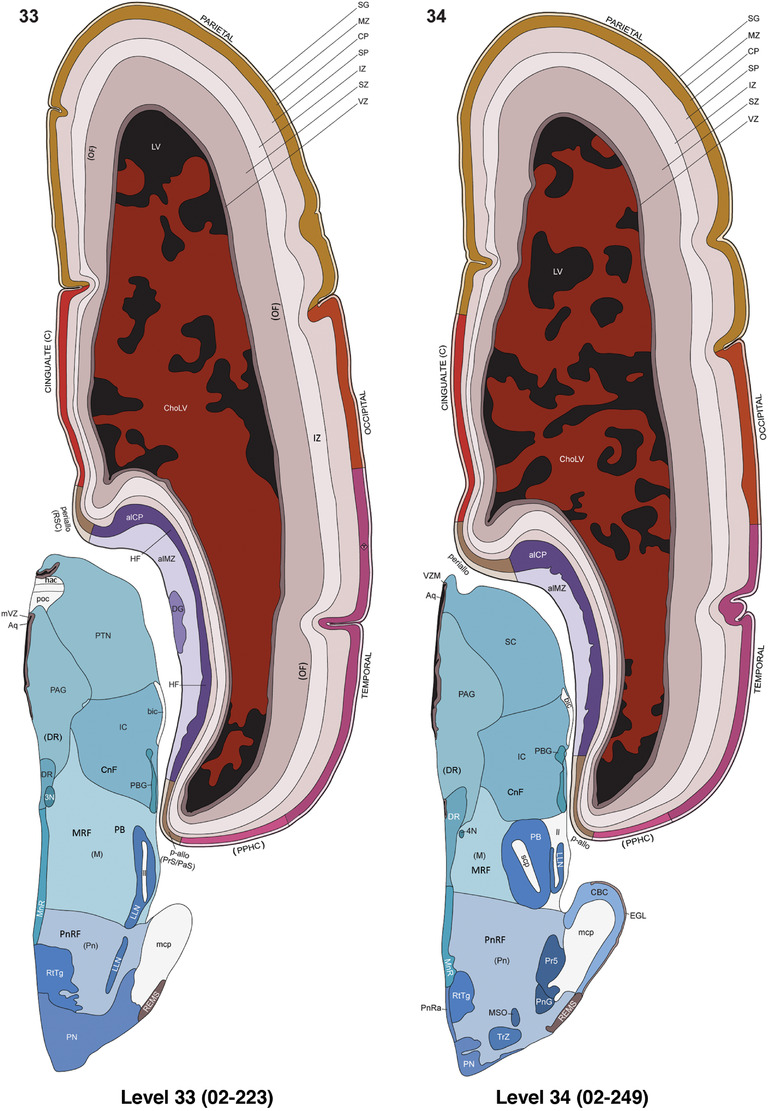
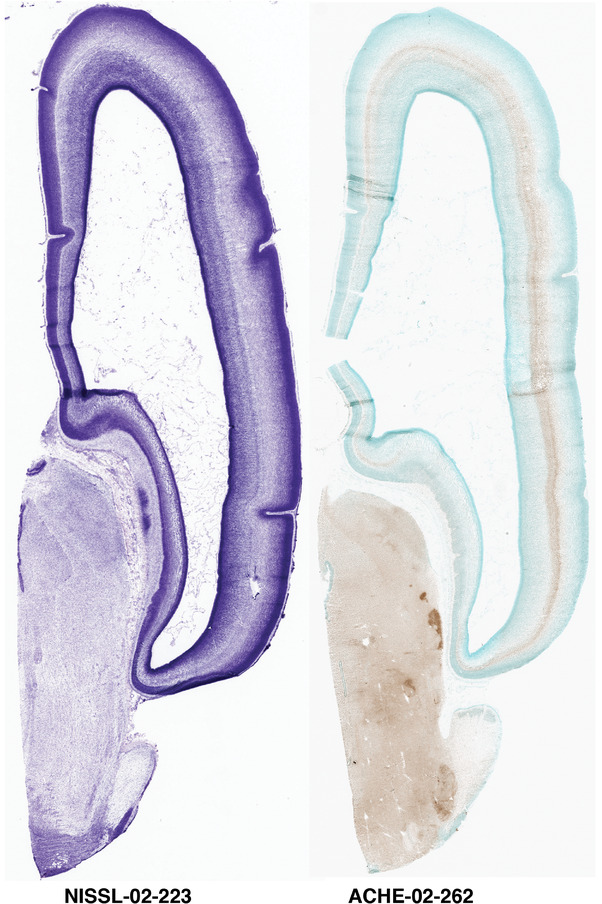
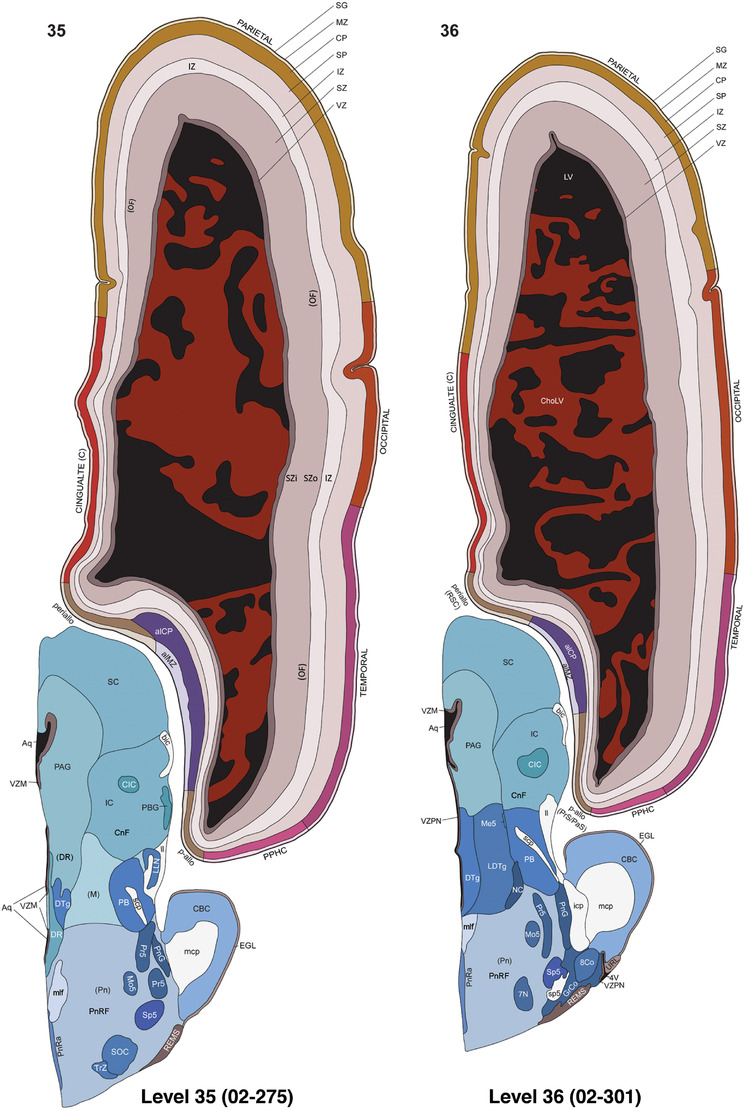
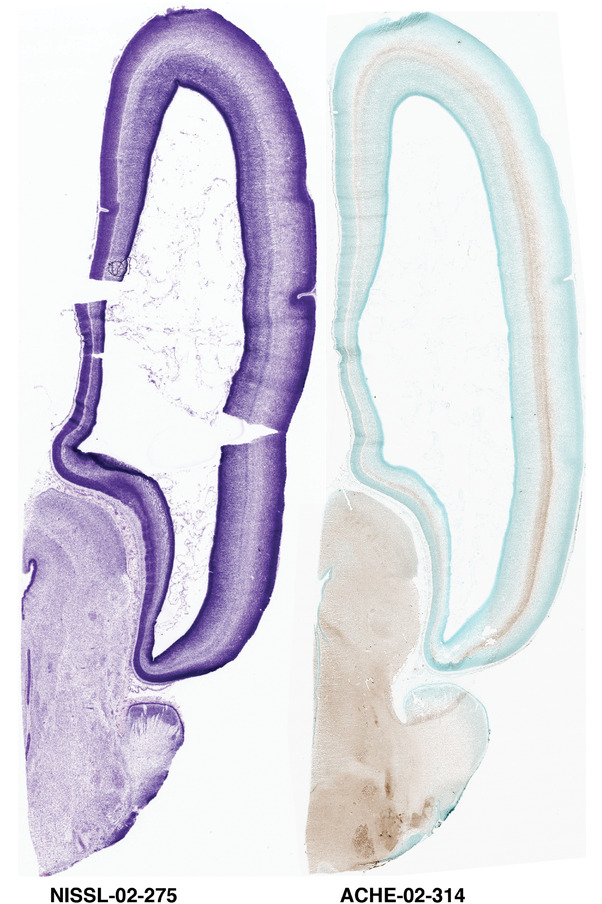
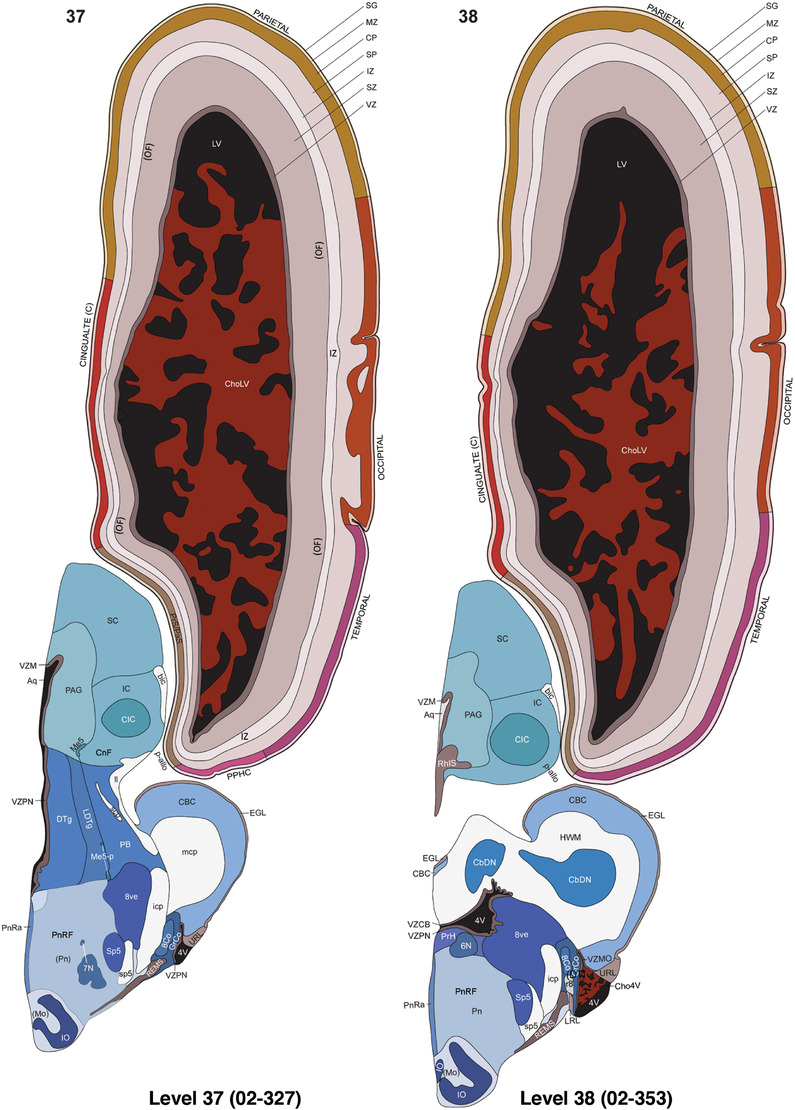
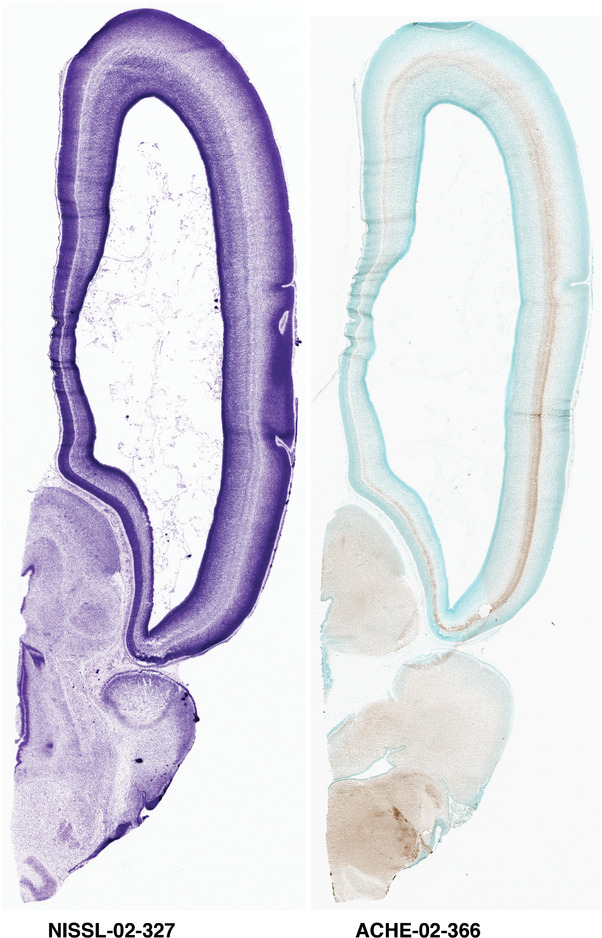
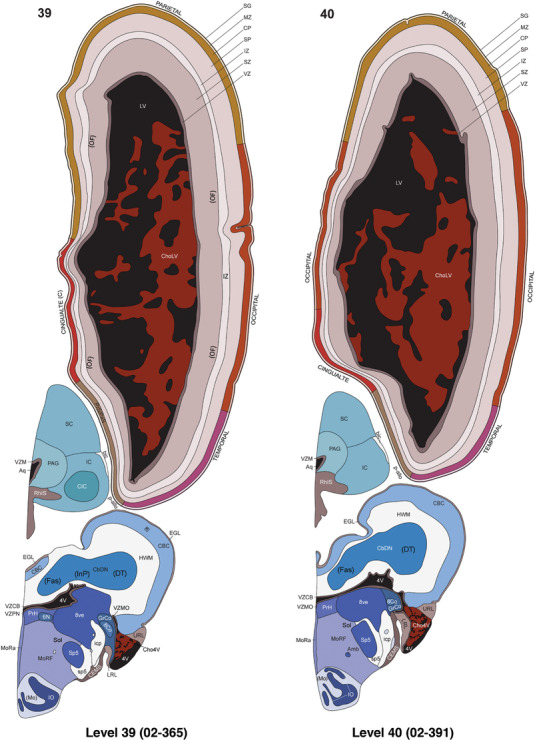
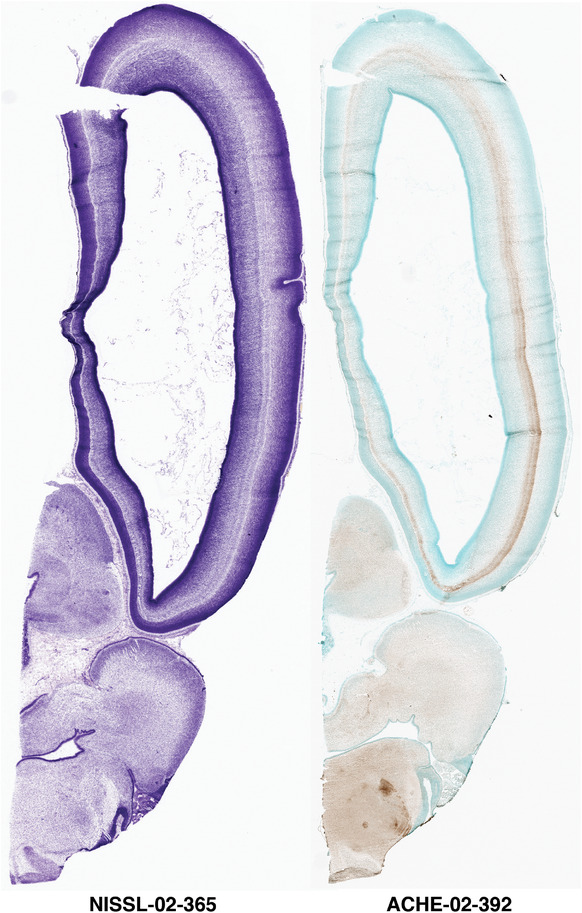
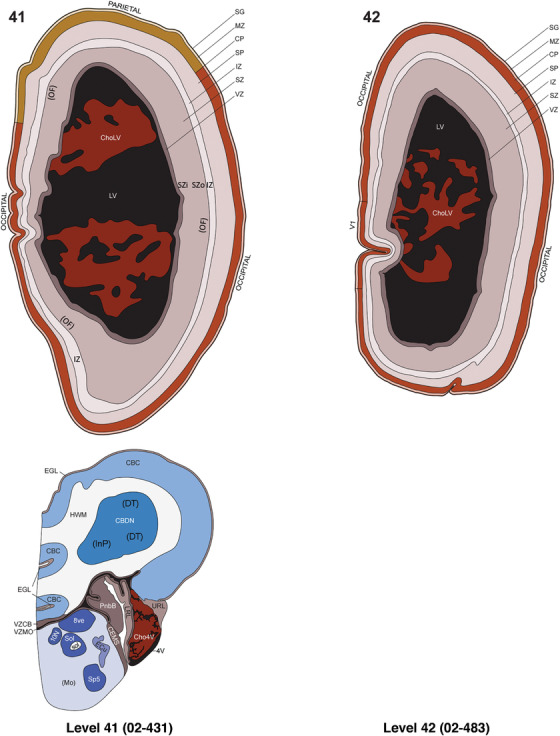
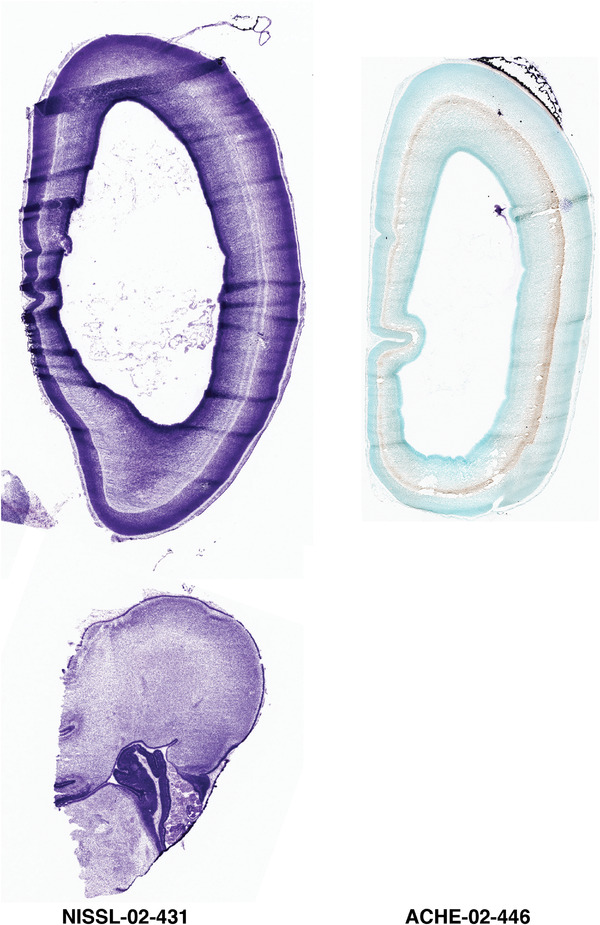
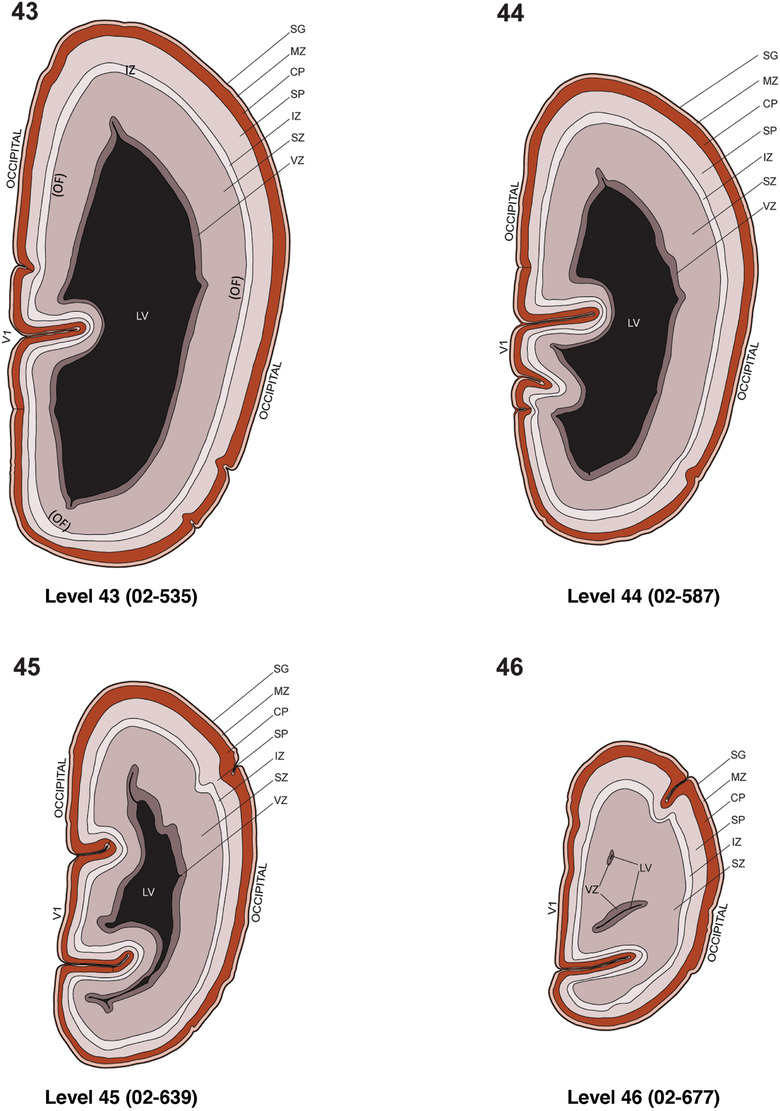
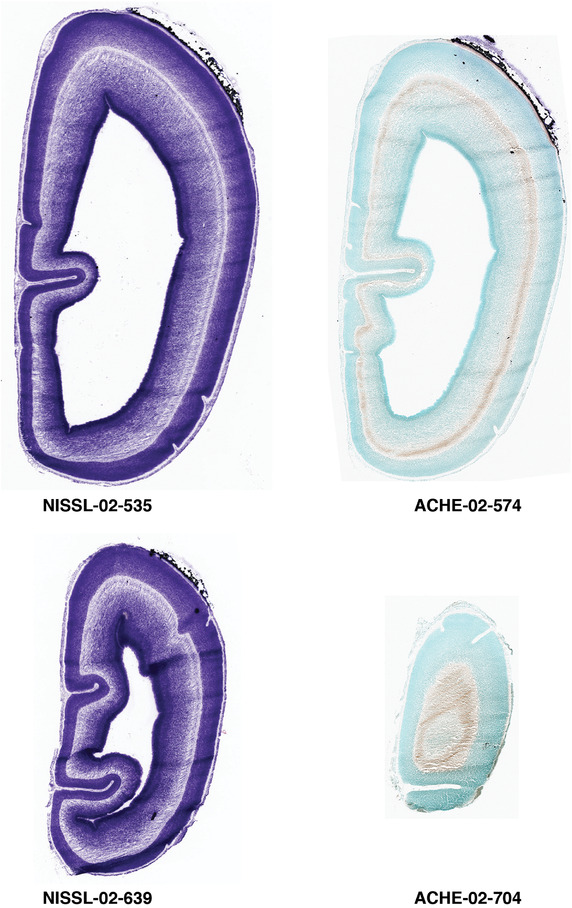
APPENDIX 2 2. Spatial expression of 37 genes in the brain at PCW 15
2.1.
Anatomical localizations of the gene expression are based on the anatomical brain atlas (Appendix 1 ) which is derived from the same brain hemisphere. Note that some artifacts like the blank (white) round or oval regions usually caused by air bulbs during ISH staining are indicated by (#). The expression of the other six genes was not annotated mainly because of their faint or sparse expression but the sequential ISH images for these genes are linked online after the 37 genes in this appendix.
CALB2 (calbindin 2) (starting page) 99
(link to online high‐resolution sequential ISH images)
CDH4 [cadherin 4, type 1, R‐cadherin (retinal)] 104
(link to online high‐resolution sequential ISH images)
CNTNAP2 (contactin associated protein‐like 2) 109
(link to online high‐resolution sequential ISH images)
DCX (doublecortin) 114
(link to online high‐resolution sequential ISH images)
DLX1 (distal‐less homeobox 1) 119
(link to online high‐resolution sequential ISH images)
DLX2 (distal‐less homeobox 2) 124
(link to online high‐resolution sequential ISH images)
DLX5 (distal‐less homeobox 5) 127
(link to online high‐resolution sequential ISH images)
ENC1 [ectodermal‐neural cortex (with BTB‐like domain)] 132
(link to online high‐resolution sequential ISH images)
EOMES (eomesodermin) or TBR2 (T‐box brain transcription factor 2) 137
(link to online high‐resolution sequential ISH images)
ERBB4 [v‐erb‐a erythroblastic leukemia viral oncogene homolog 4 (avian)] 142
(link to online high‐resolution sequential ISH images)
ETV1 (ets variant 1) 147
(link to online high‐resolution sequential ISH images)
FABP7 (fatty acid‐binding protein 7, brain) 152
(link to online high‐resolution sequential ISH images)
FADS2 (fatty acid desaturase 2) 157
(link to online high‐resolution sequential ISH images)
FEZF2 (FEZ family zinc finger 2) 162
(link to online high‐resolution sequential ISH images)
FOXG1 (forkhead box G1) 167
(link to online high‐resolution sequential ISH images)
FOXP1 (forkhead box P1) 172
(link to online high‐resolution sequential ISH images)
GAP43 (growth‐associated protein 43) 177
(link to online high‐resolution sequential ISH images)
GFAP (glial fibrillary acidic protein) 182
(link to online high‐resolution sequential ISH images)
GRIK2 (glutamate receptor, ionotropic, kainate 2) 187
(link to online high‐resolution sequential ISH images)
LHX2 (LIM homeobox 2) 192
(link to online high‐resolution sequential ISH images)
LMO4 (LIM domain only 4) 197
(link to online high‐resolution sequential ISH images)
NES (nestin) 202
(link to online high‐resolution sequential ISH images)
NKX2.1 (NK2 homeobox 1) 207
(link to online high‐resolution sequential ISH images)
NPY (neuropeptide Y) 212
(link to online high‐resolution sequential ISH images)
NRGN neurogranin (protein kinase C substrate, RC3) 217
(link to online high‐resolution sequential ISH images)
NRXN1 (neurexin 1) 222
(link to online high‐resolution sequential ISH images)
NTRK2 (neurotrophic tyrosine kinase, receptor, type 2) 227
(link to online high‐resolution sequential ISH images)
PAX6 (paired box 6) 232
(link to online high‐resolution sequential ISH images)
PLXNA2 (plexin A2) 237
(link to online high‐resolution sequential ISH images)
RELN (reelin) 242
(link to online high‐resolution sequential ISH images)
SATB2 (SATB homeobox 2) 247
(link to online high‐resolution sequential ISH images)
SOX2 [SRY (sex determining region Y)‐box 2] 252
(link to online high‐resolution sequential ISH images)
SST (somatostatin) 257
(link to online high‐resolution sequential ISH images)
SYNGAP1 [synaptic Ras GTPase activating protein 1 homolog (rat)] 262
(link to online high‐resolution sequential ISH images)
TBR1 (T‐box brain transcription factor 1) 267
(link to online high‐resolution sequential ISH images)
VIM (tripeptidyl peptidase I) 271
(link to online high‐resolution sequential ISH images)
ZIC1 [Zic family member 1 (odd‐paired homolog, Drosophila)] 276
(link to online high‐resolution sequential ISH images)
List of other six genes with only online link for their spatial expression
HOXA4 (homeobox A4): link to online ISH images.
LBX1 (ladybird homeobox 1): link to online ISH images.
MECP2 [methyl CpG‐binding protein 2 (Rett syndrome)]: link to online ISH images
SHANK3 (SH3 and multiple ankyrin repeat domains 3): link to online ISH images.
SOX10 [SRY (sex determining region Y)‐box 10]: link to online ISH images.
TPP1 (tripeptidyl peptidase I): link to online ISH images.
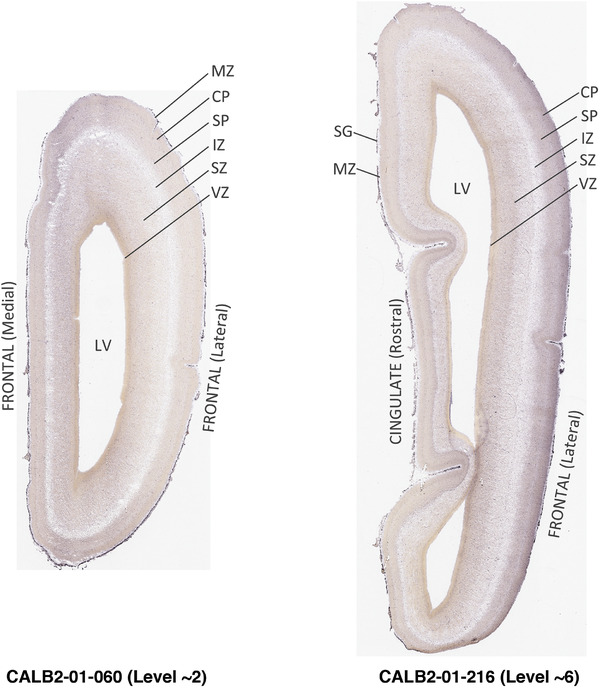
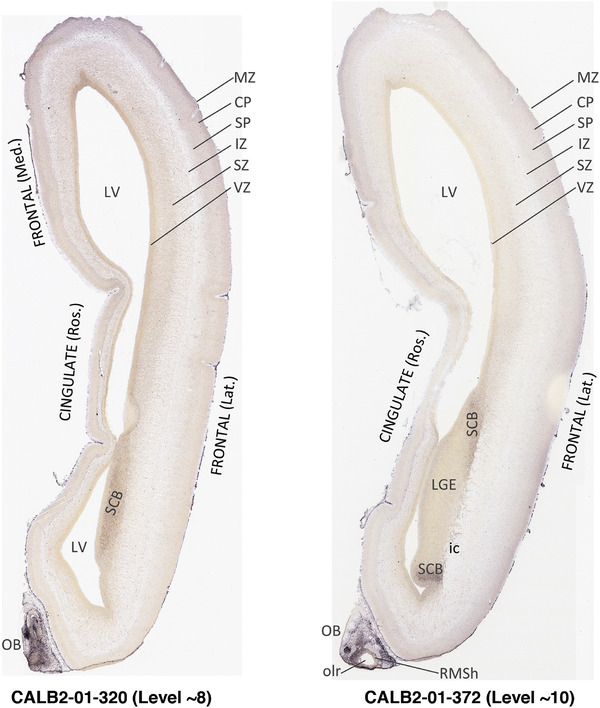
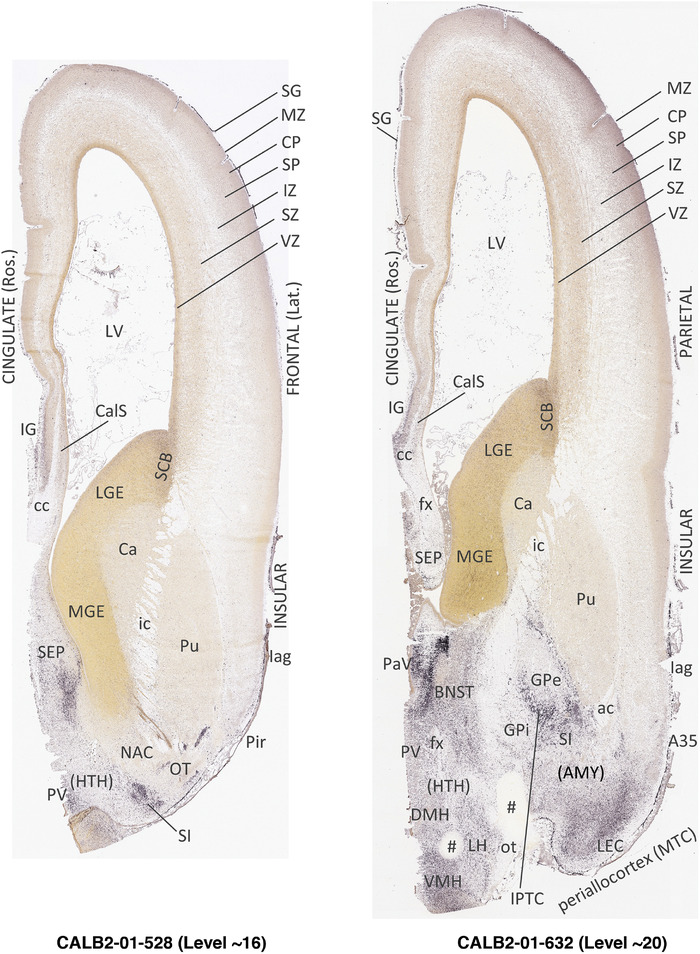
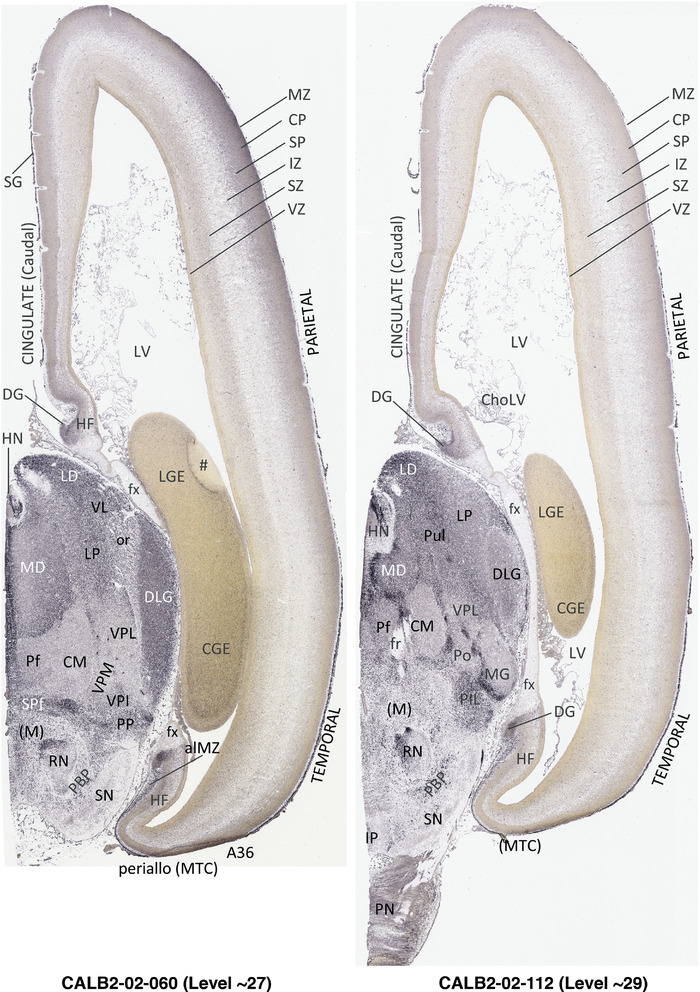
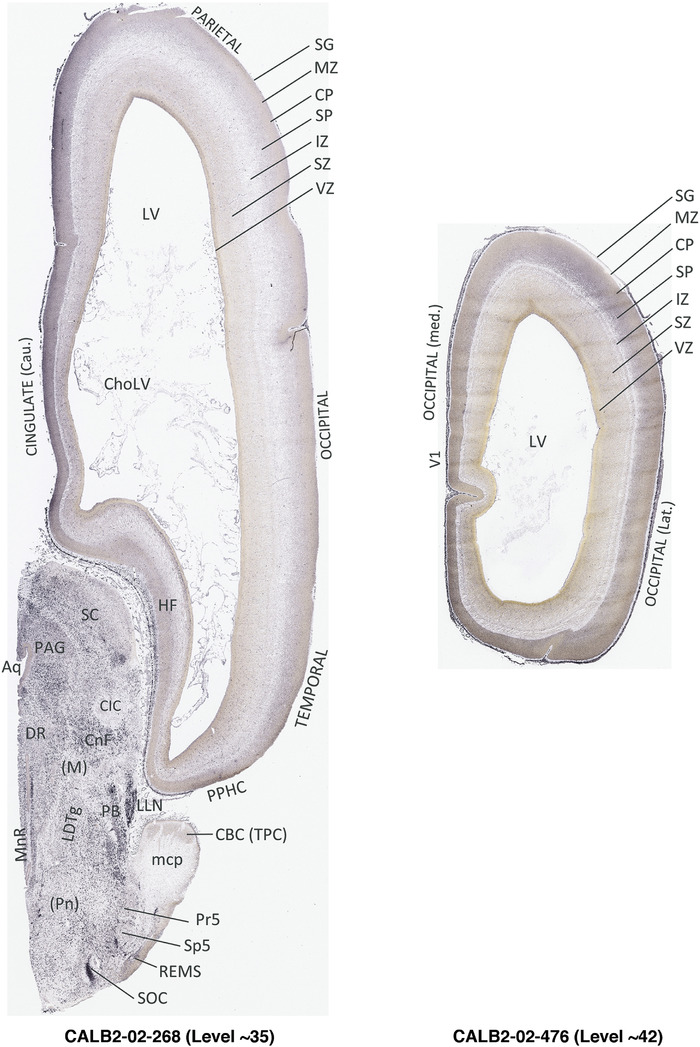
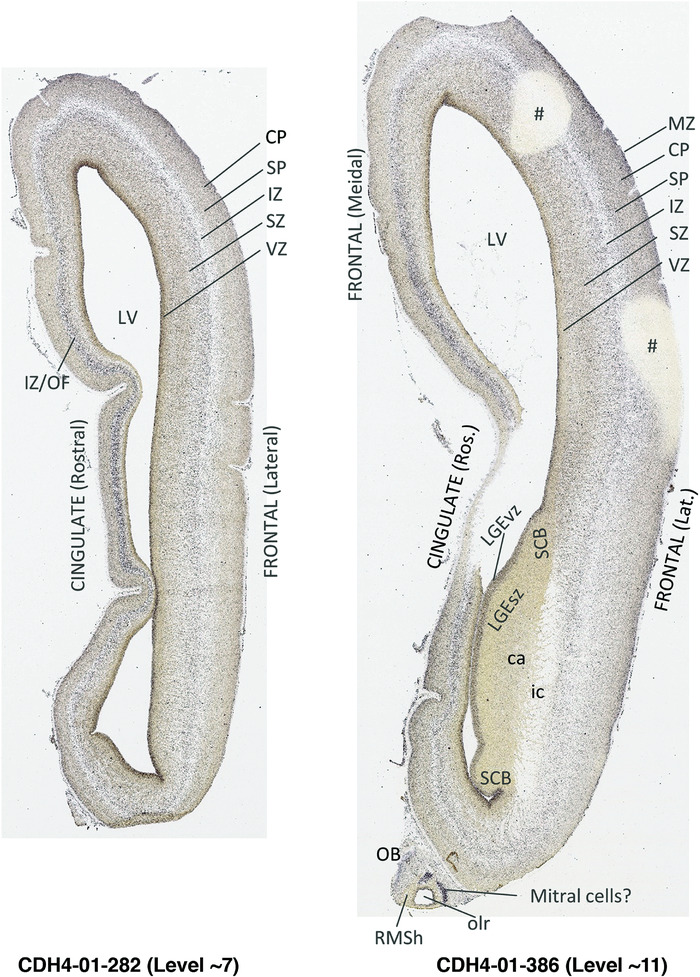
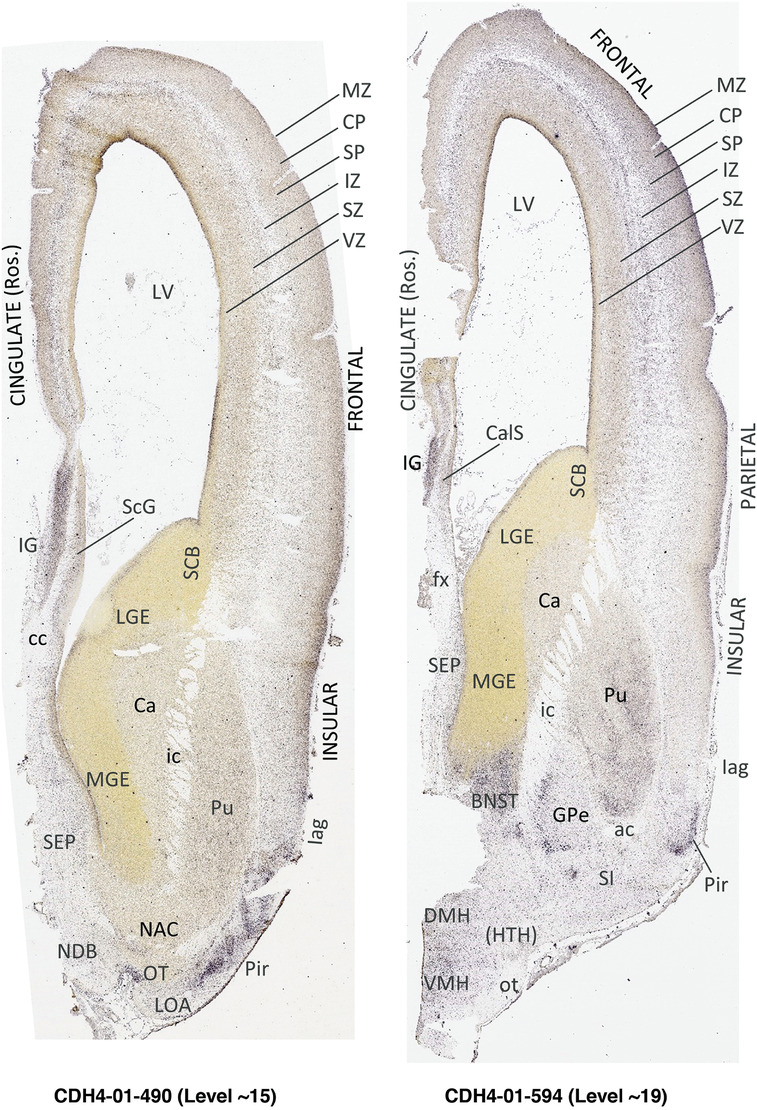
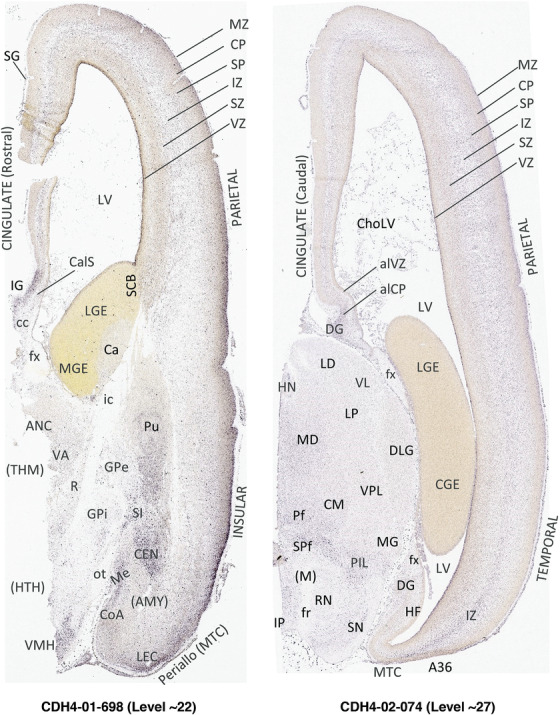
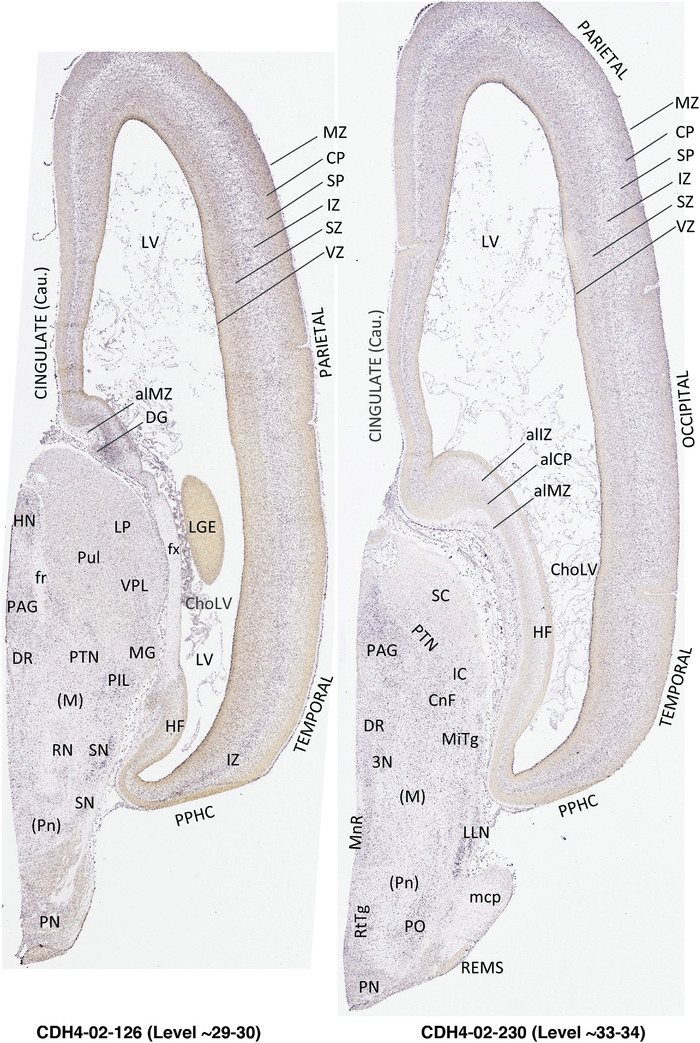
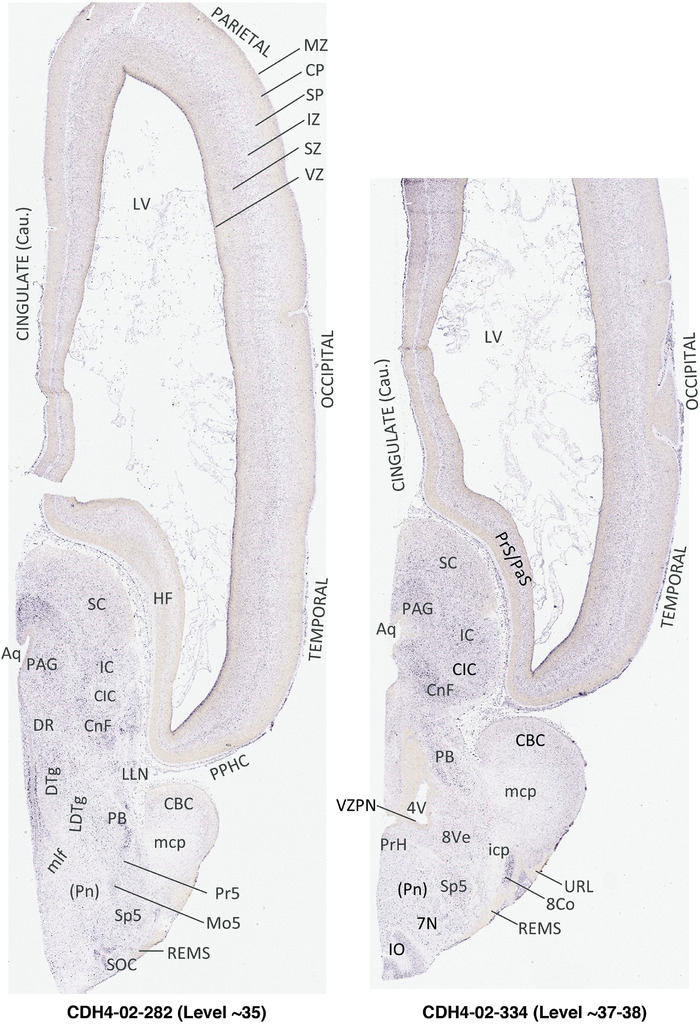
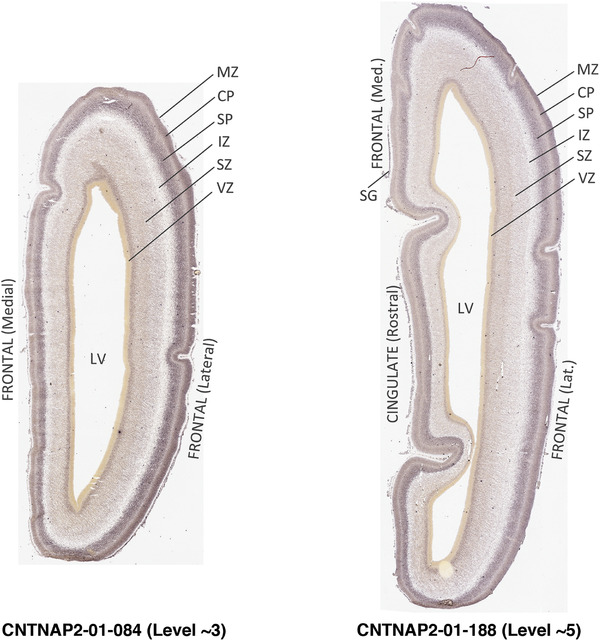
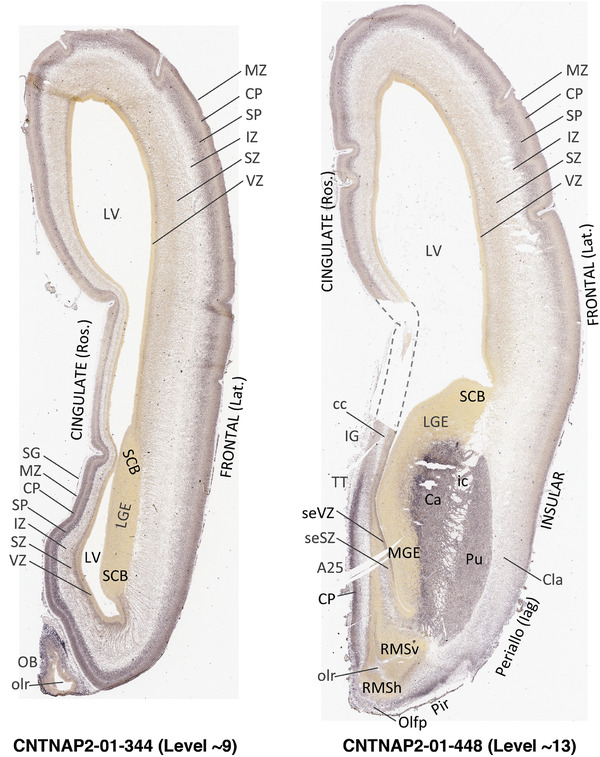
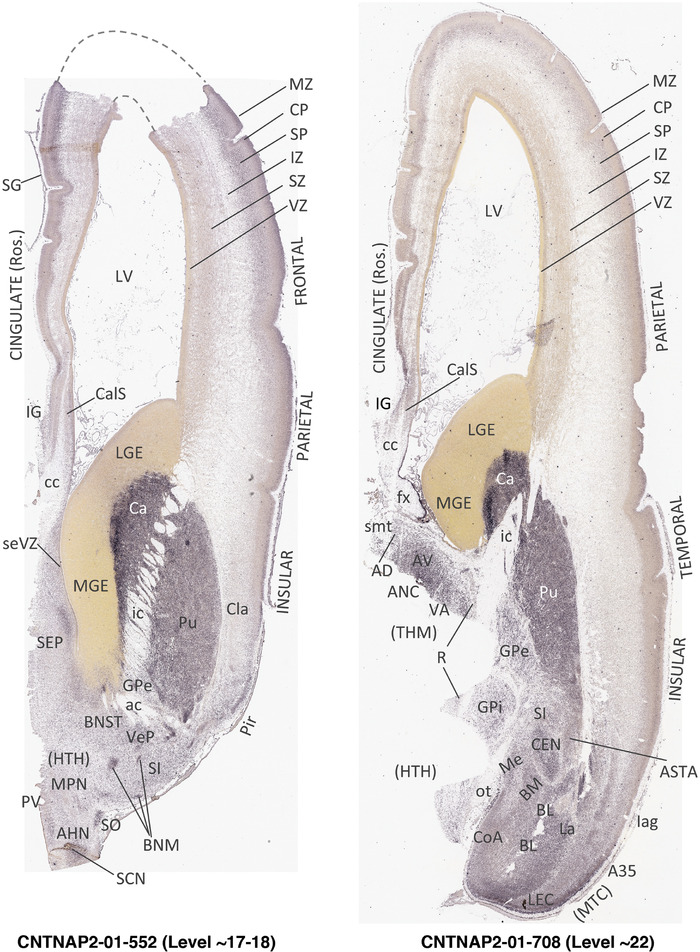
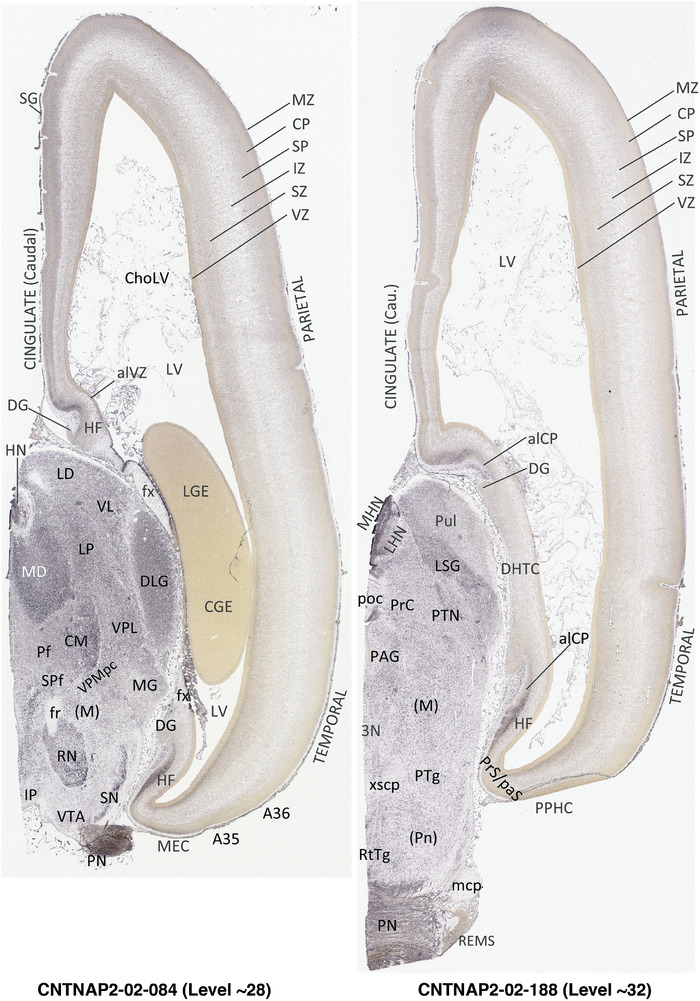
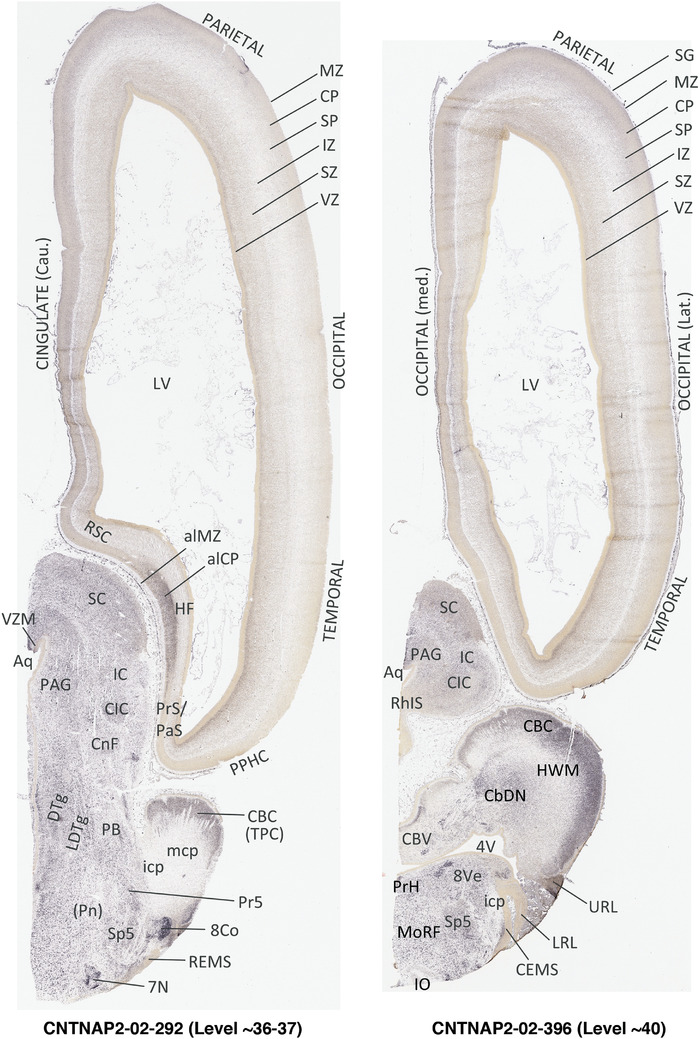
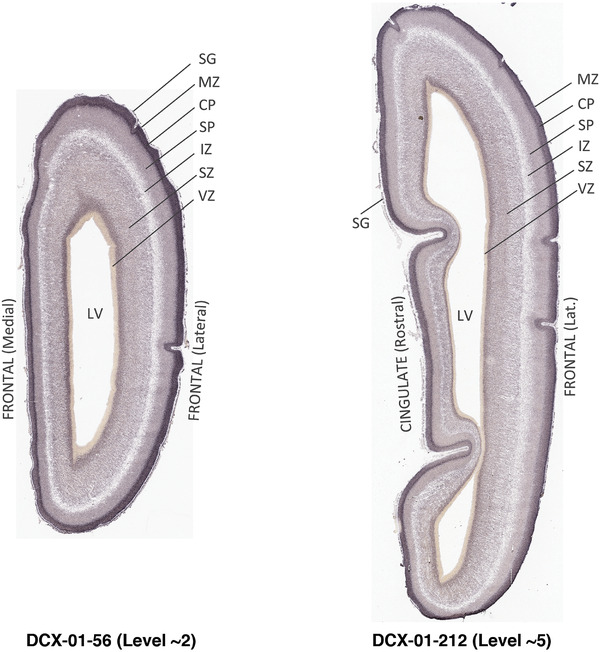
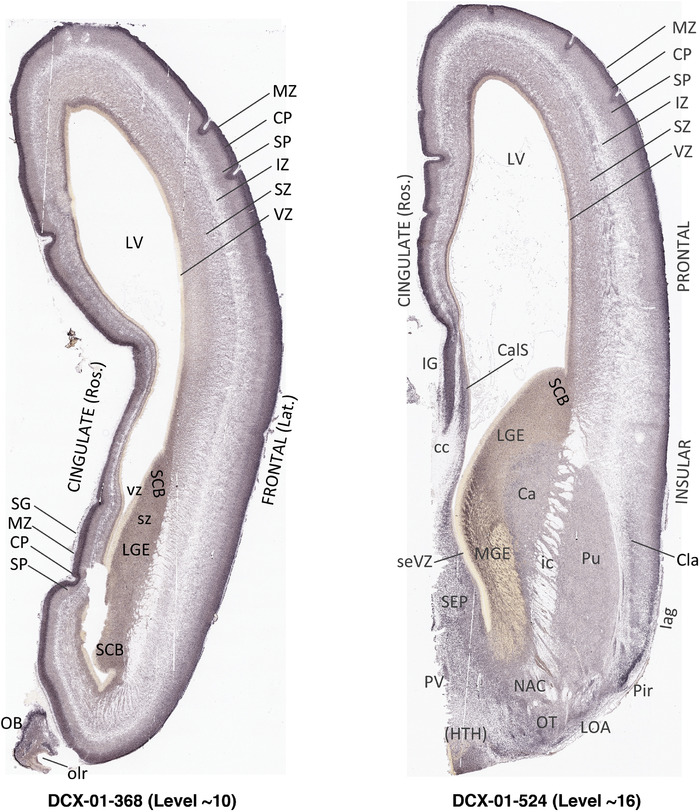
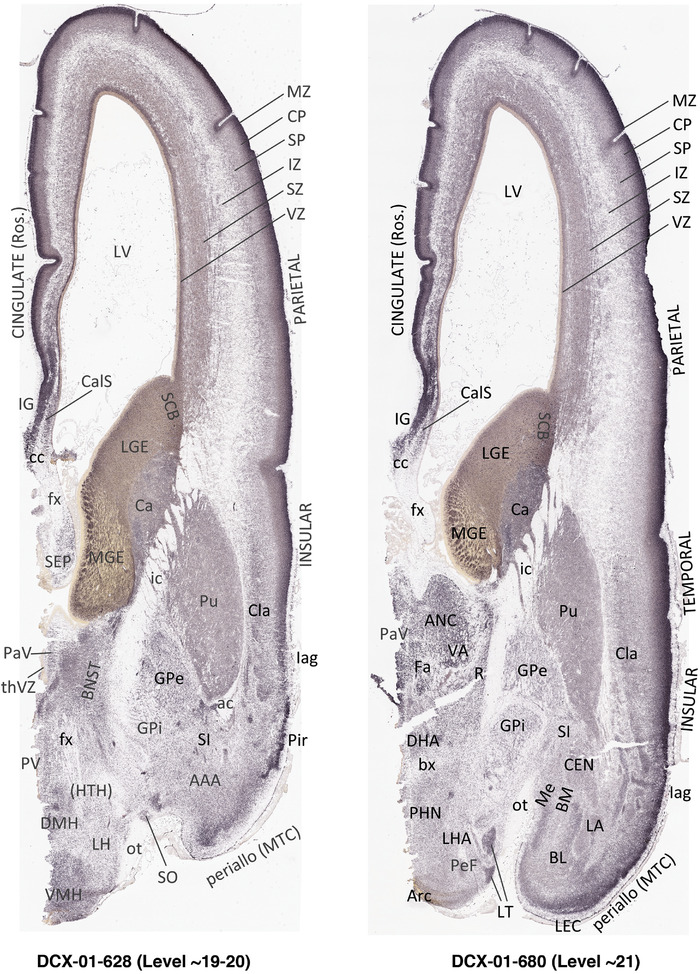
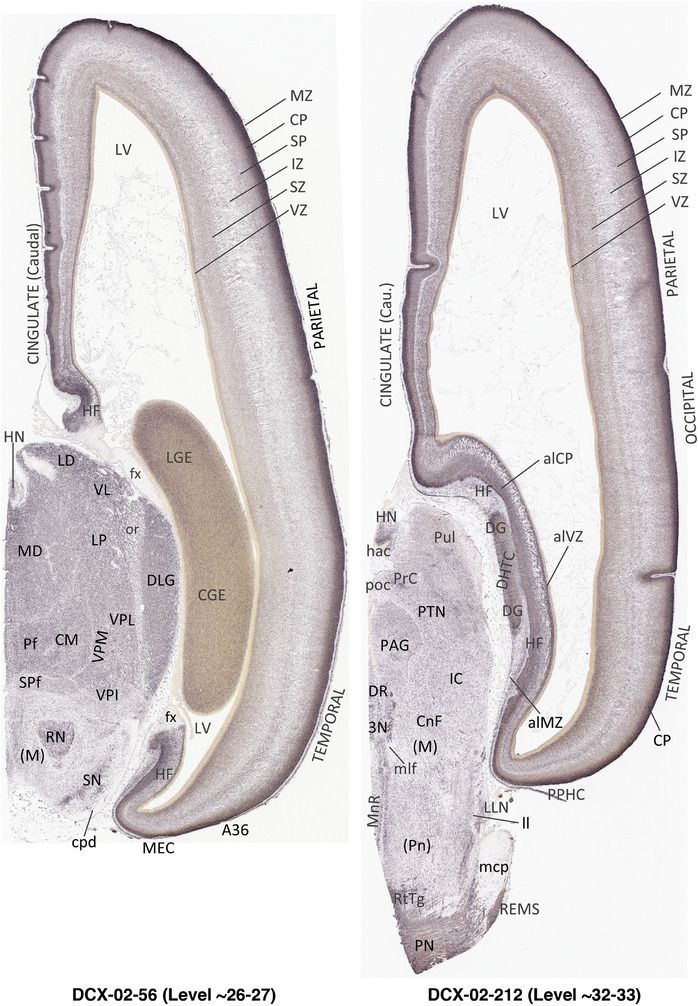
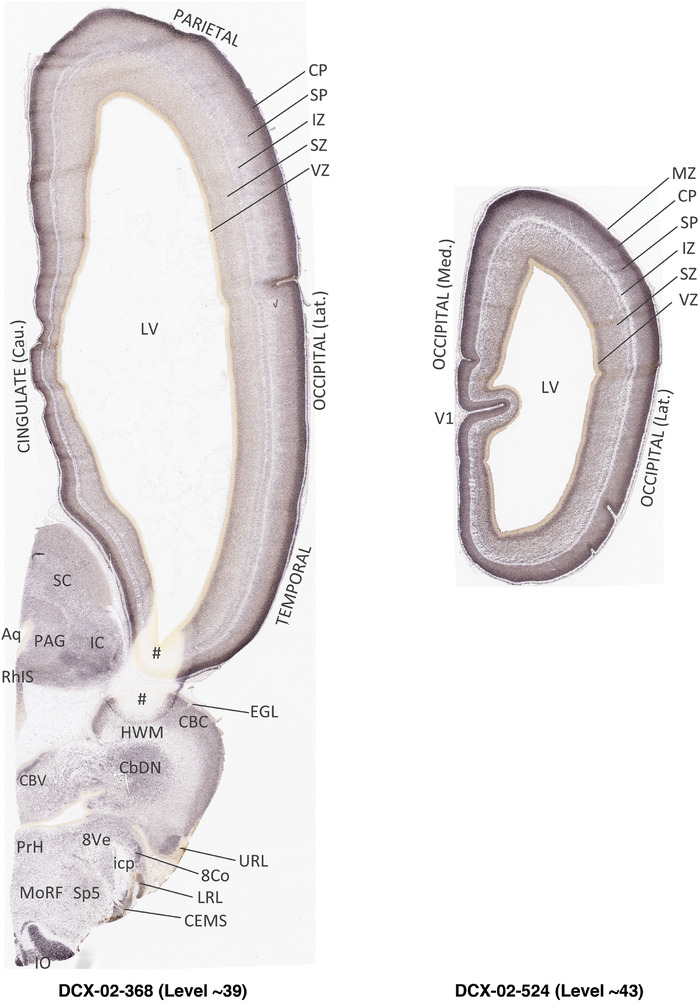
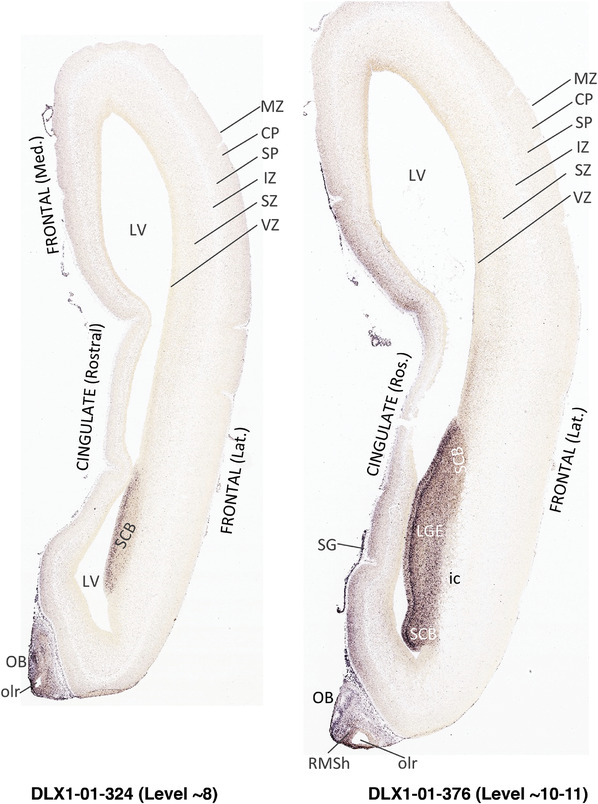
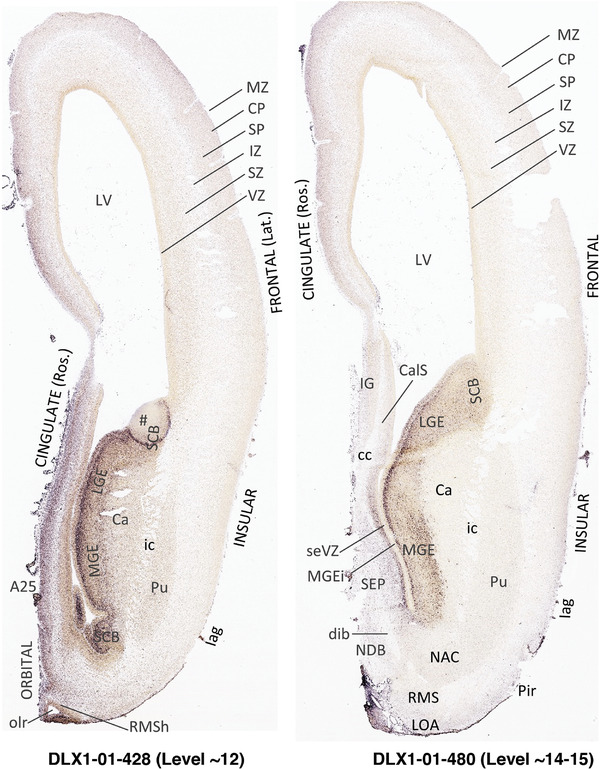
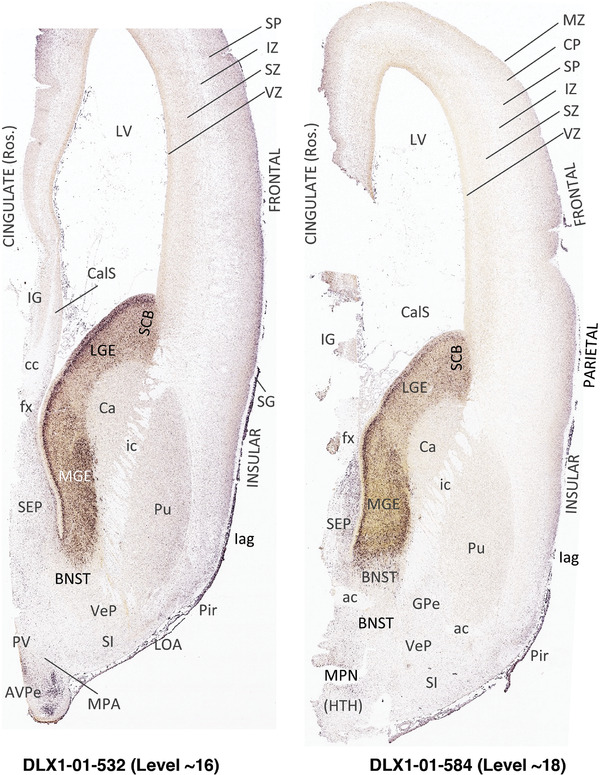
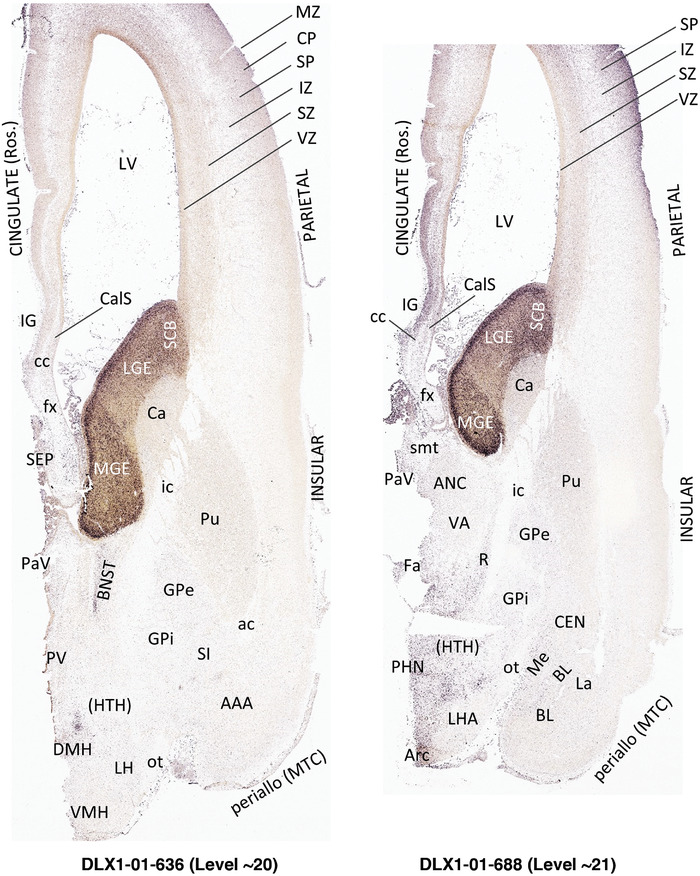
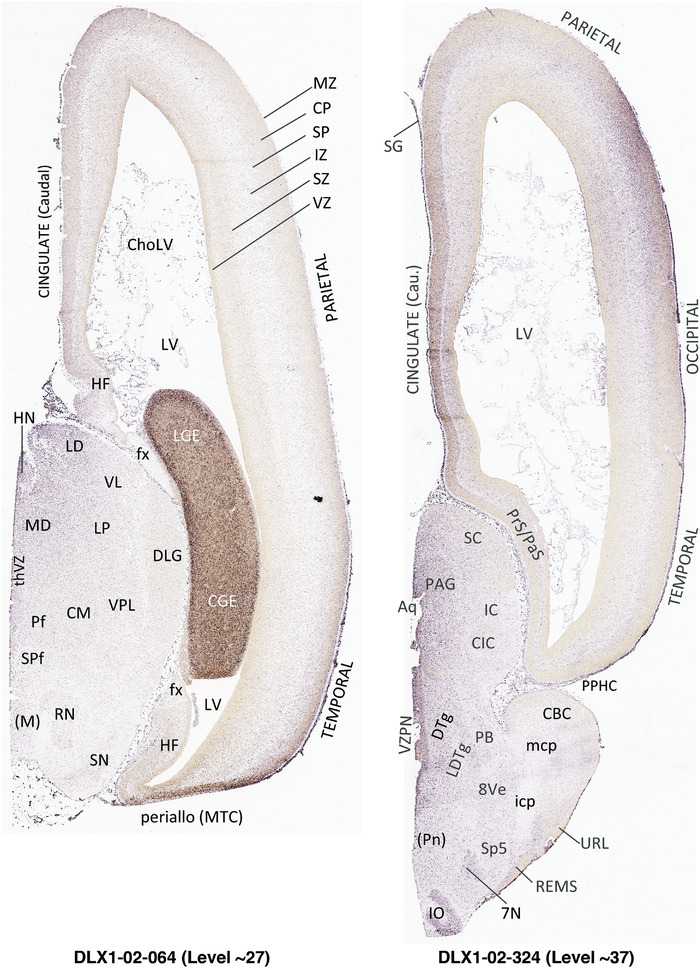
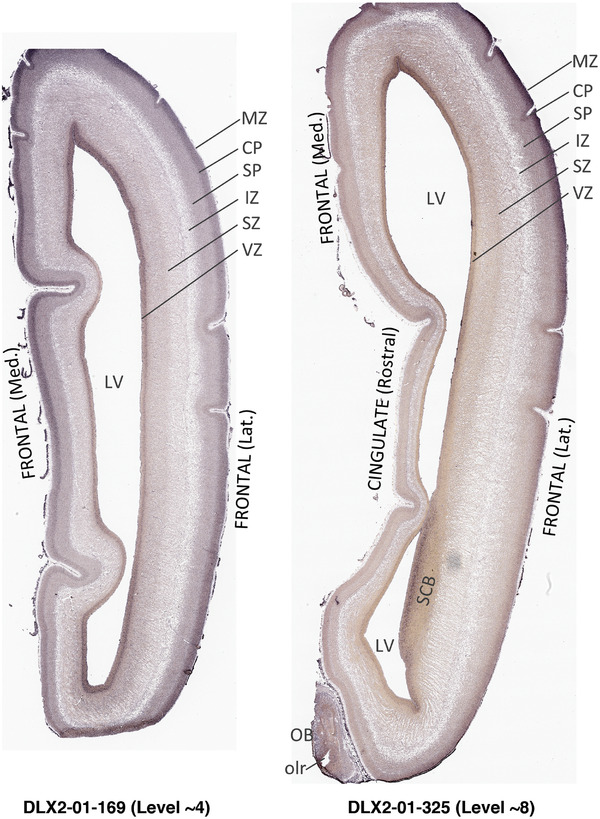
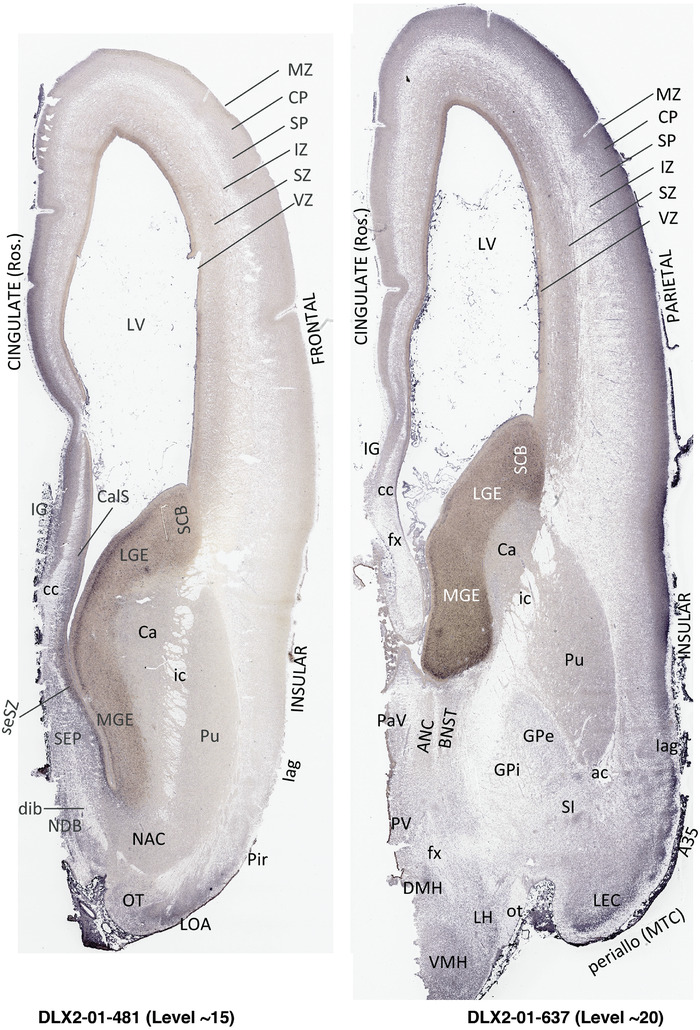
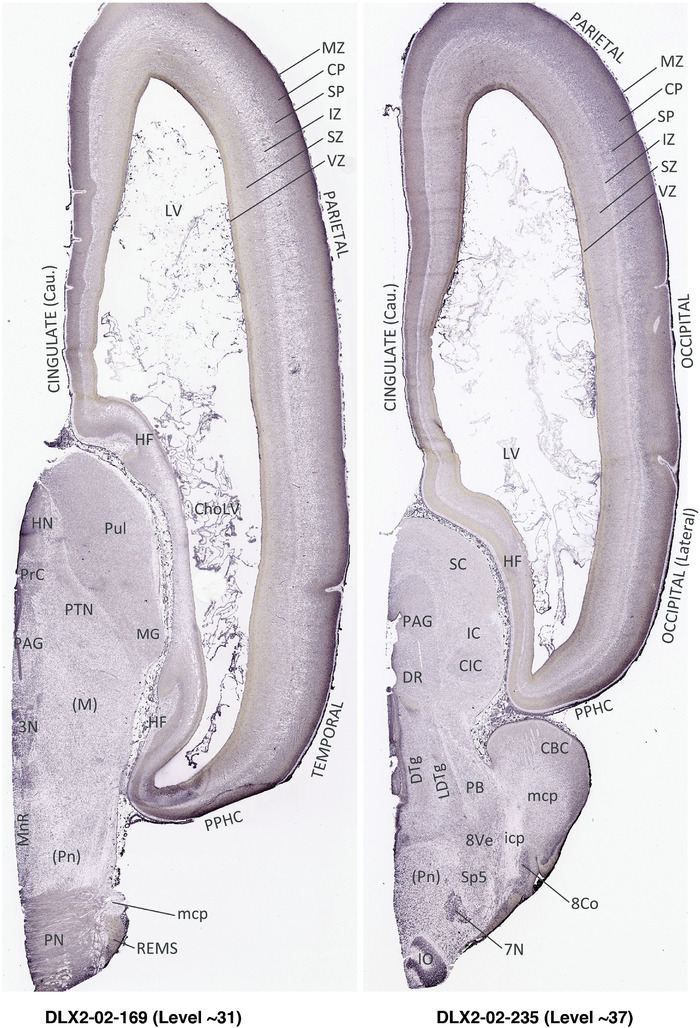
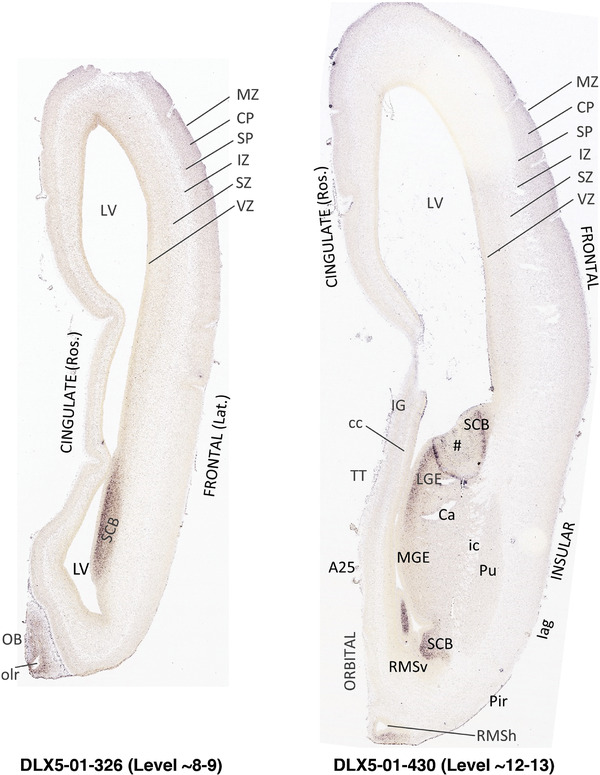
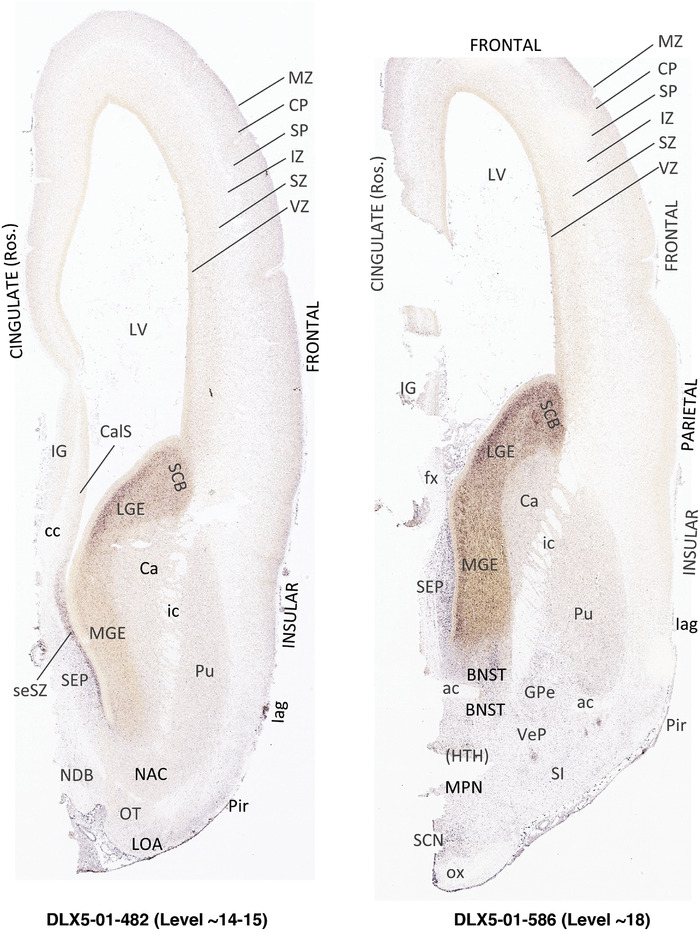
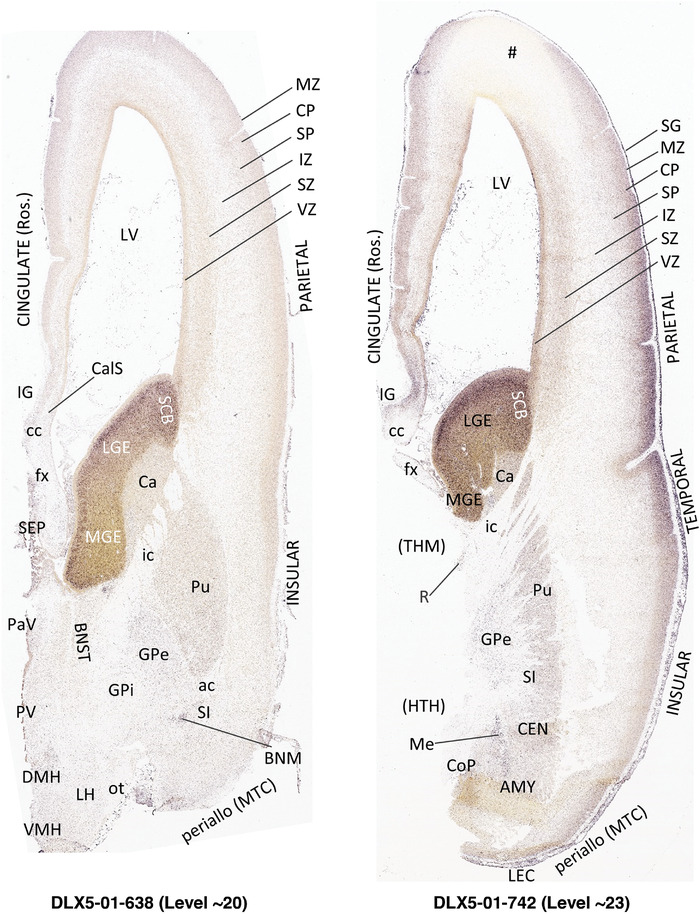
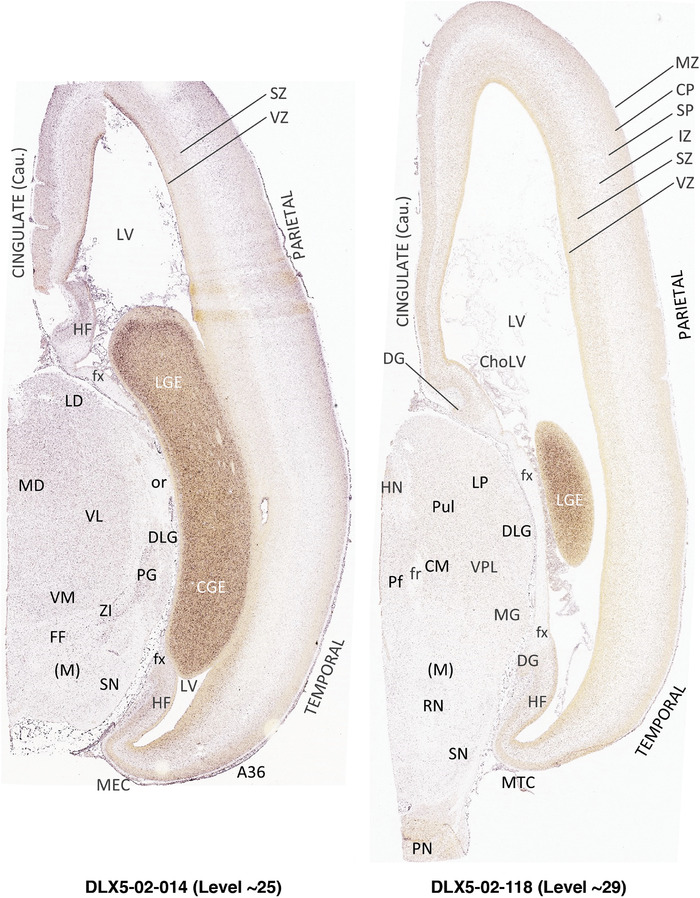
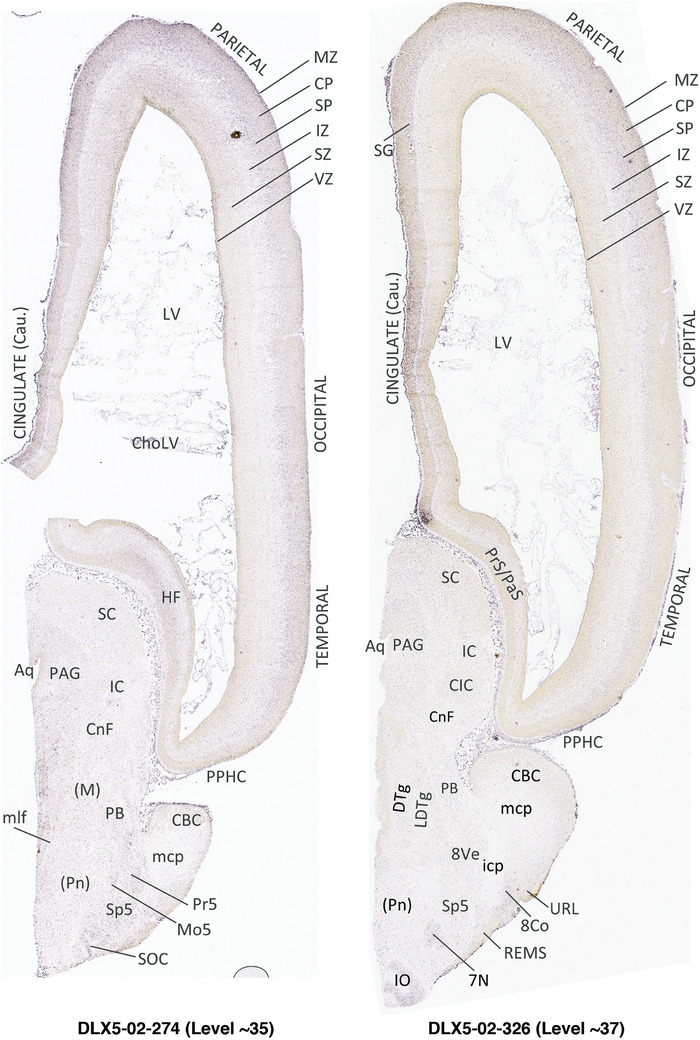
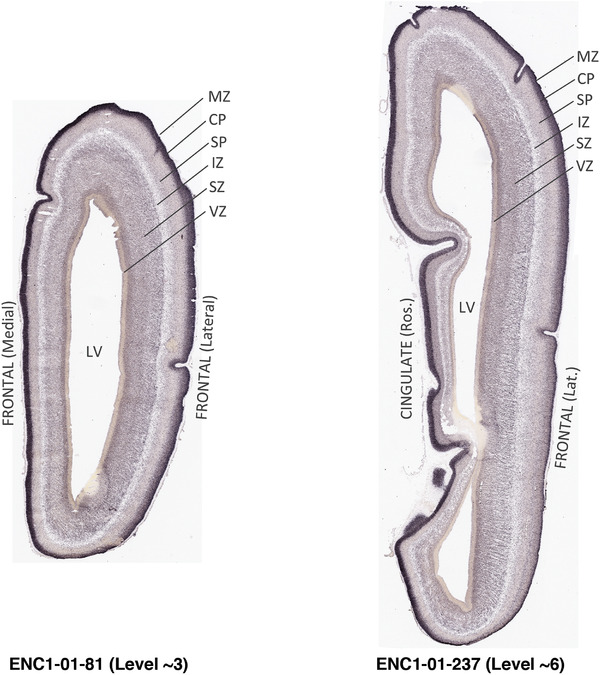
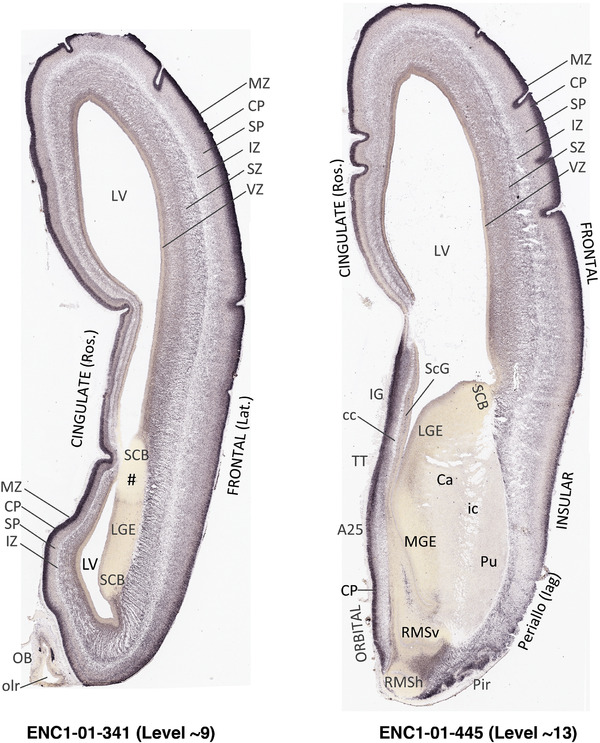
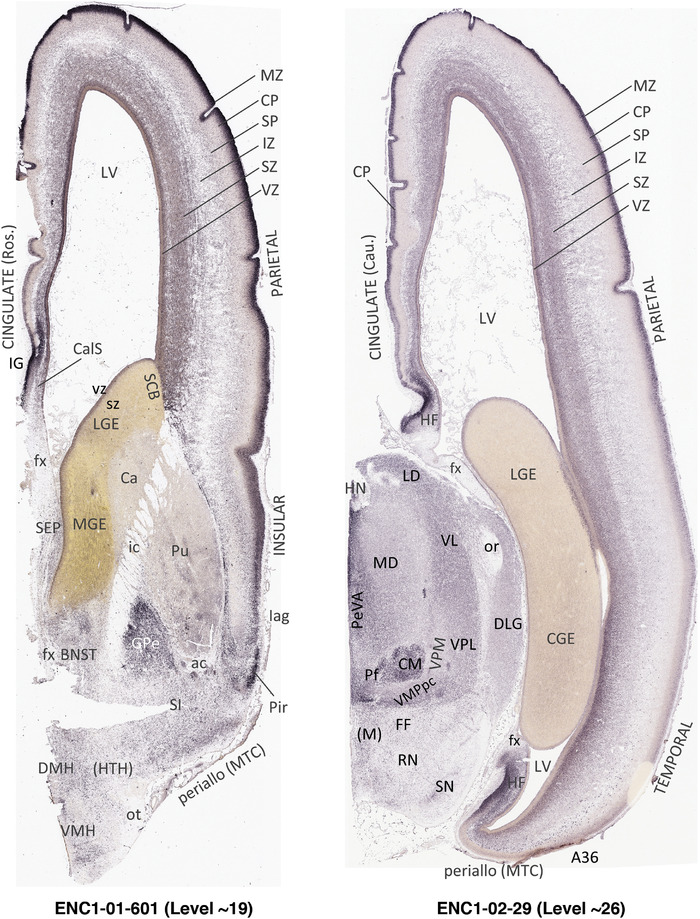
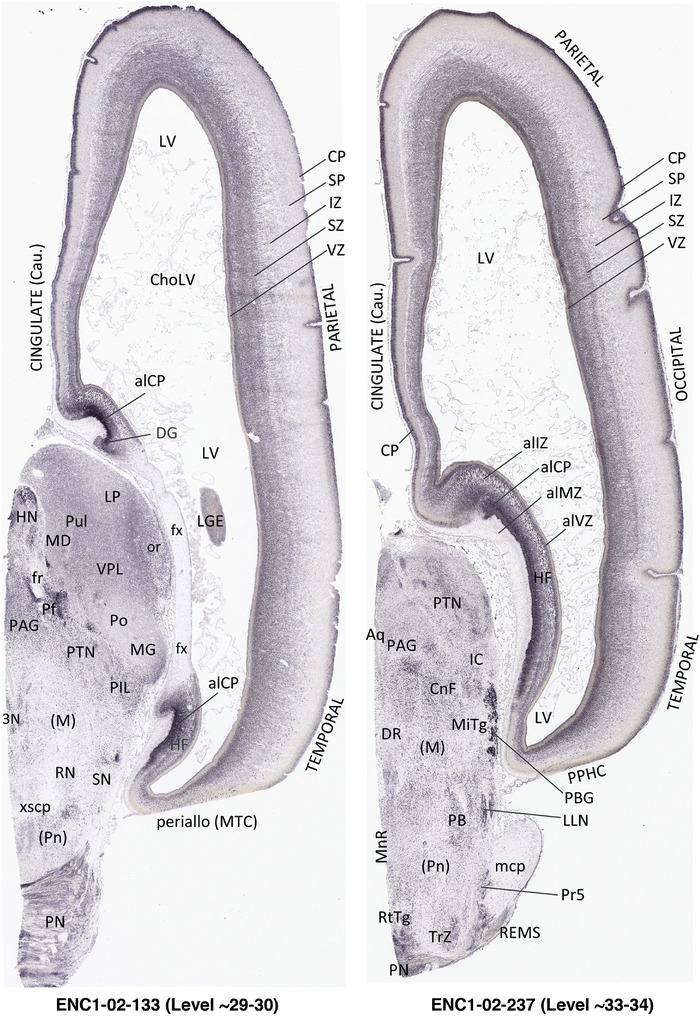
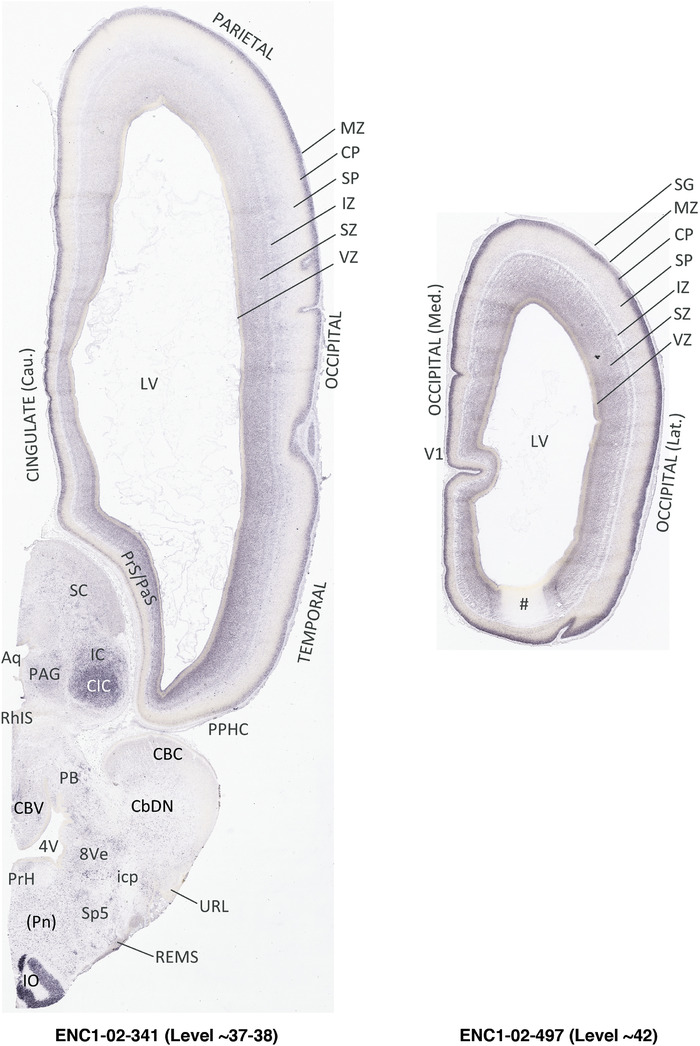
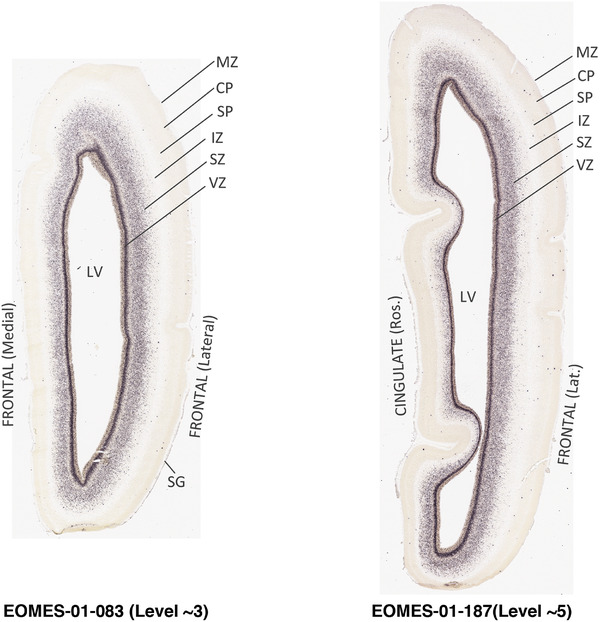
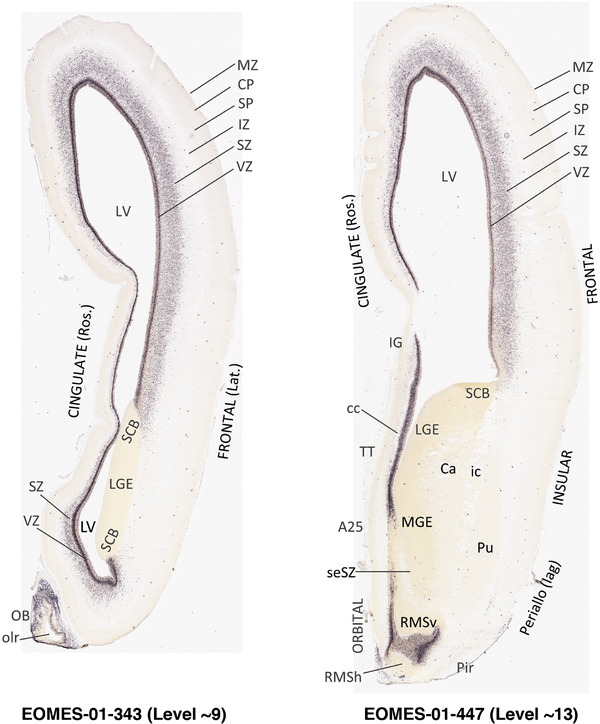
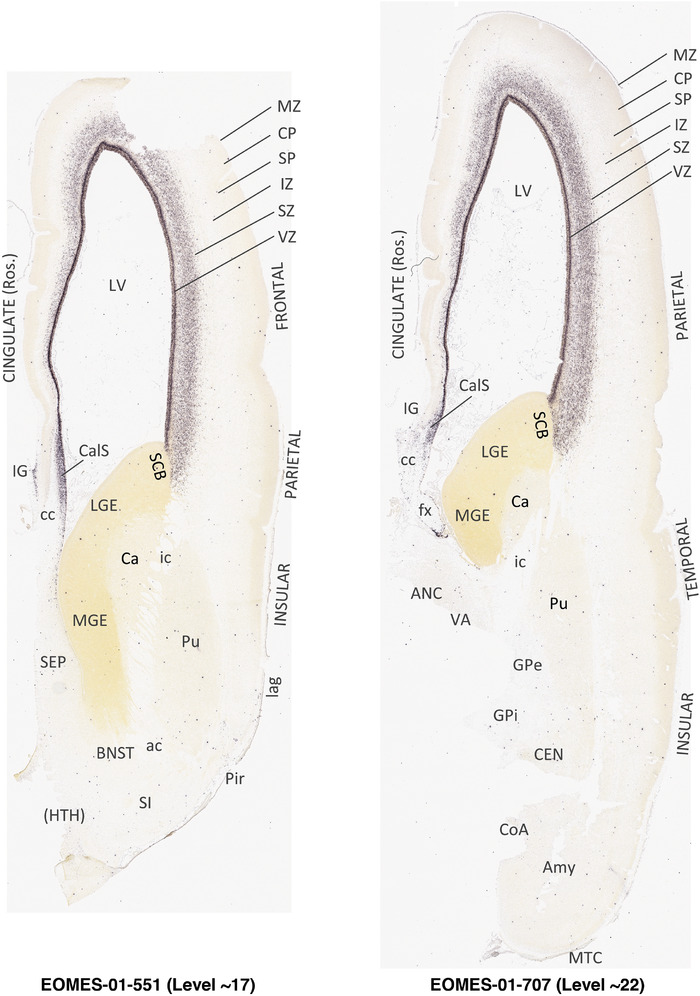
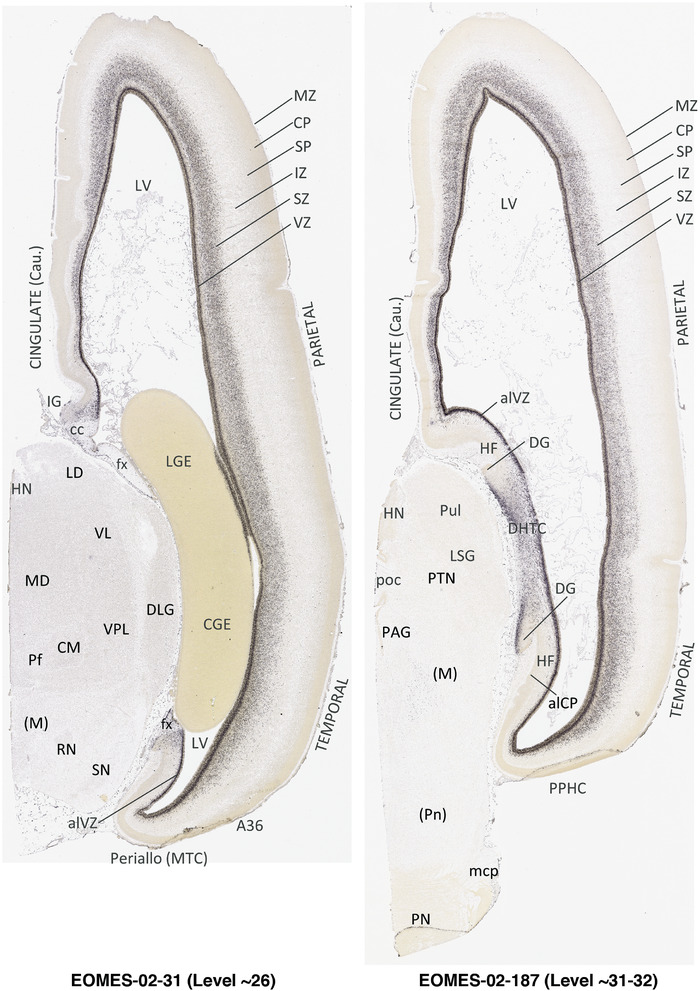
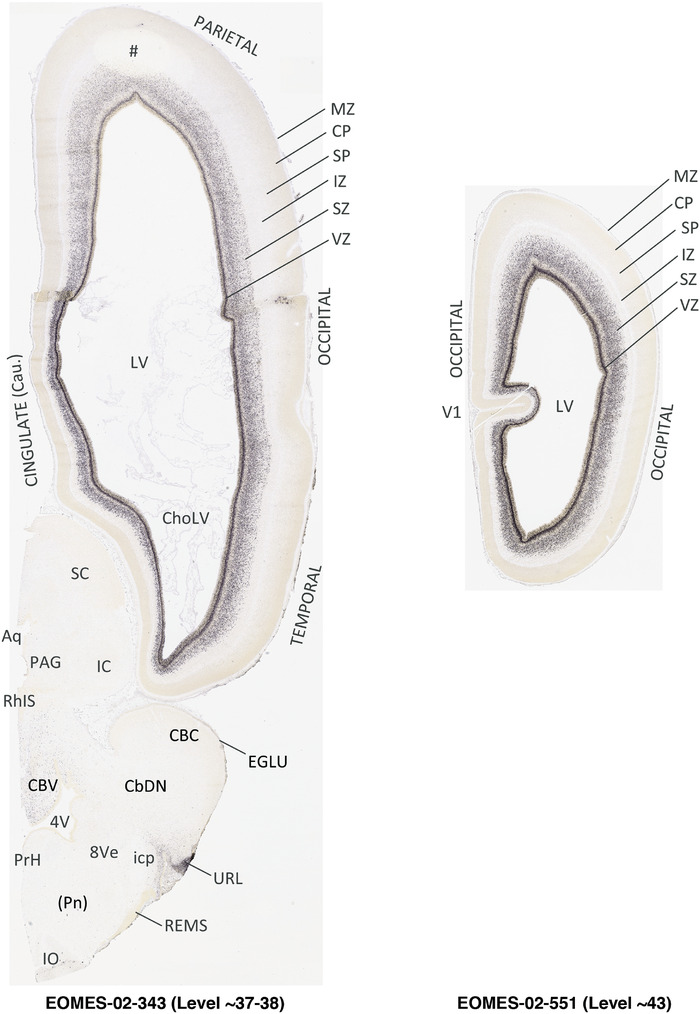
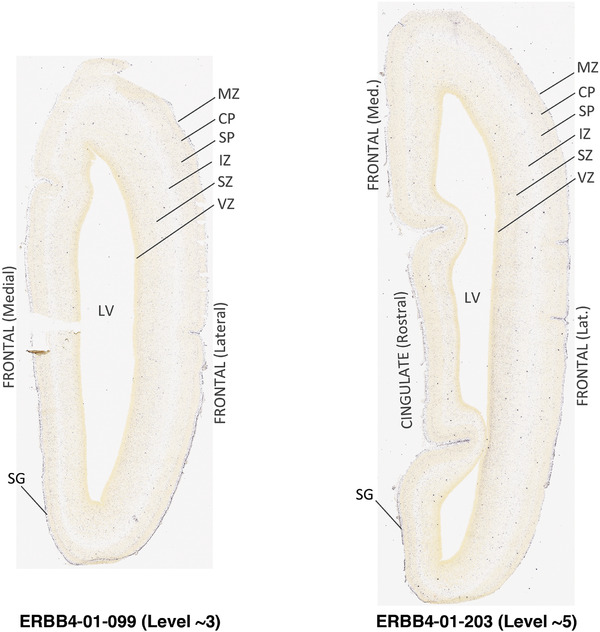
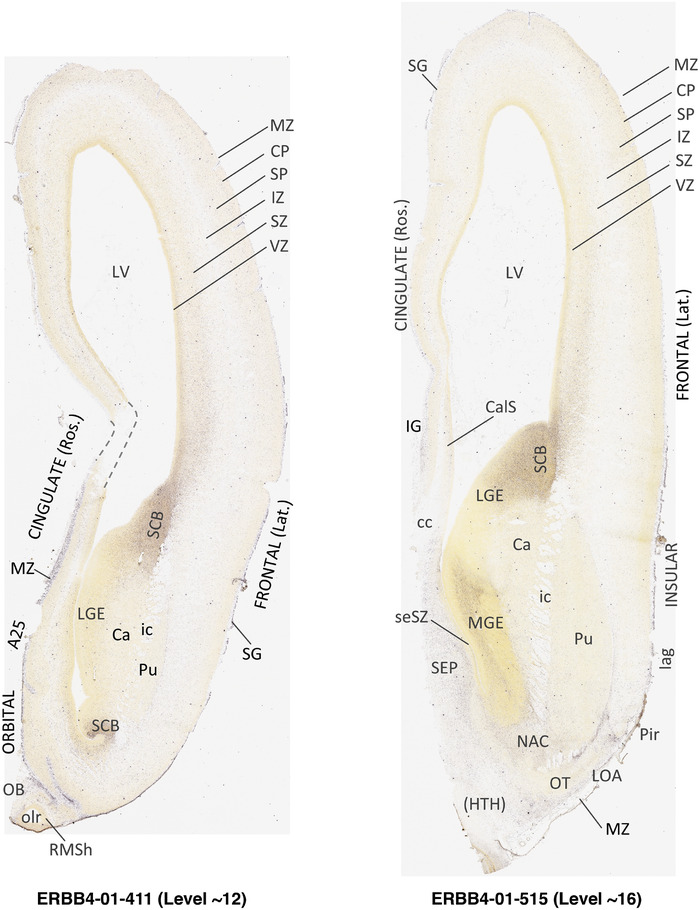
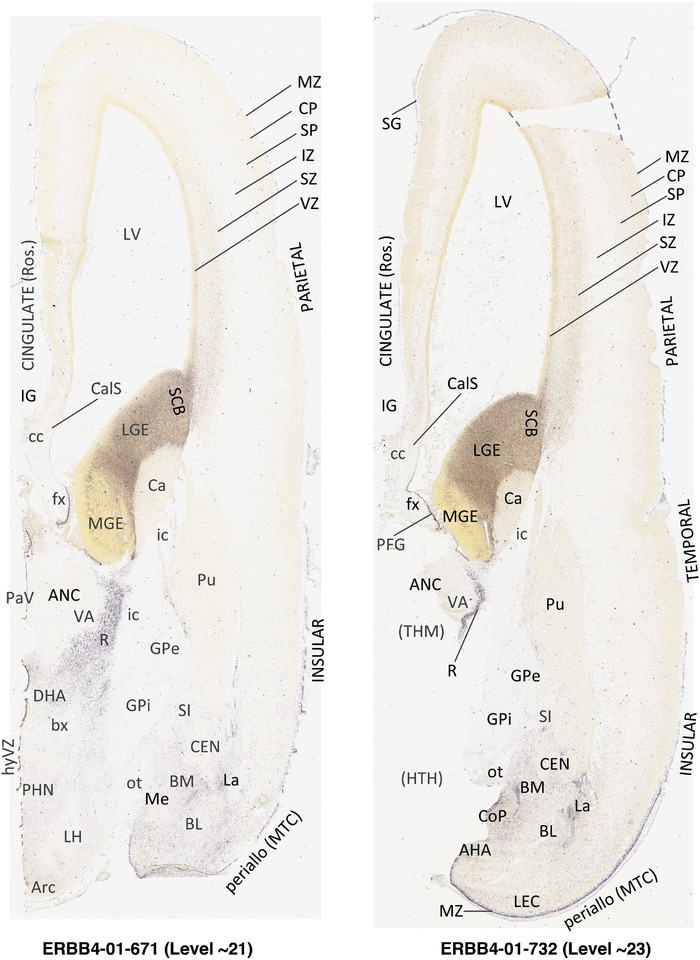
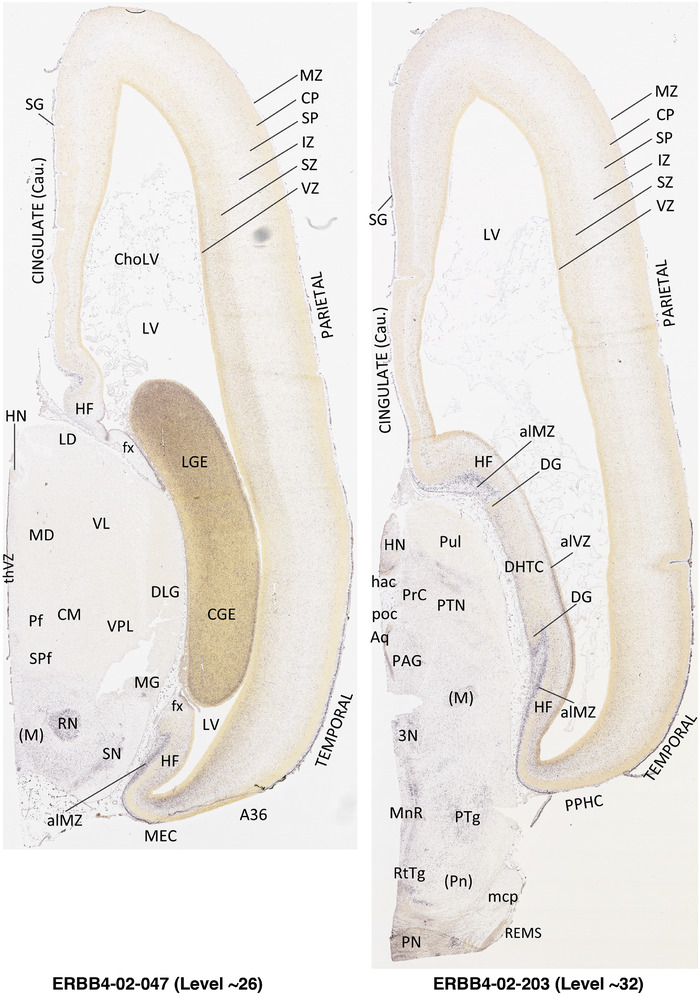
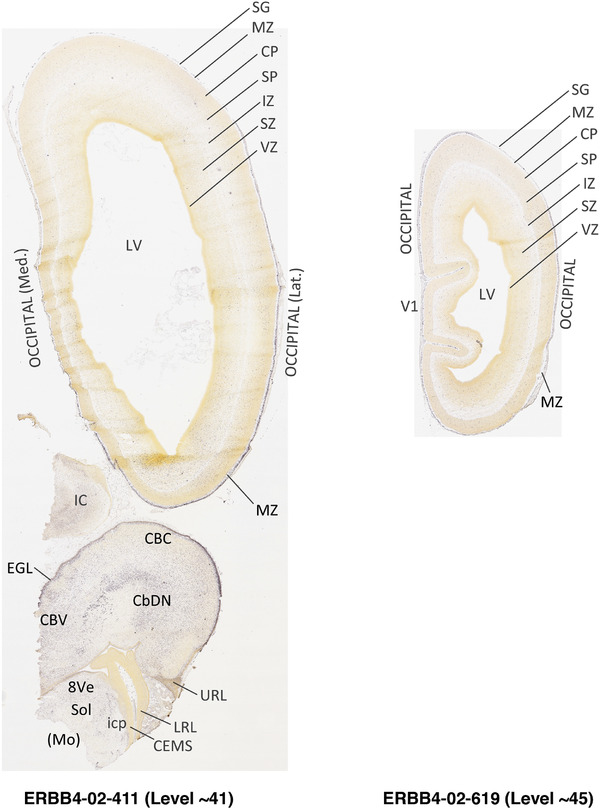
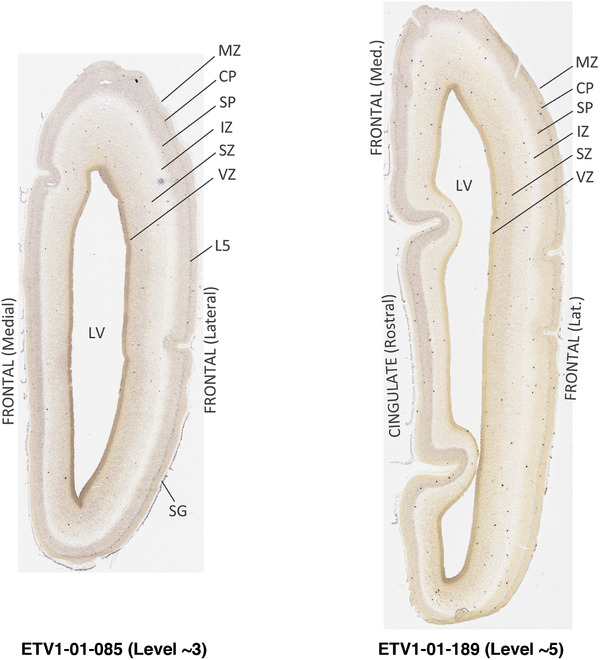
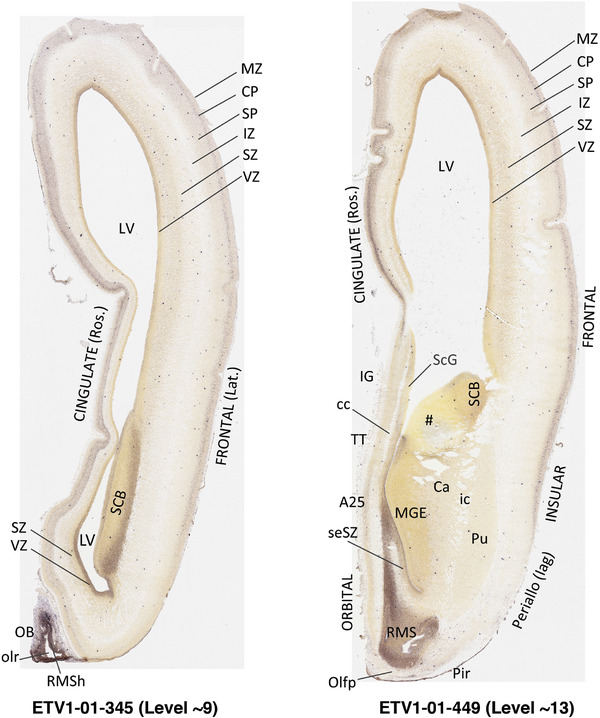
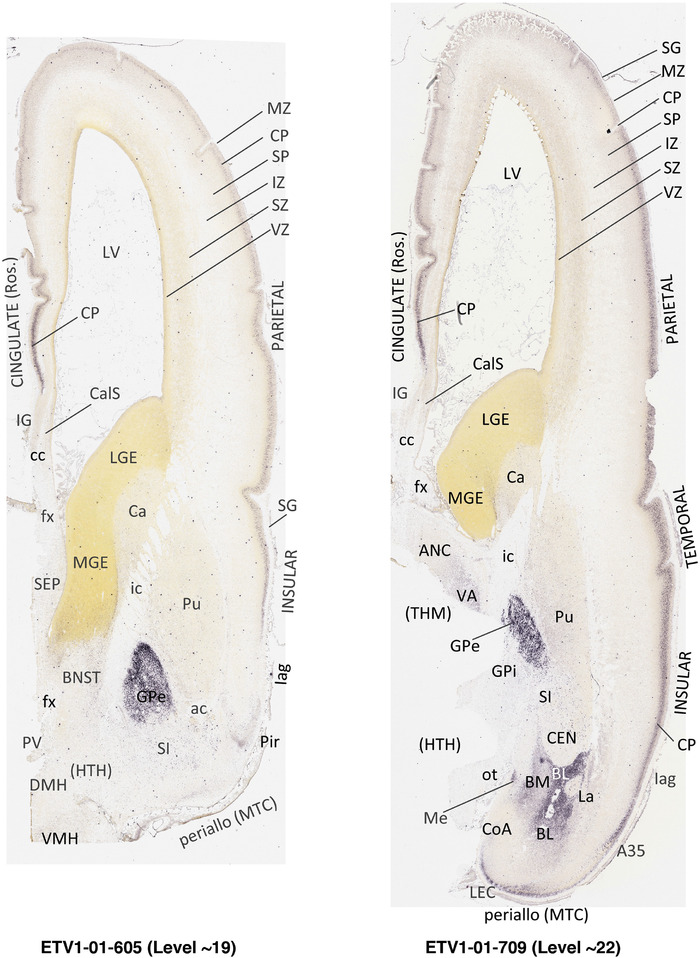
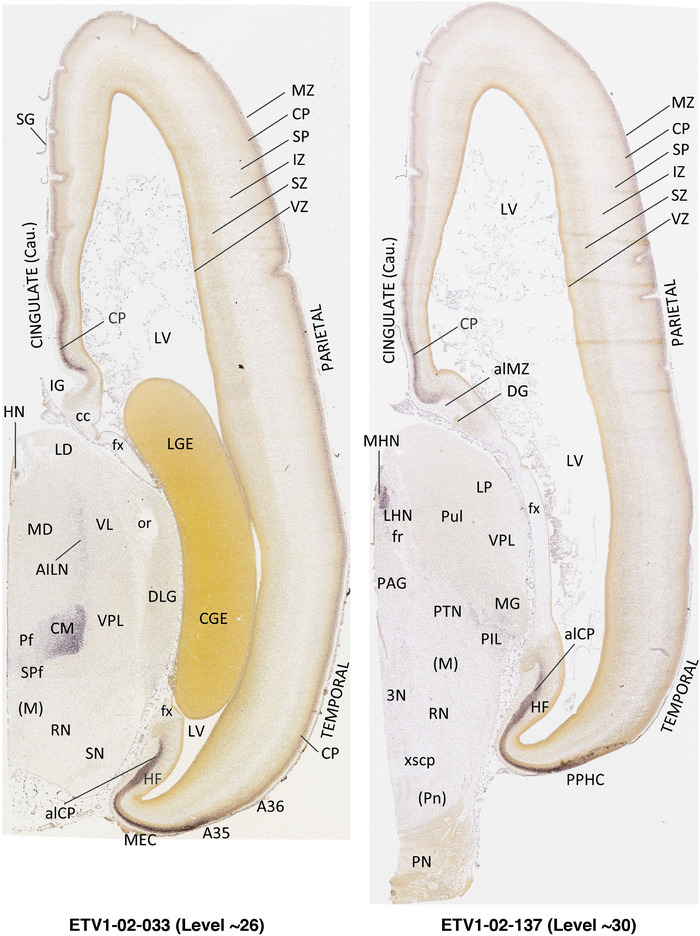
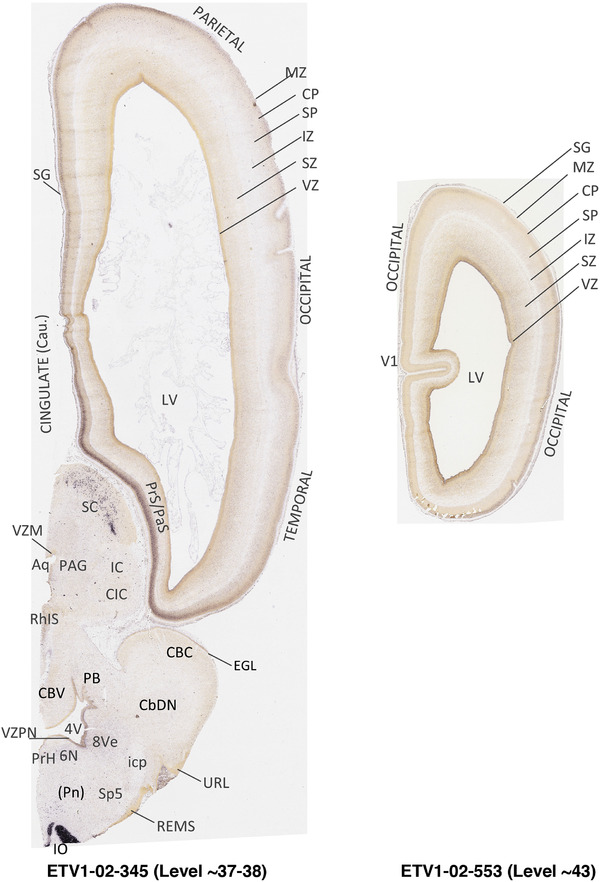
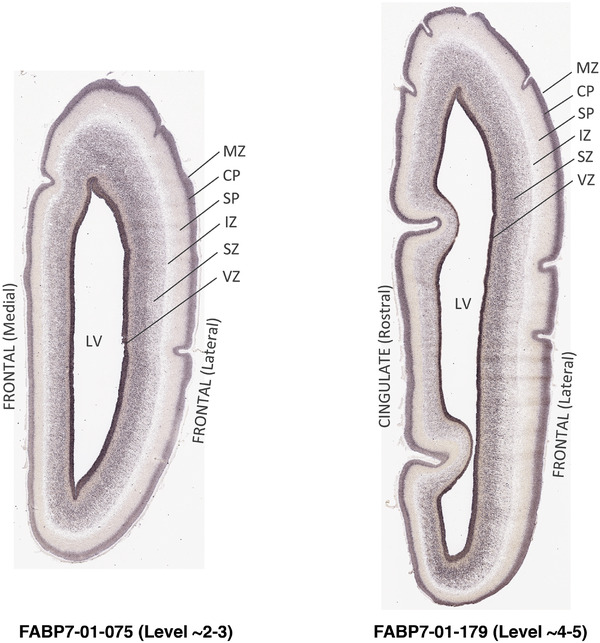
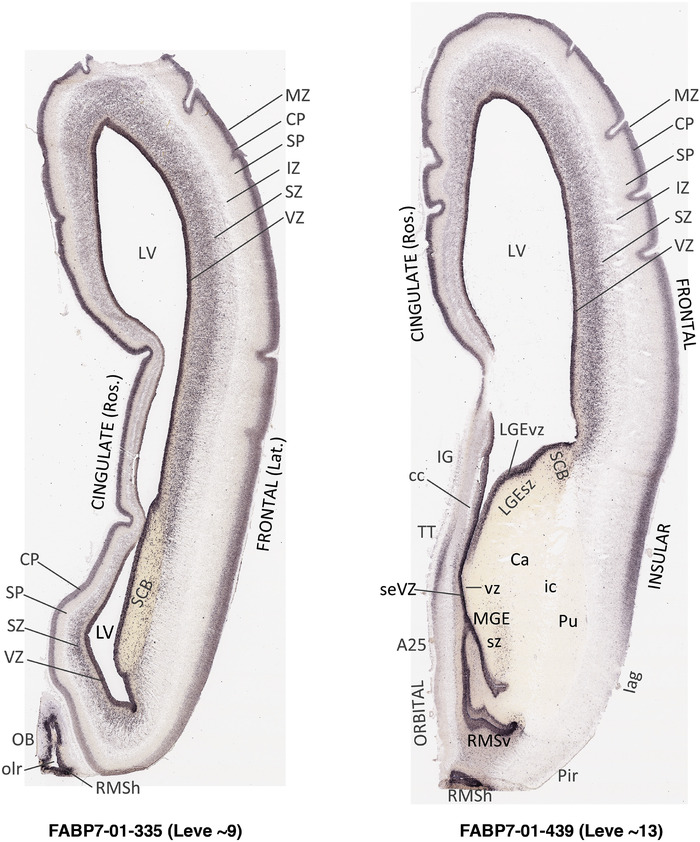
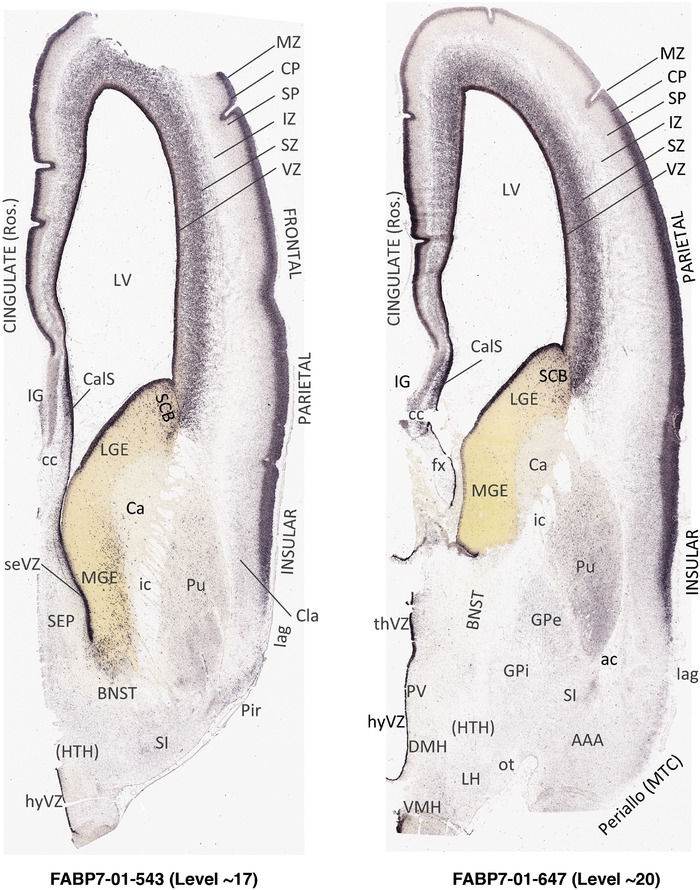
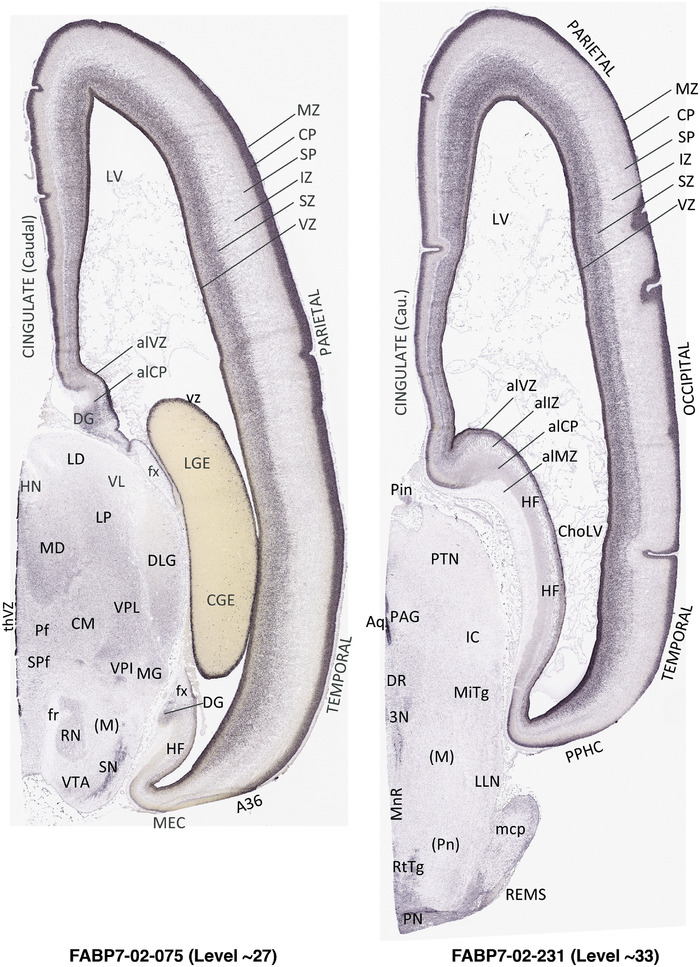
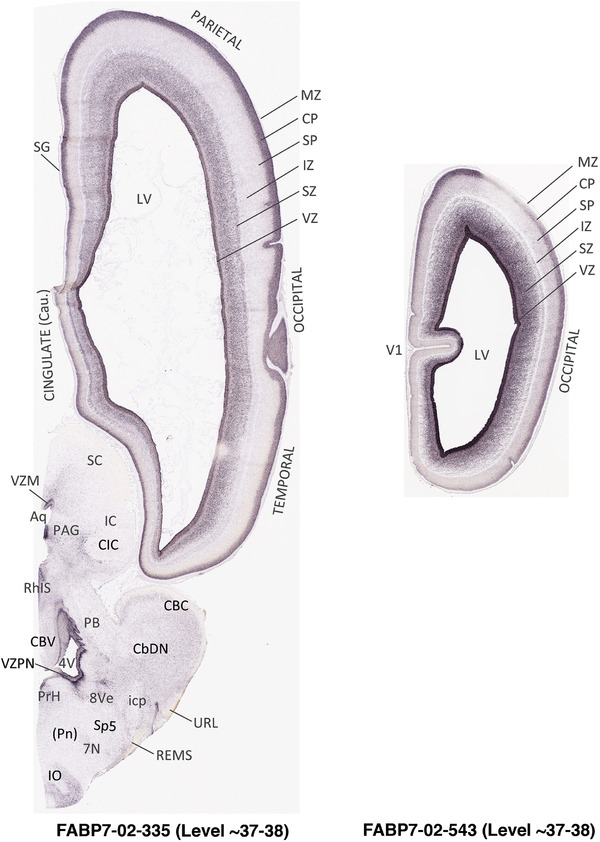
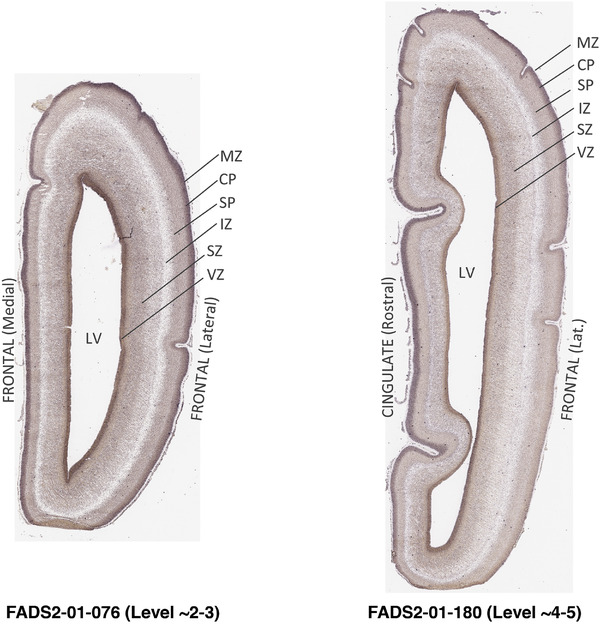
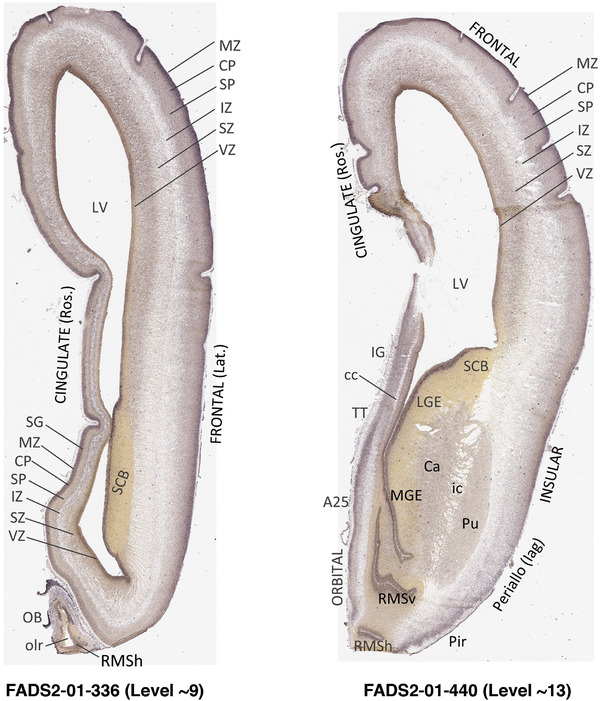
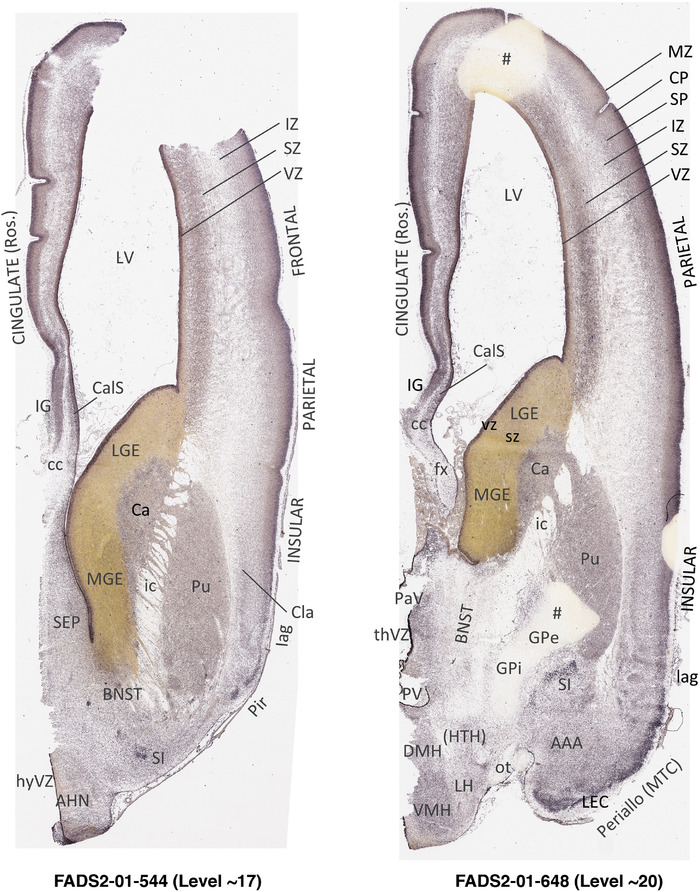
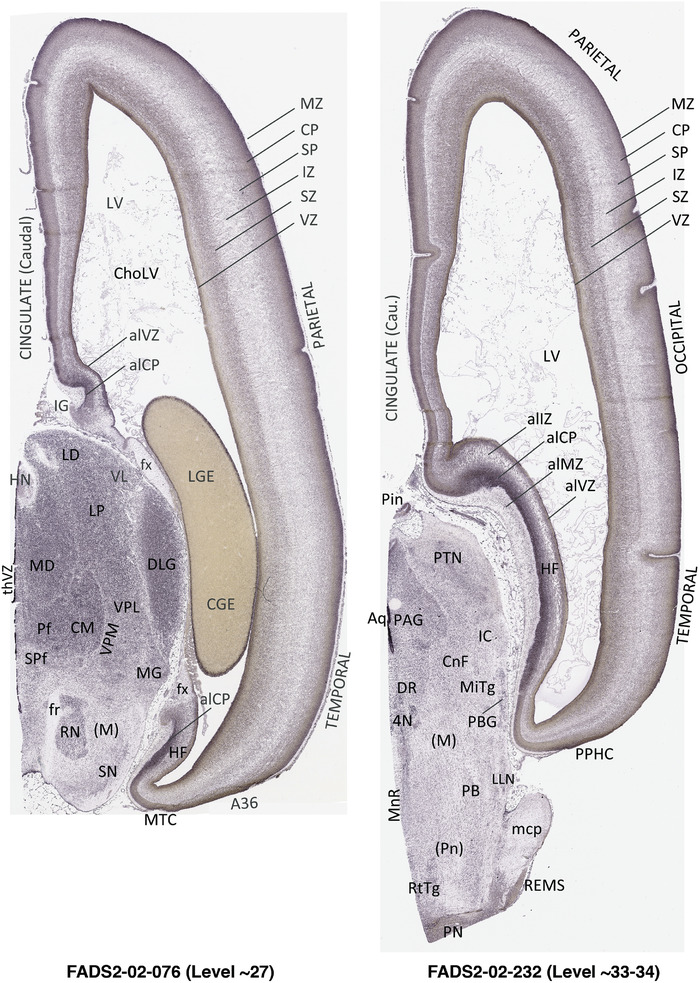
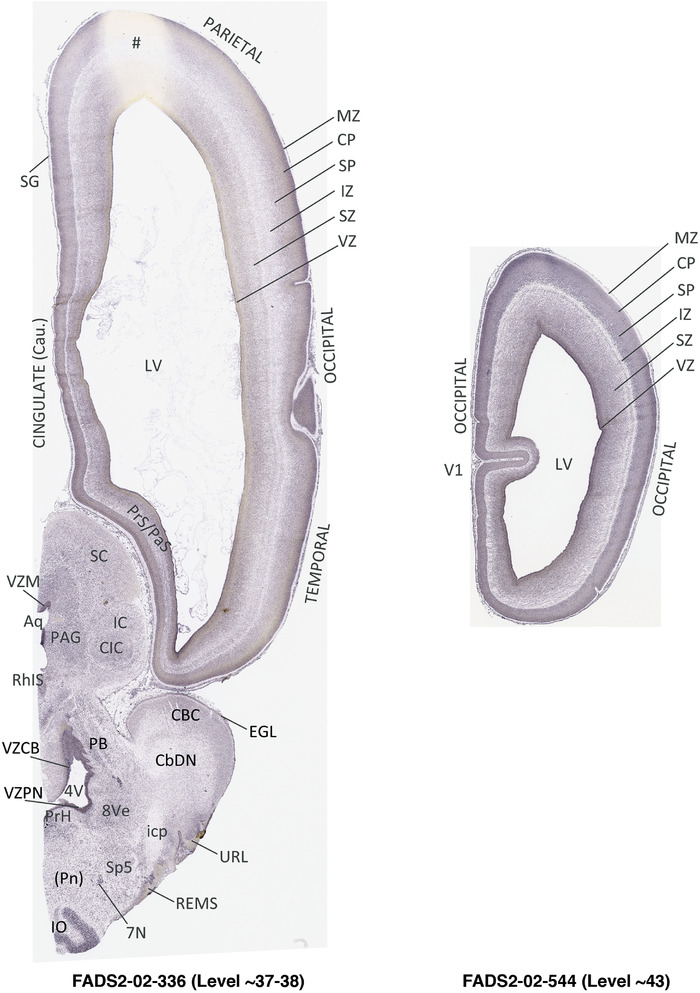
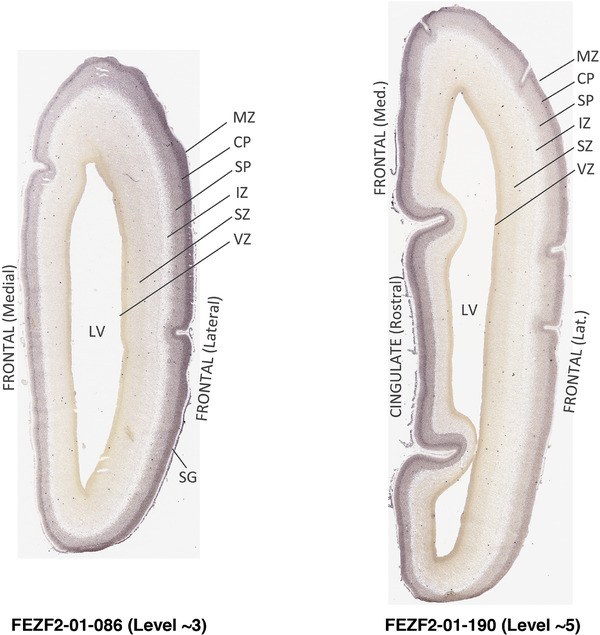
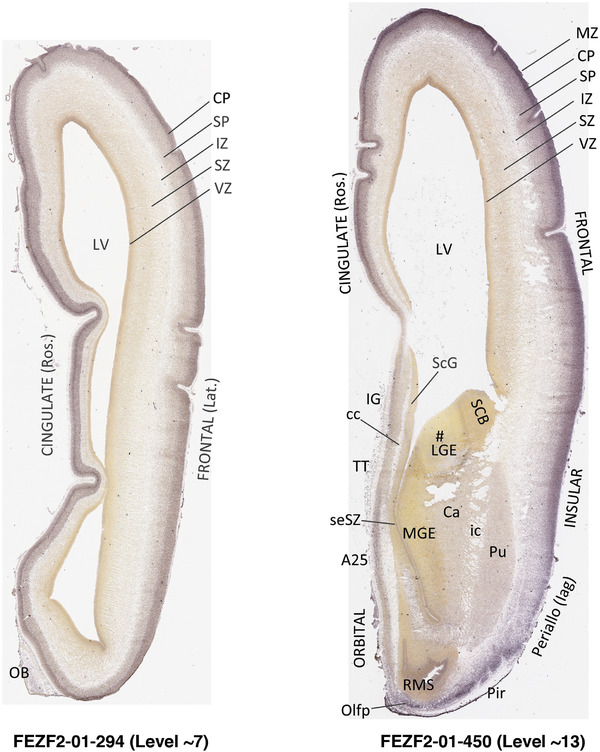
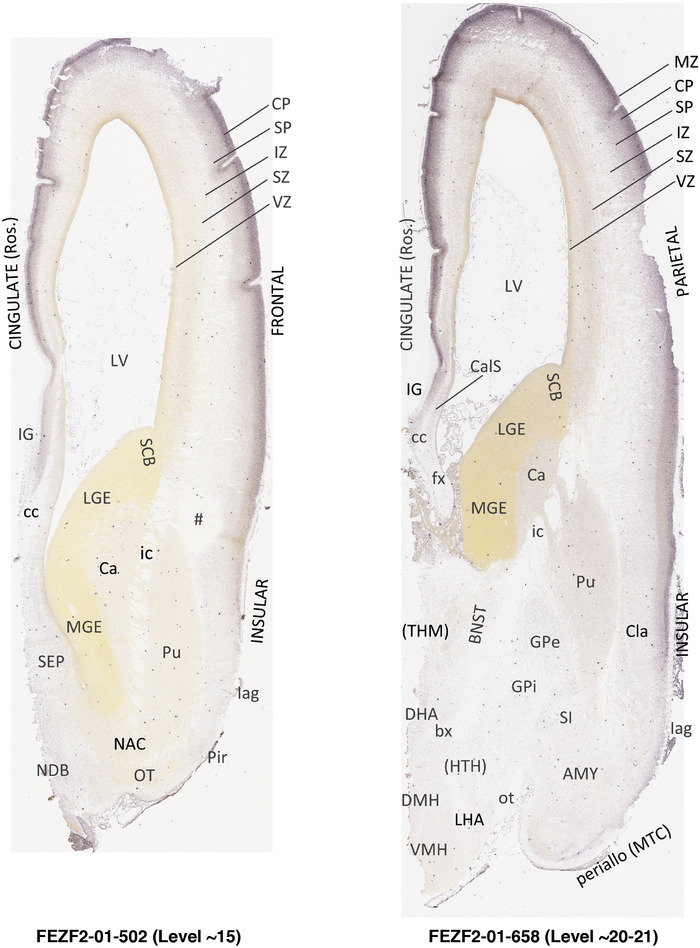
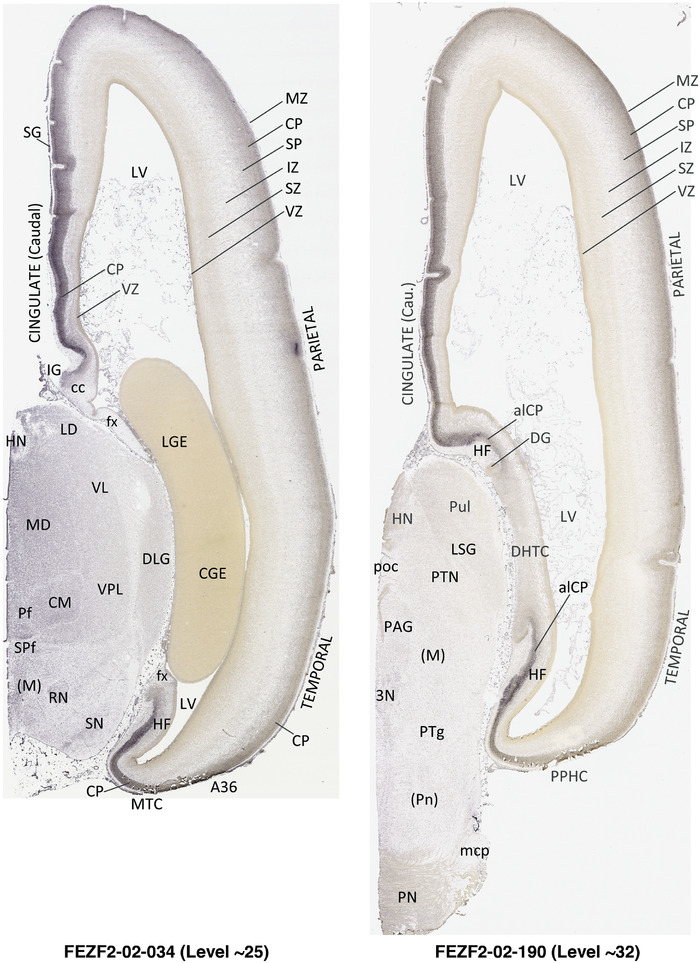
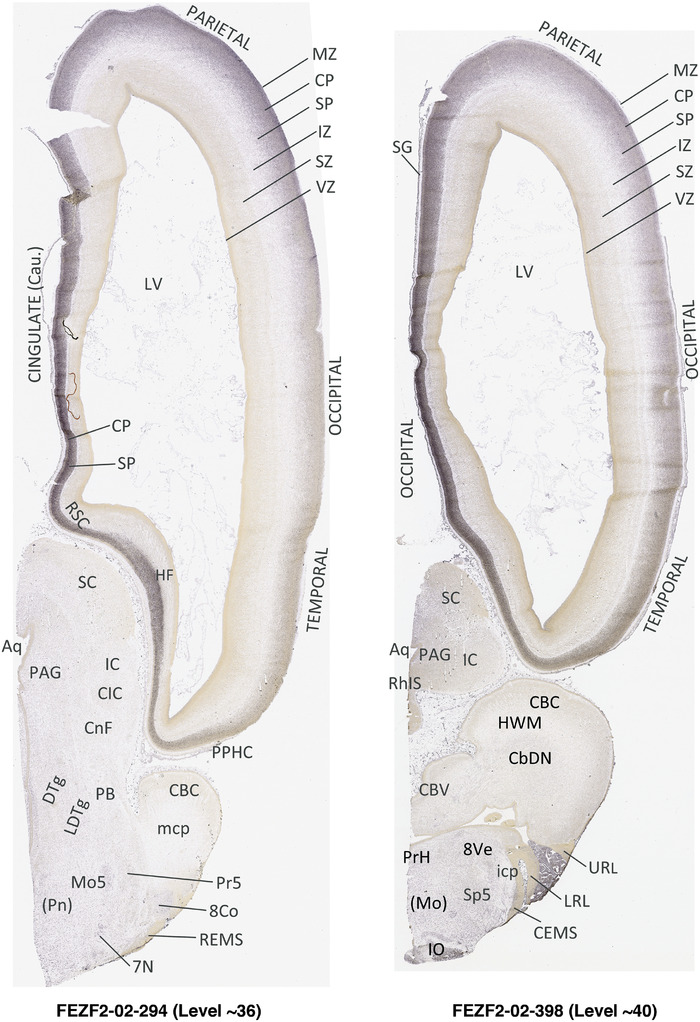
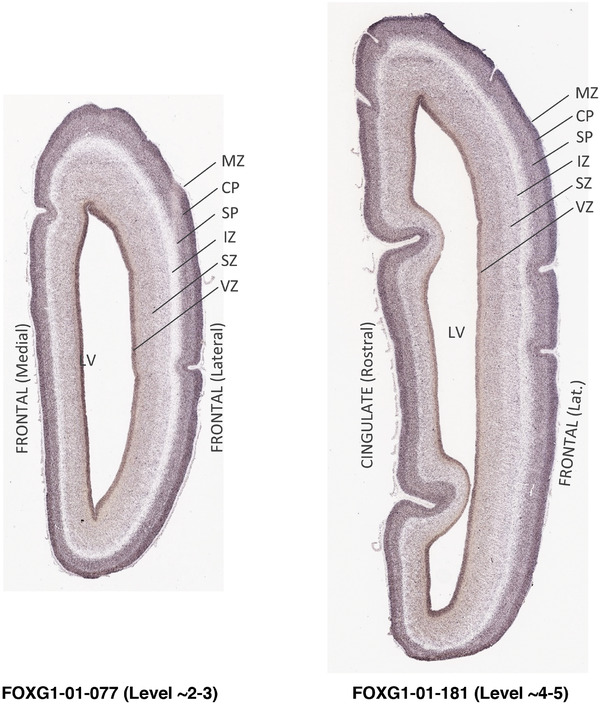
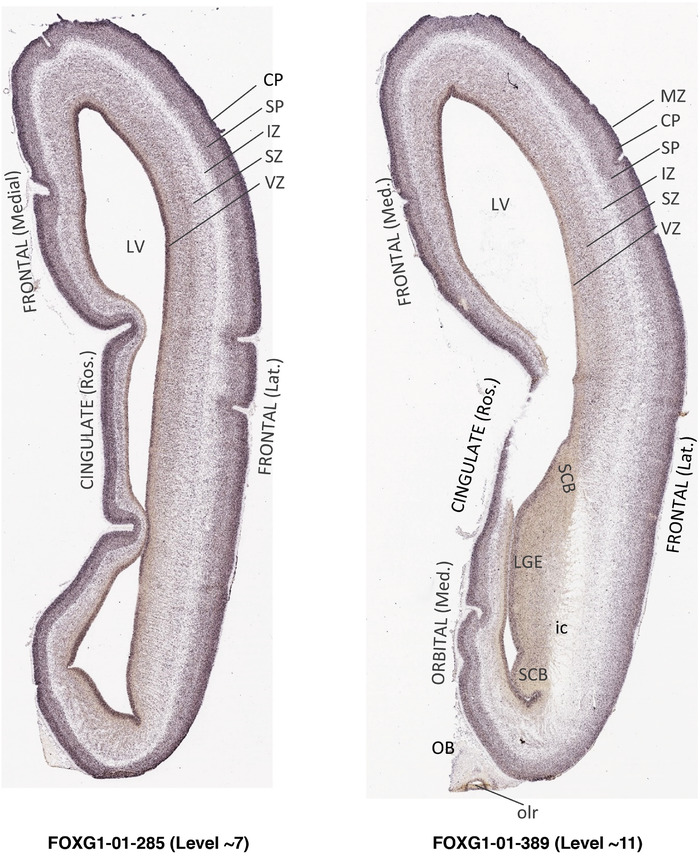
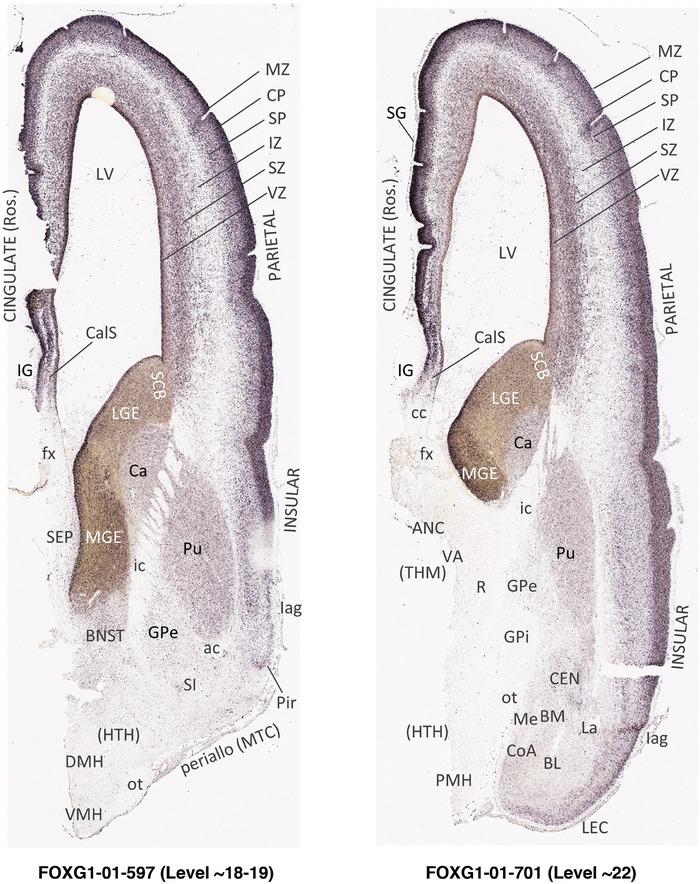
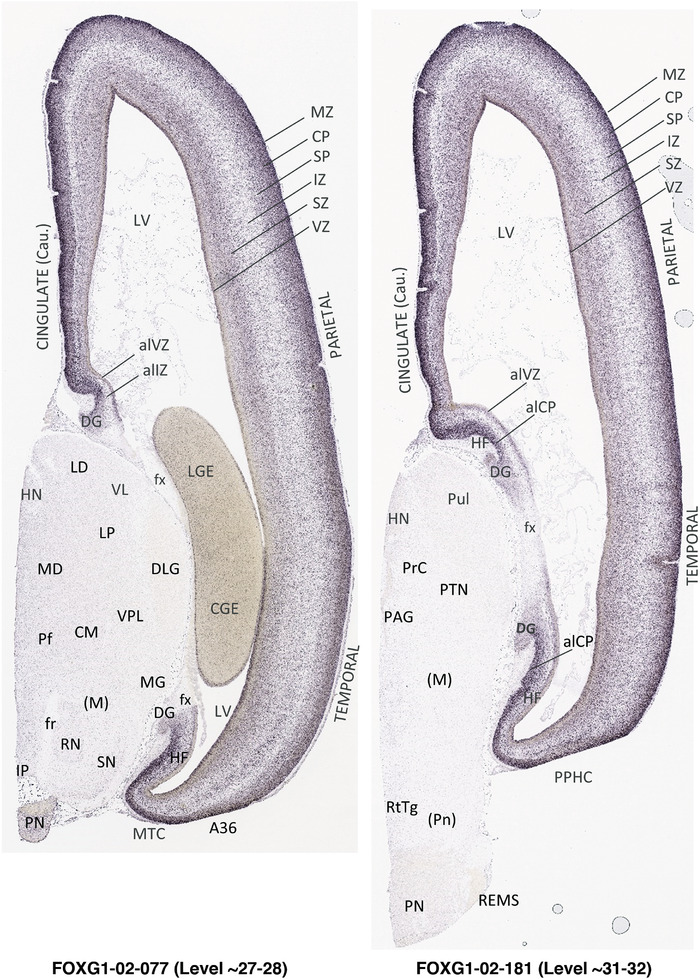
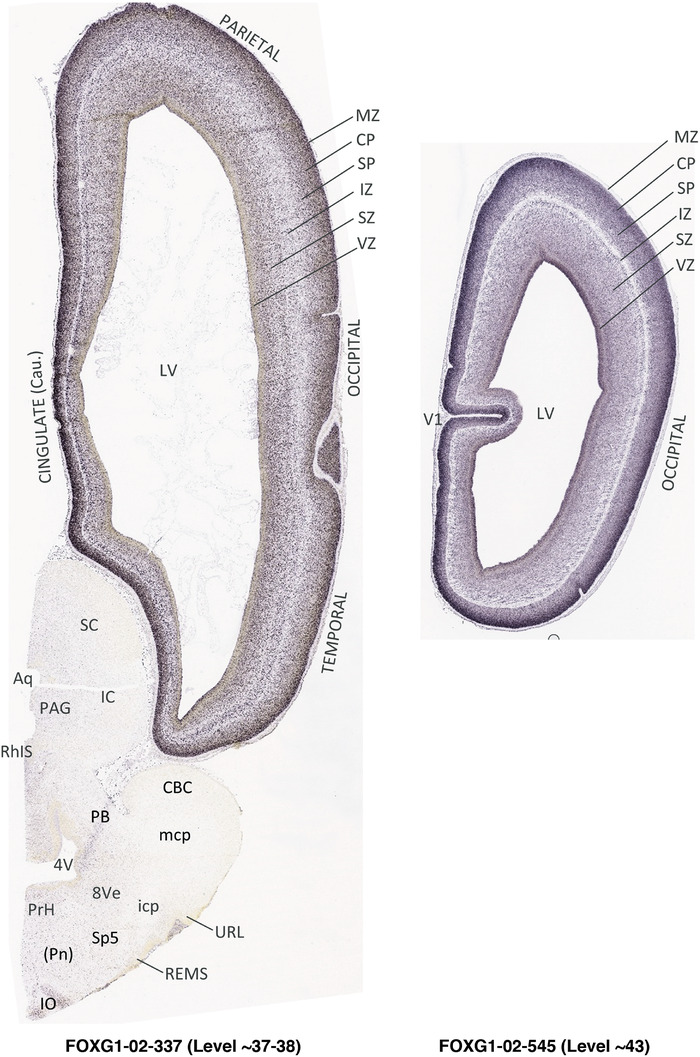
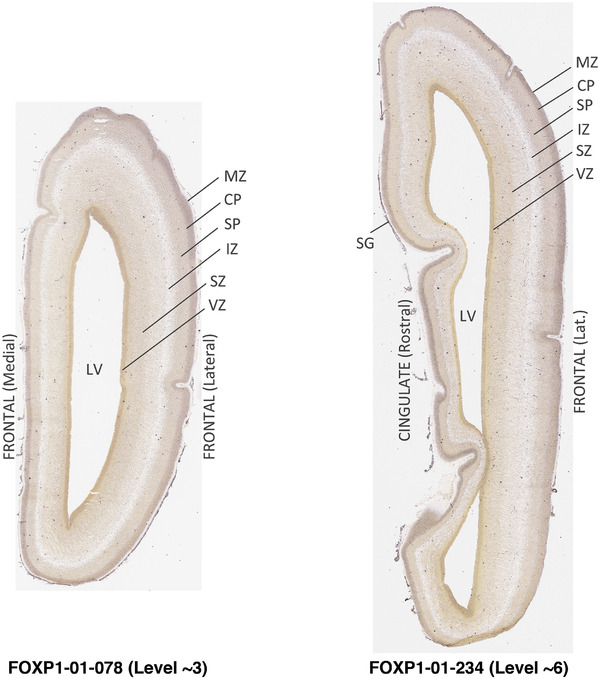
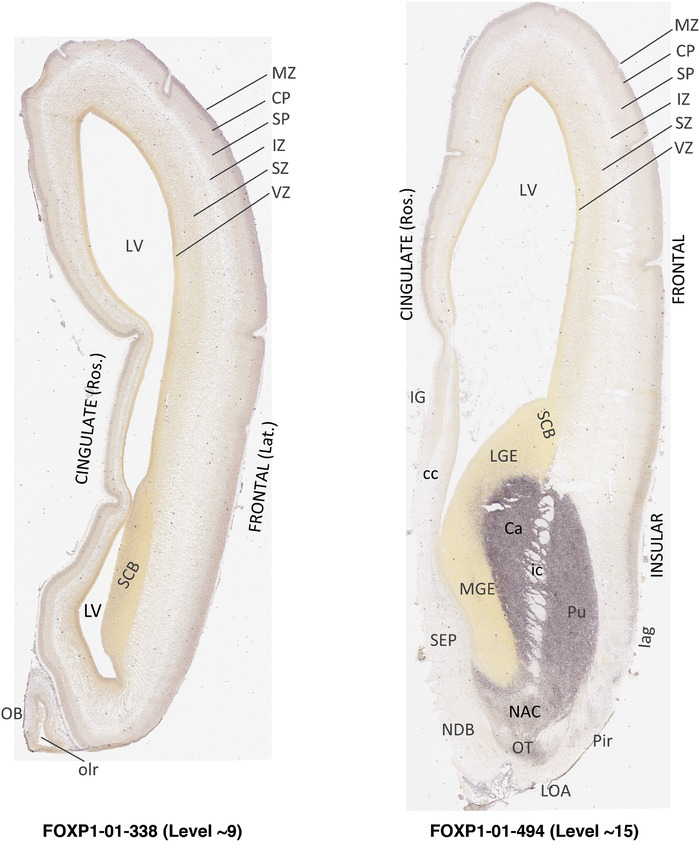
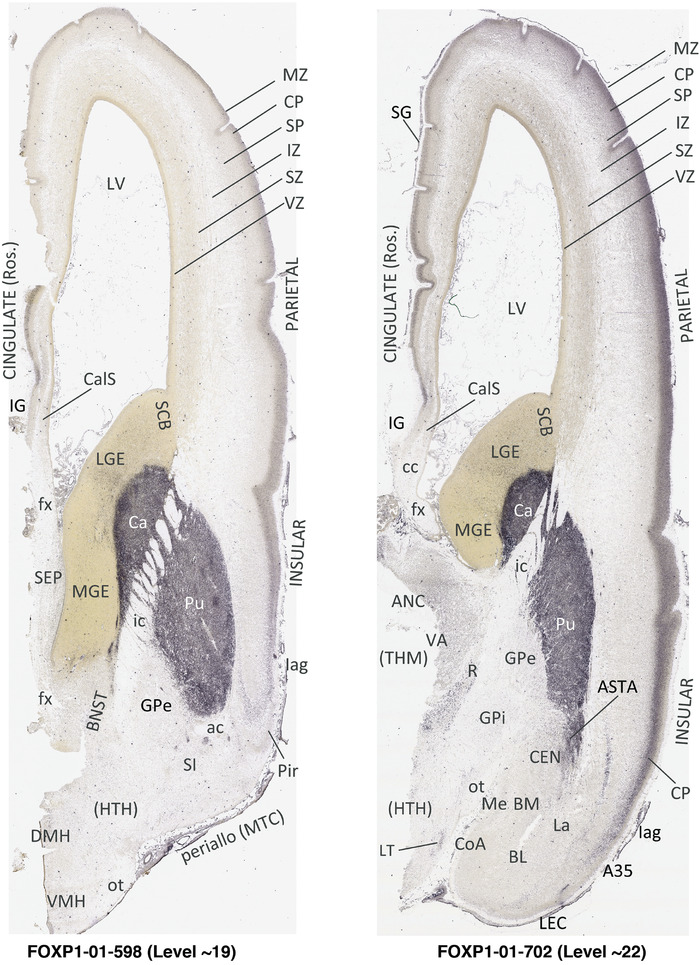
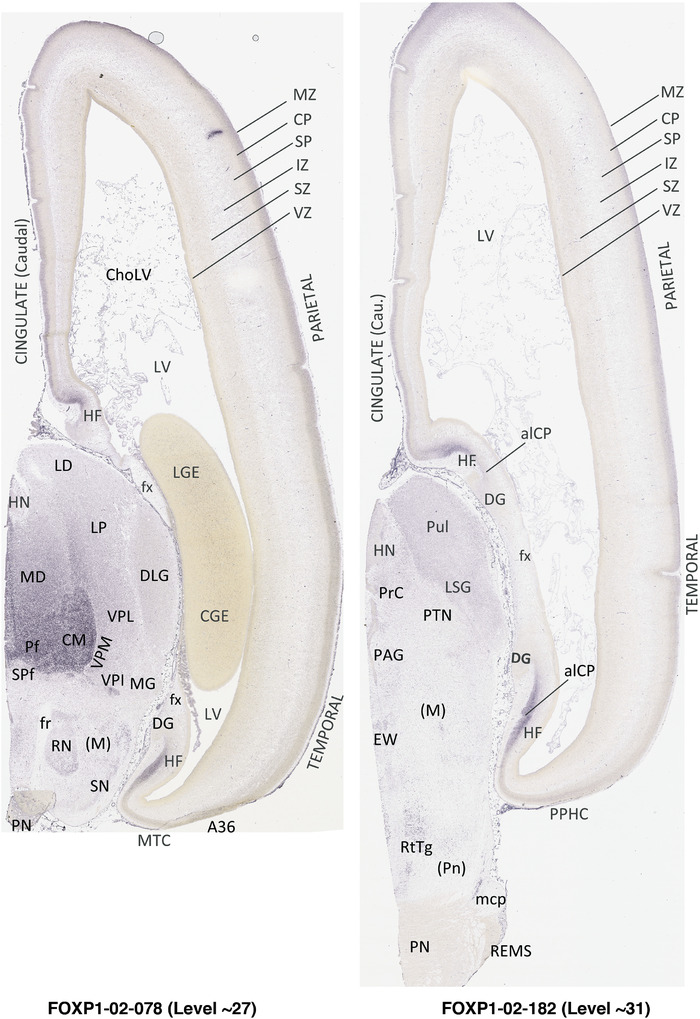
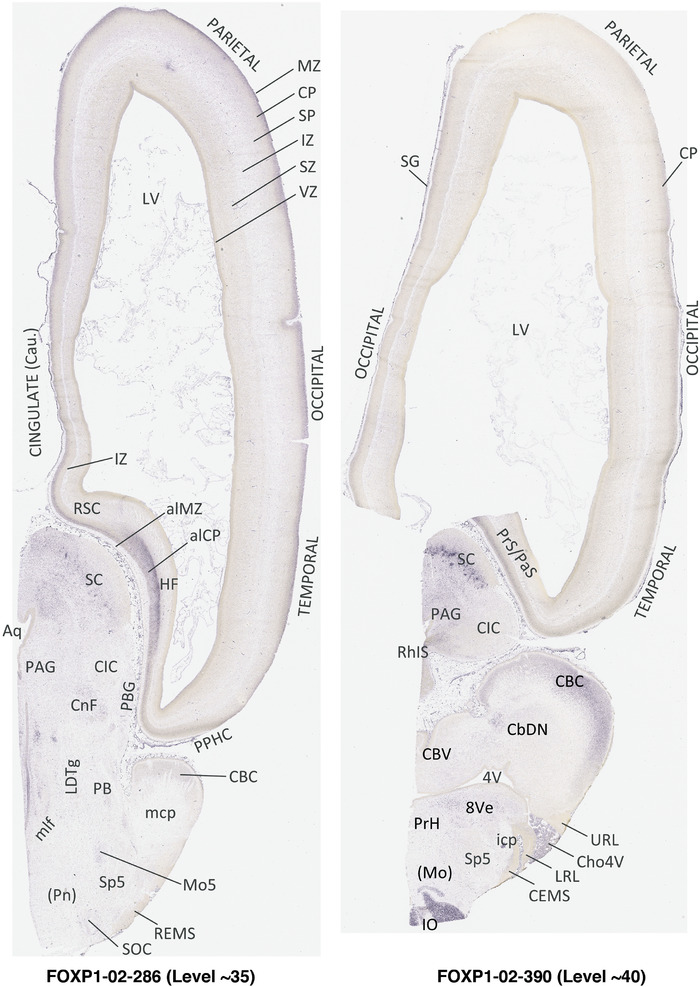
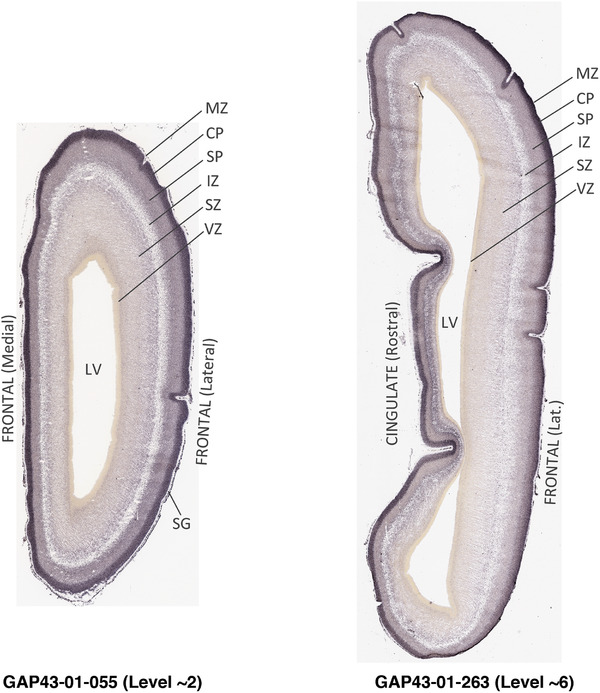
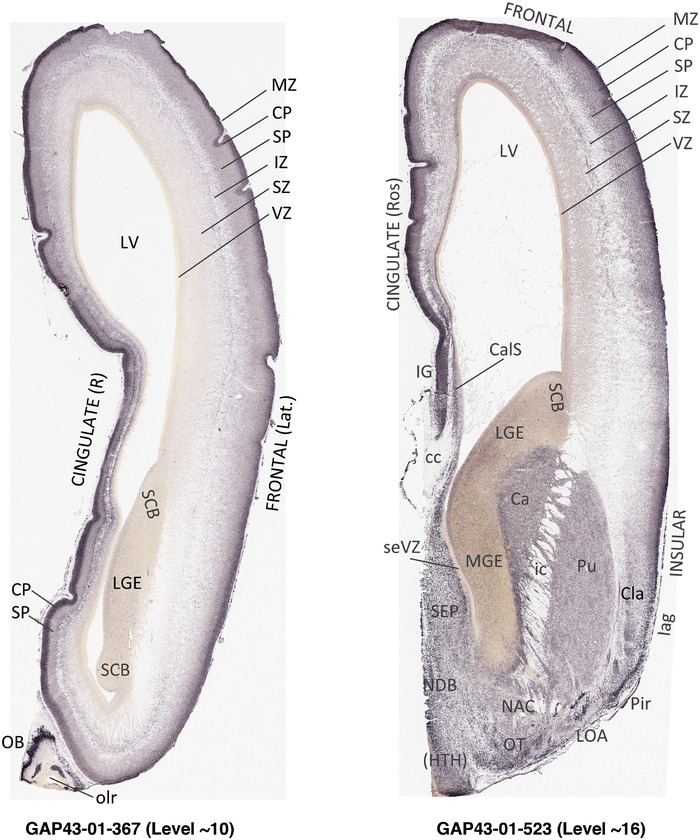
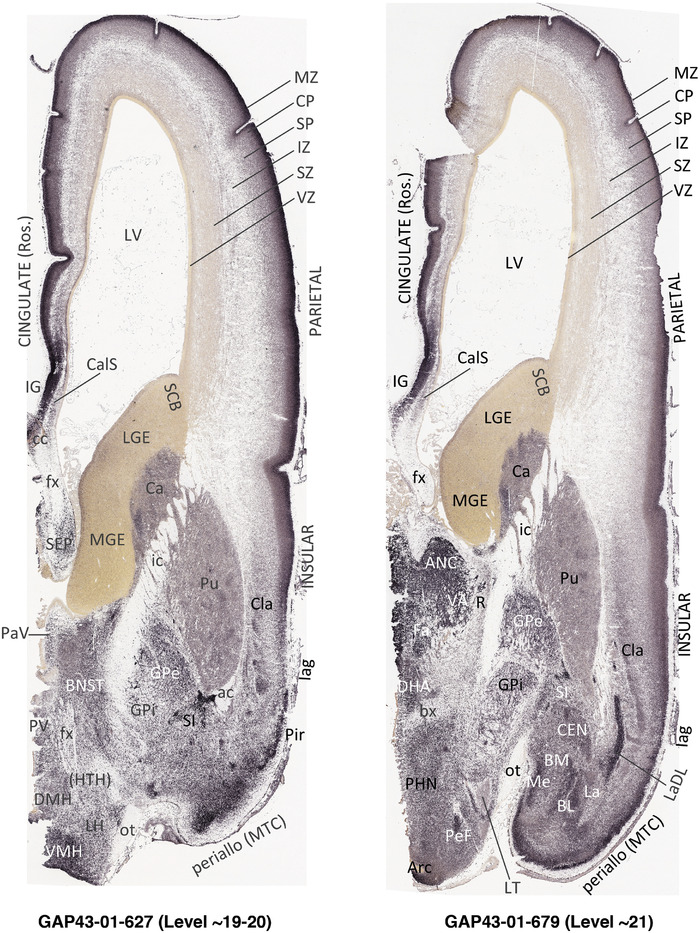
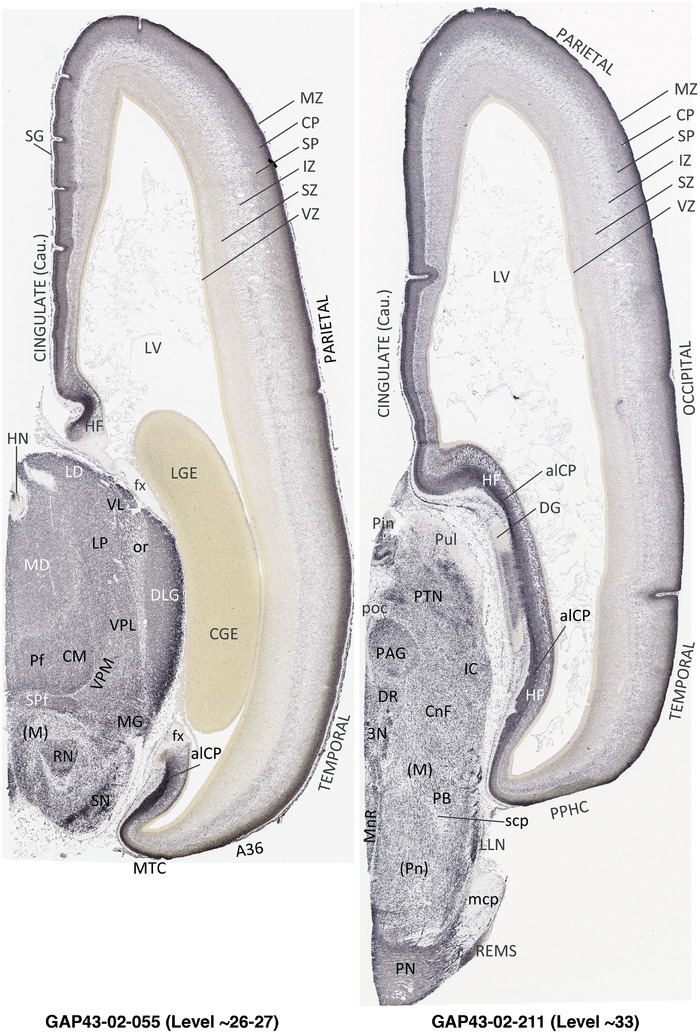
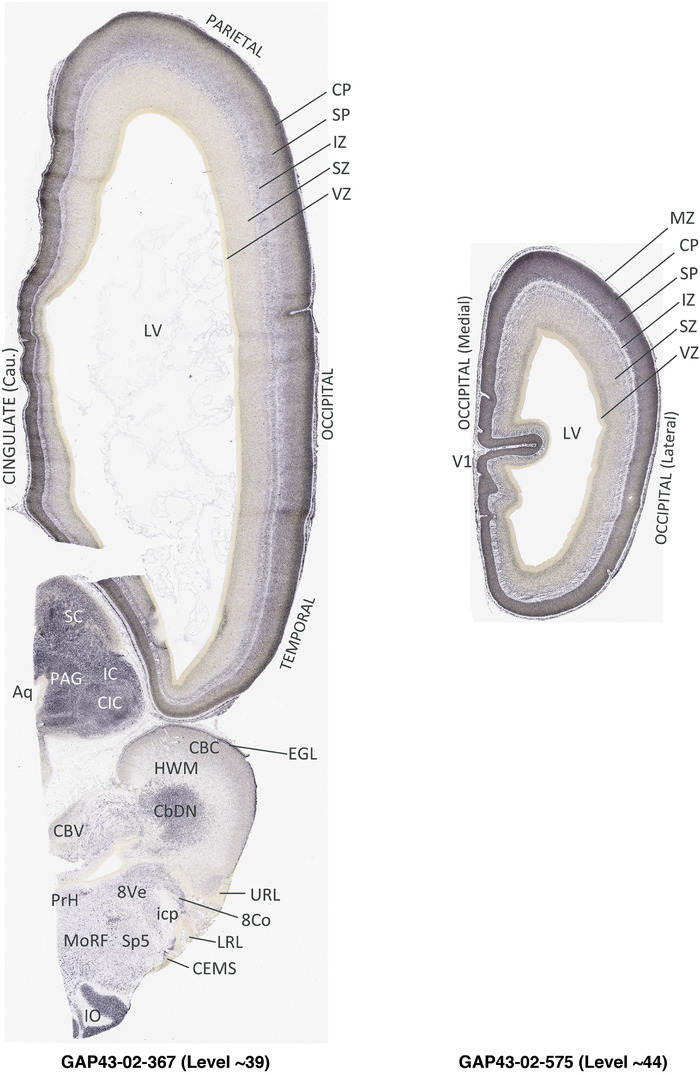
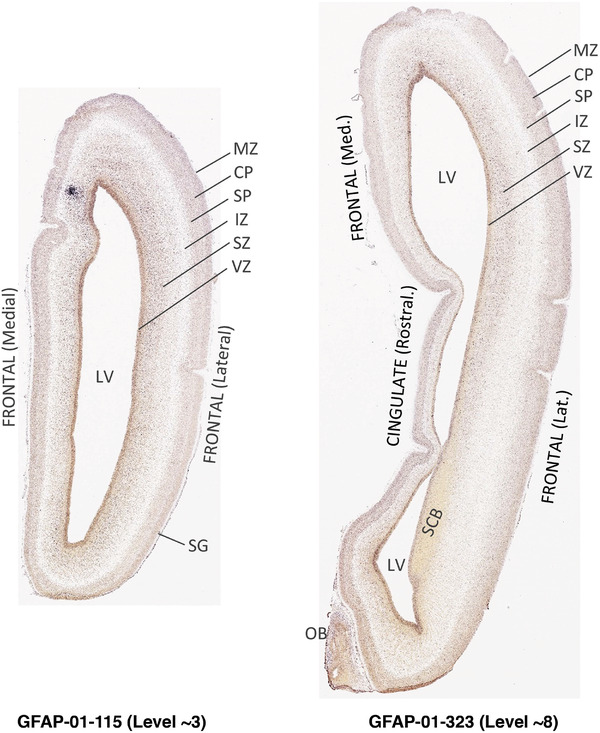
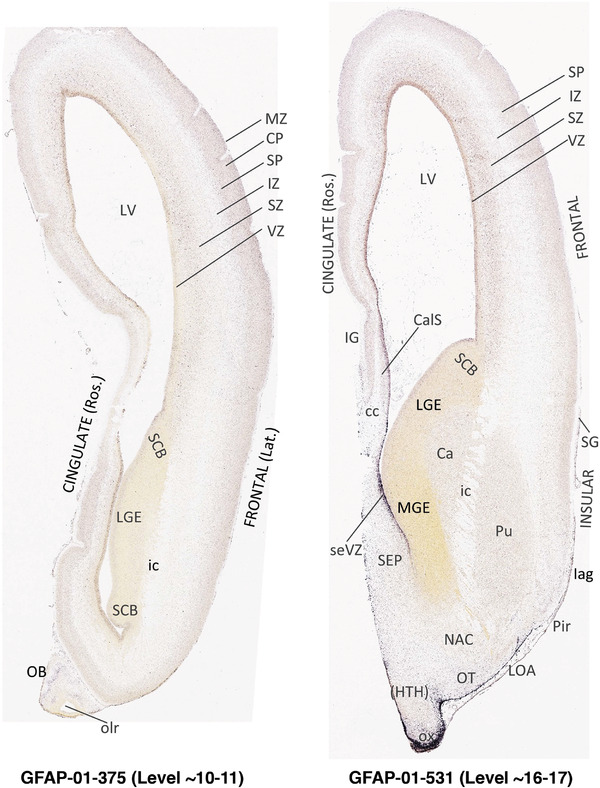
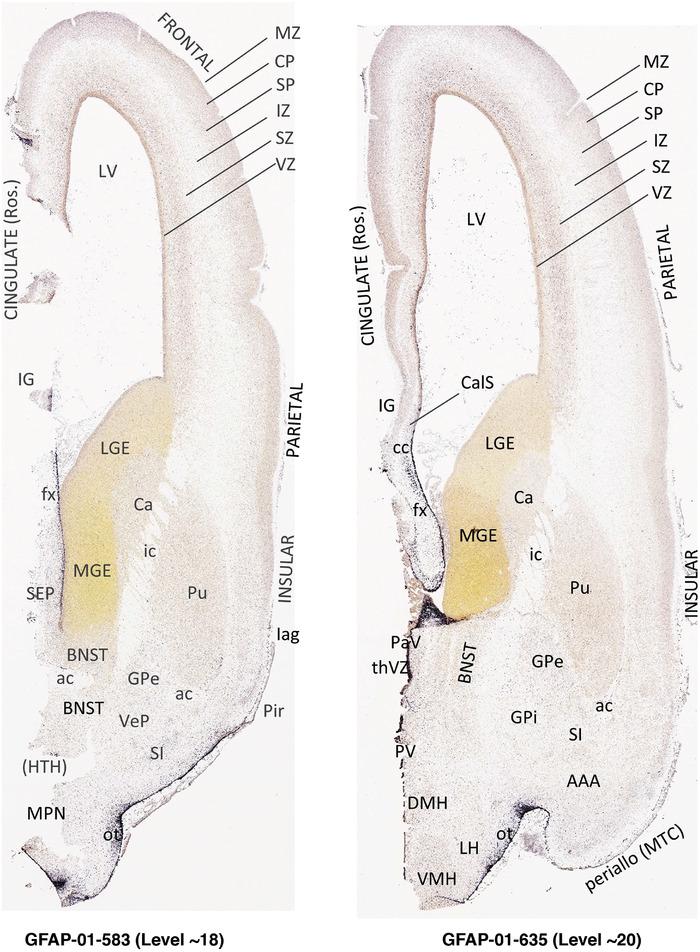
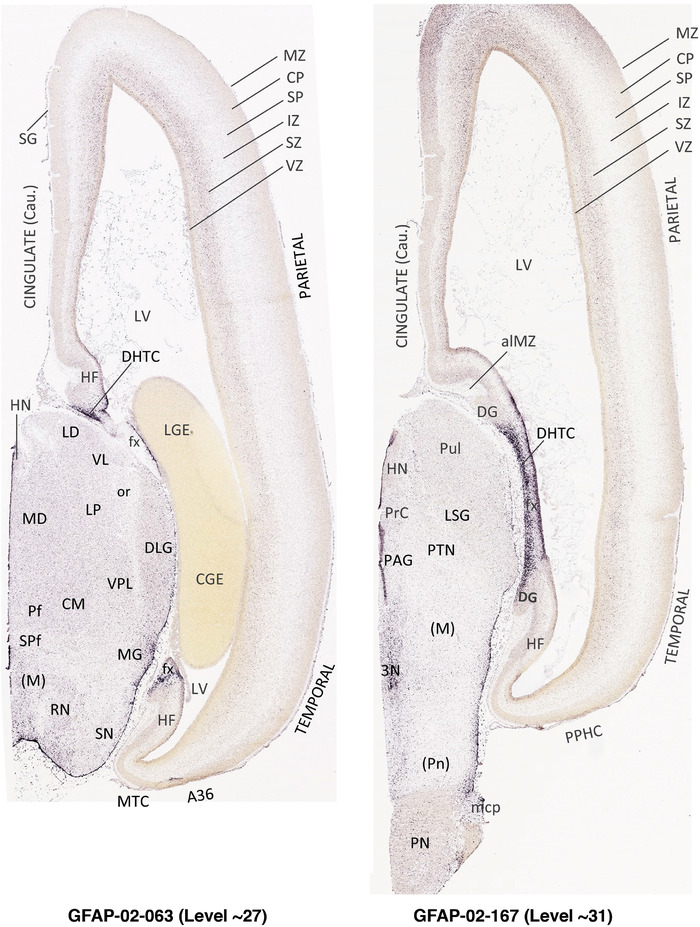
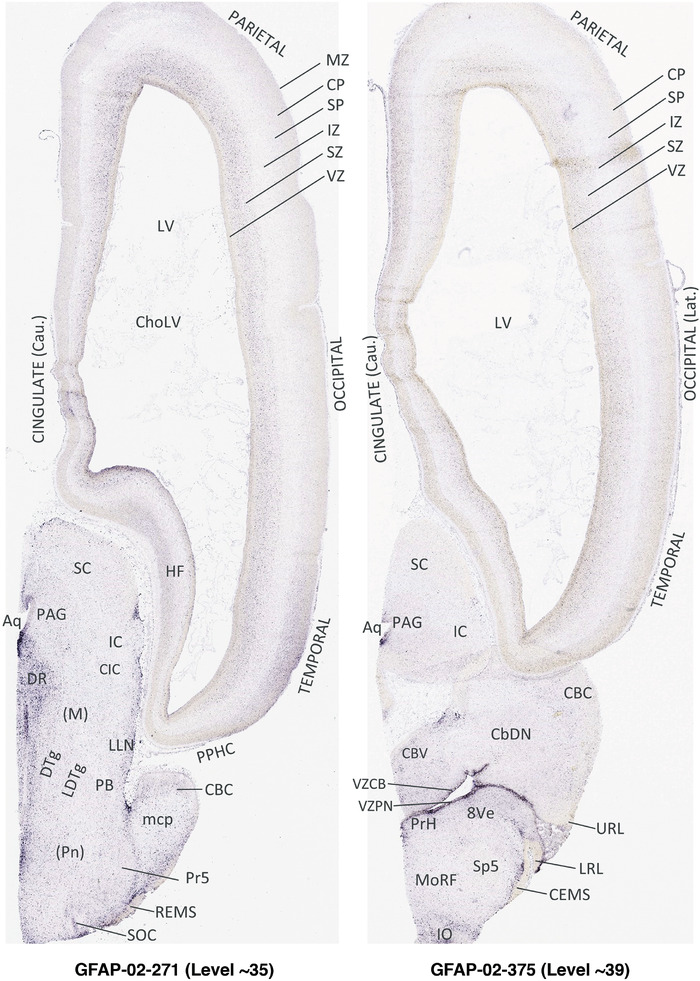
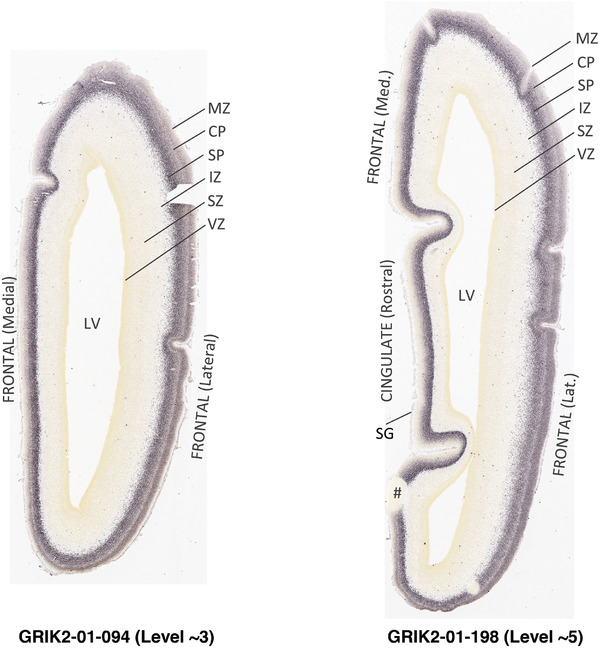
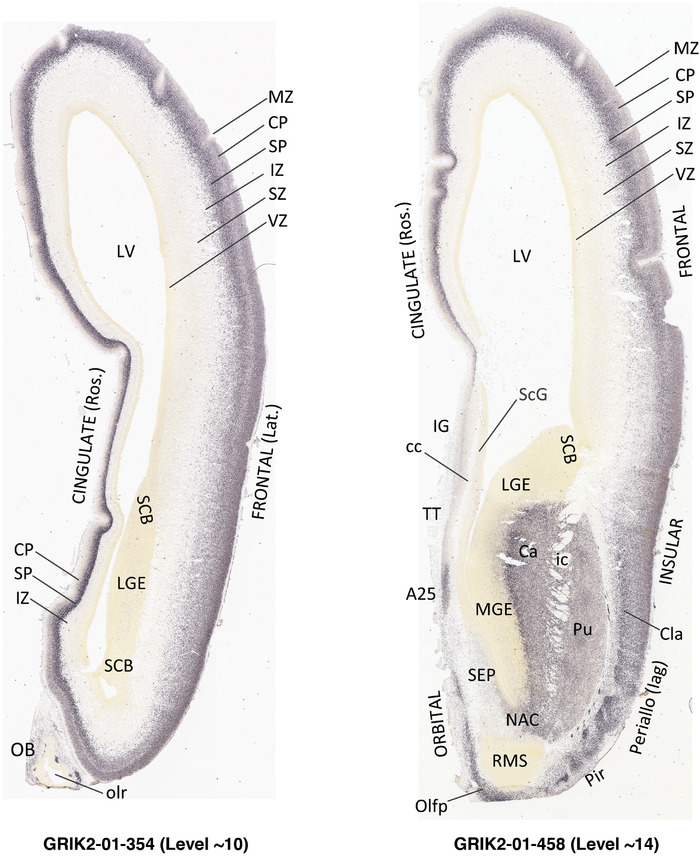
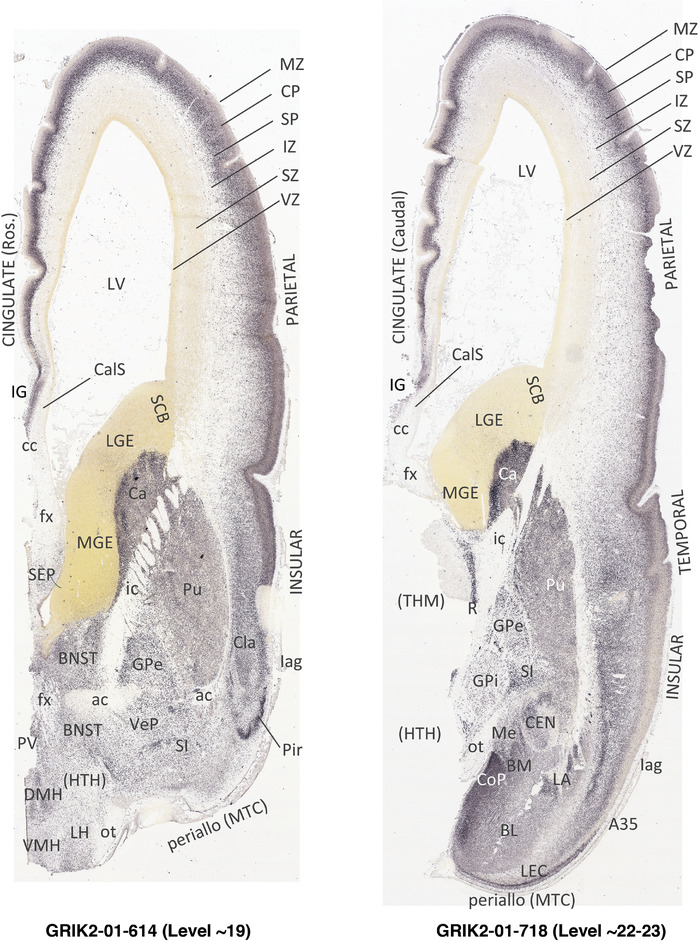
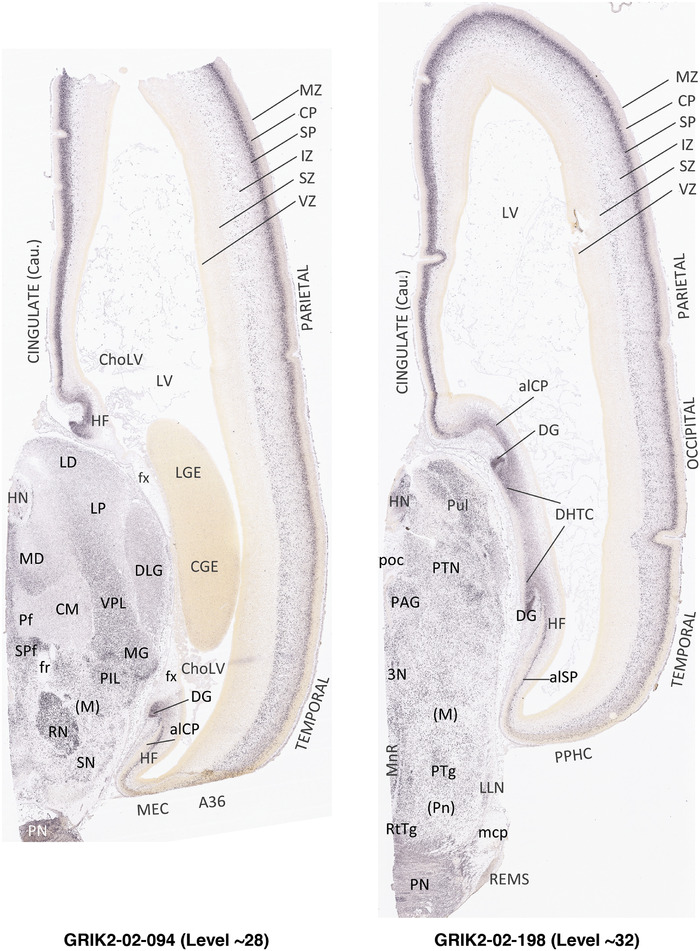
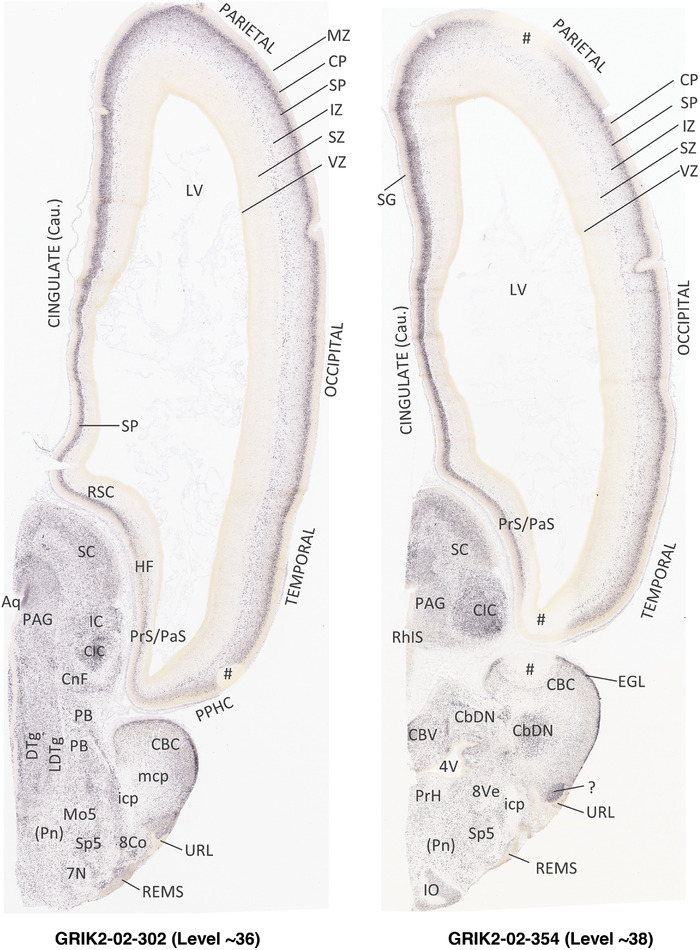
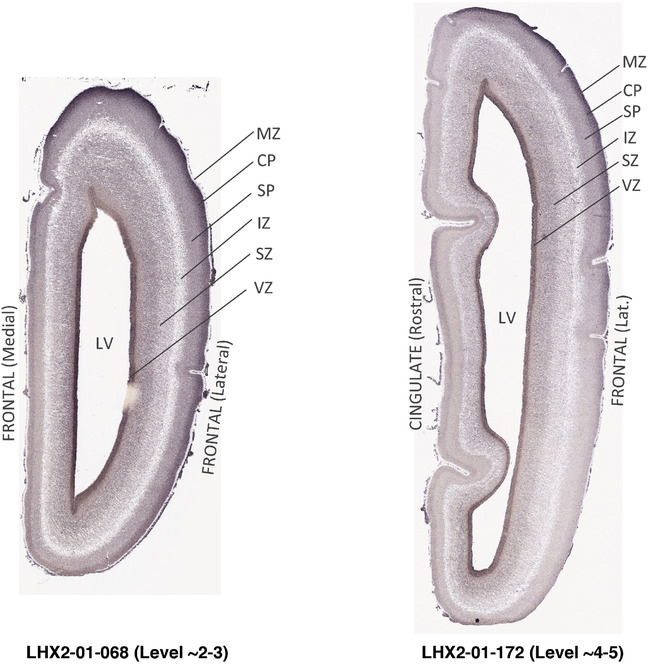
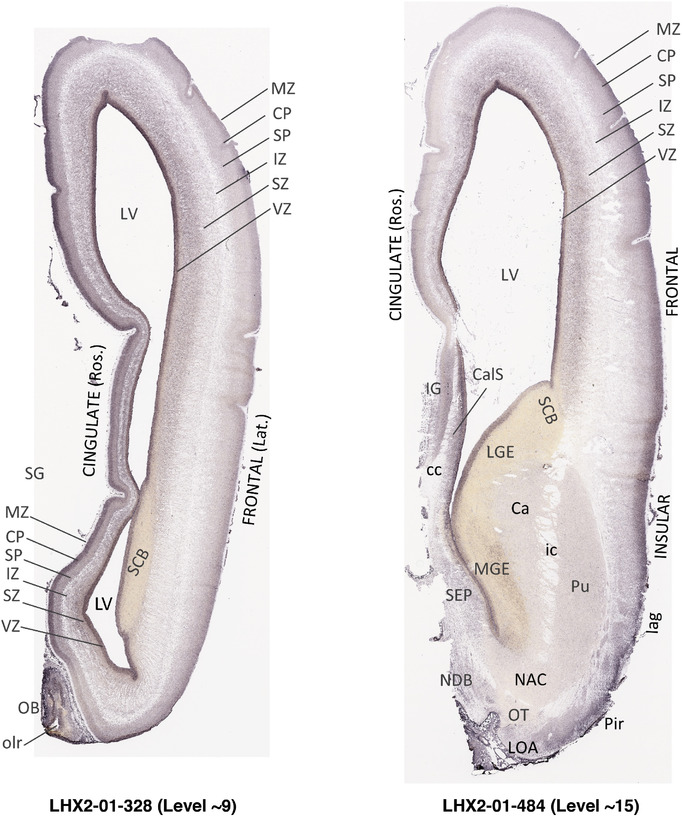
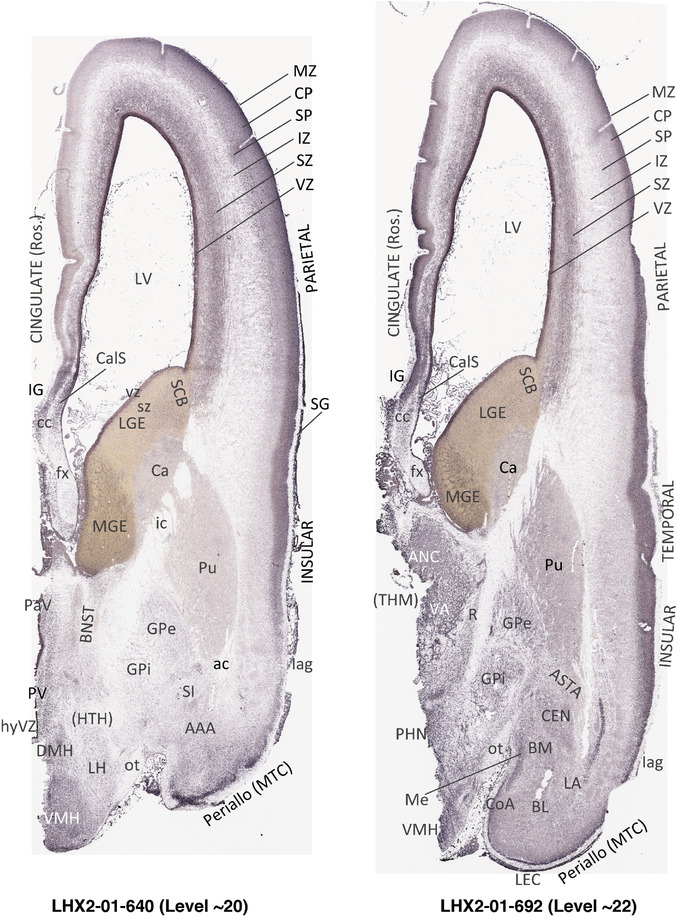
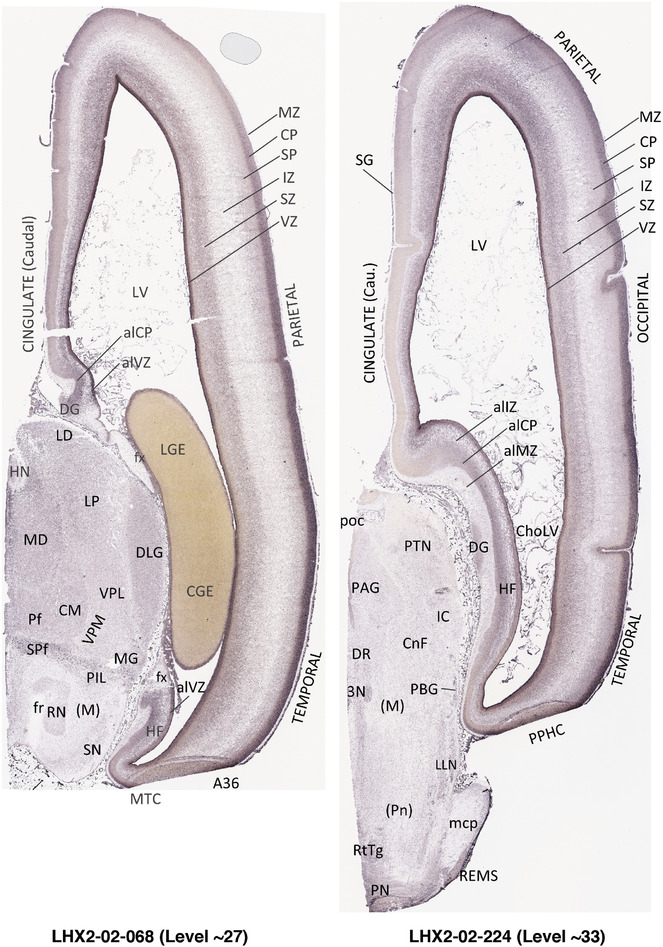
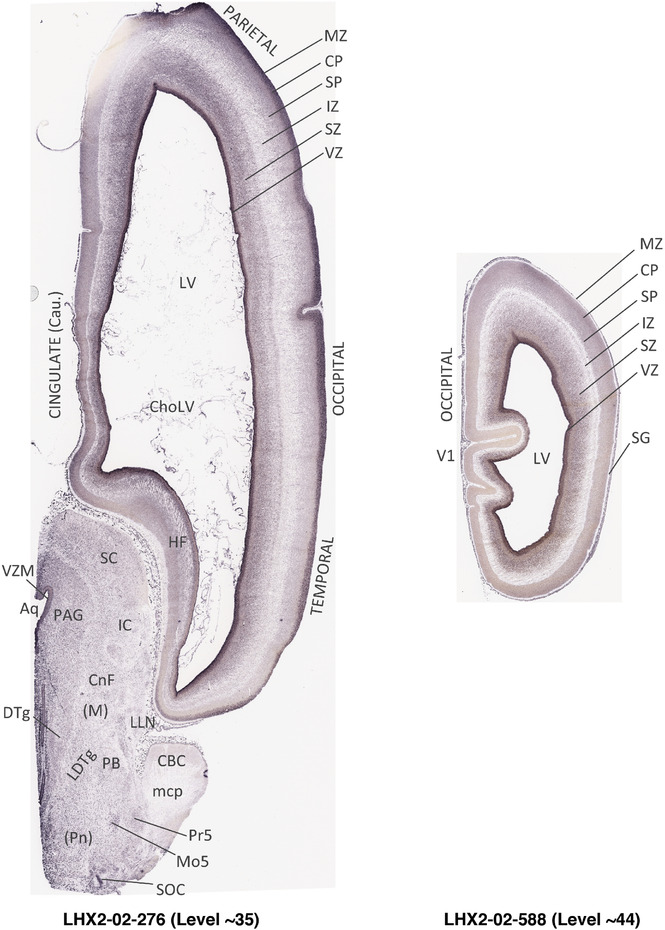
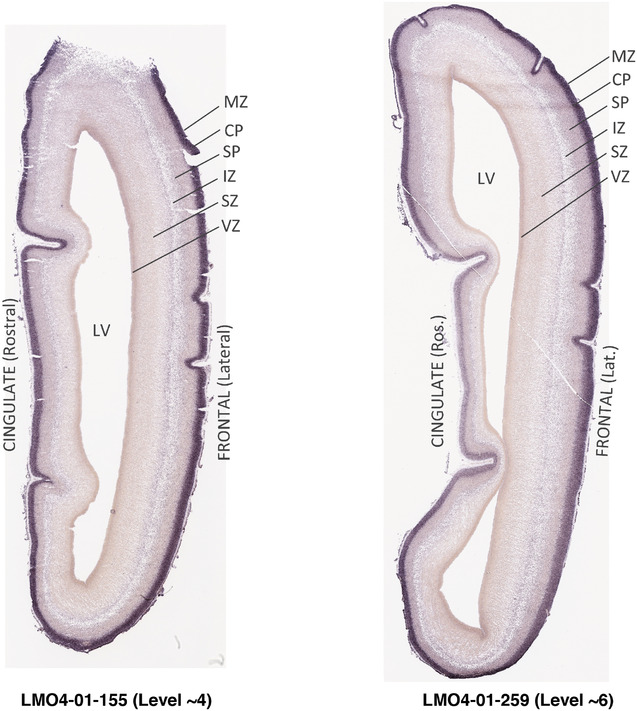
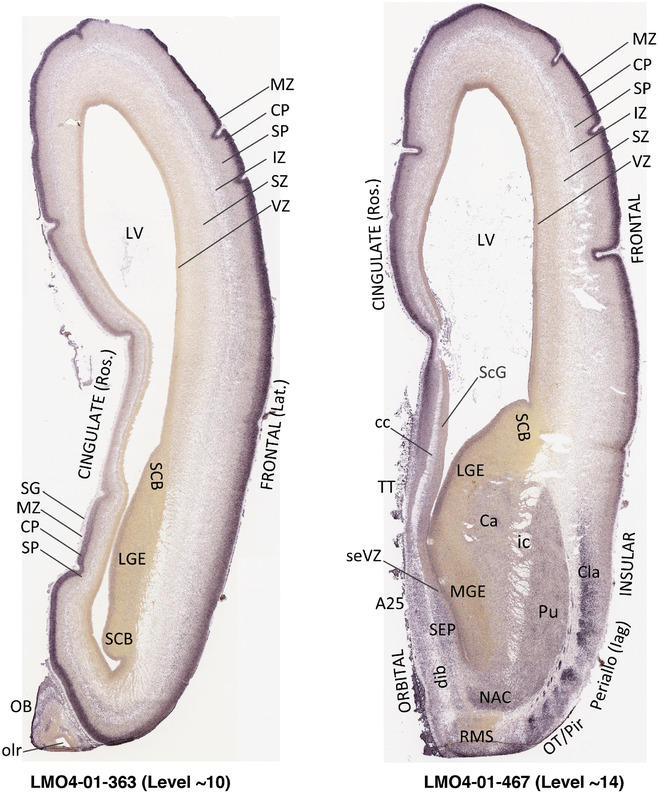
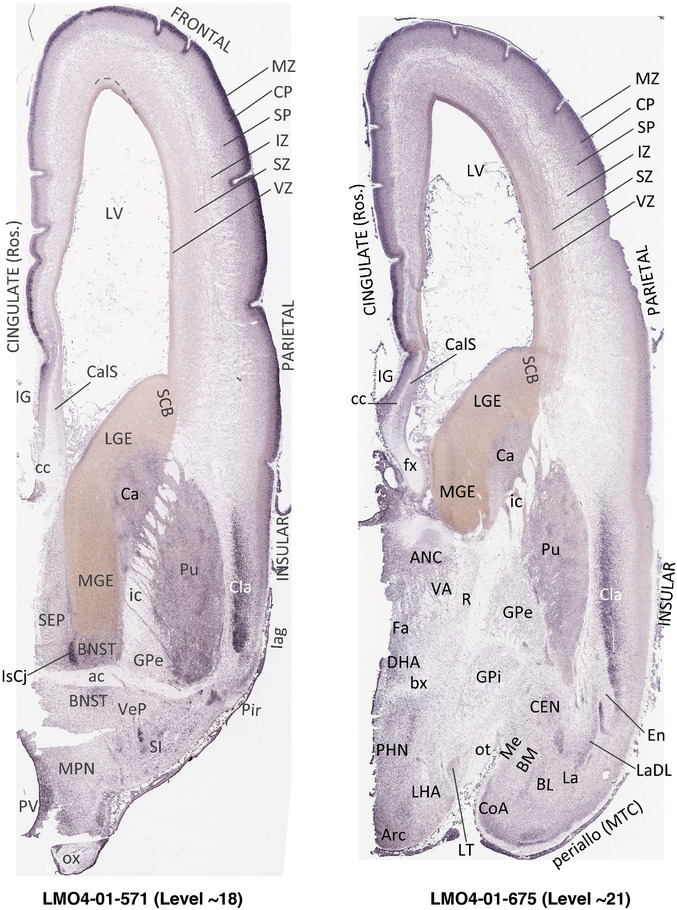
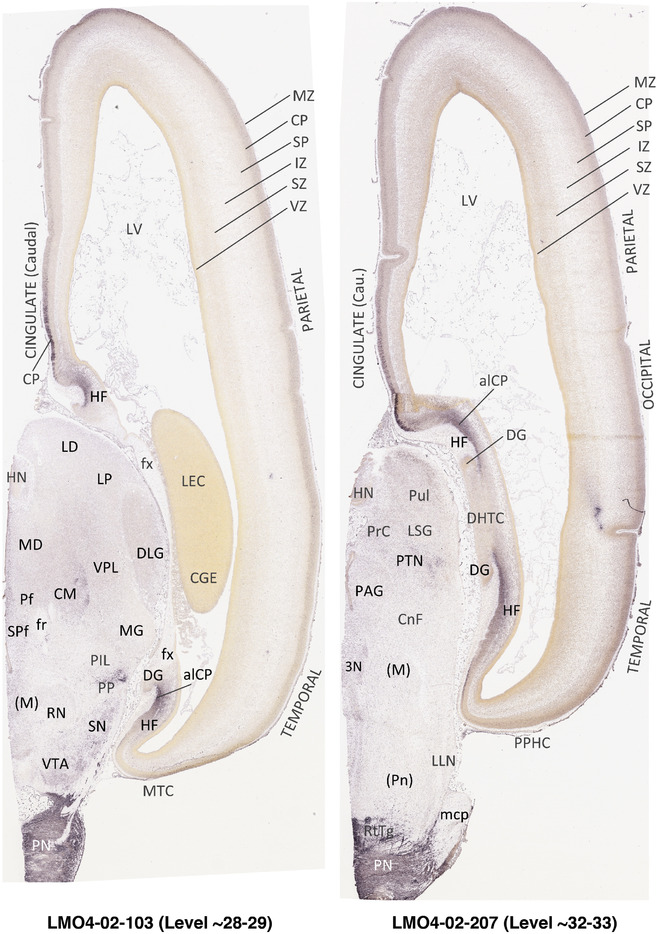
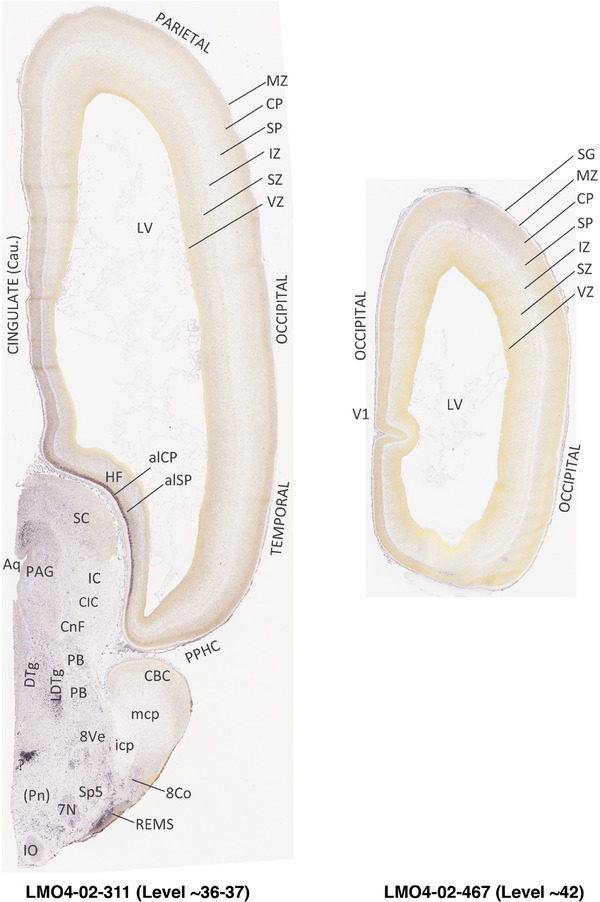
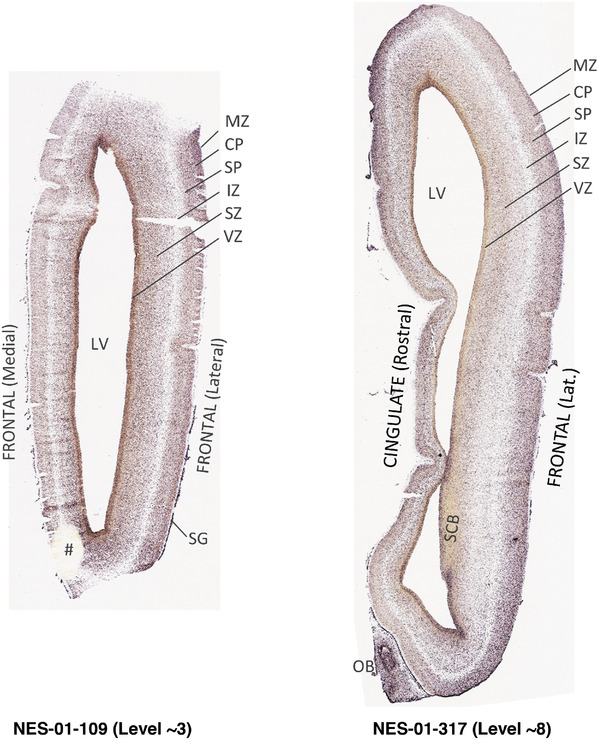
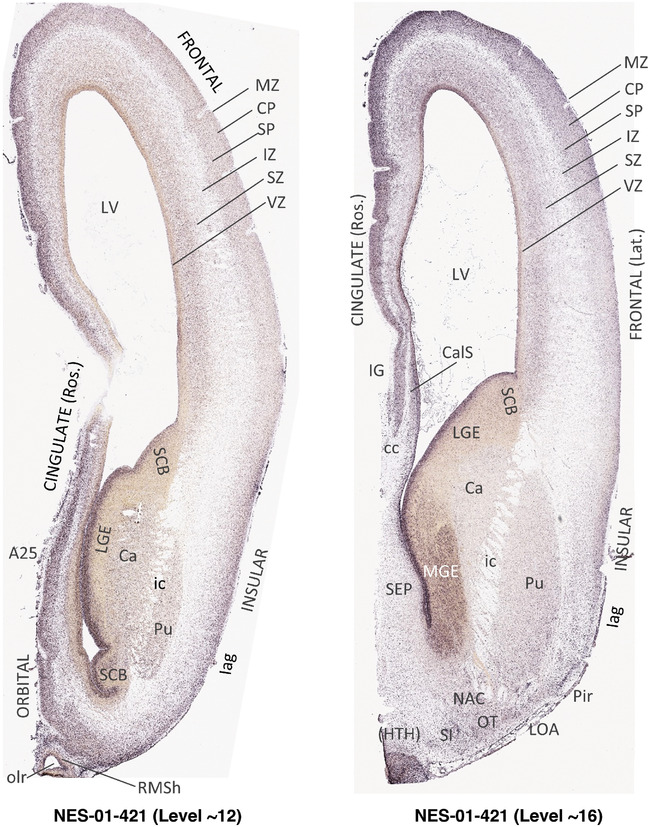
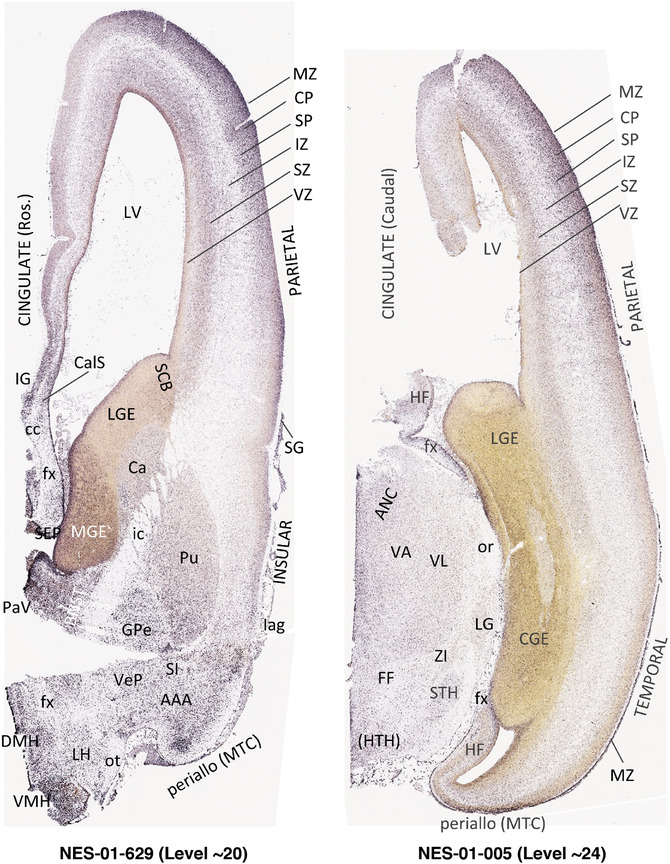
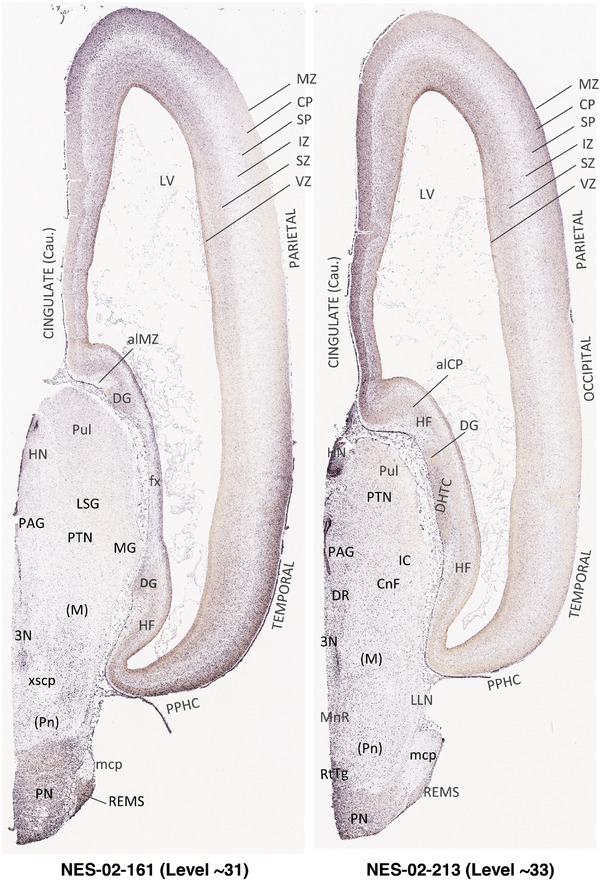
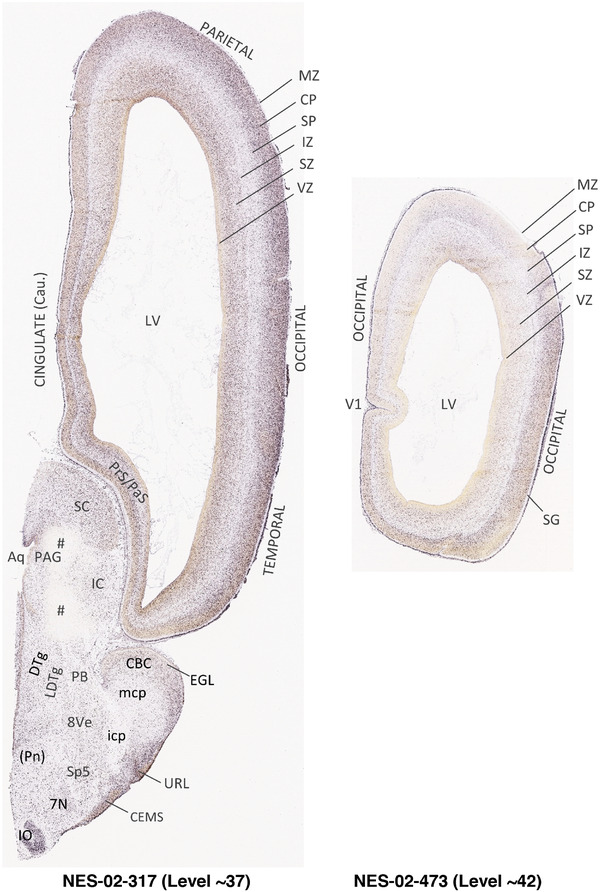
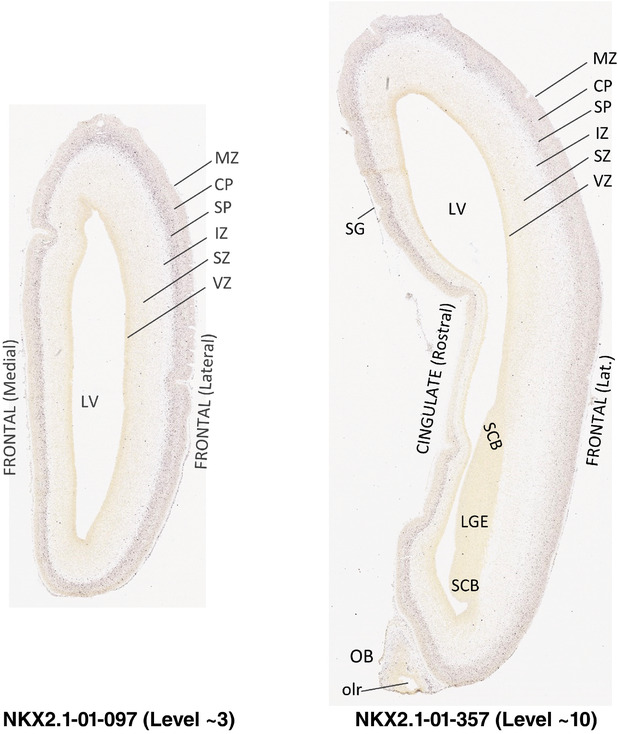
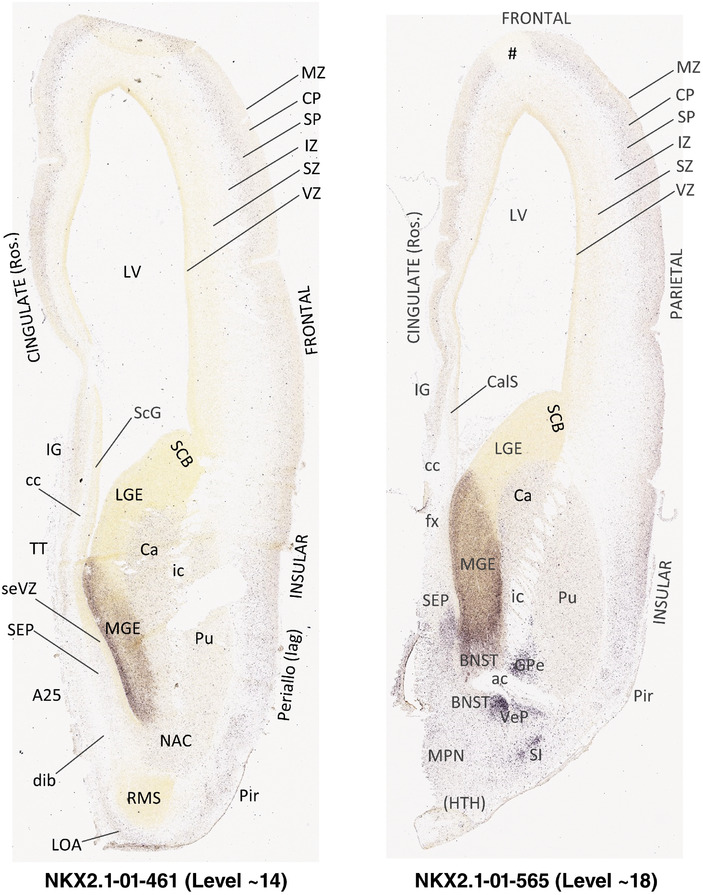
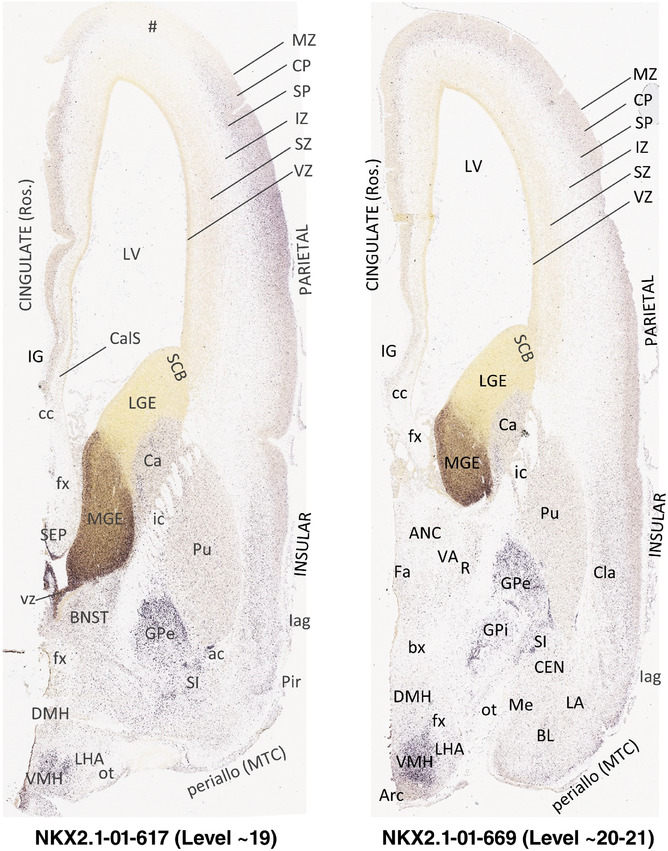
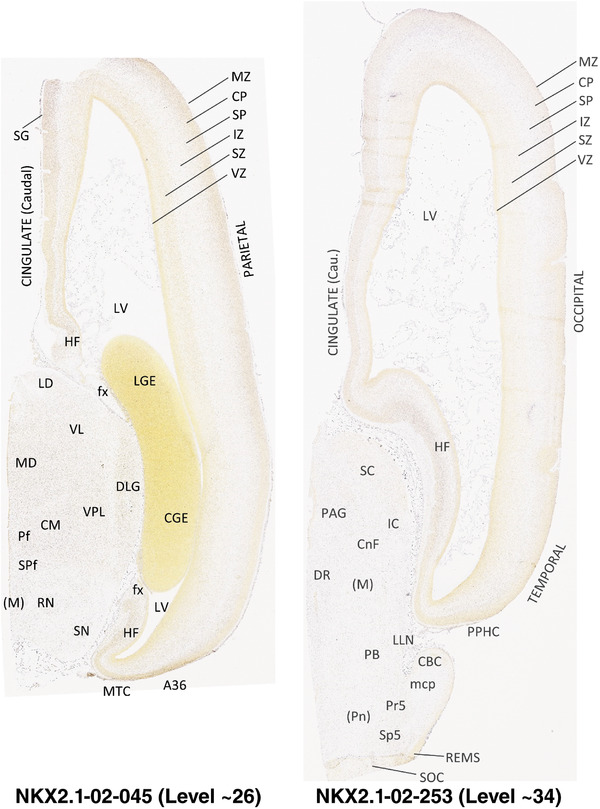
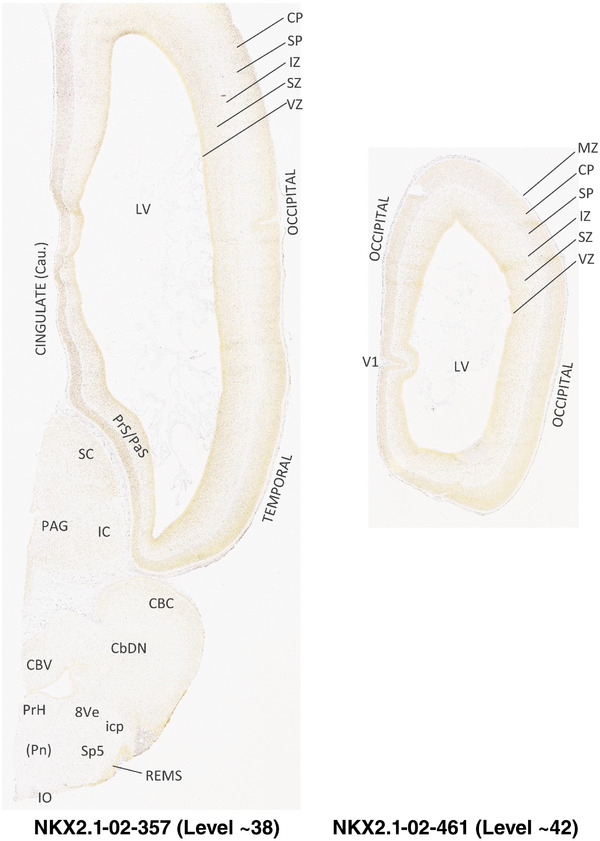
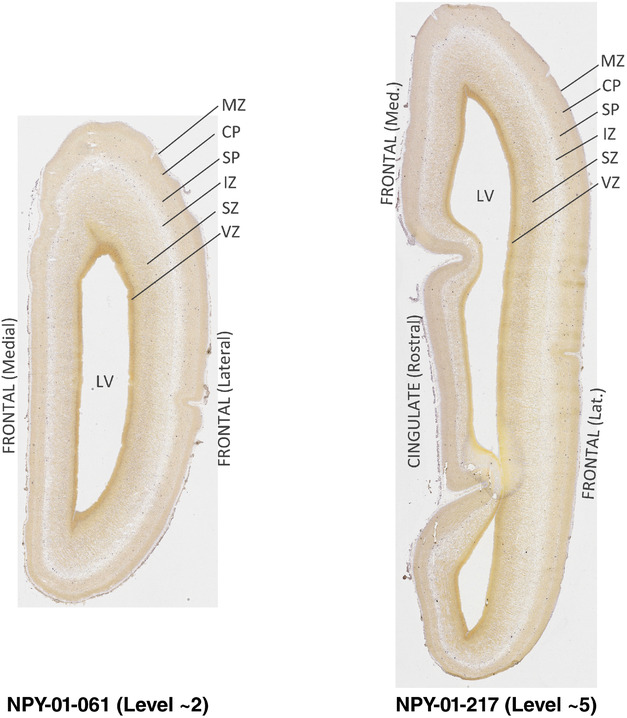
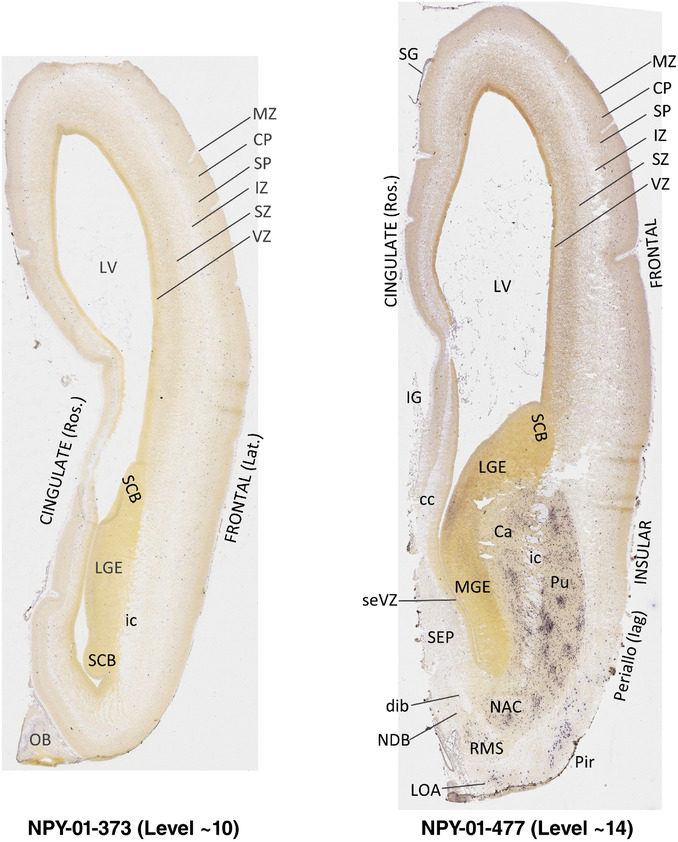
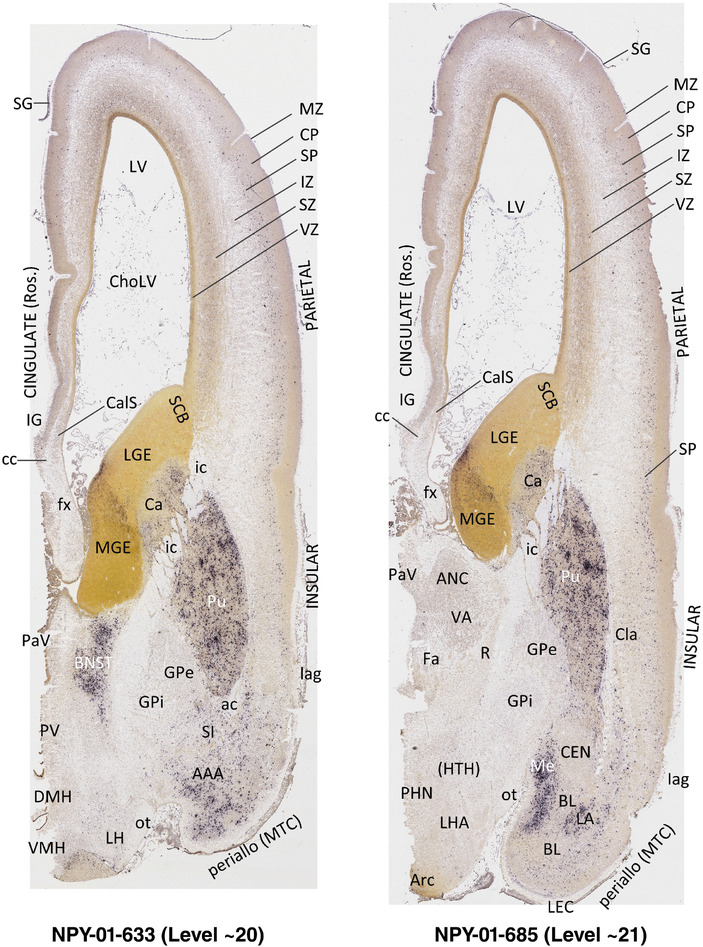
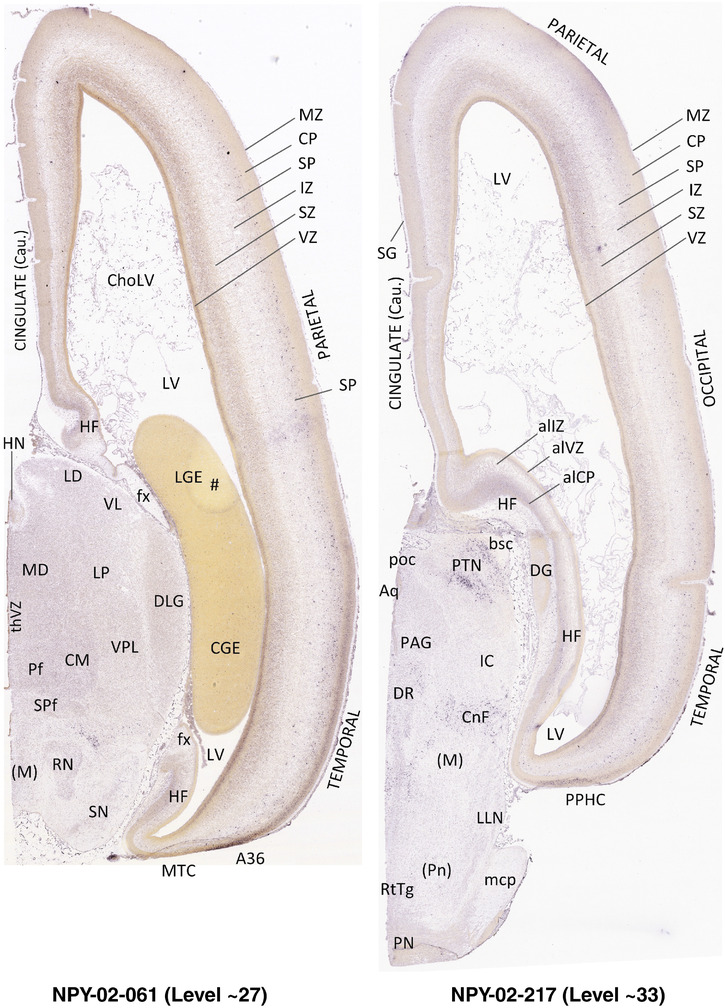
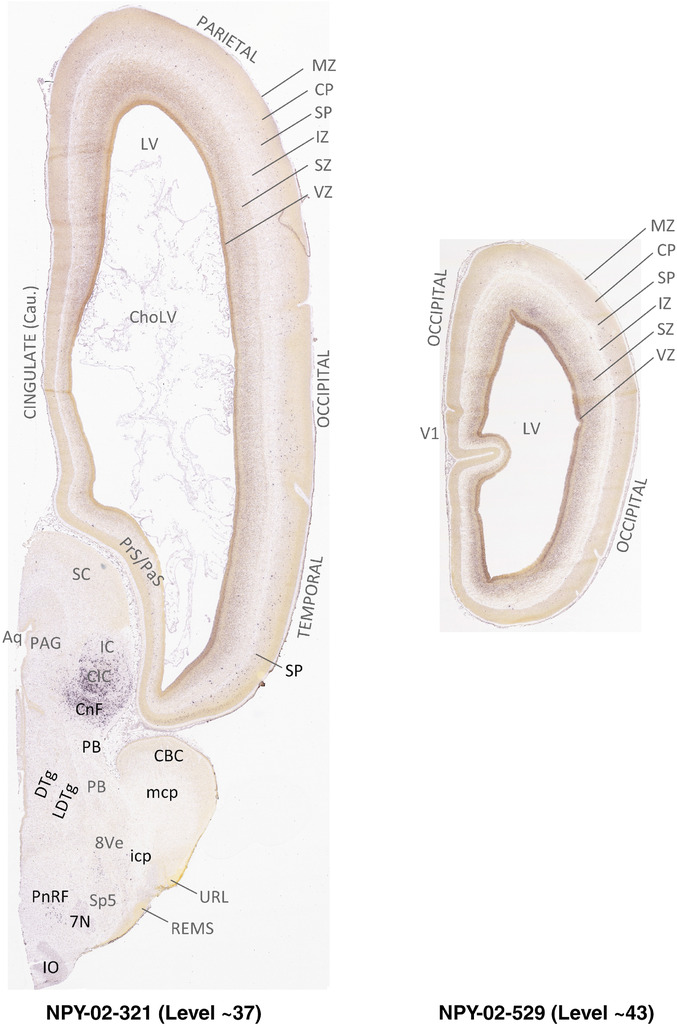
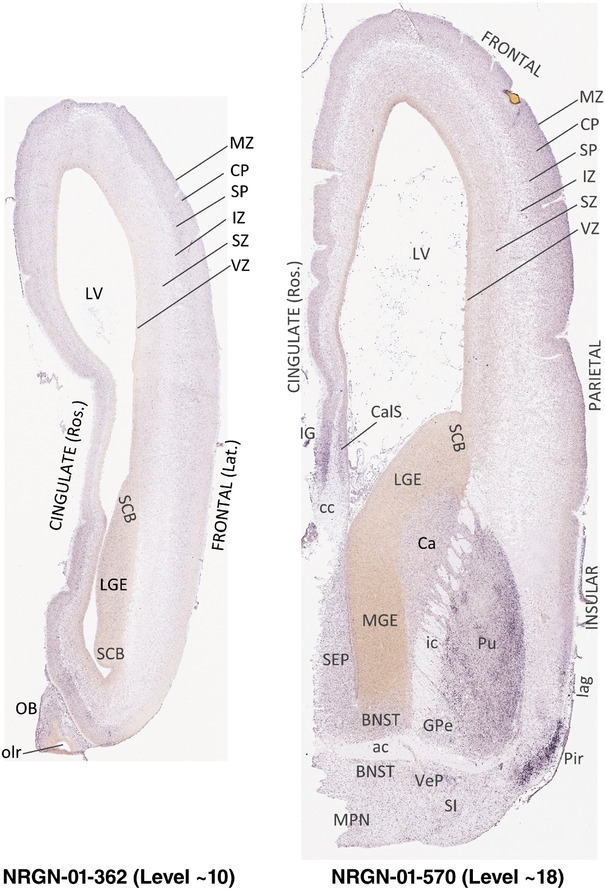
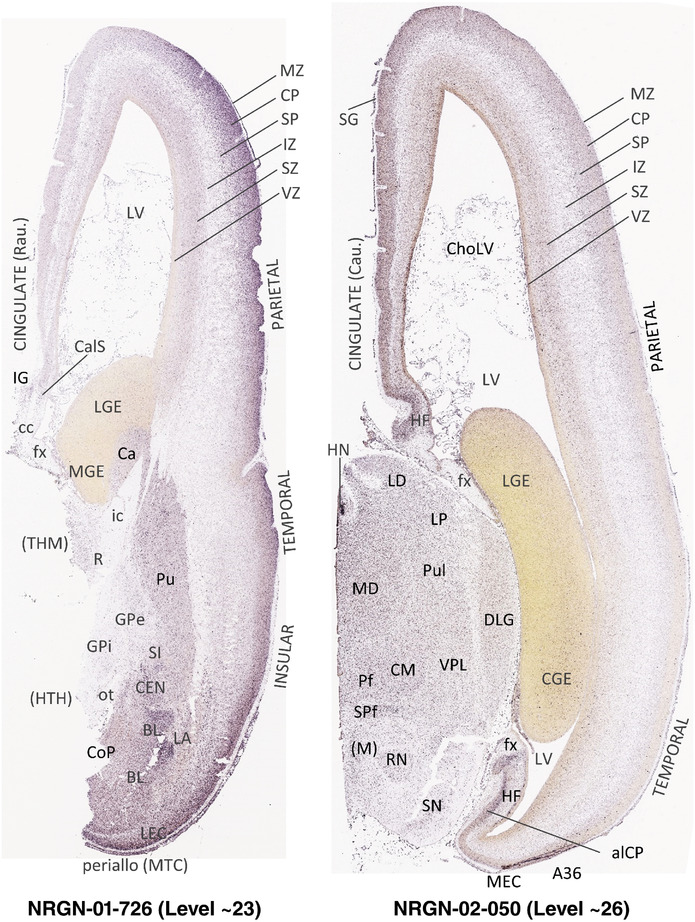
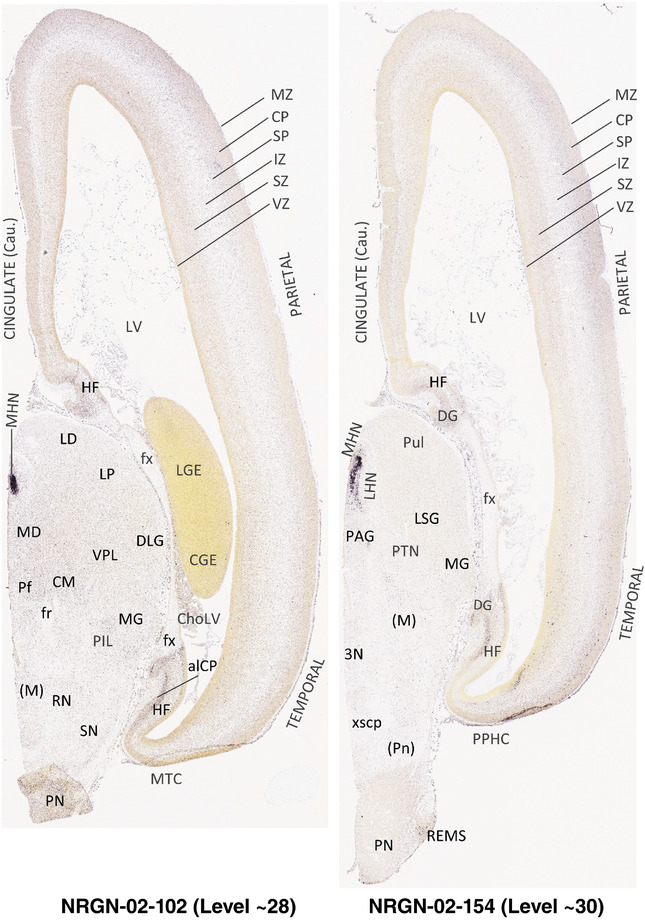
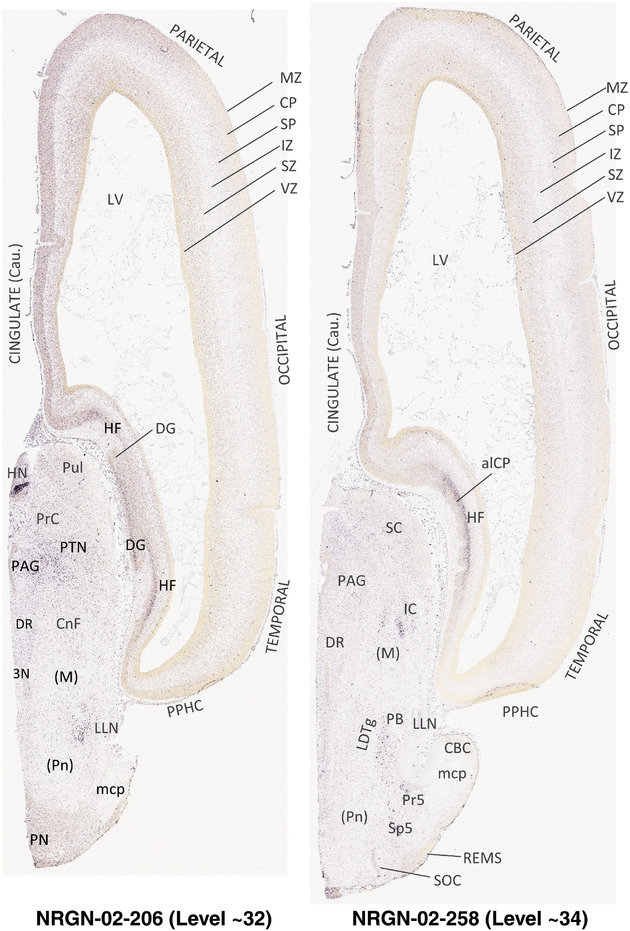
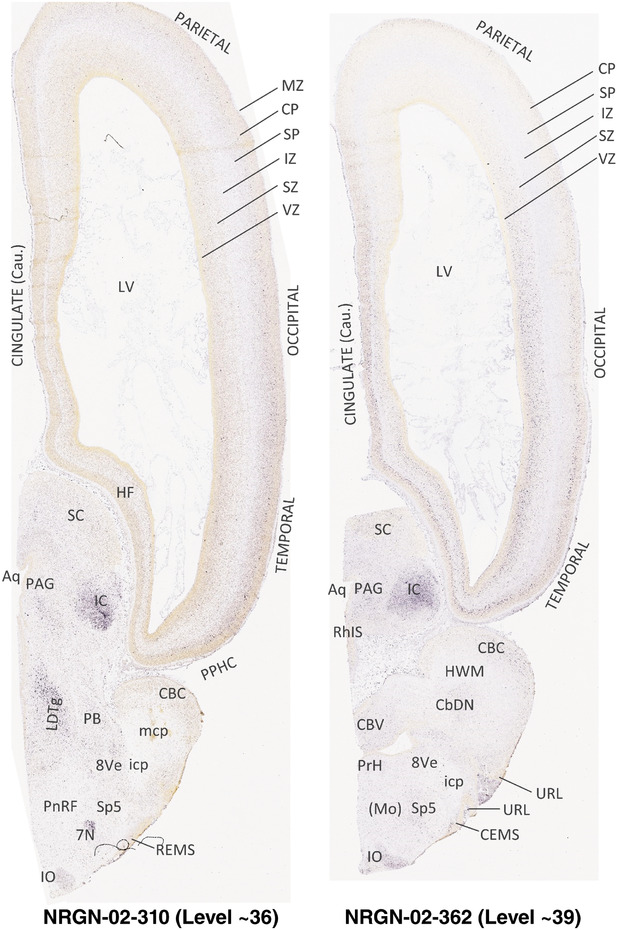
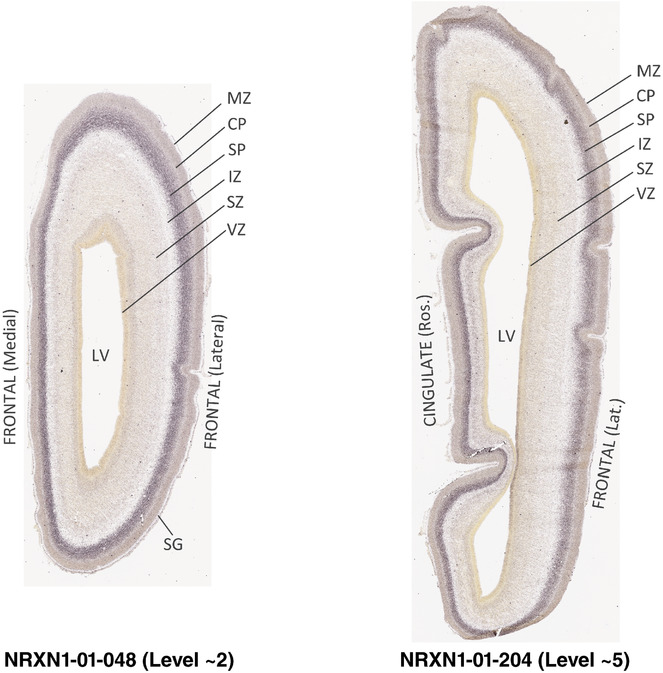
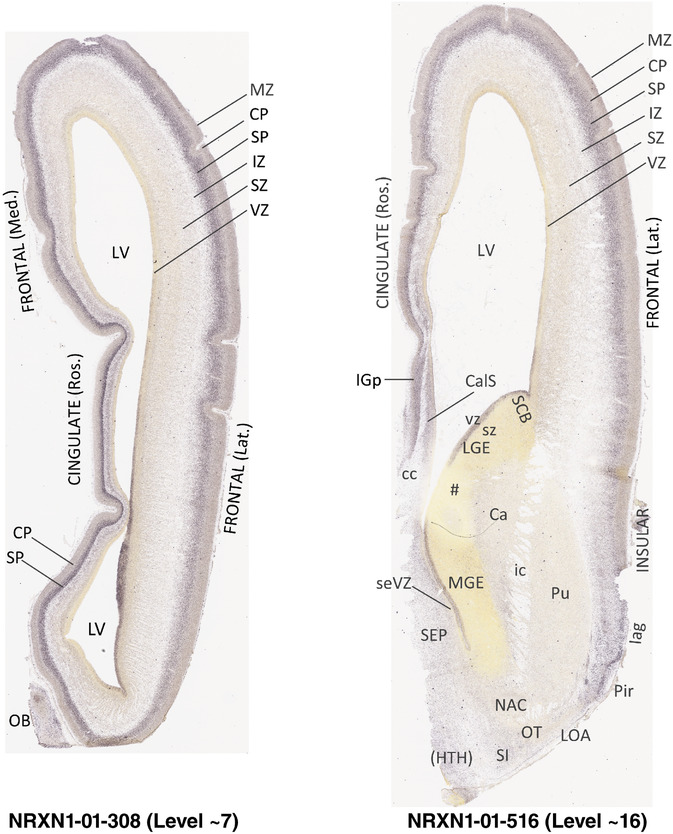
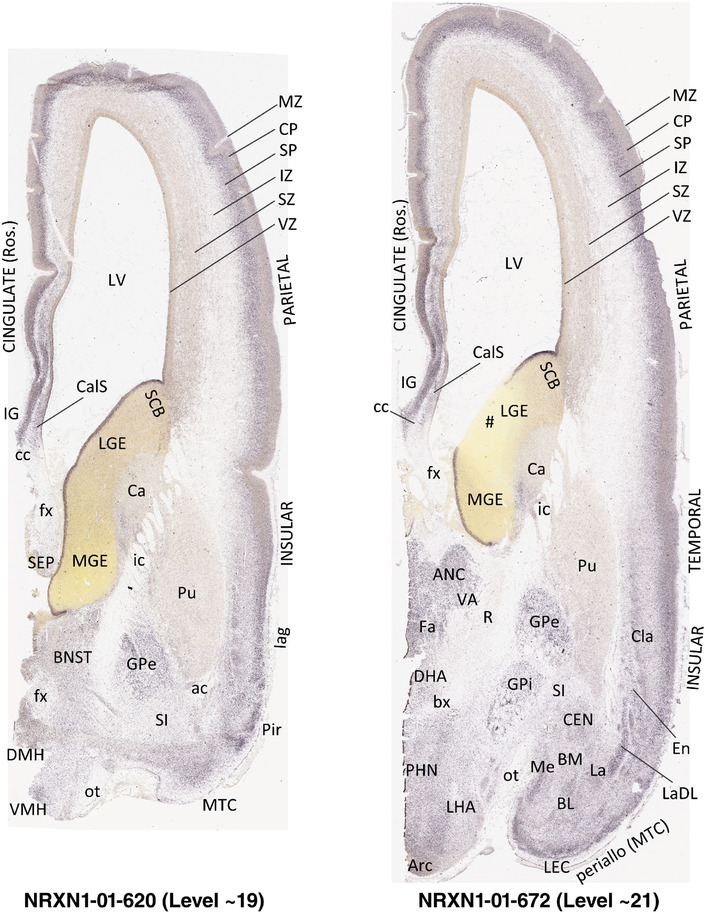
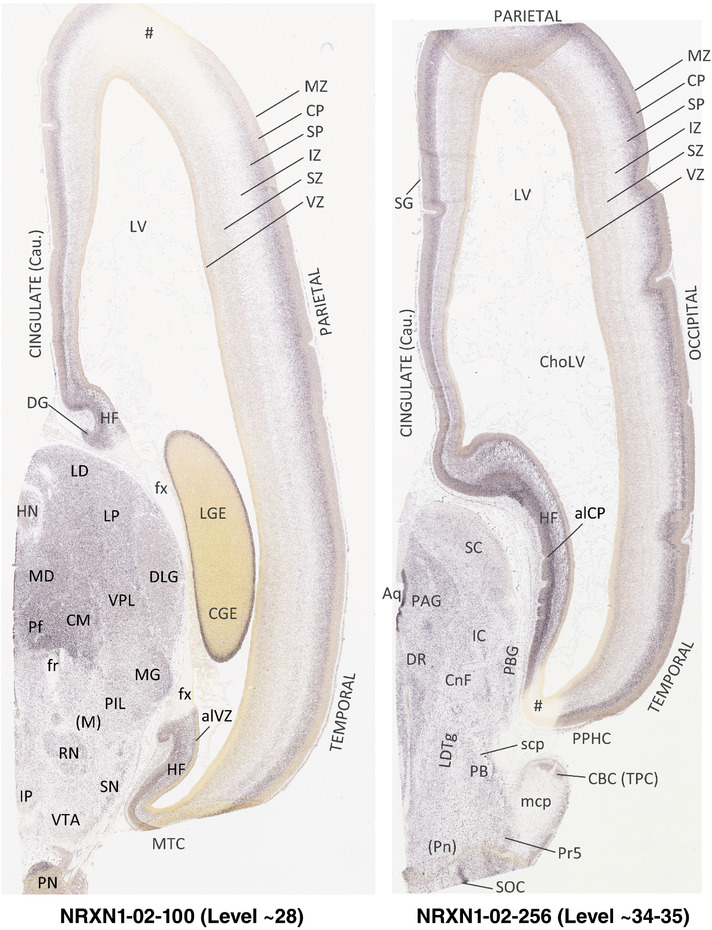
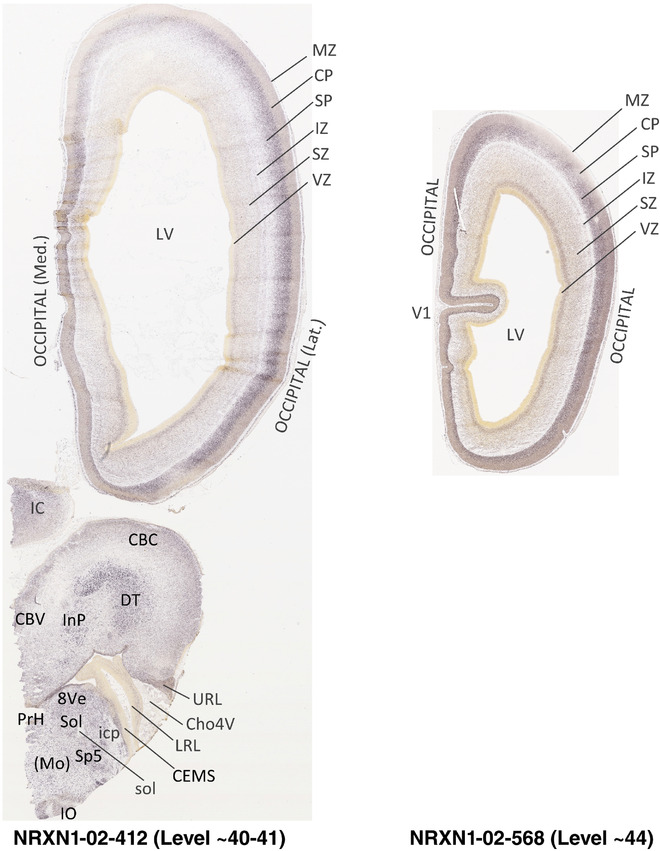
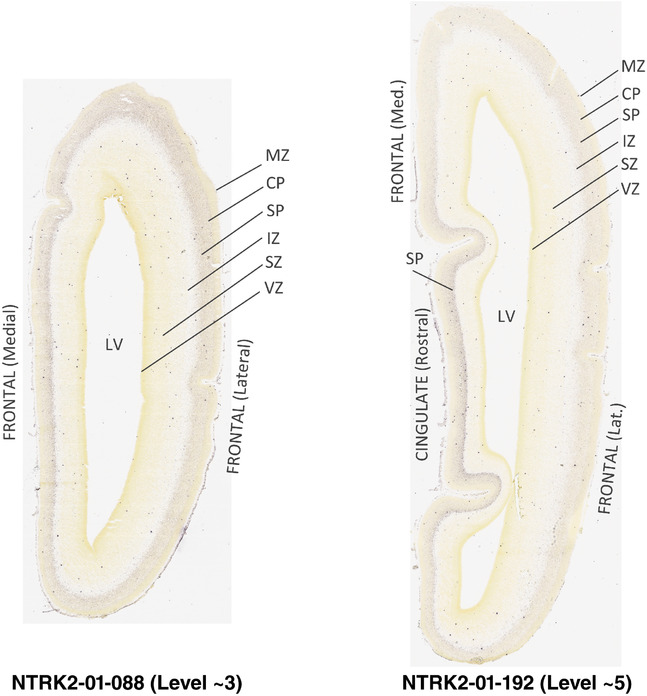
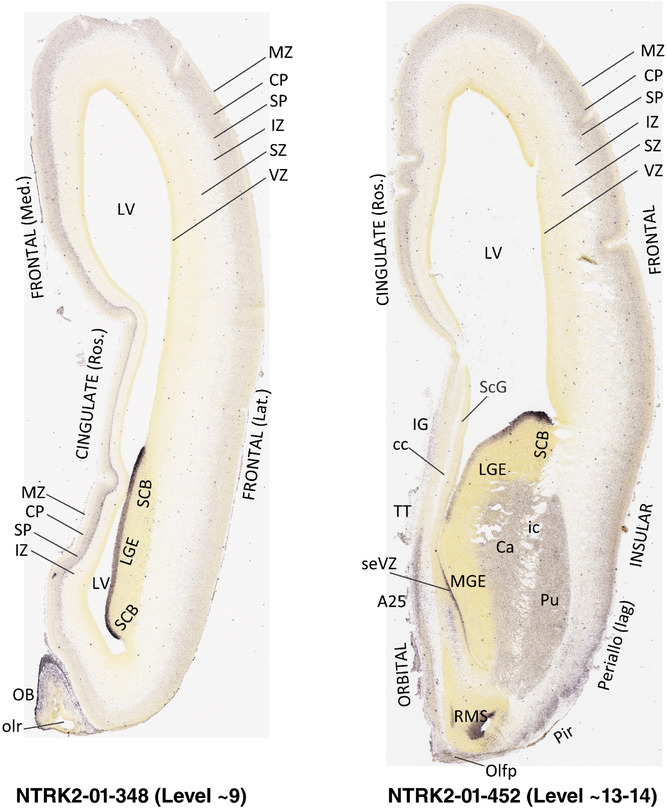
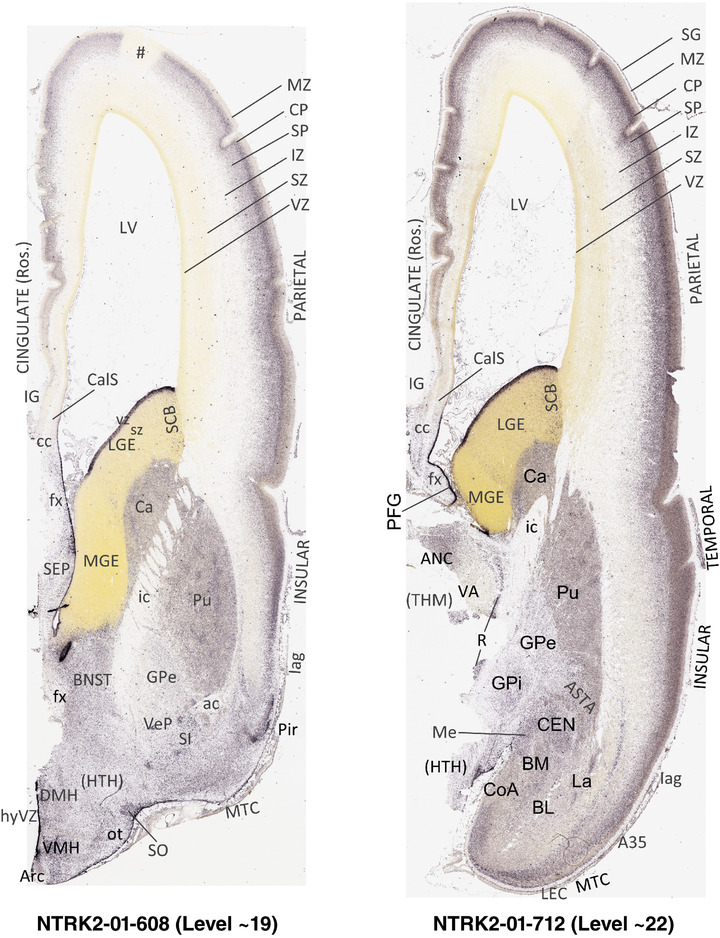
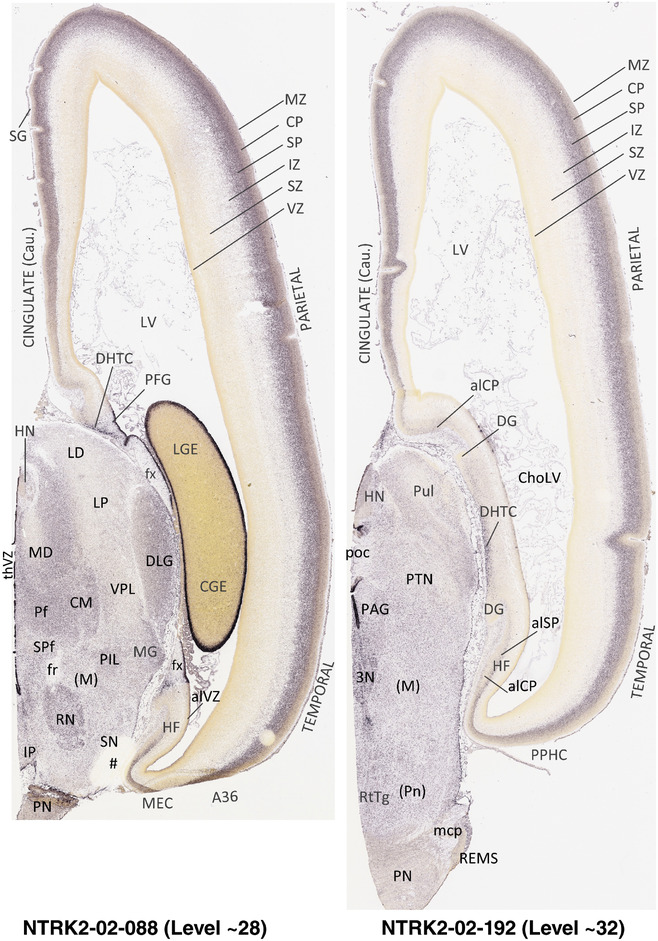
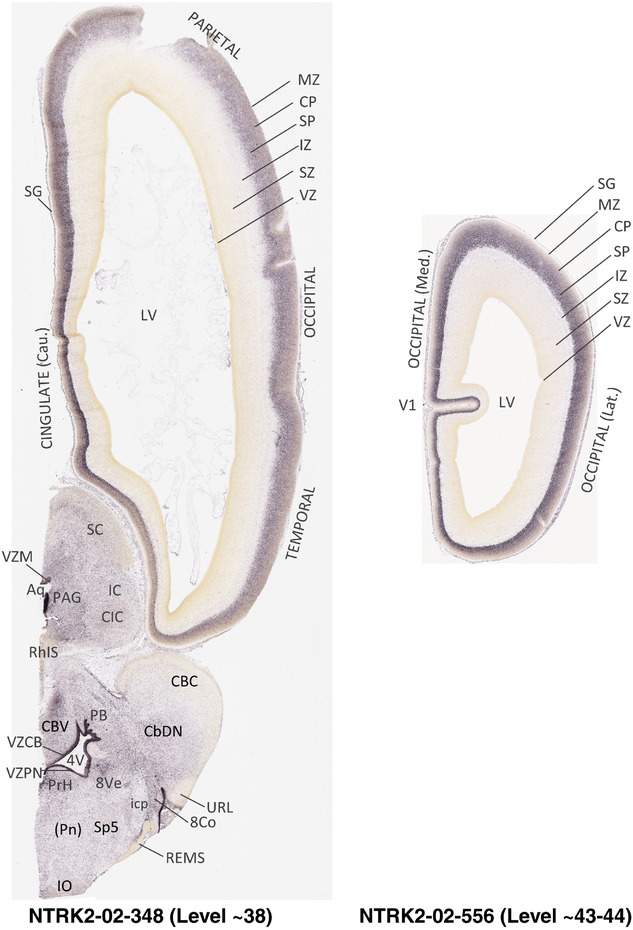
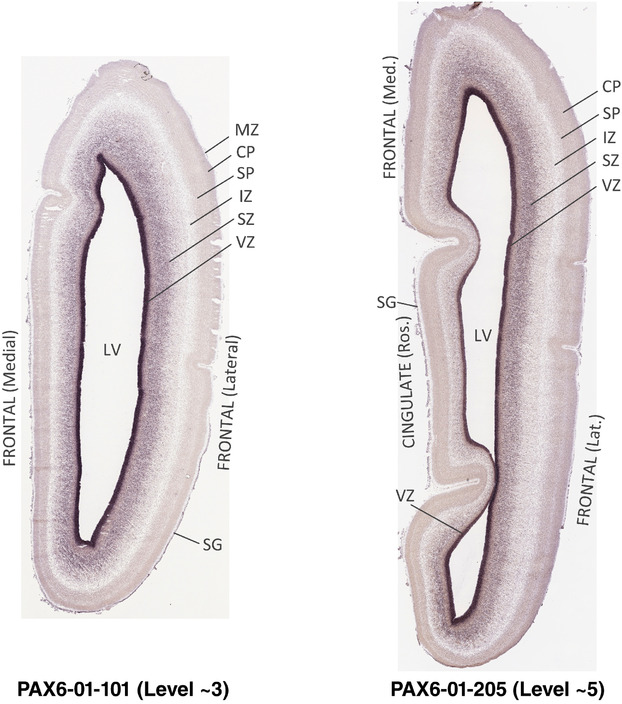
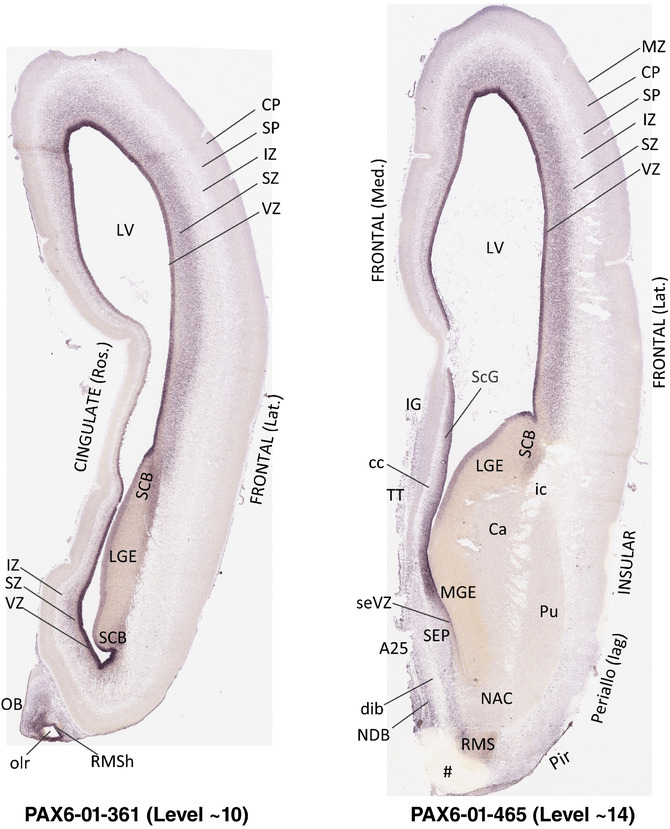
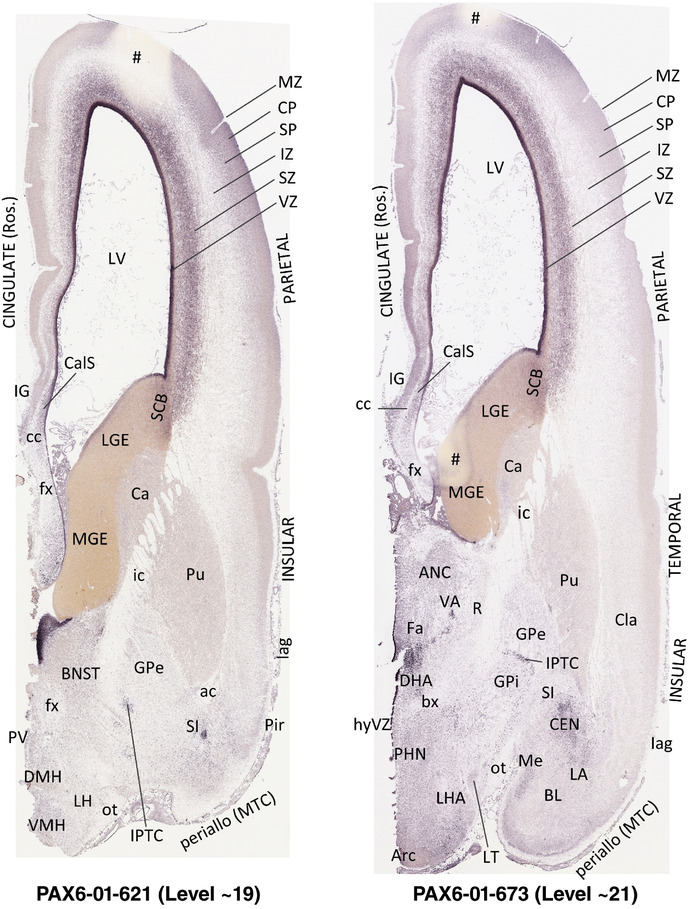
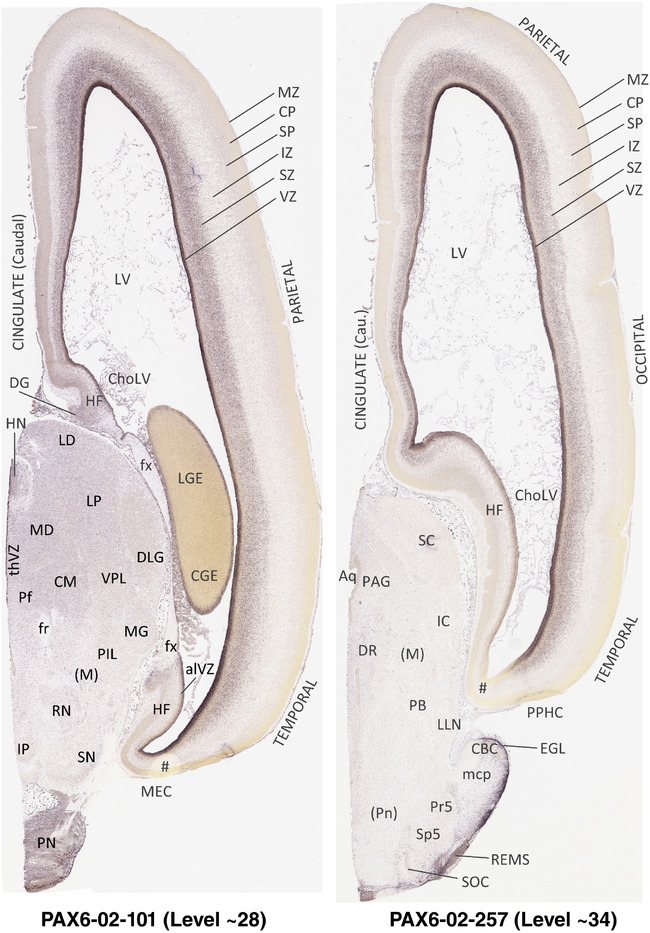
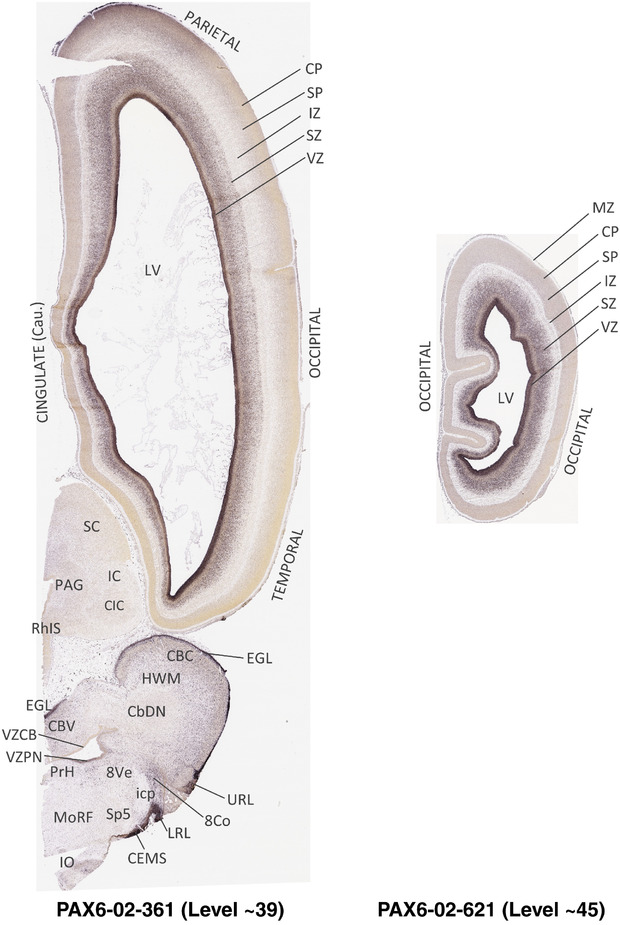
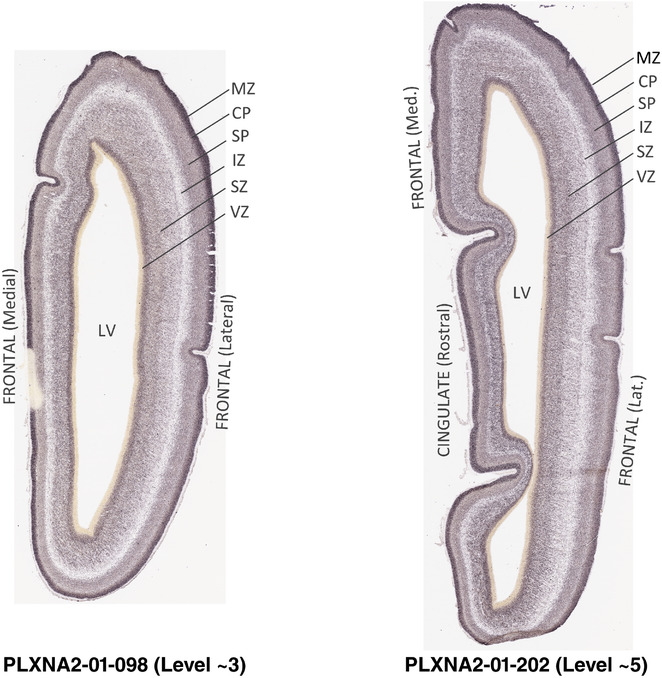
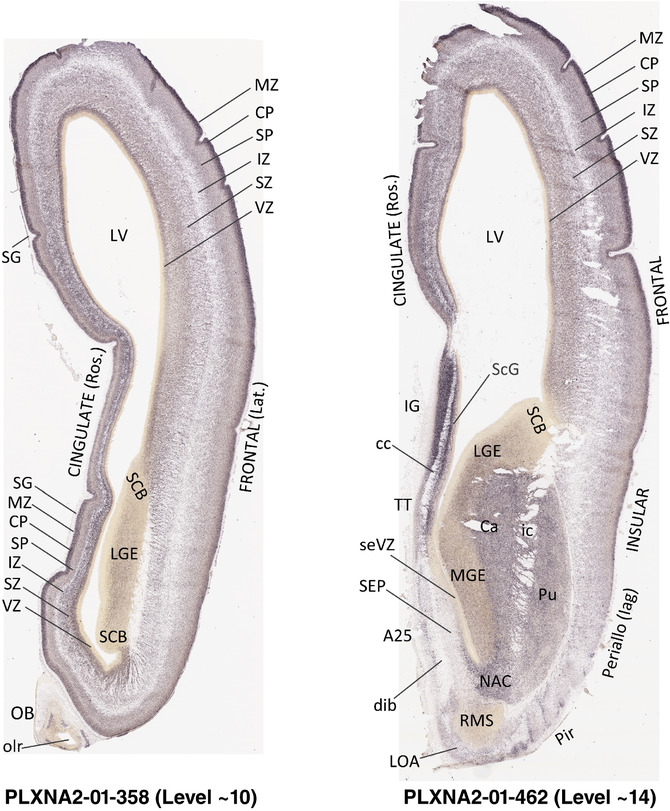
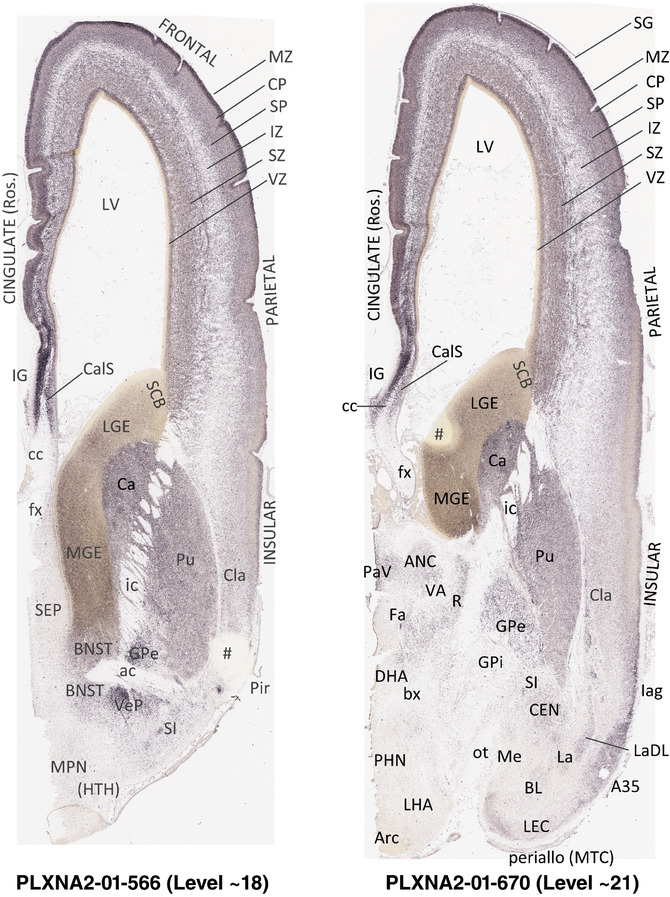
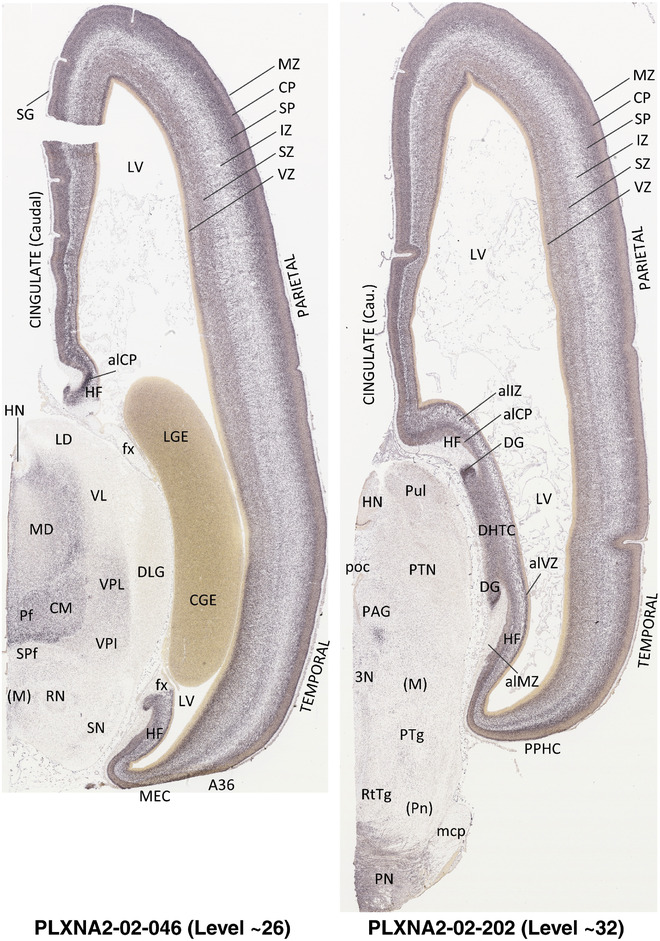
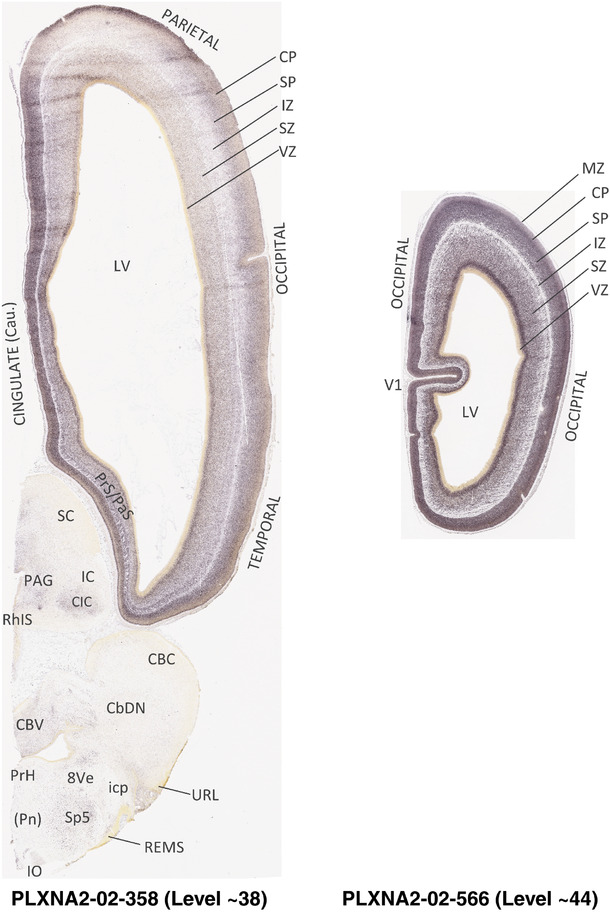
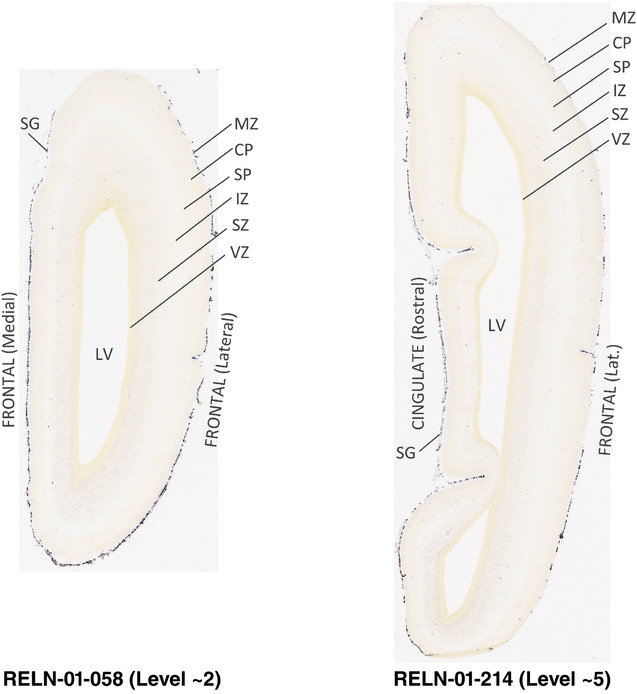
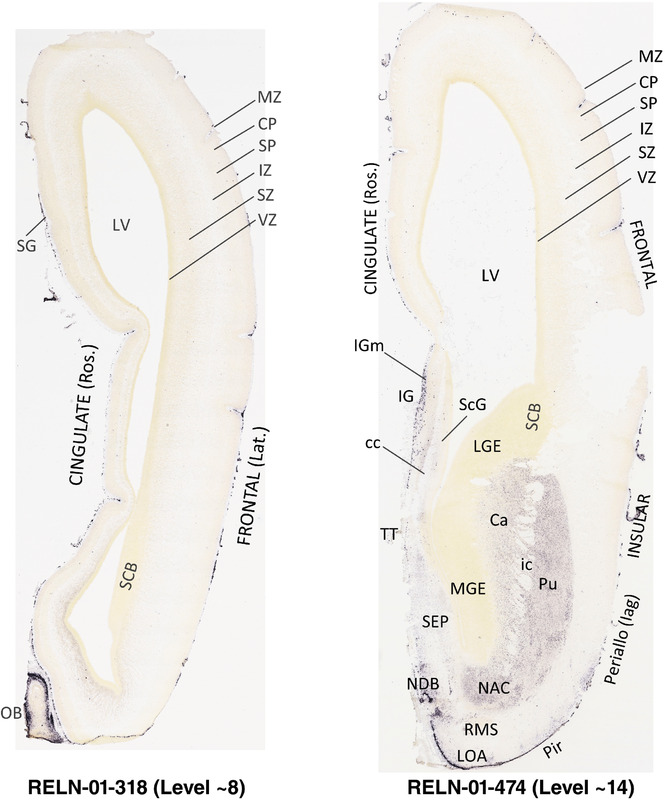
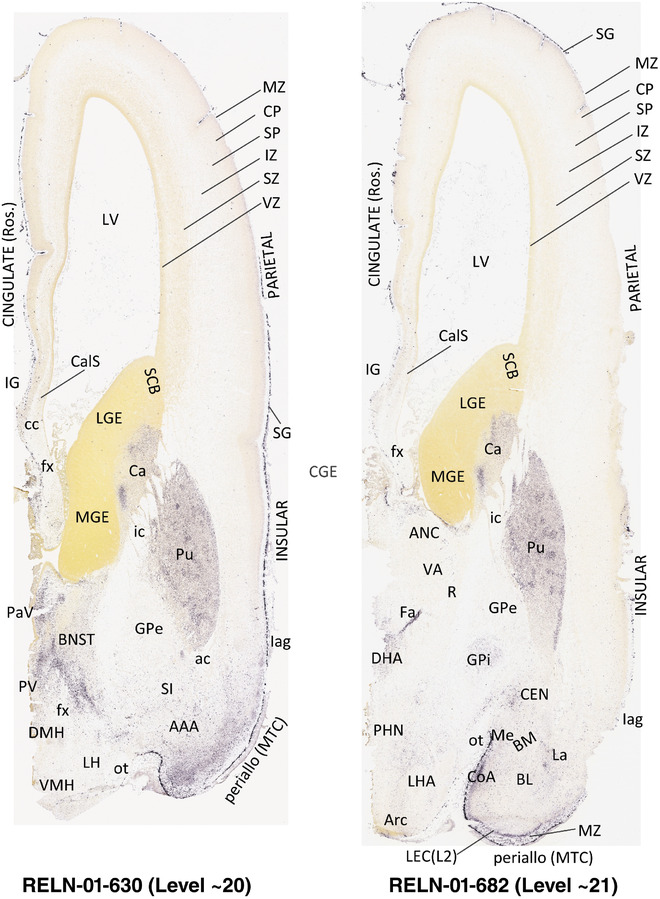
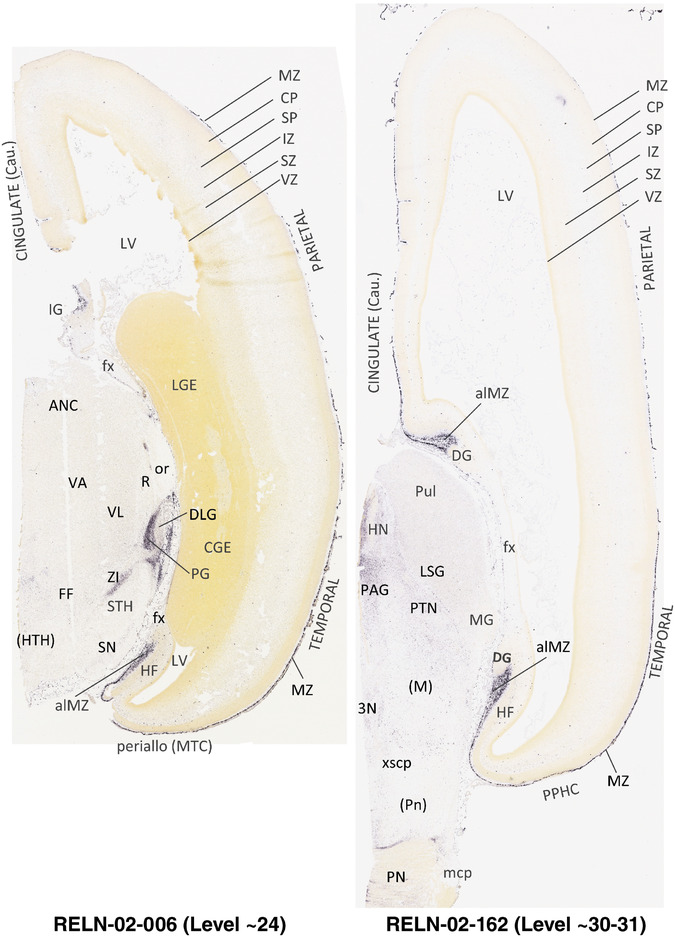
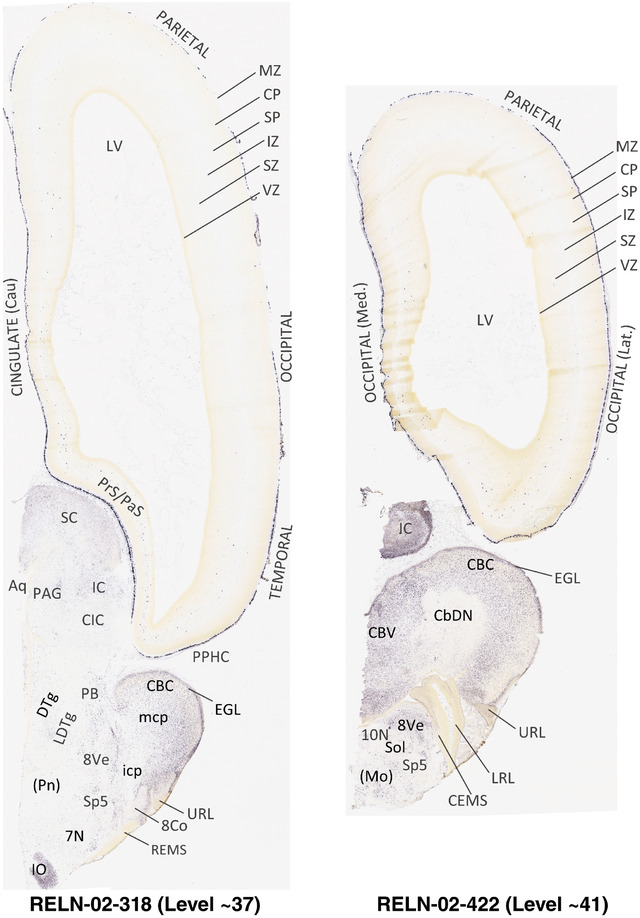
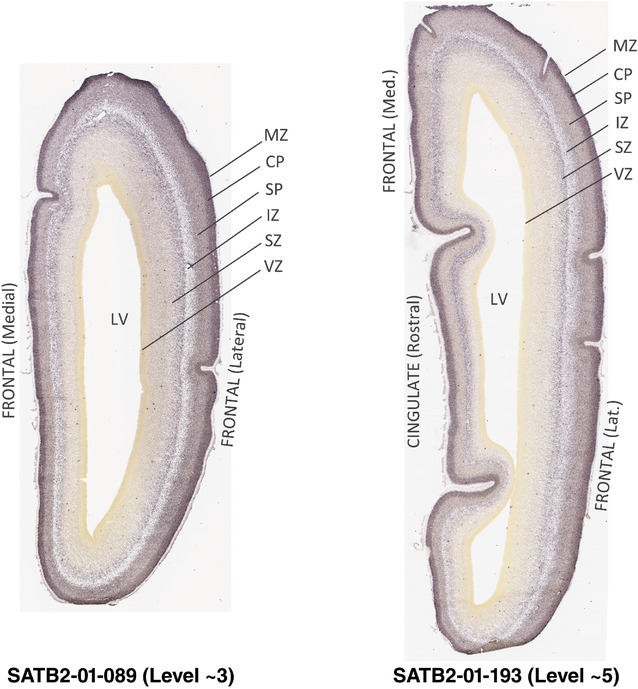
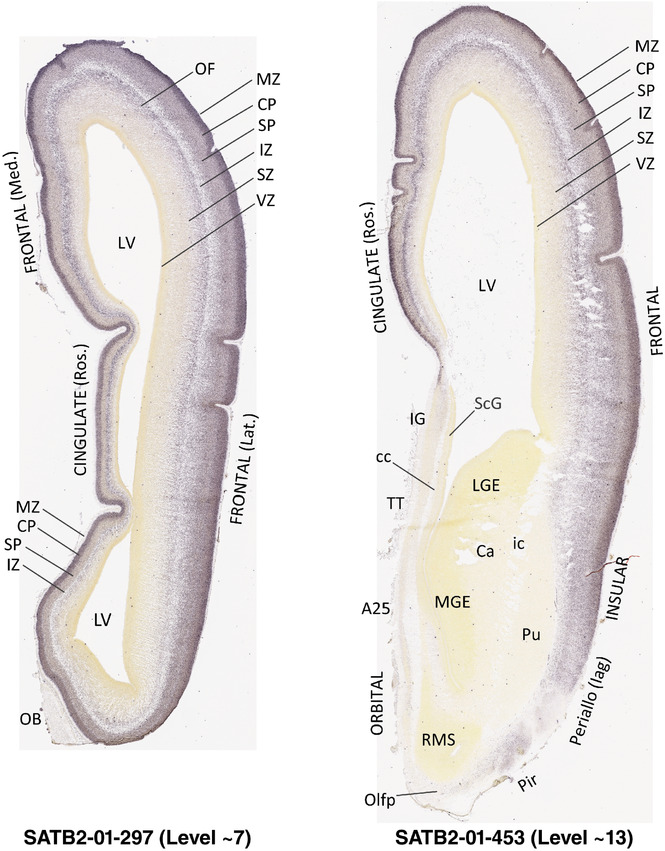
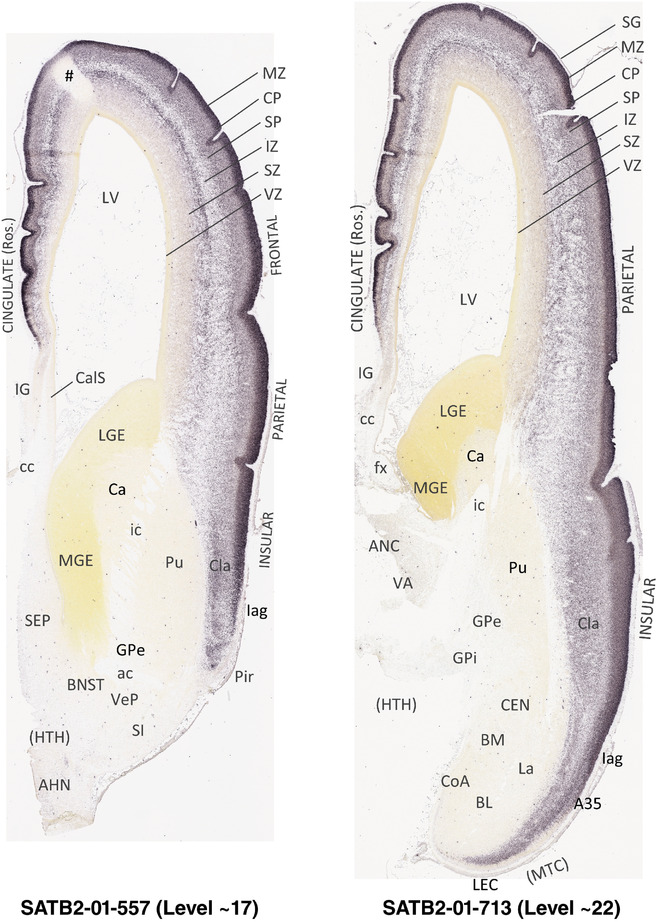
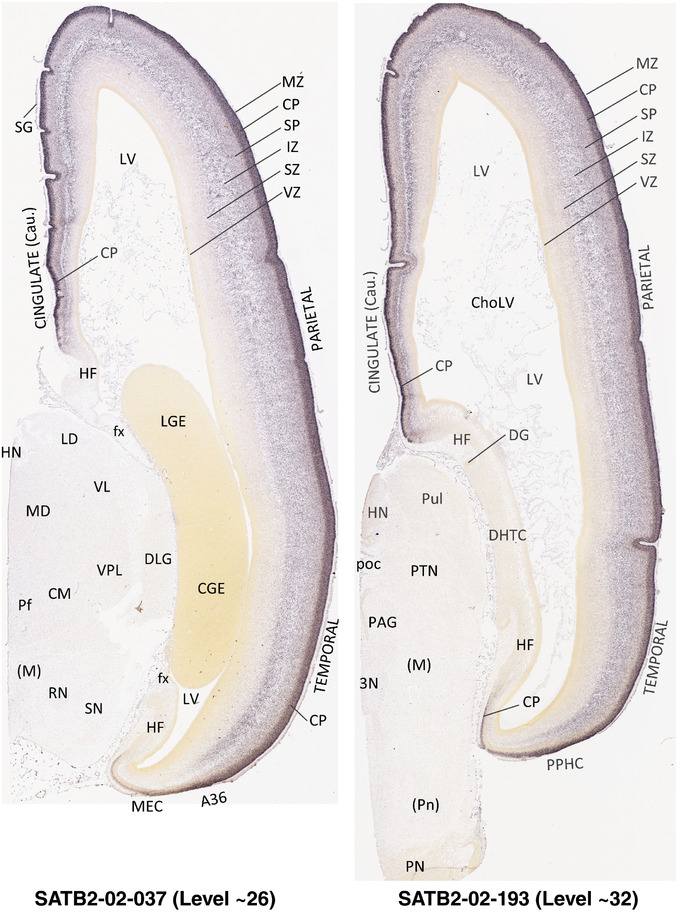
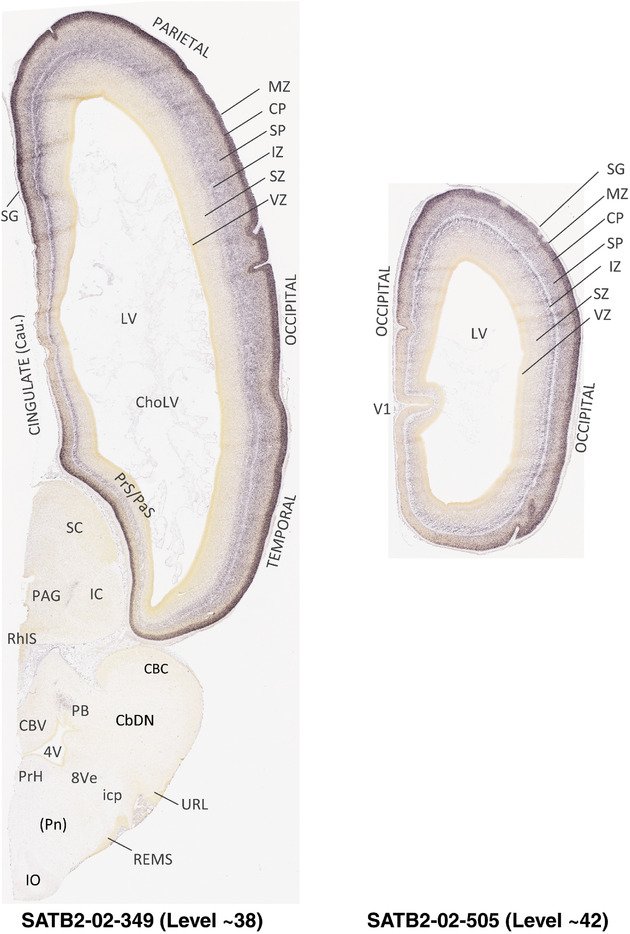
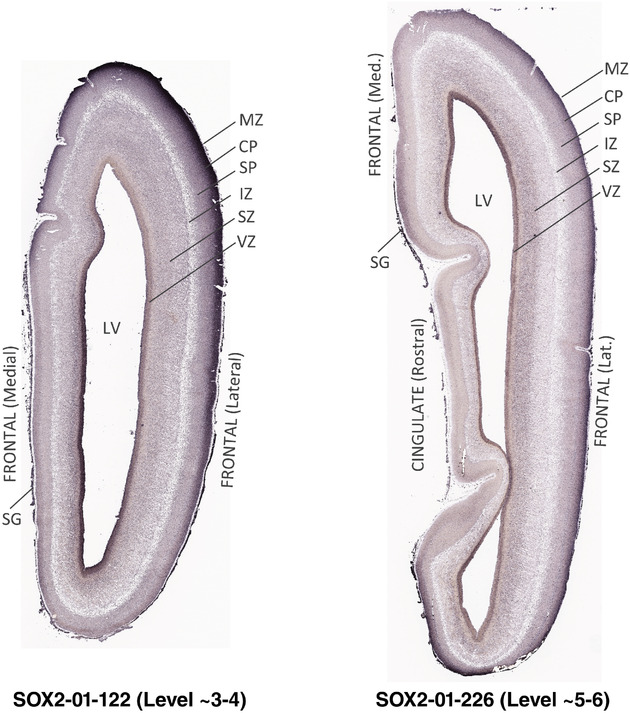
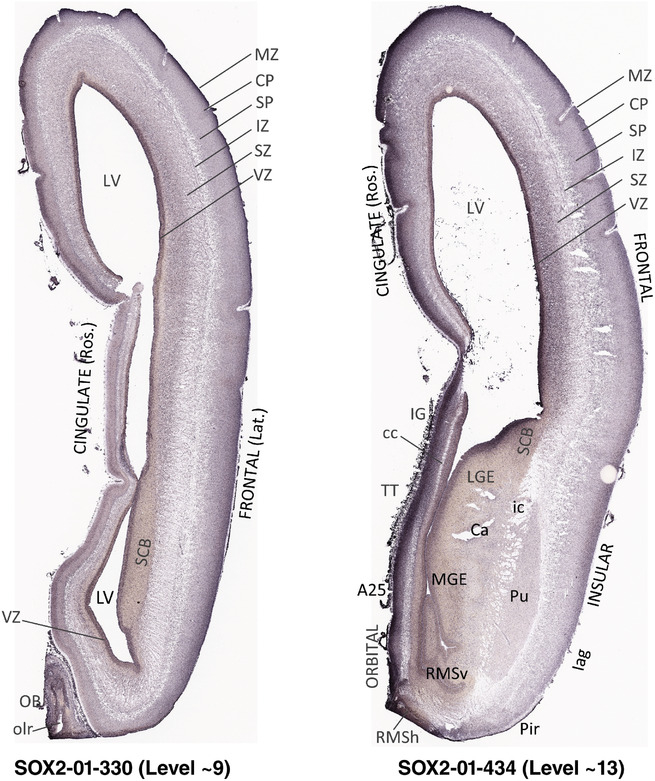
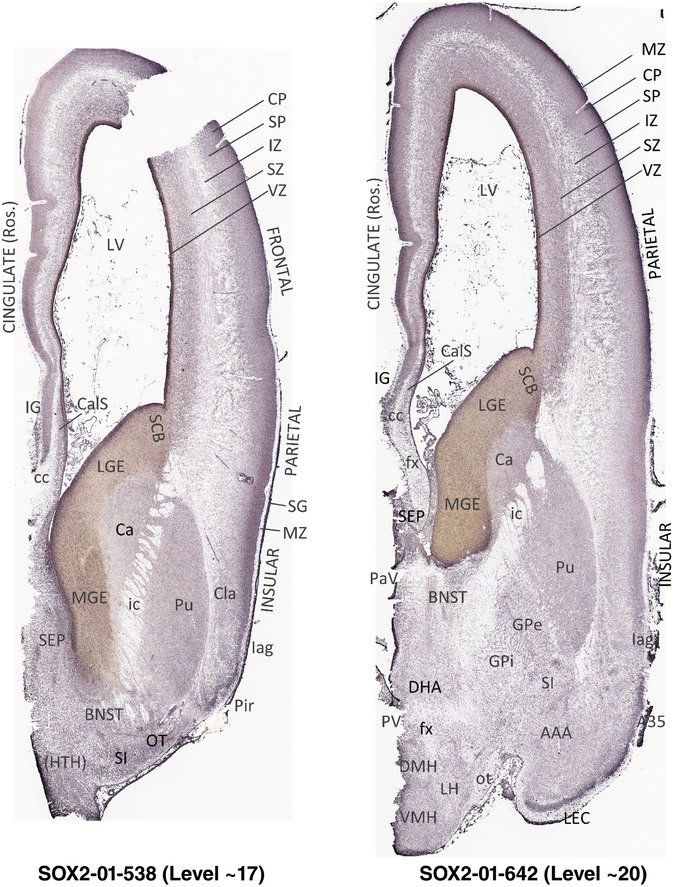
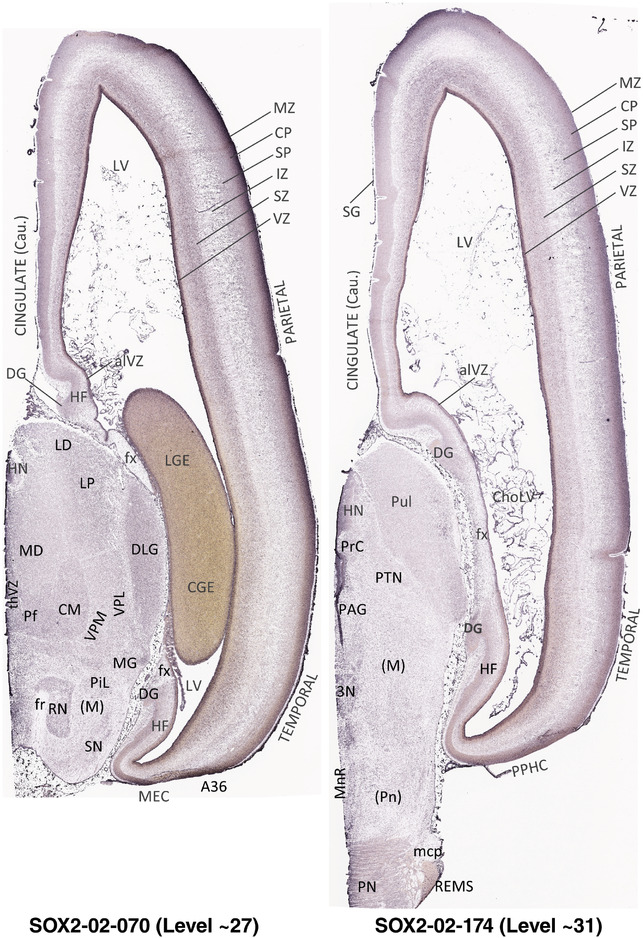
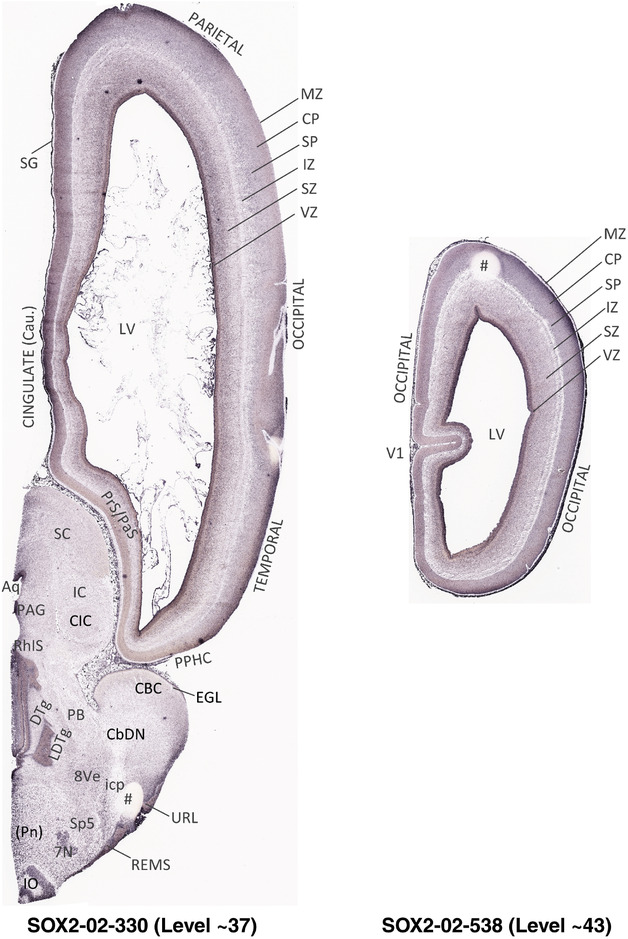
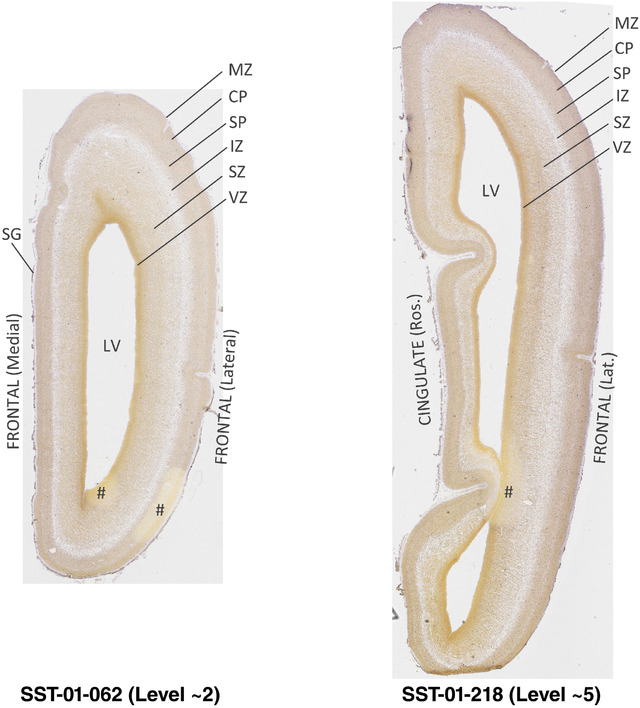
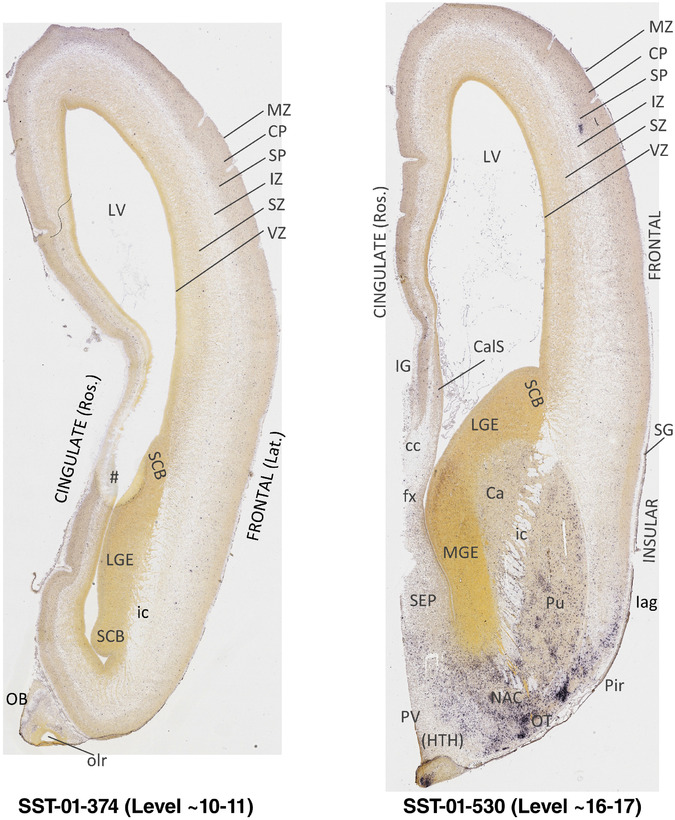
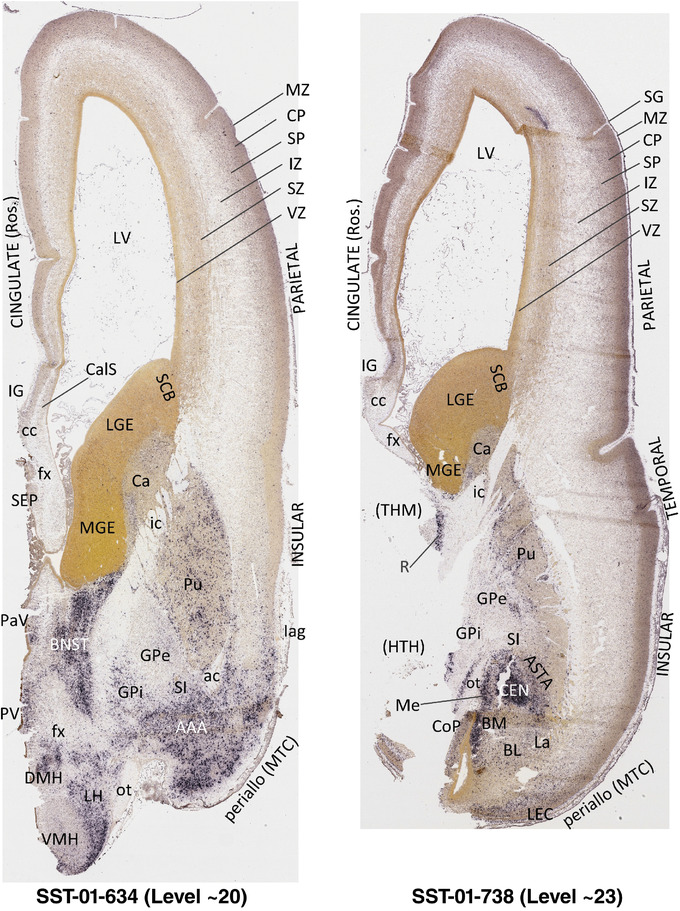
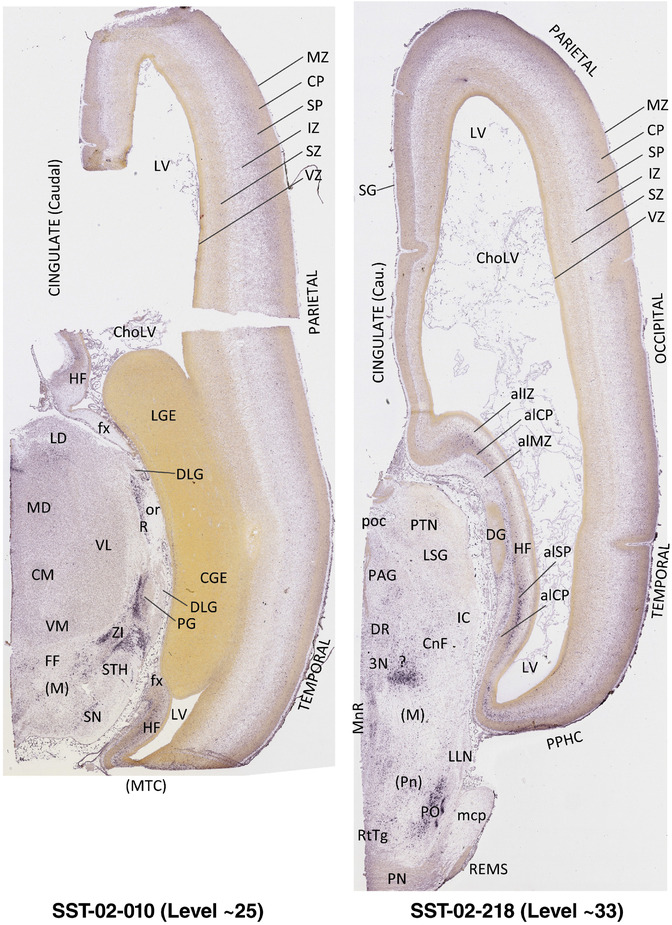
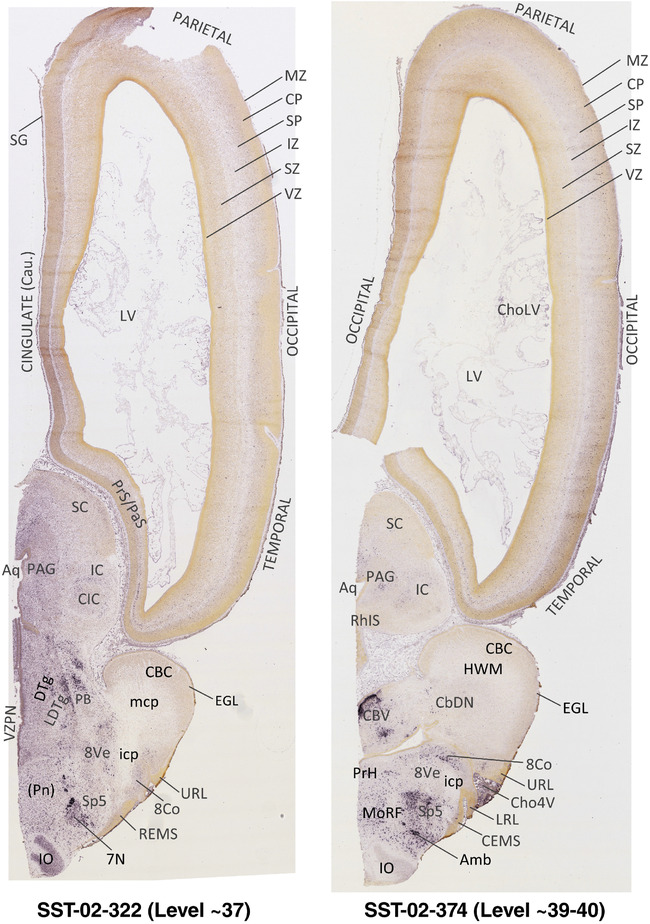
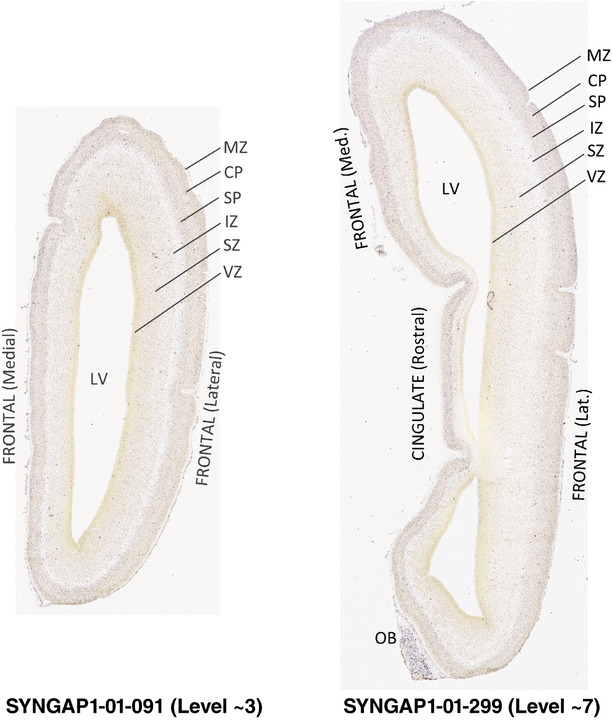
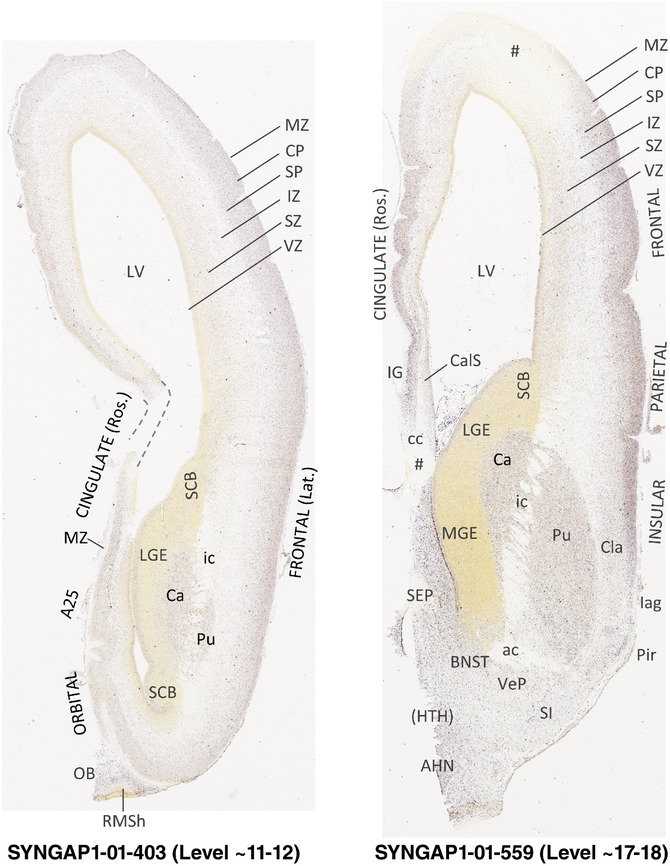
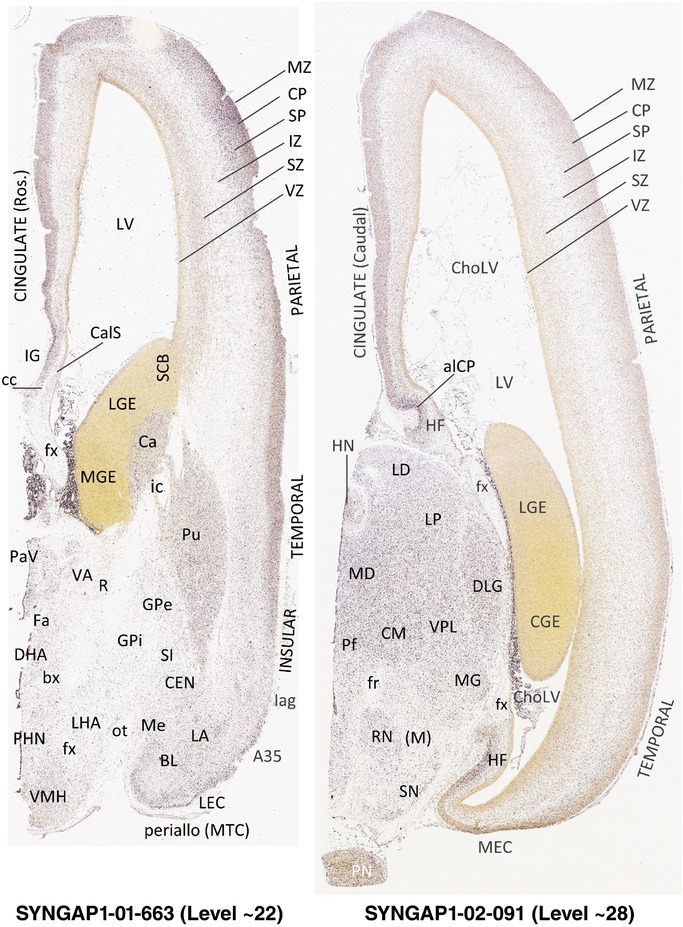
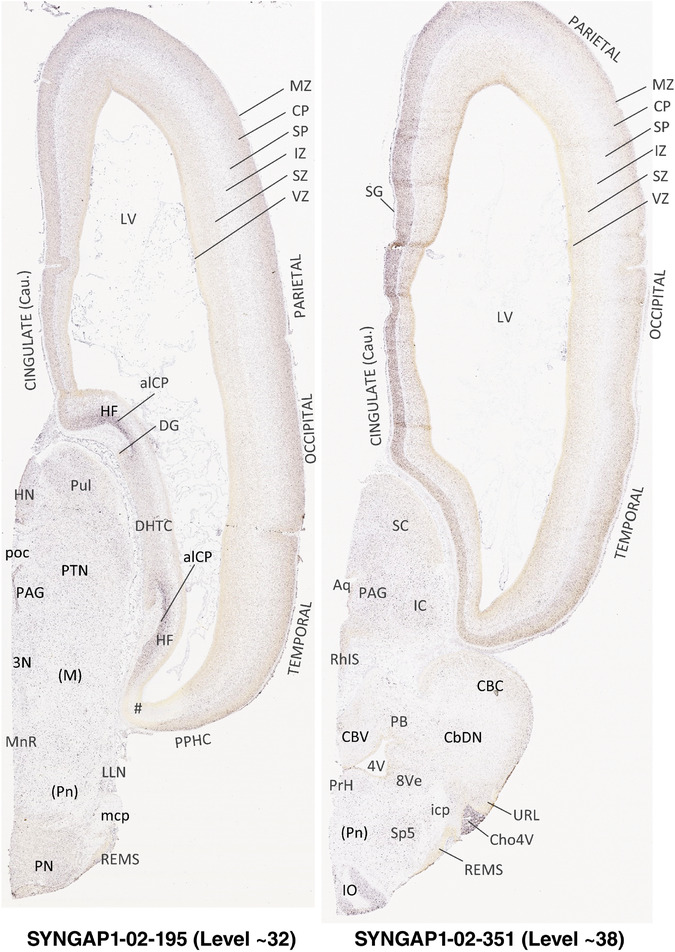
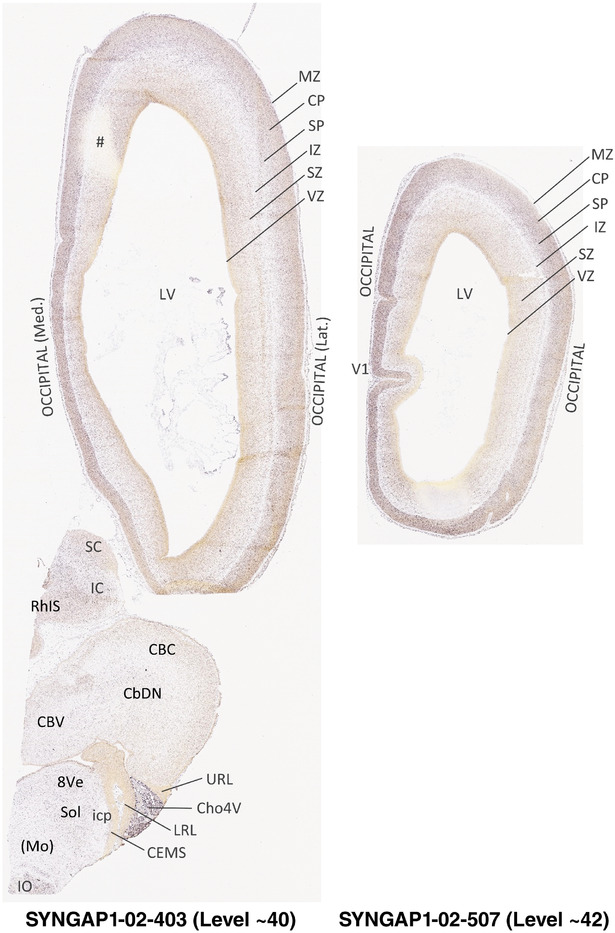
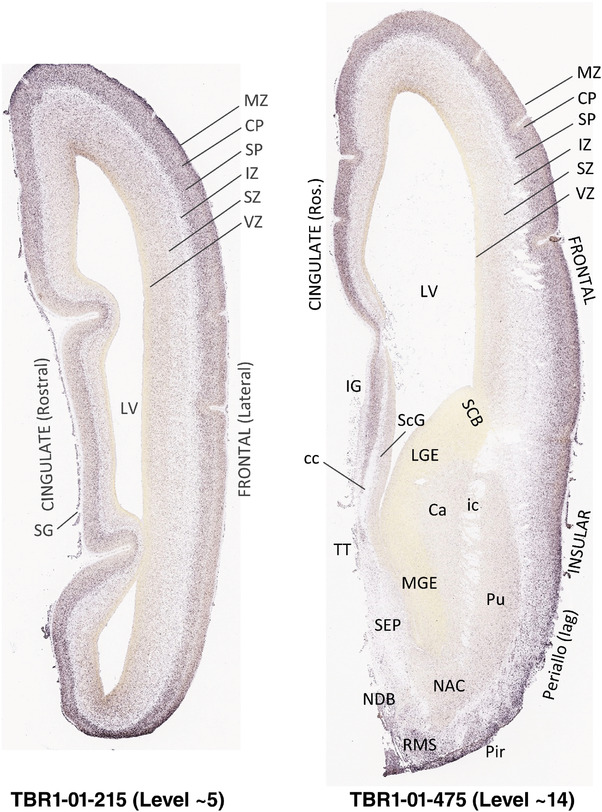
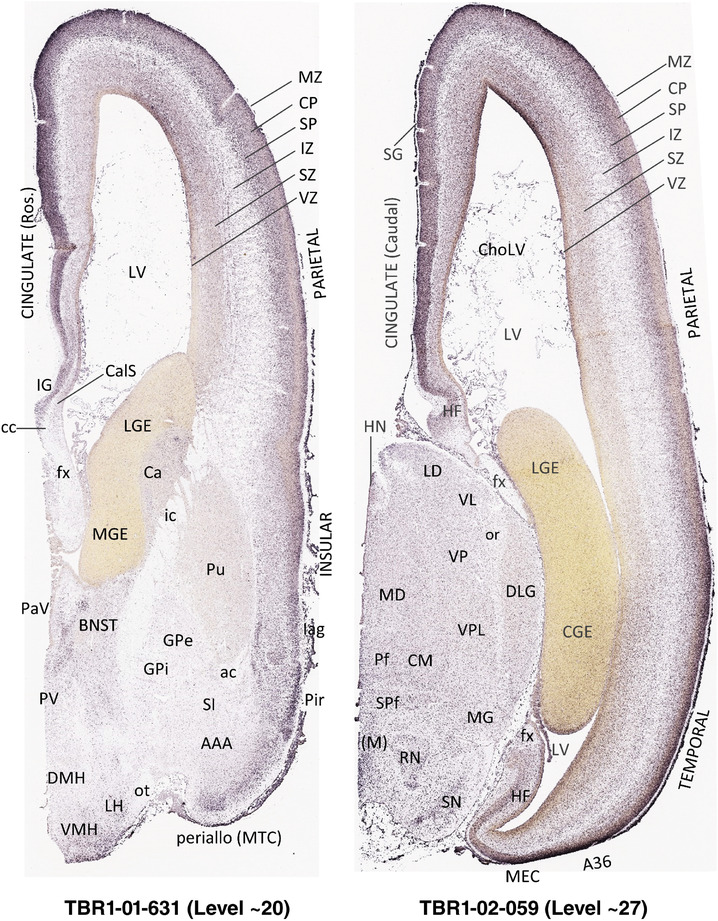
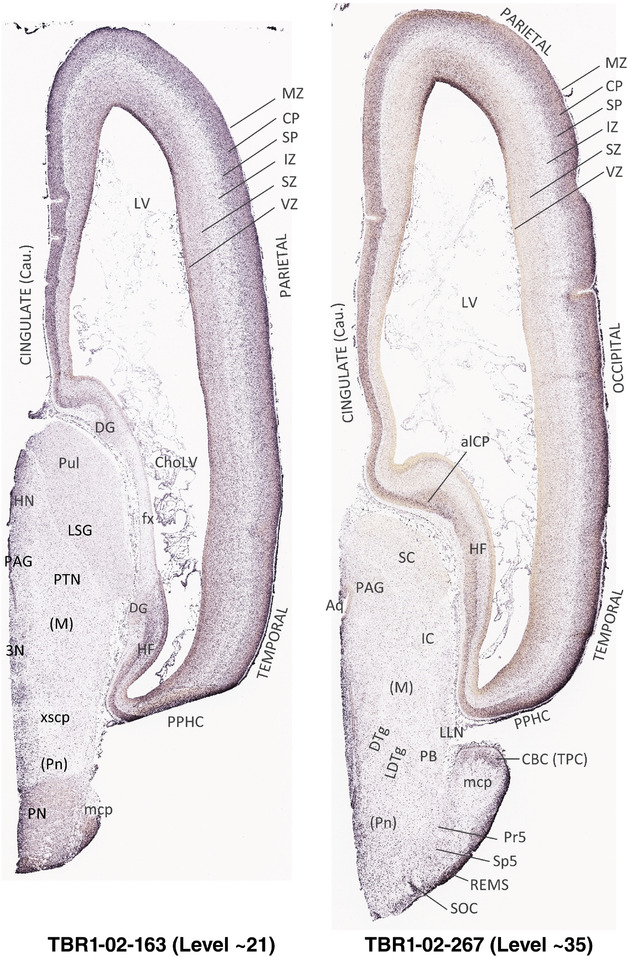
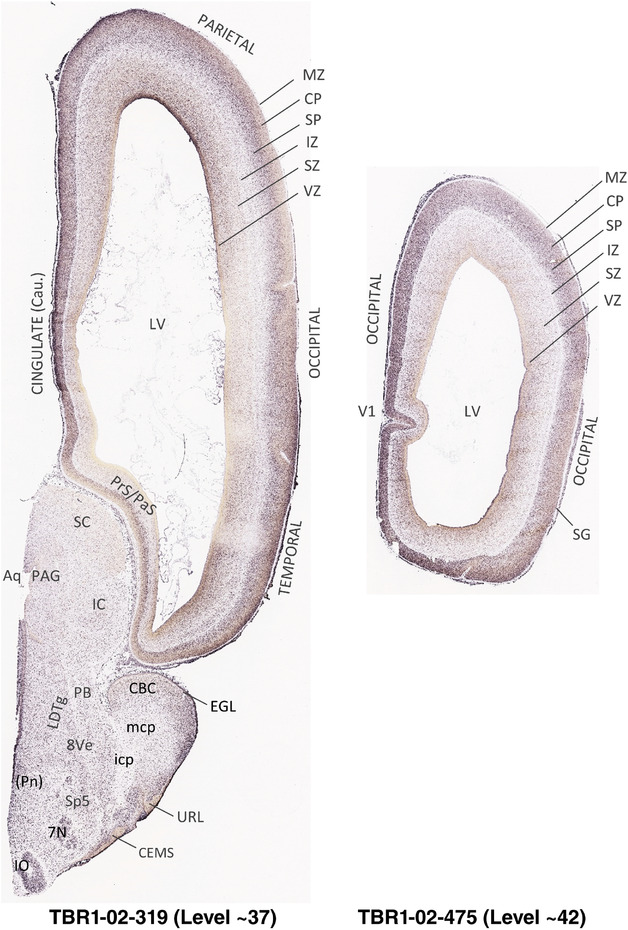
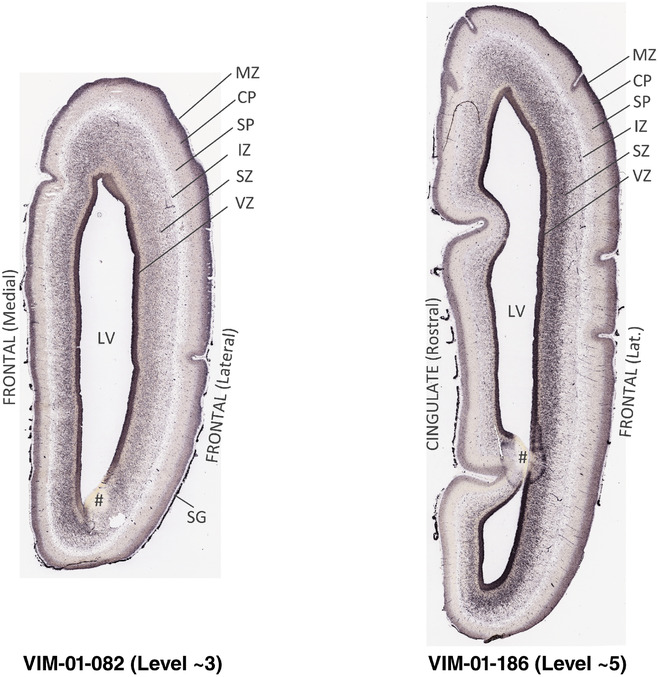
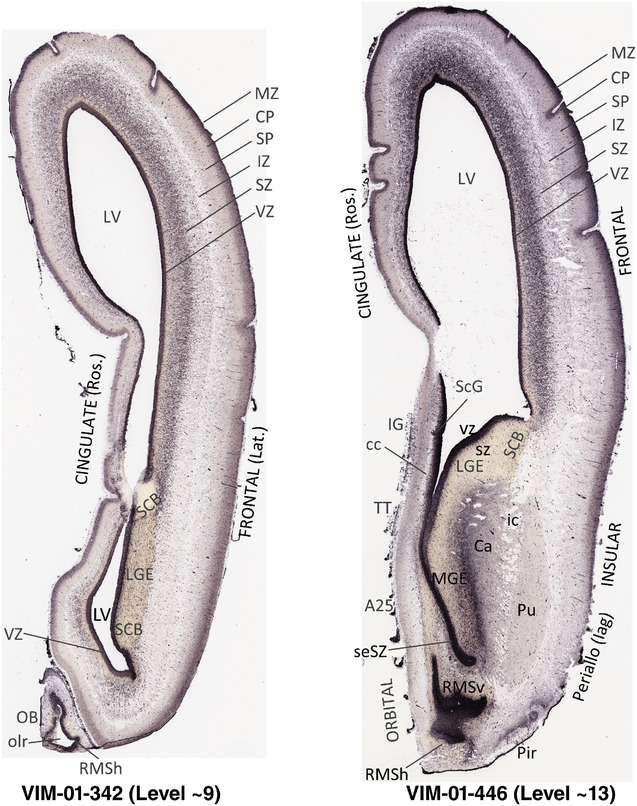
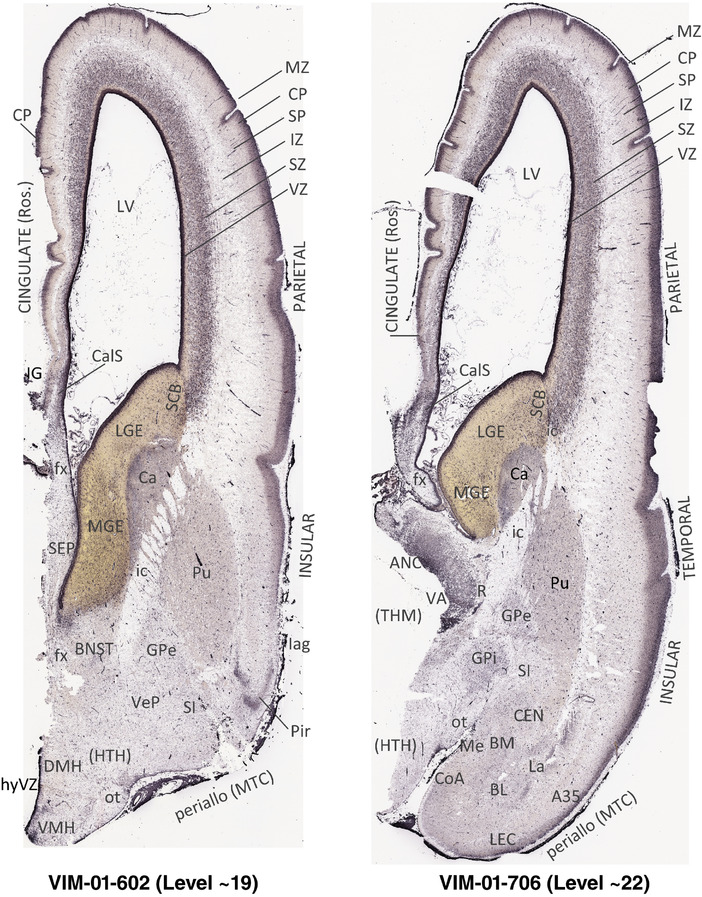
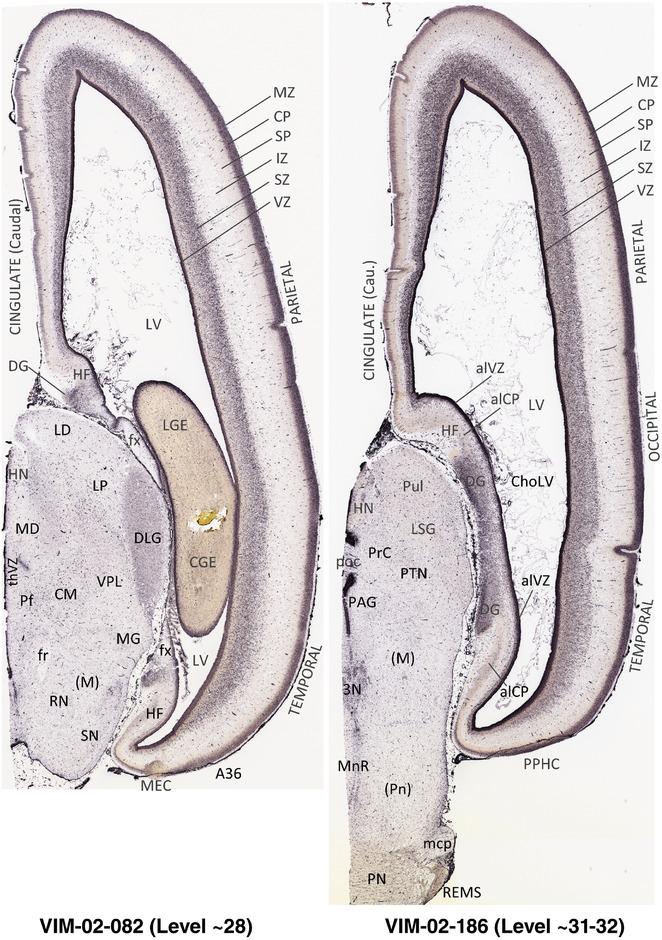
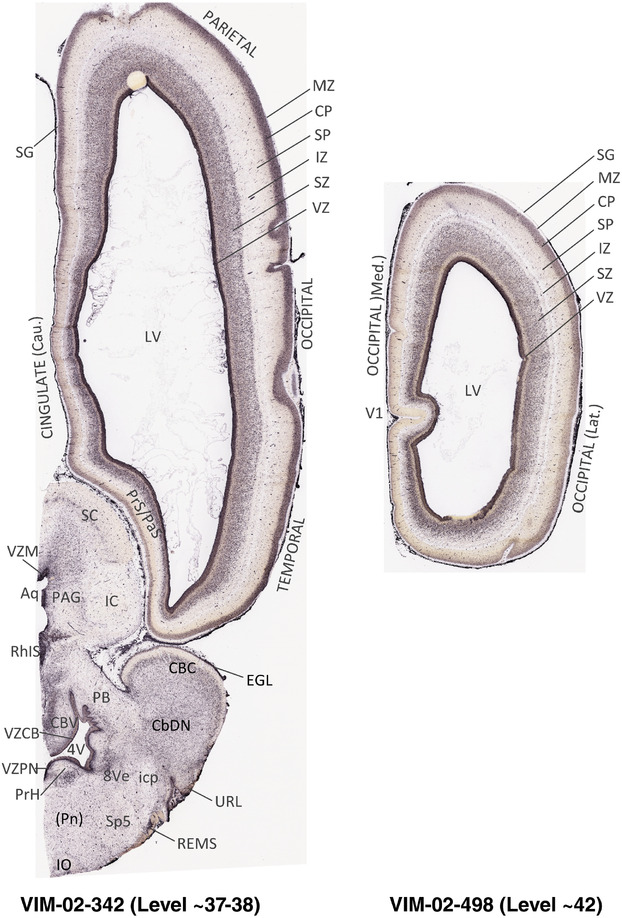
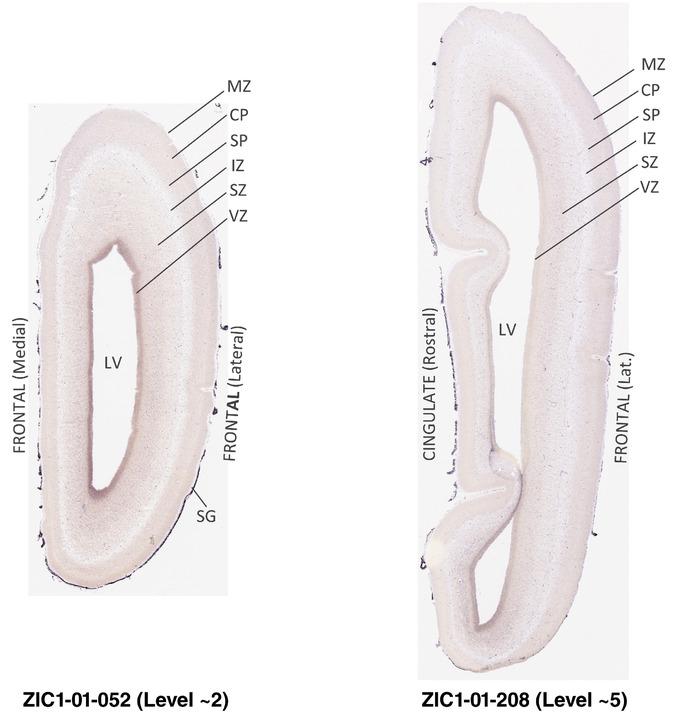
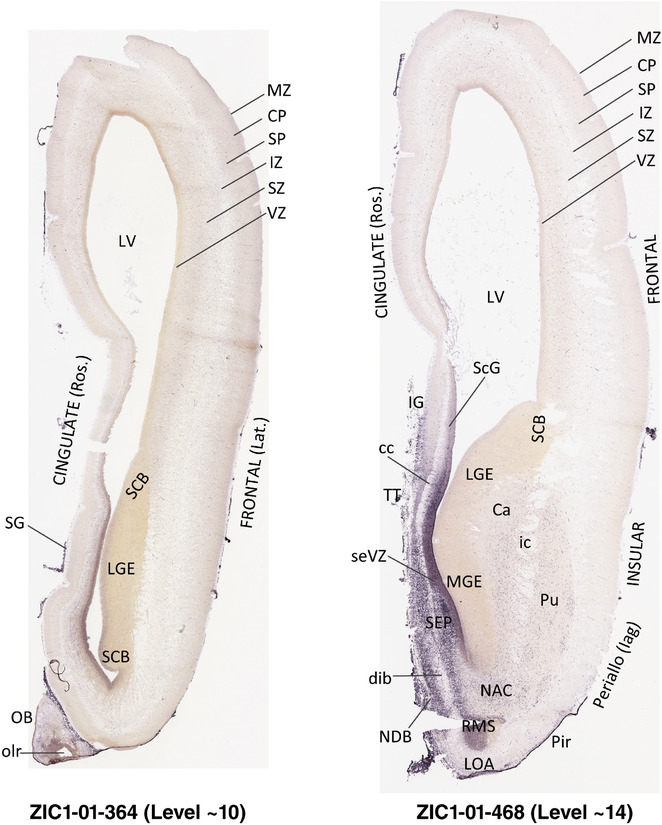
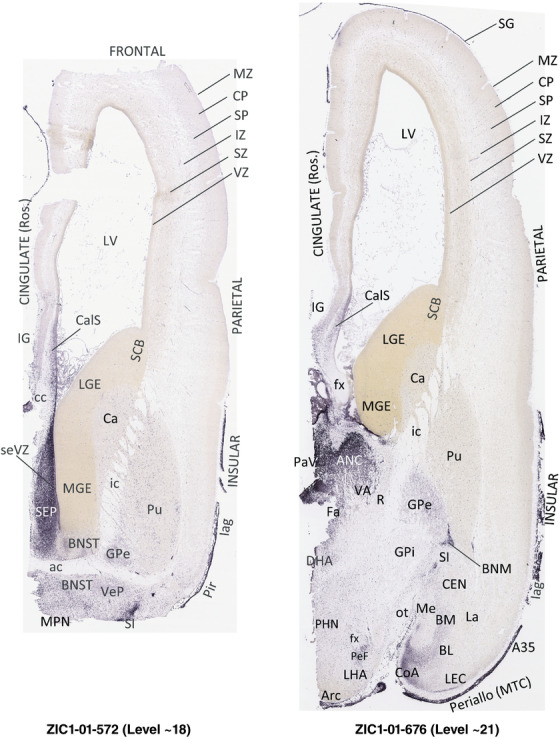
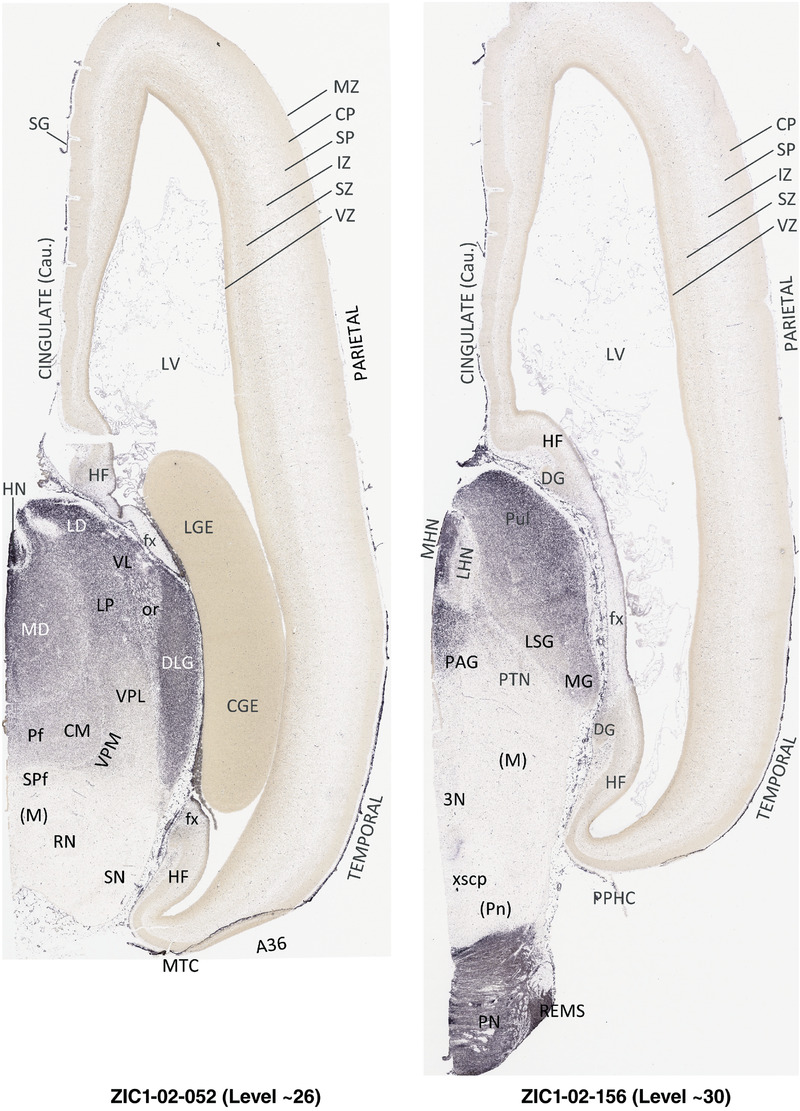
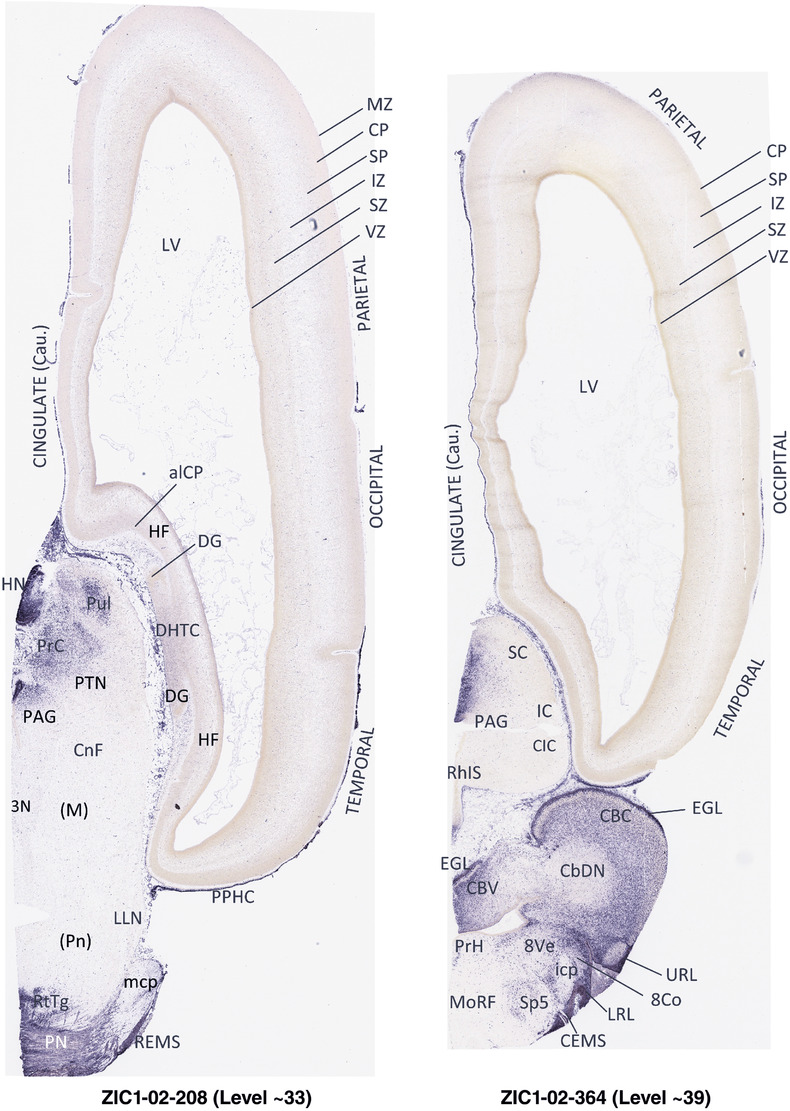
APPENDIX 3 3. Anatomical atlas plates for the prenatal human brain at PCW 21
3.1.
Eighty‐one plates with matching histological (Nissl‐stained) sections are displayed in anterior‐to‐posterior (A‐P) order. The A‐P positions of 81 atlas plates (levels 1−81) and the locations of the four slabs and their starting and ending plate levels in each slab are indicated in the Inset of this Appendix (below). For each atlas plate, its A‐P levels, slab, and section numbers are labeled in this style: Level number (slab number‐sections number in the slabs). For example, Level 1 (01−026) represents the 26th section from slab 1, which is atlas plate 1 (i.e., Level 1). The matching Nissl‐stained sections are labeled in this way: NISSL‐slab section number in the slabs. For example, NISSL‐01−026 represents the 26th section from slab 1, on which the annotation of atlas plate 1 (Level 1) was performed. In addition, one series of sequential AChE‐stained sections from the same brain hemisphere is also available and linked online here (https://www.brainspan.org/ish/experiment/show?id=100134984). The parcellation and subdivisions of different brain regions as well as the parent–daughter relationship and abbreviation of each structure are detailed in Table 1 (for transient structures) and in our adult human brain atlas (Ding et al., 2016; for permanent structures). Note that all annotated brain structures and their abbreviation in this atlas can be searched in the interactive window of the online version of this atlas (www.brainspan.org or http://brainspan.org/static/atlas).
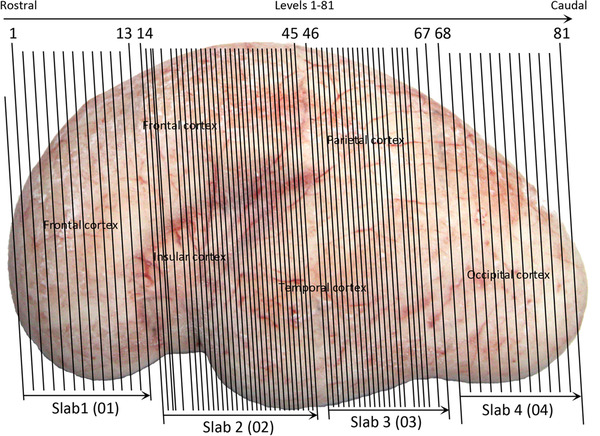
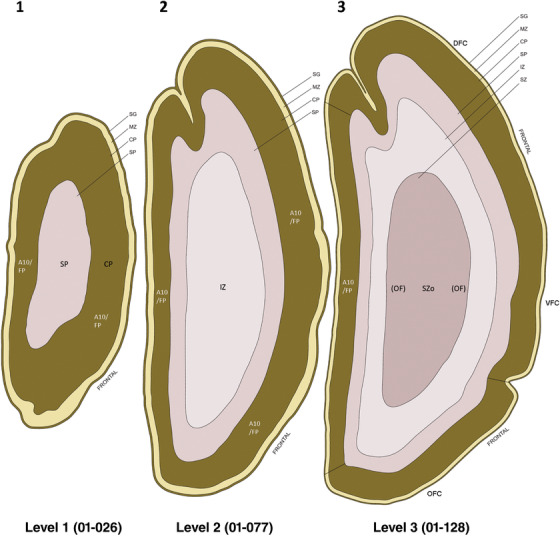
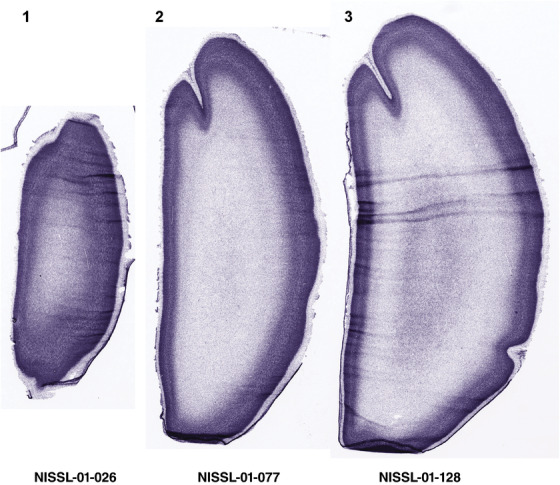
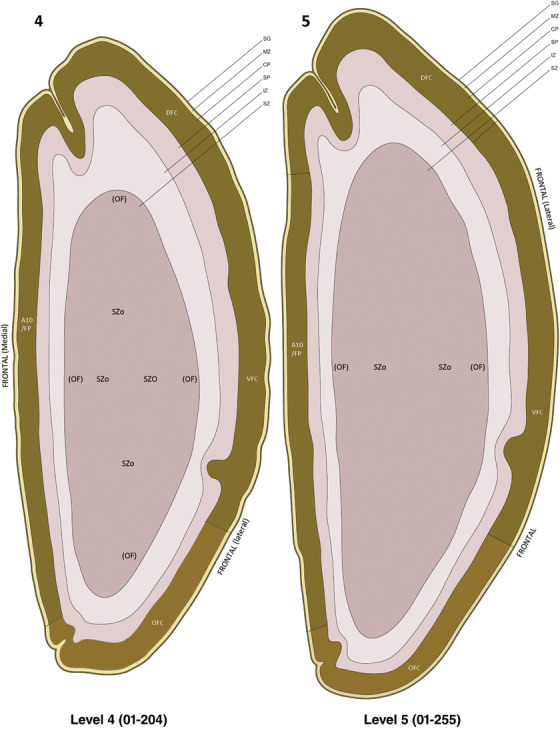
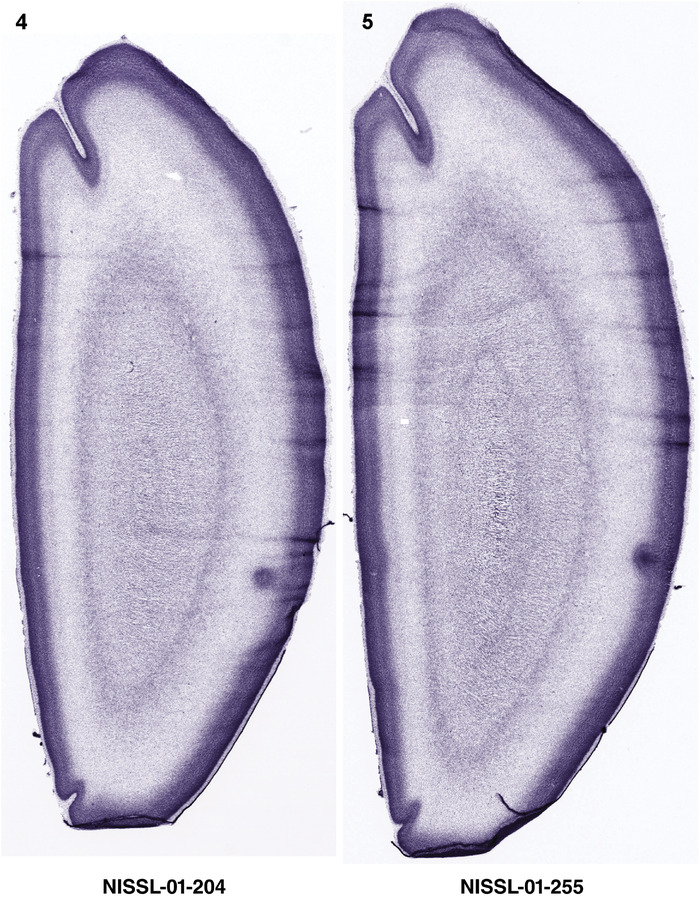
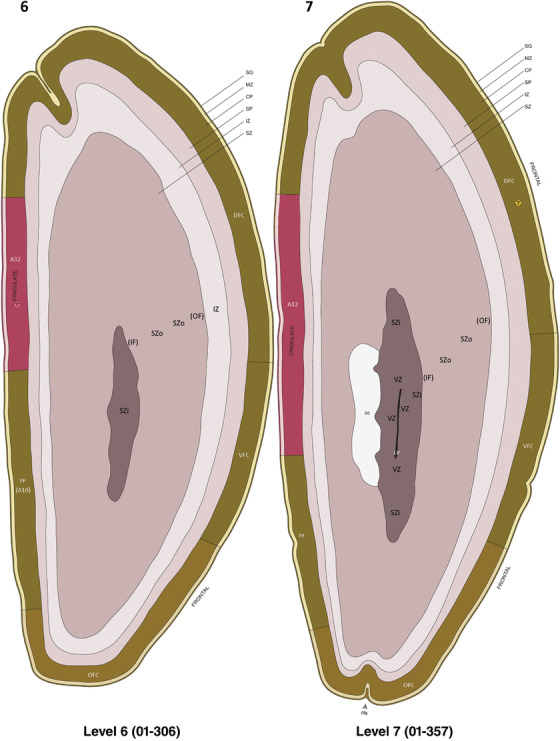
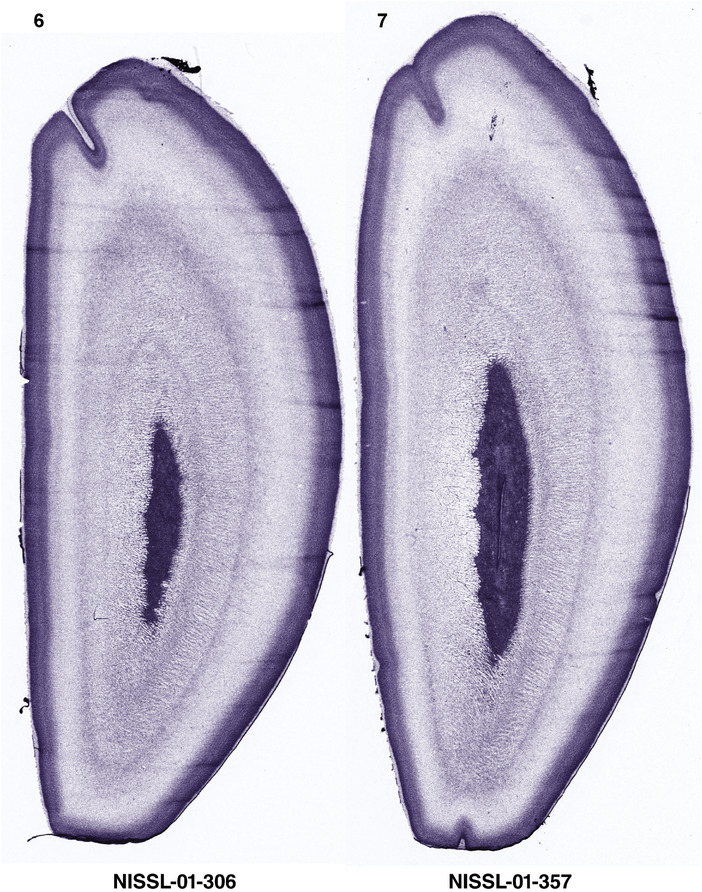
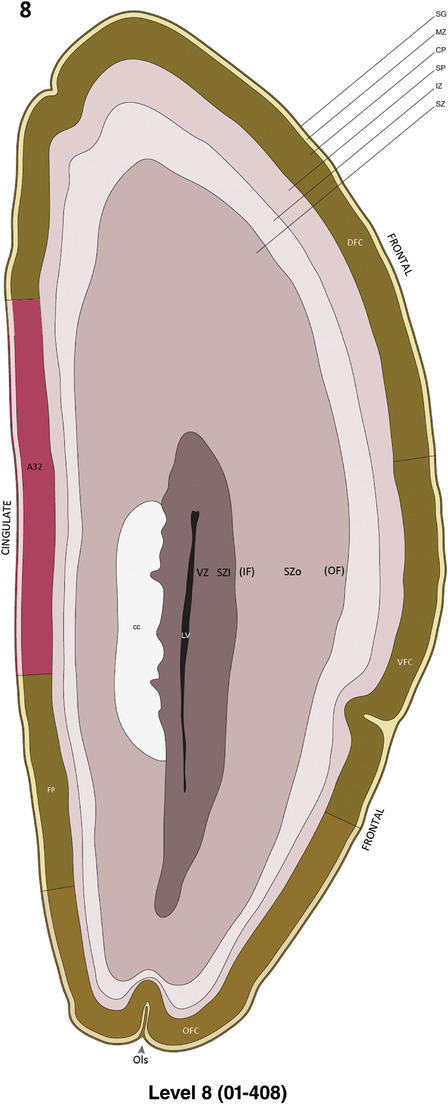
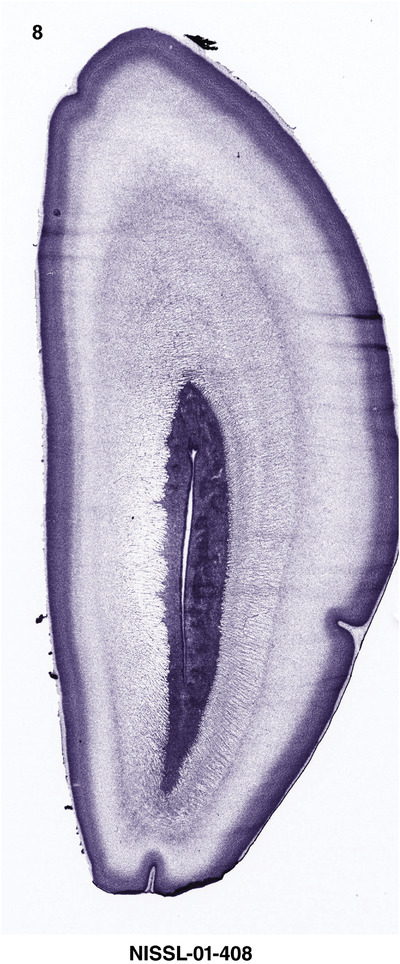
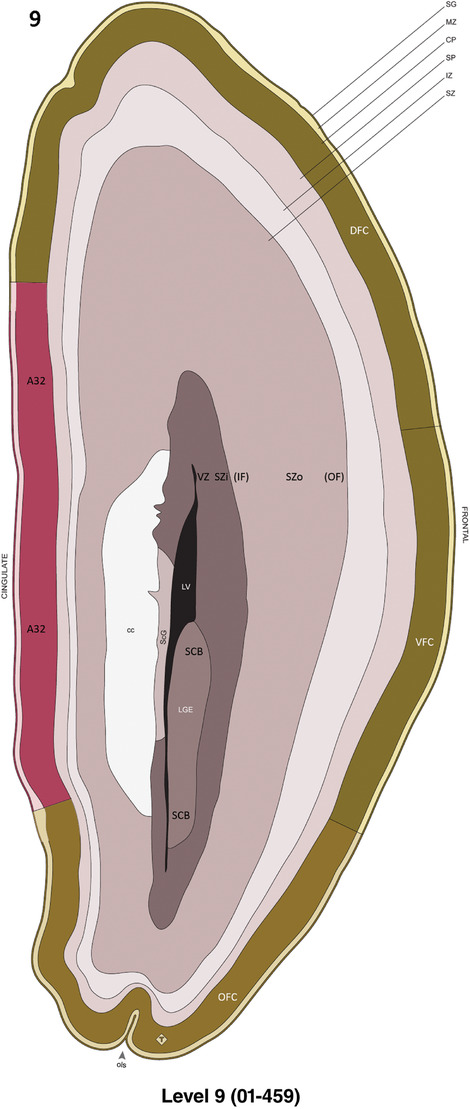
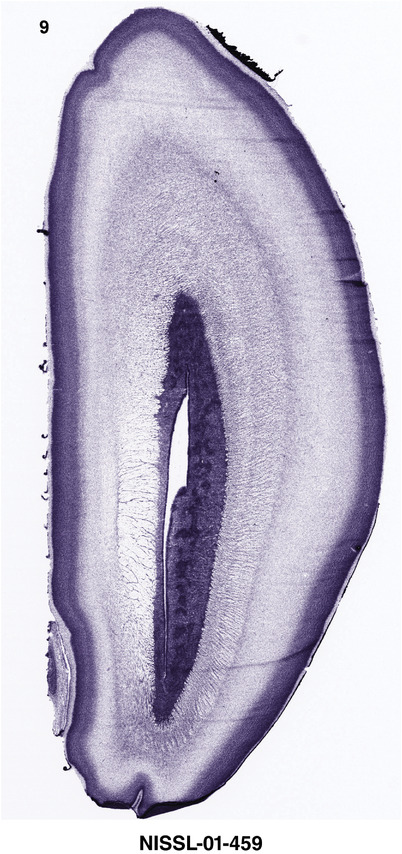
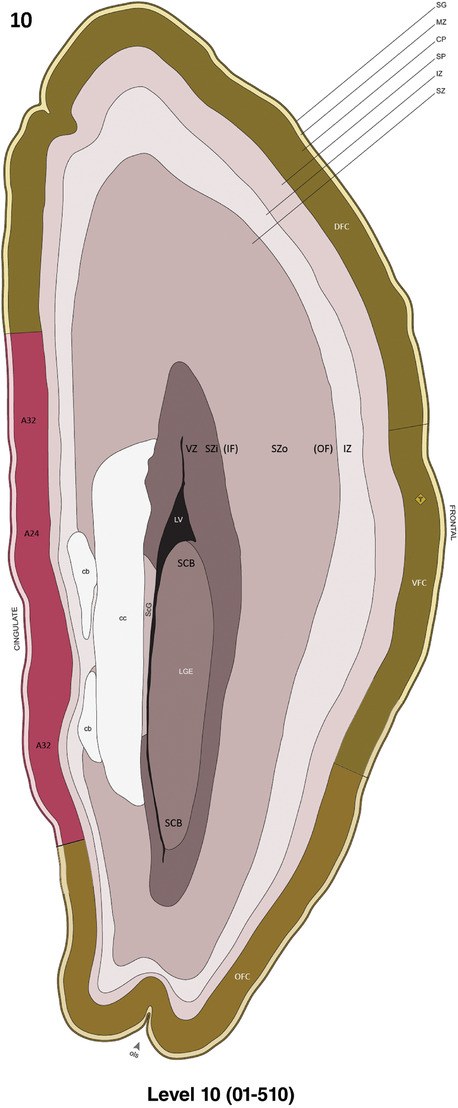
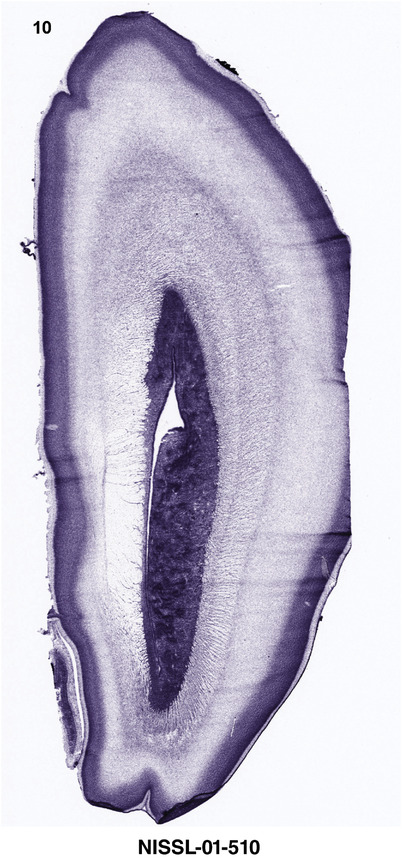
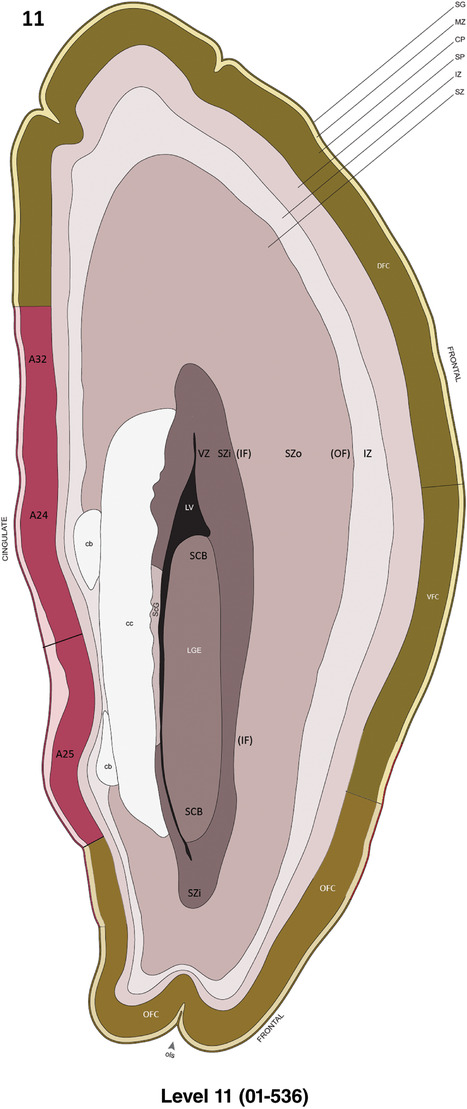
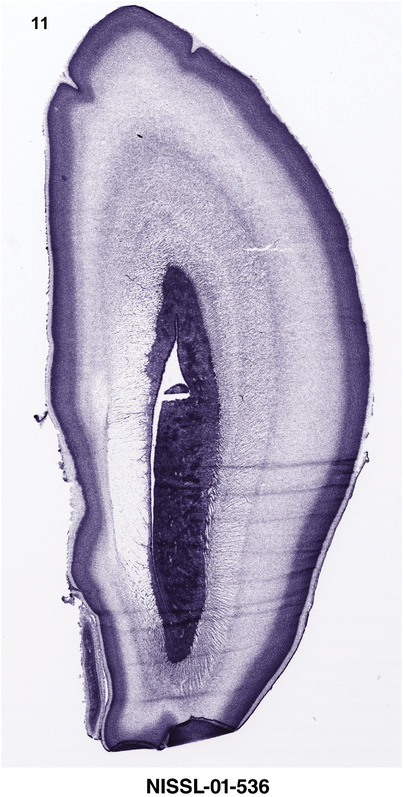
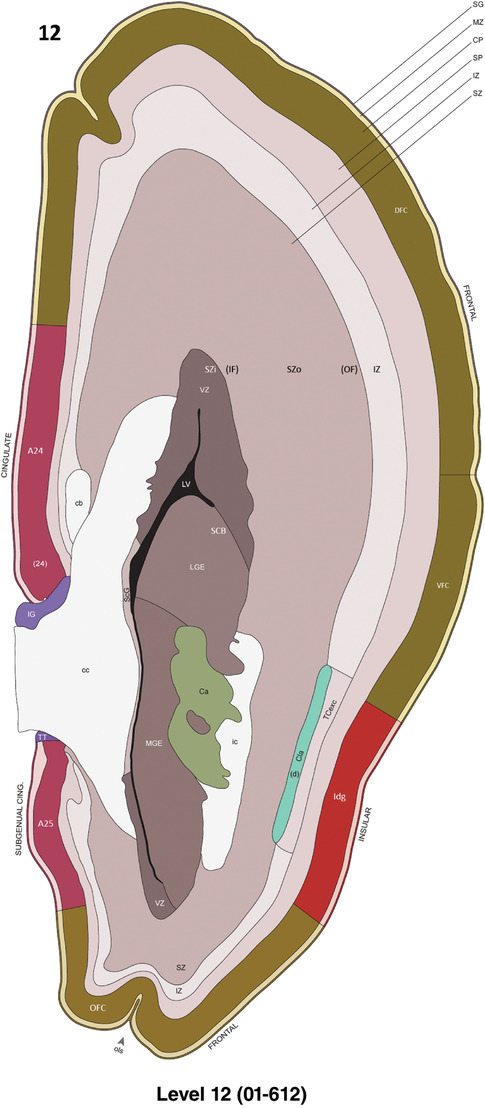
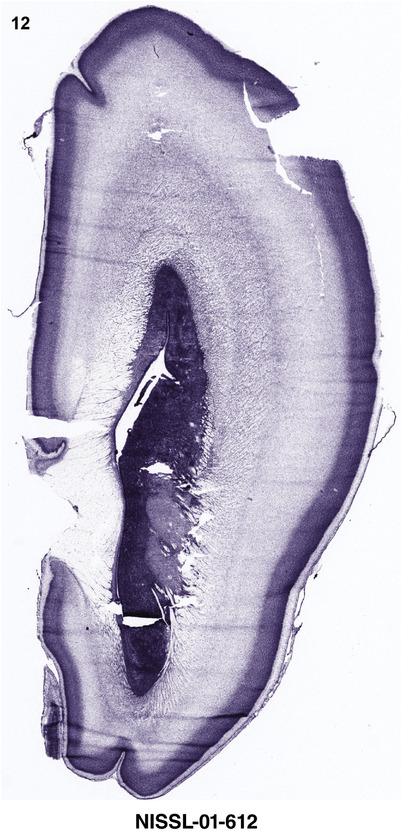
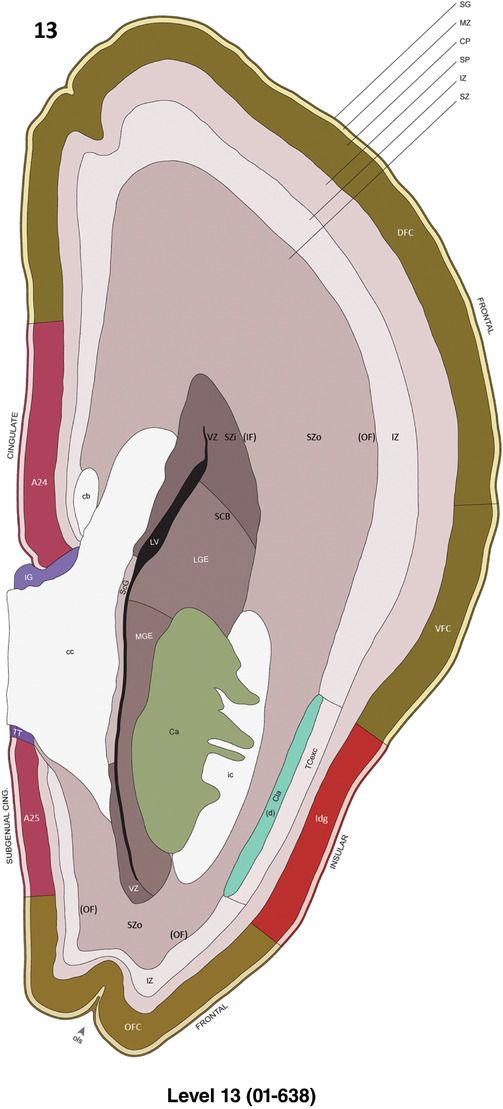
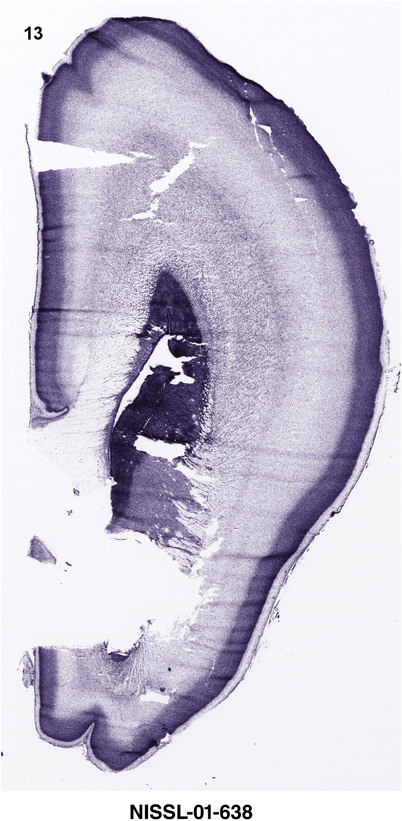
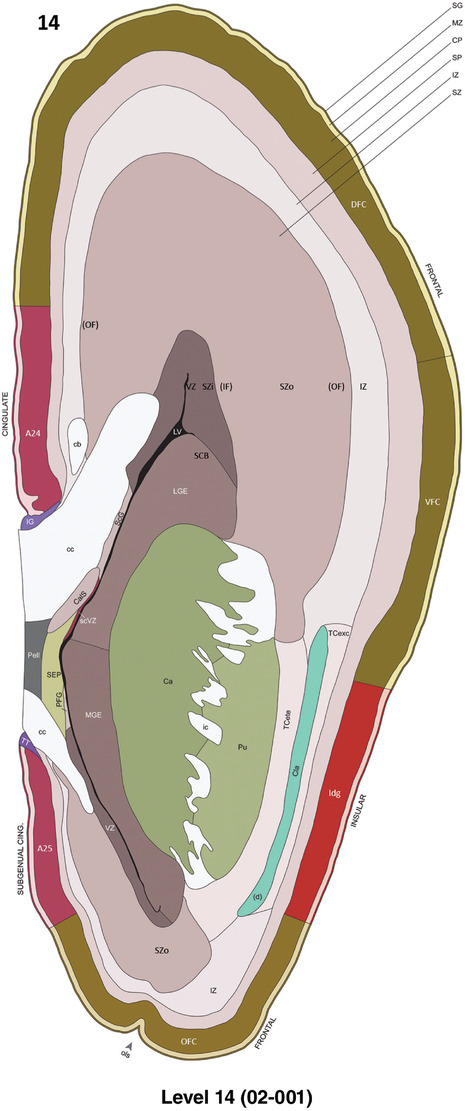
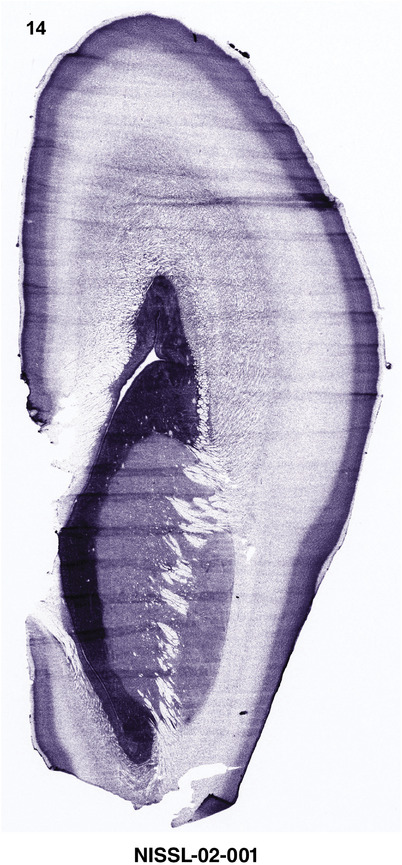
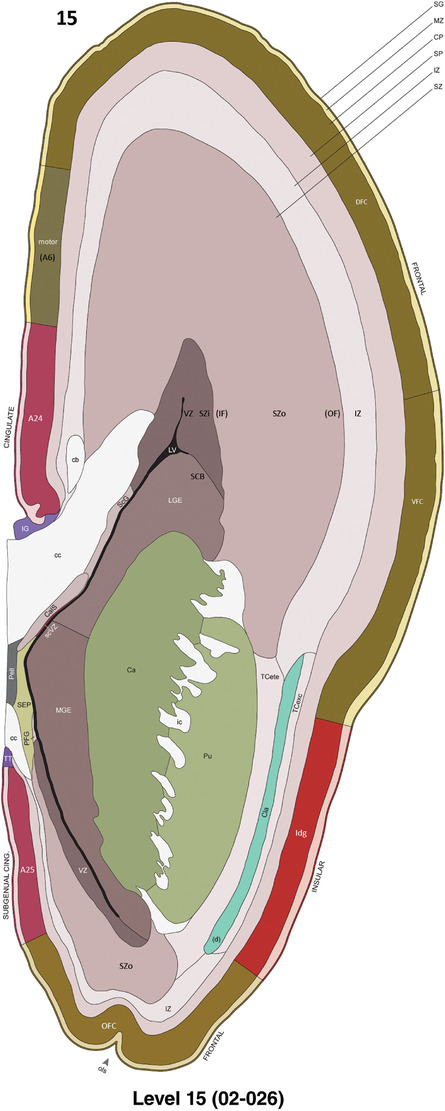
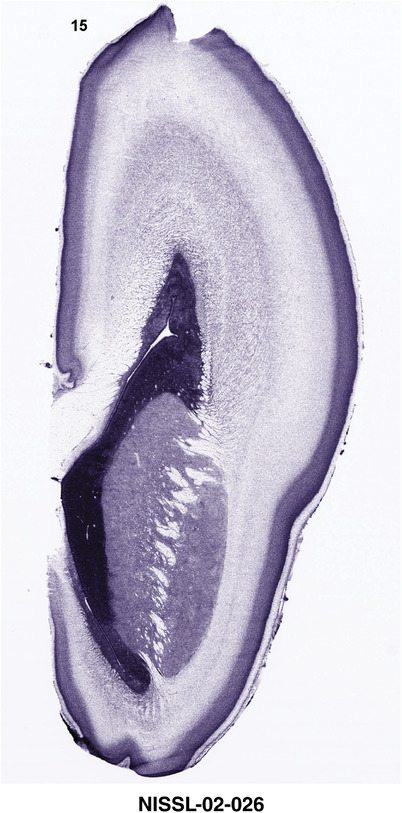
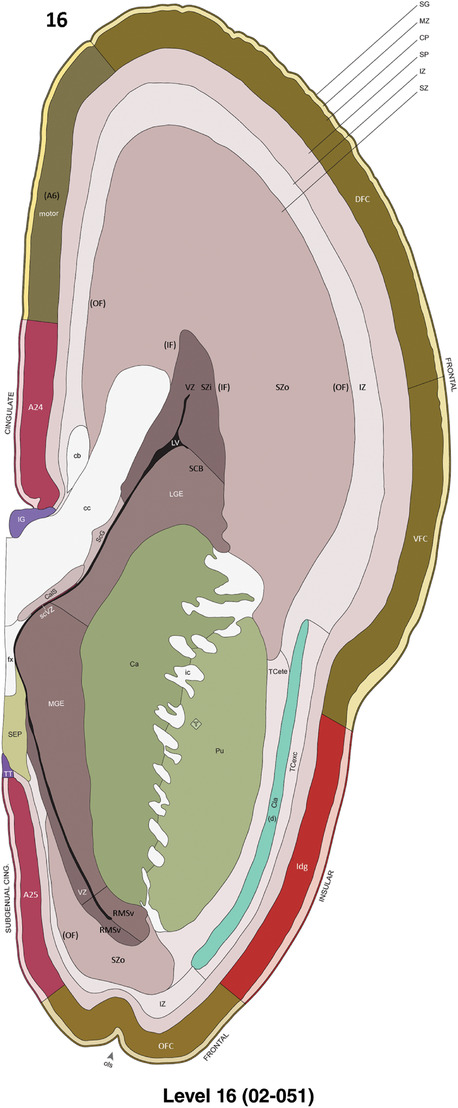
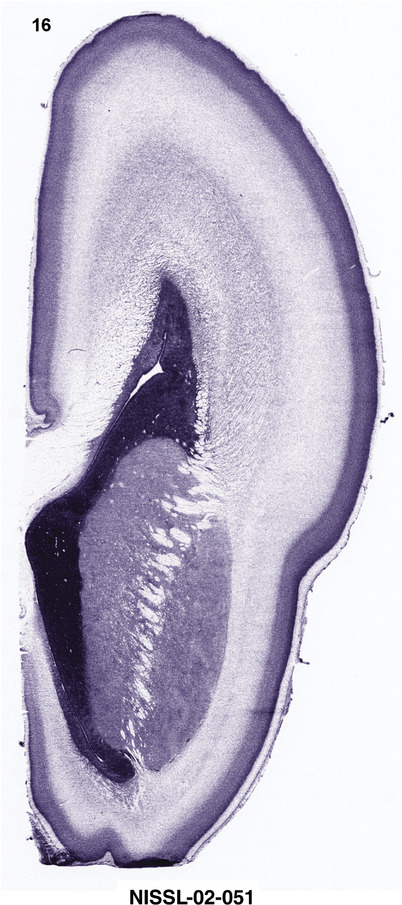
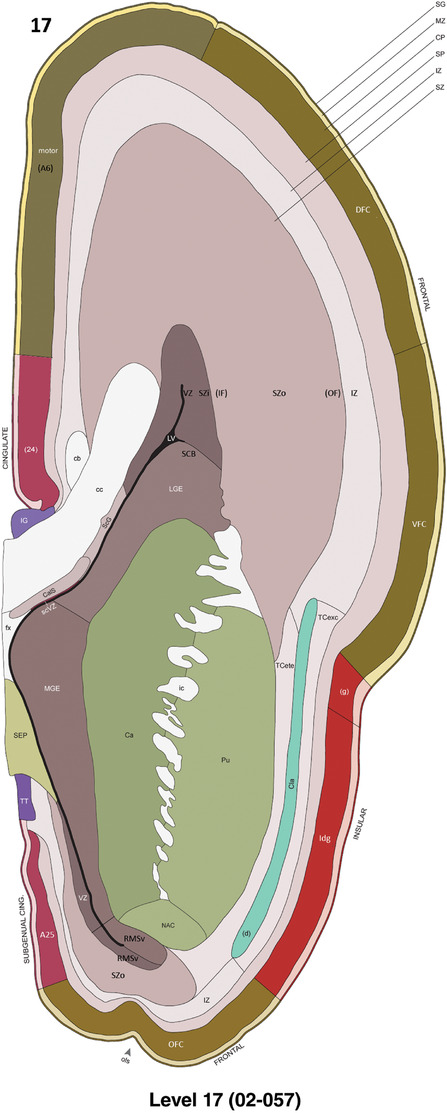
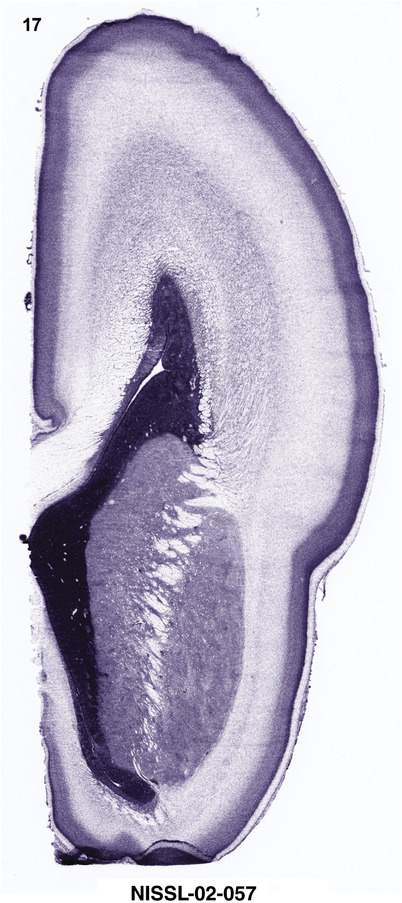
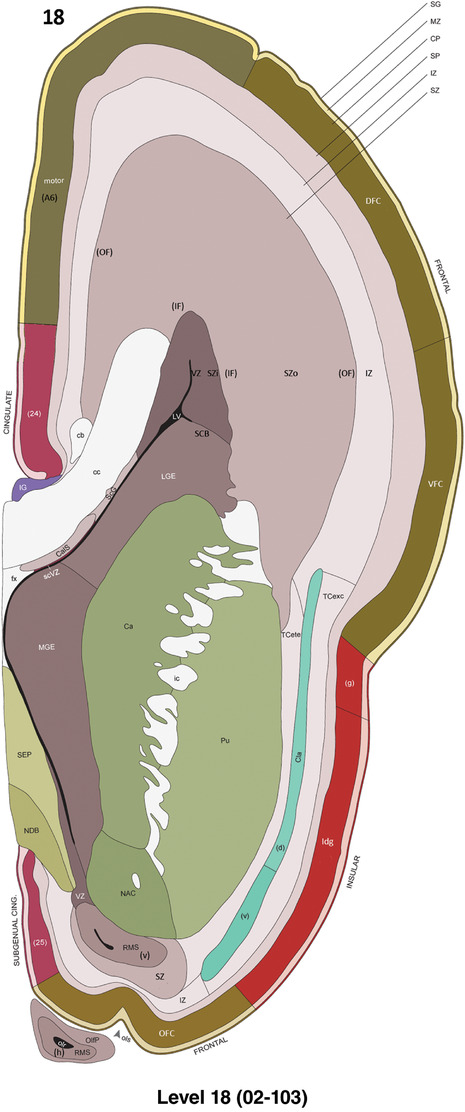
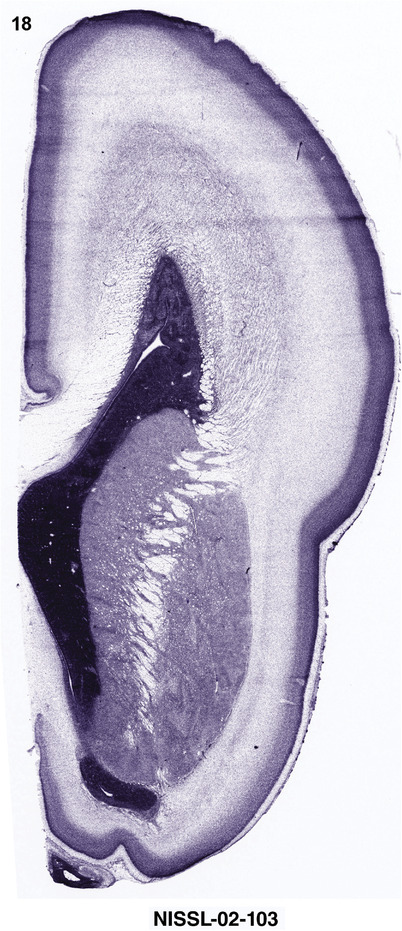
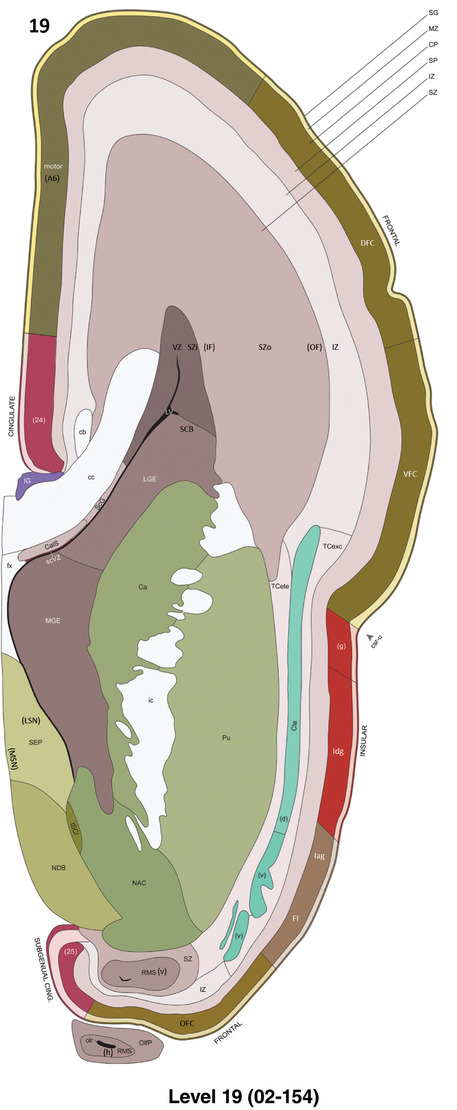
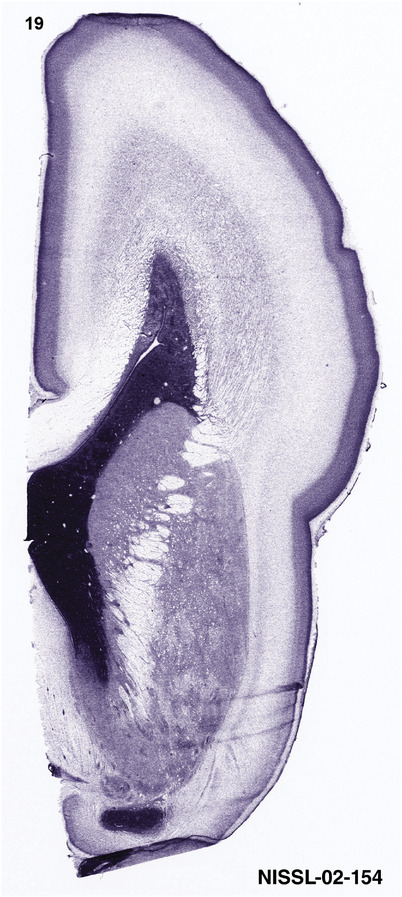
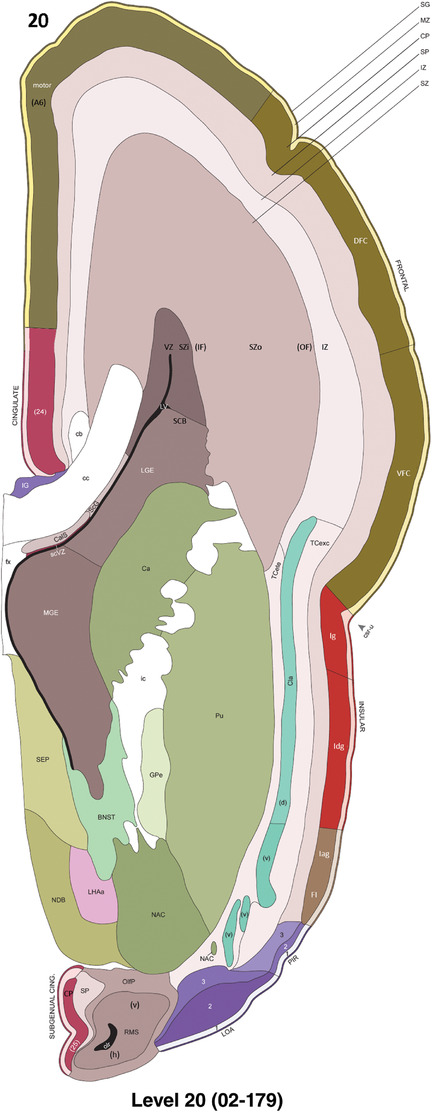
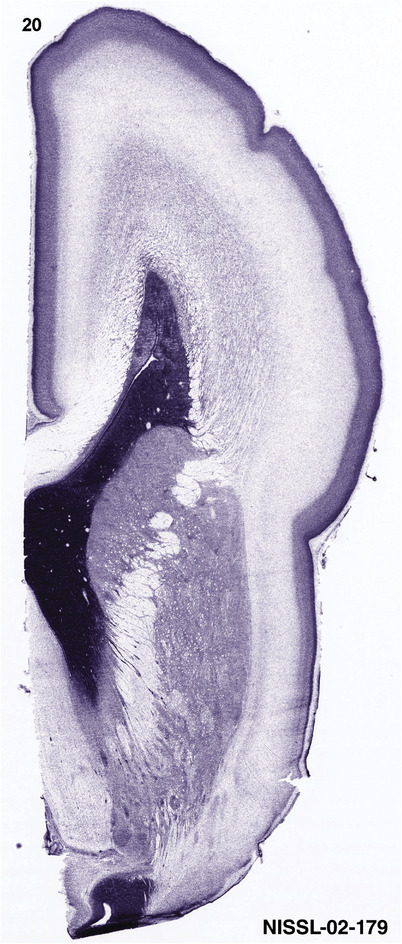
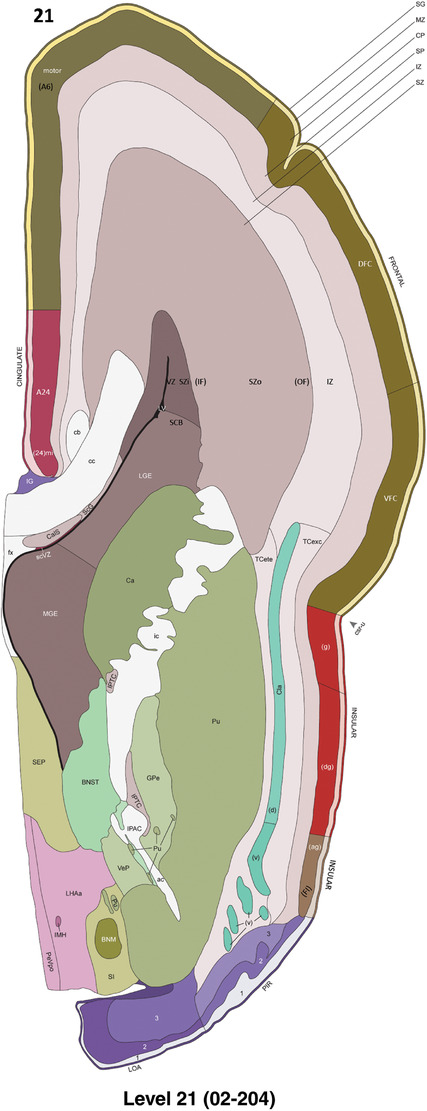
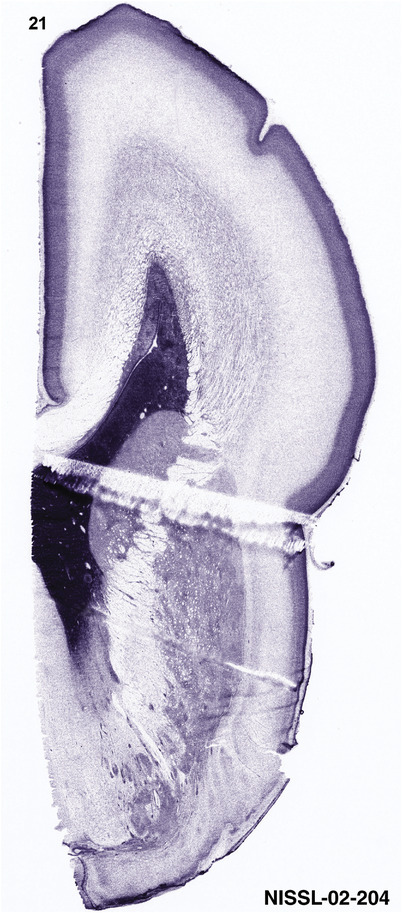
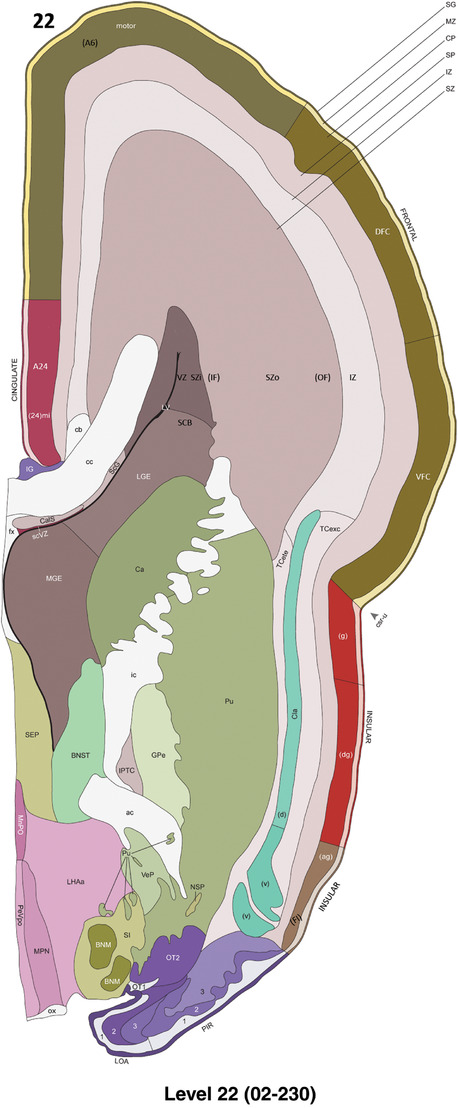
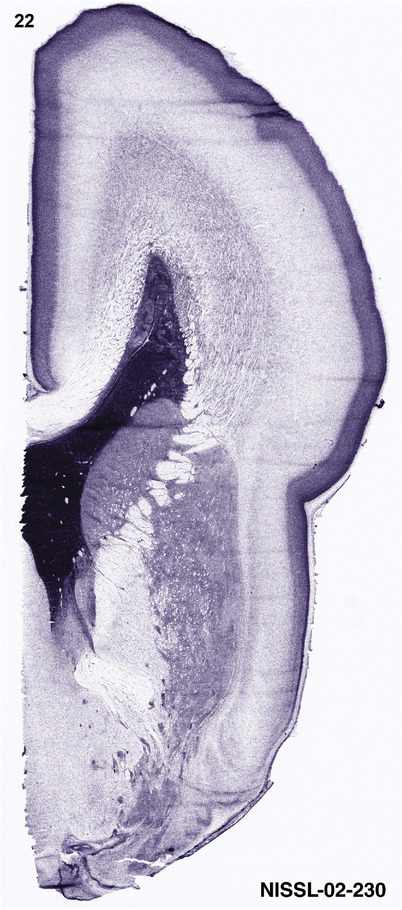
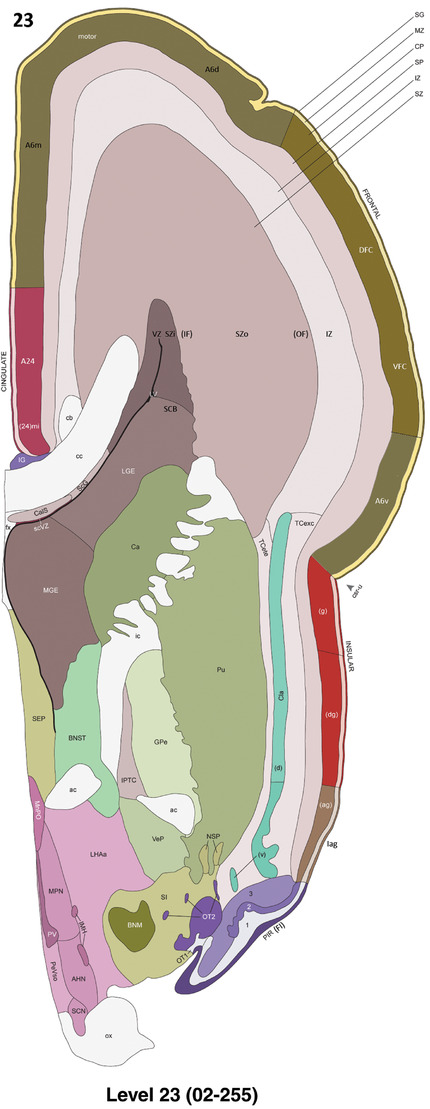
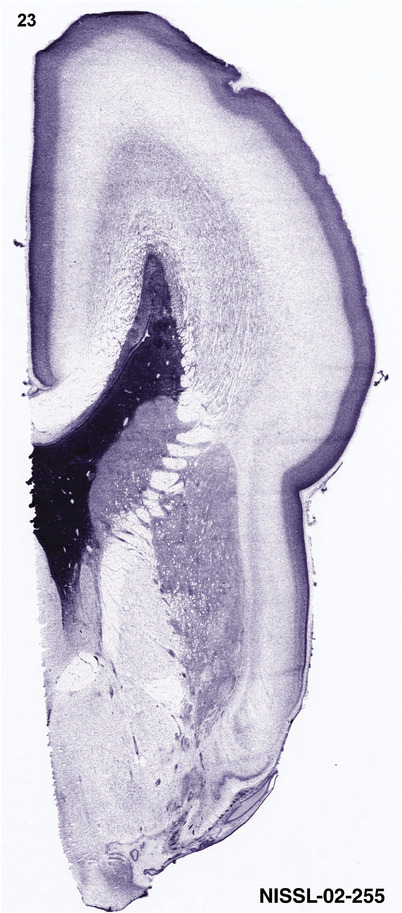
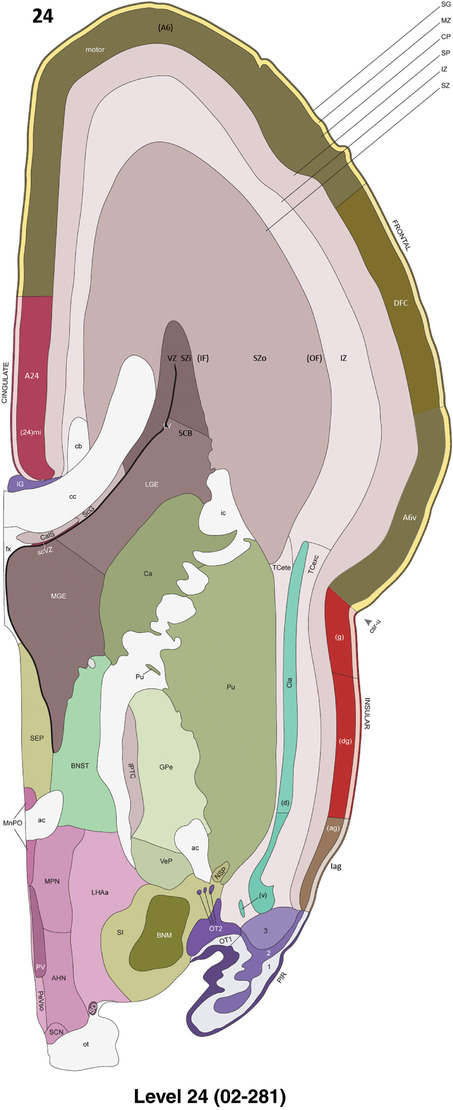
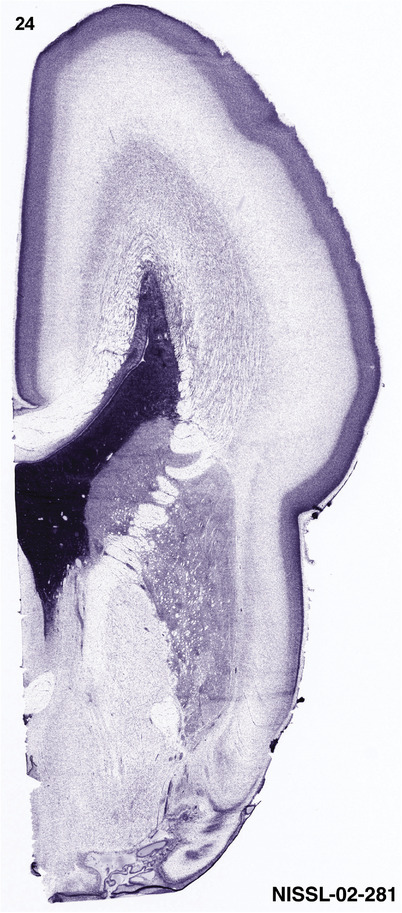
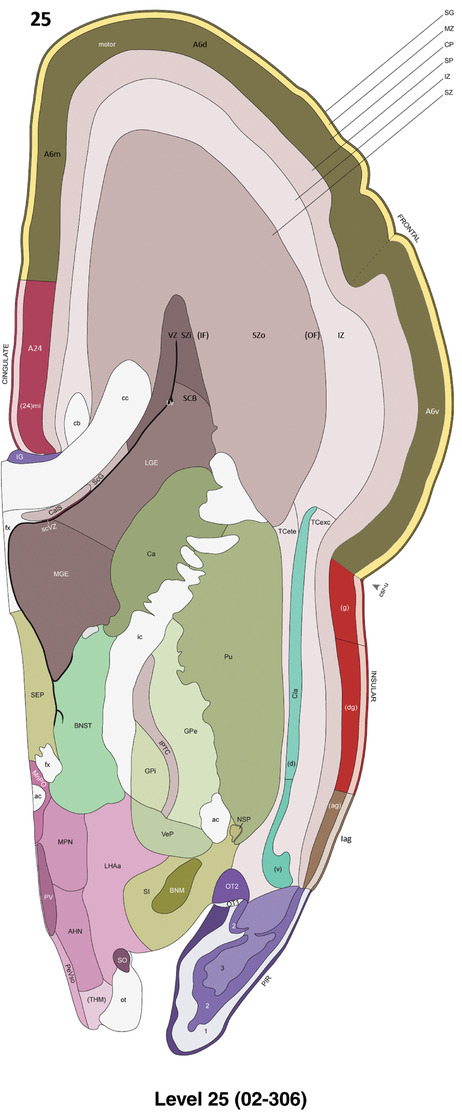
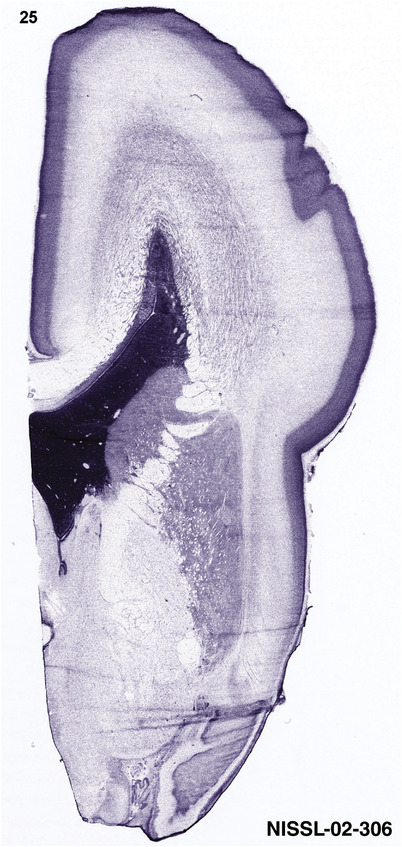
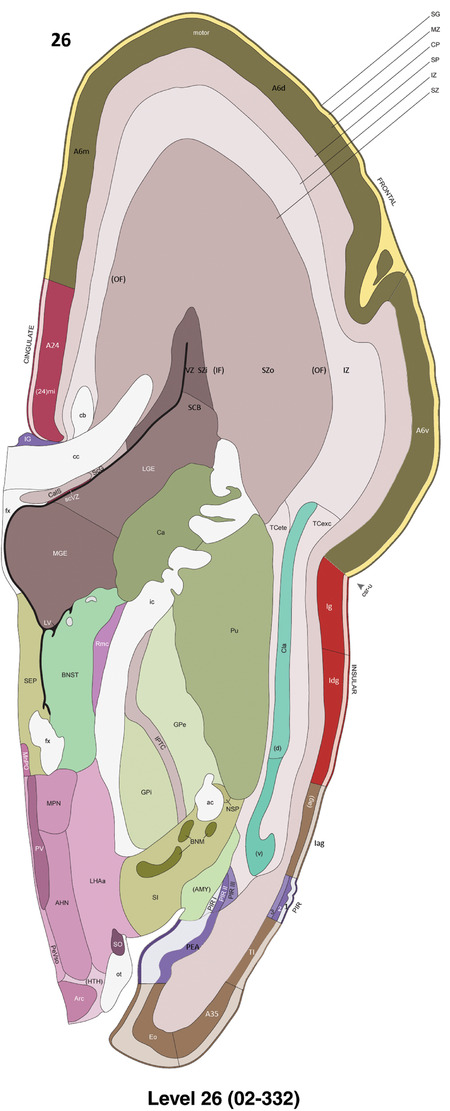
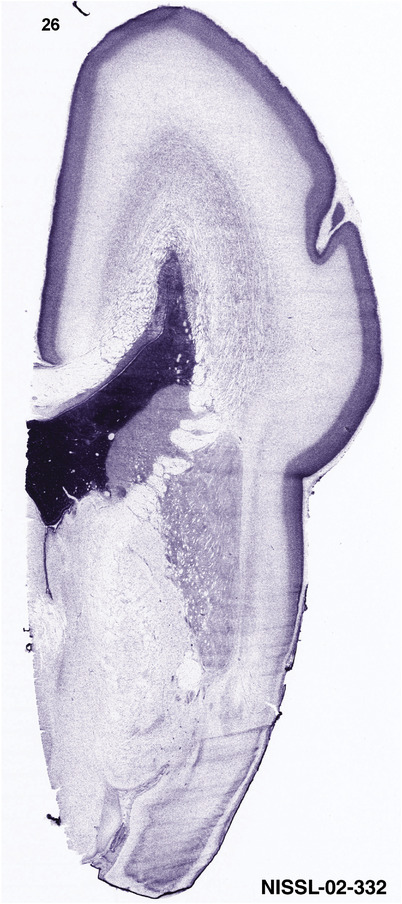
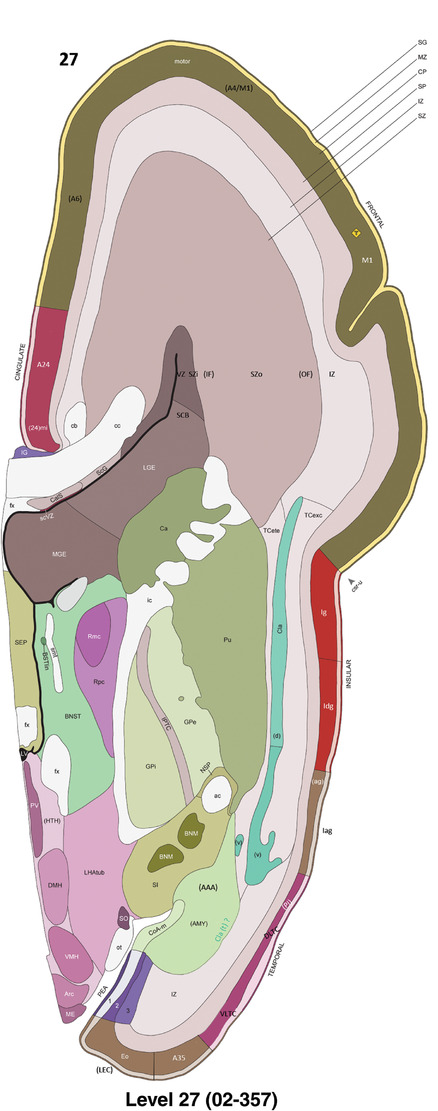
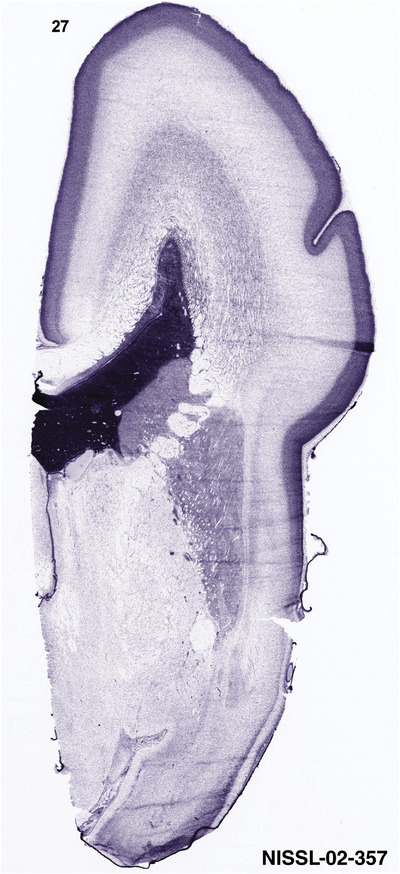
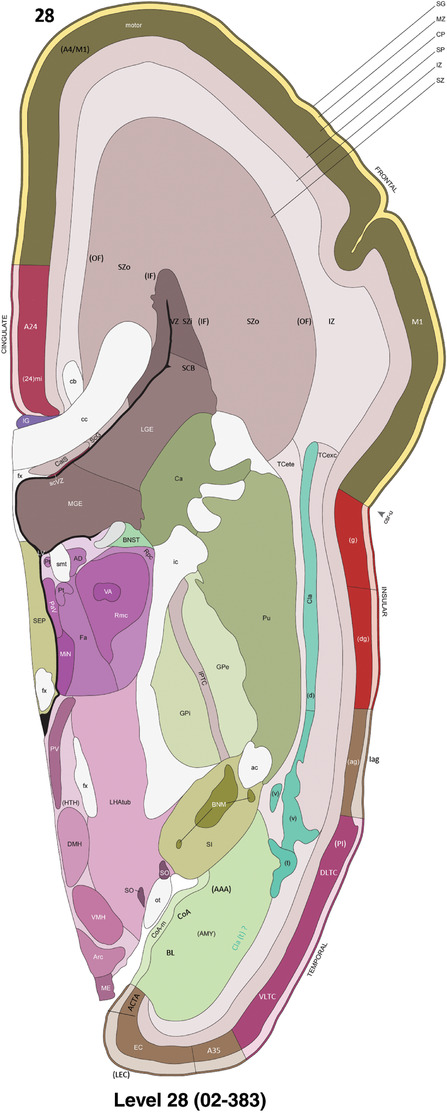
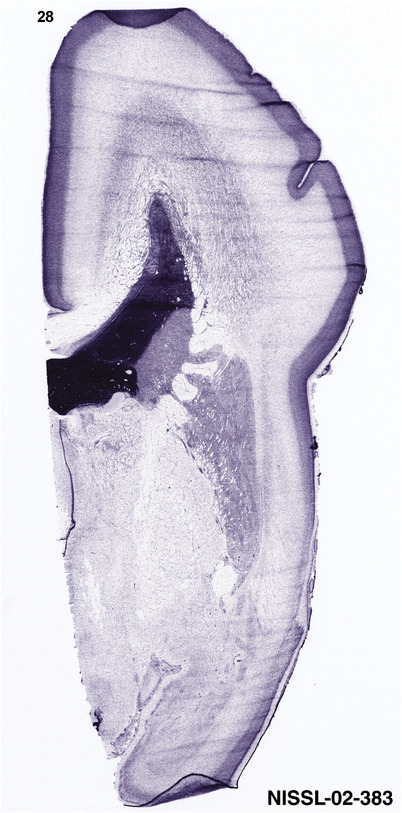
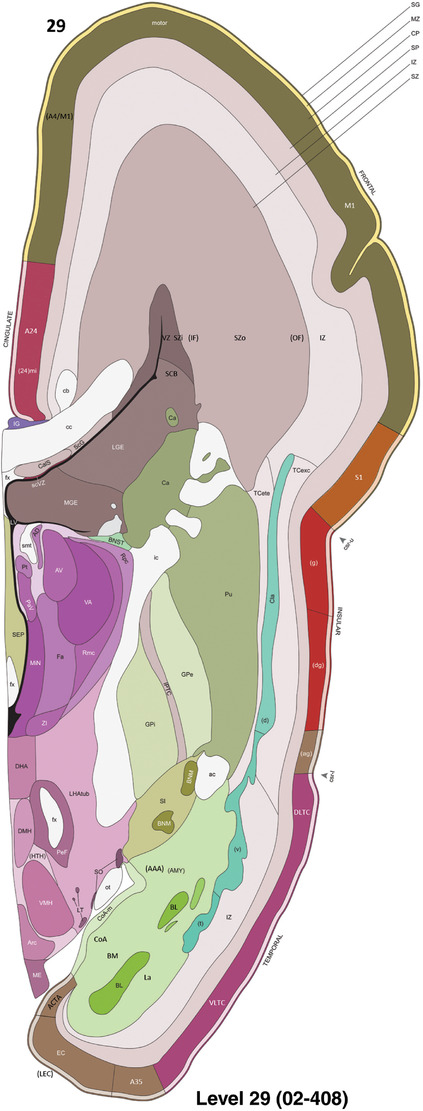
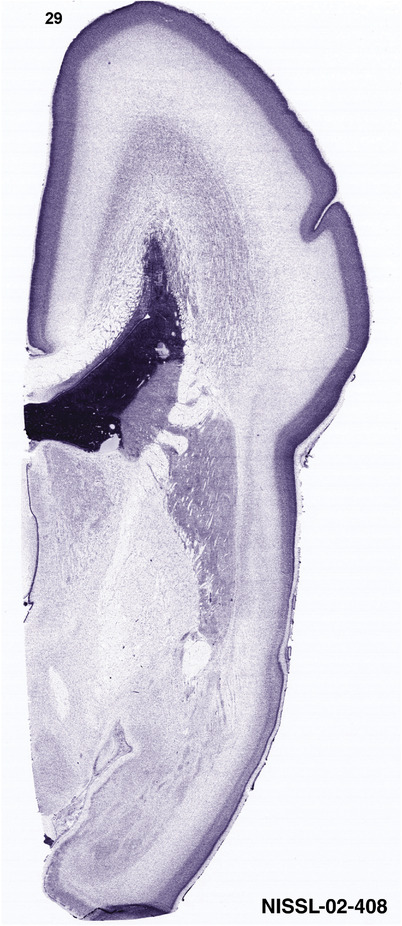
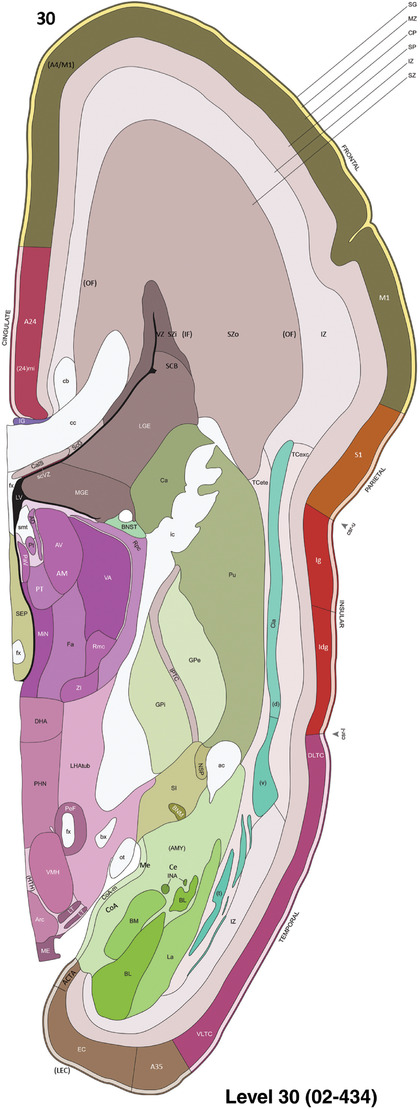
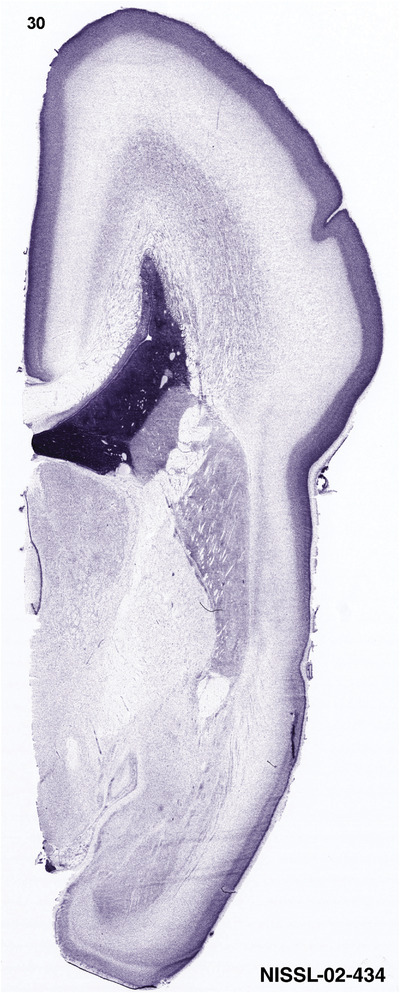
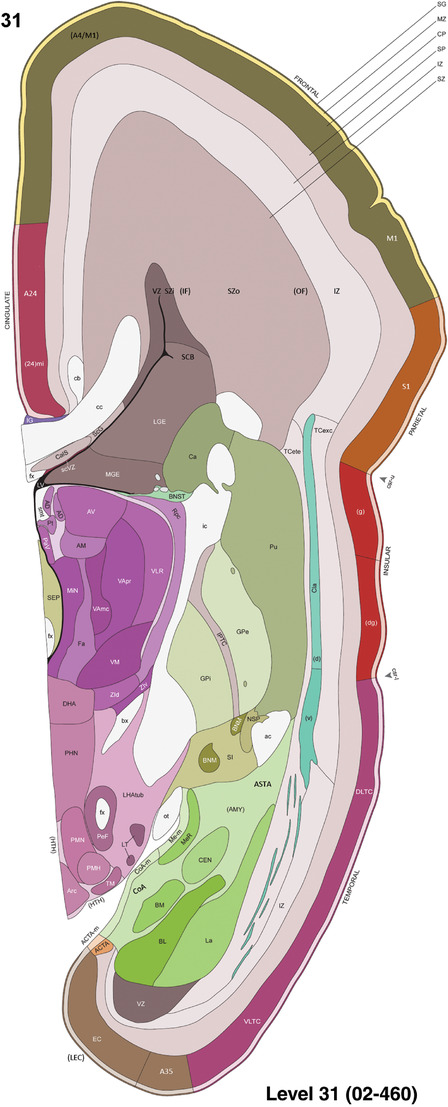
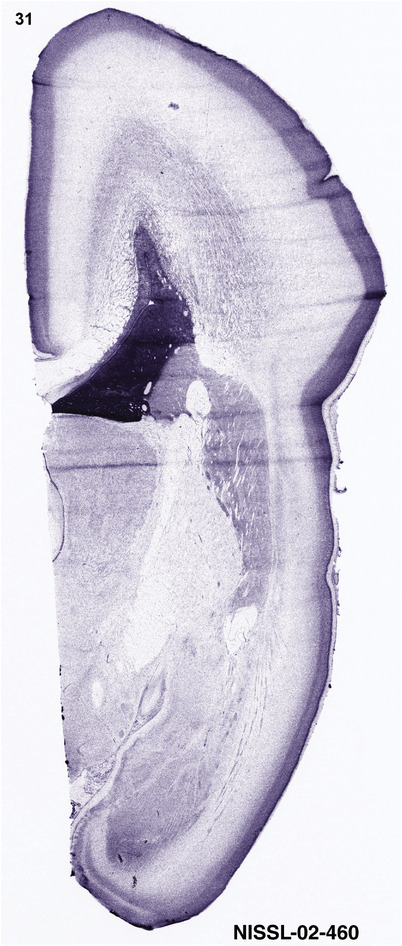
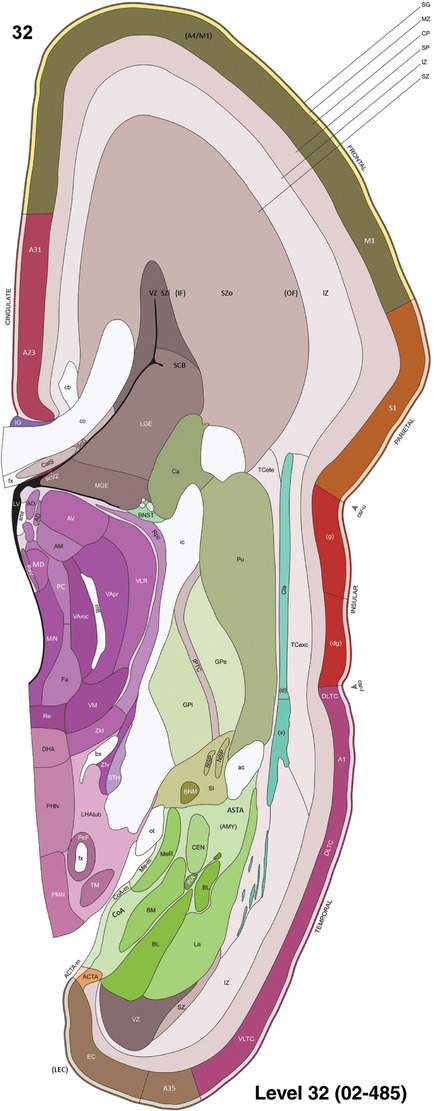
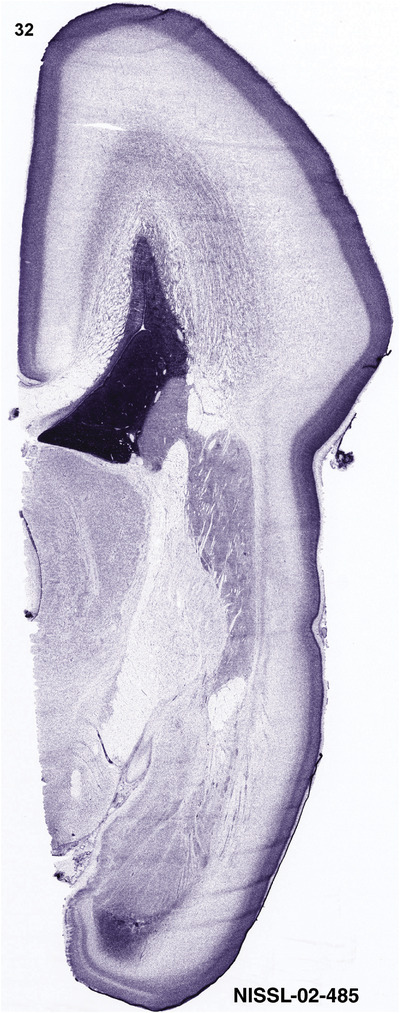
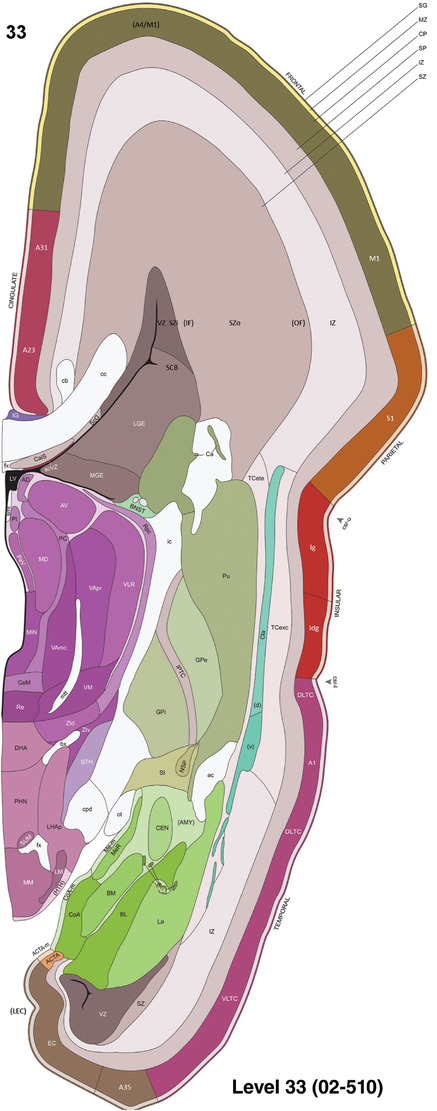
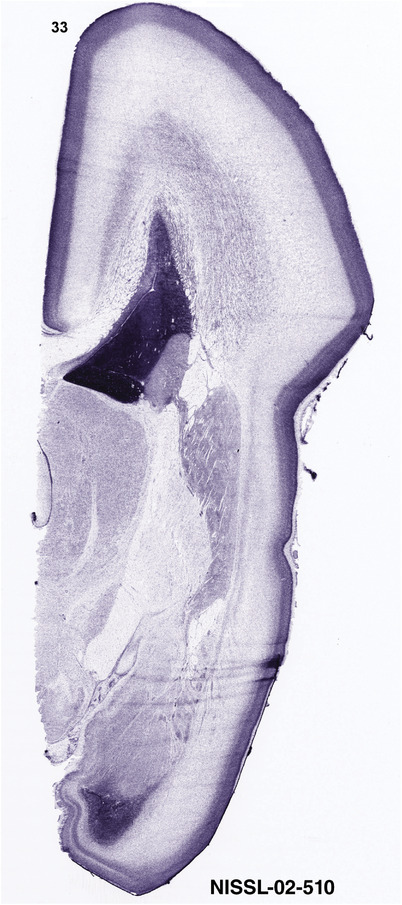
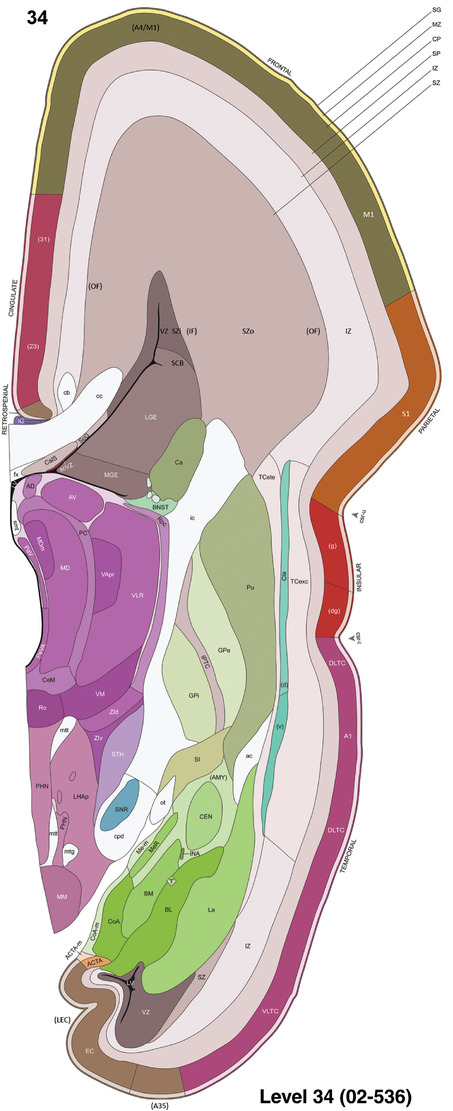
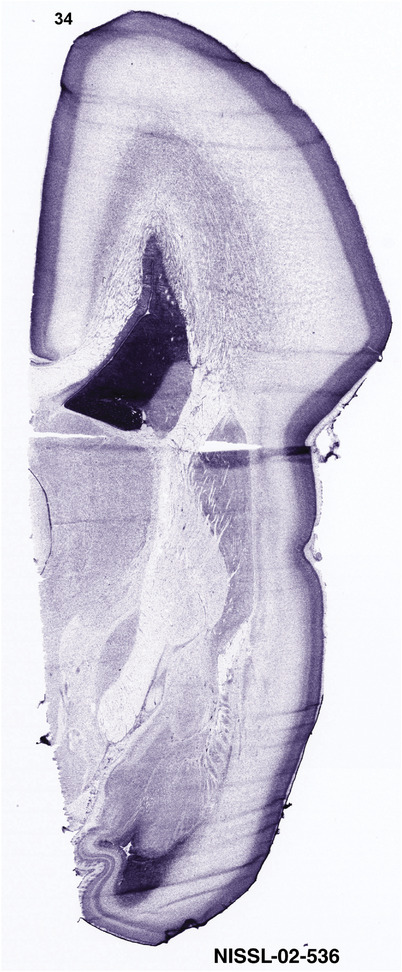
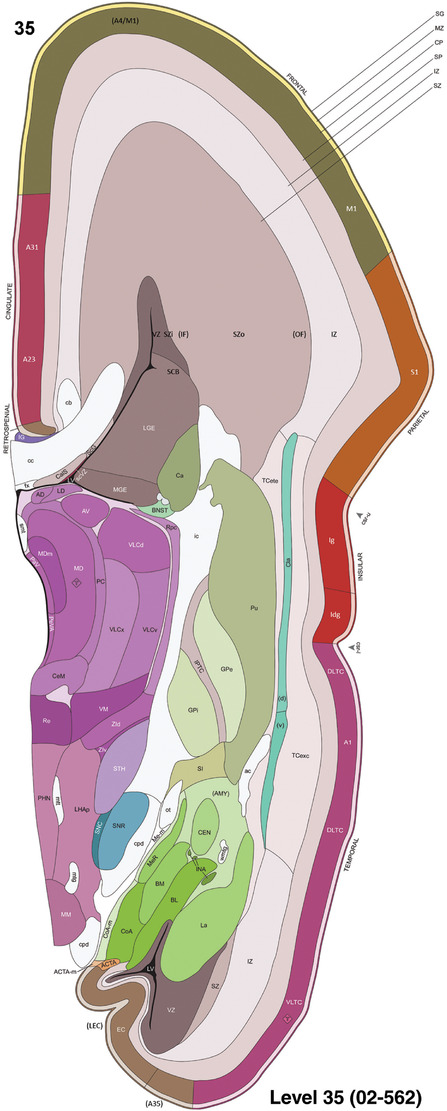
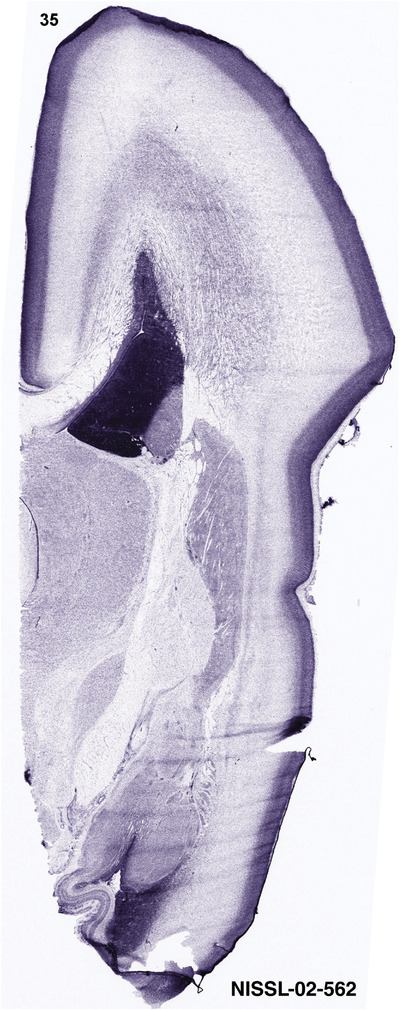
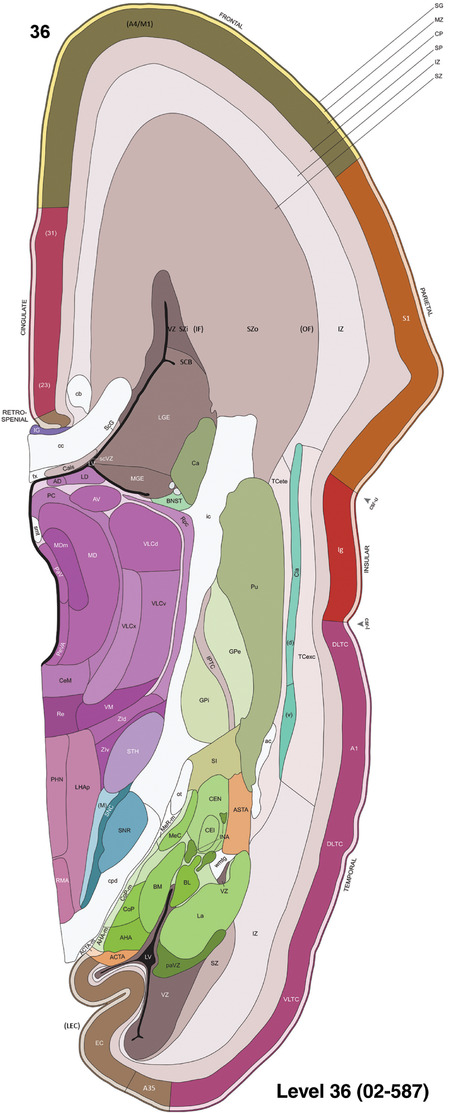
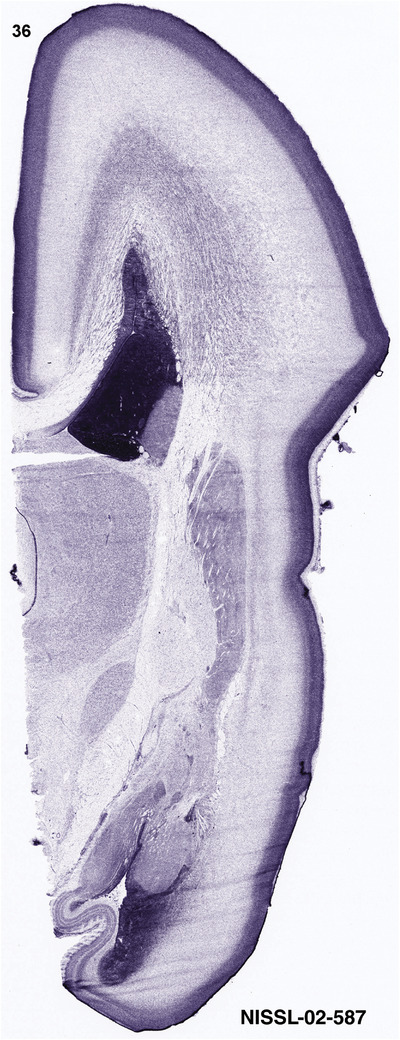
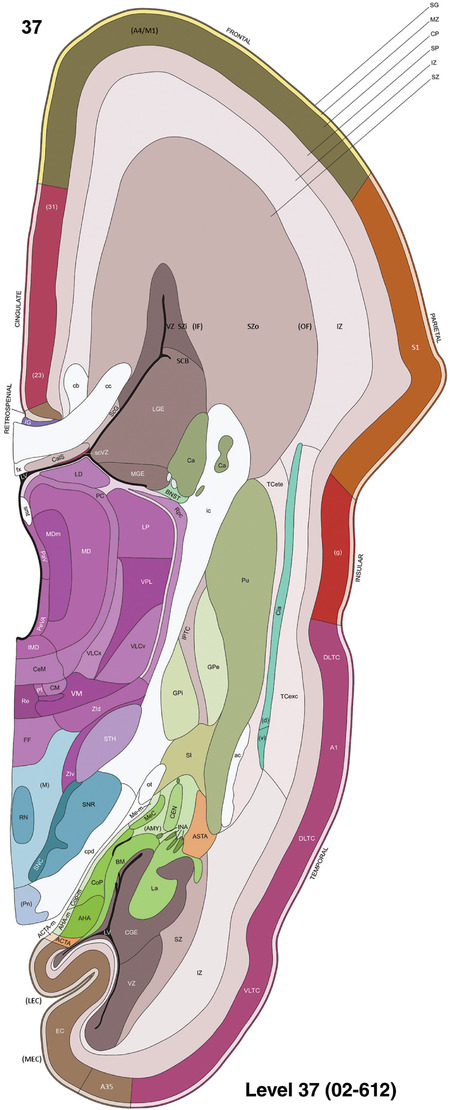
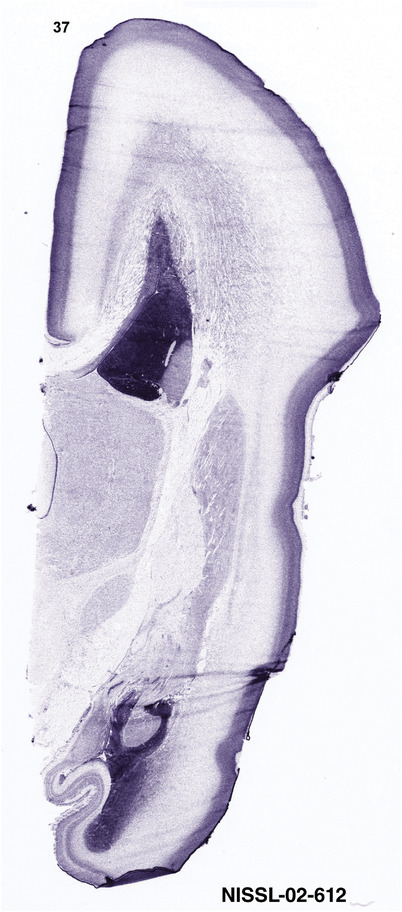
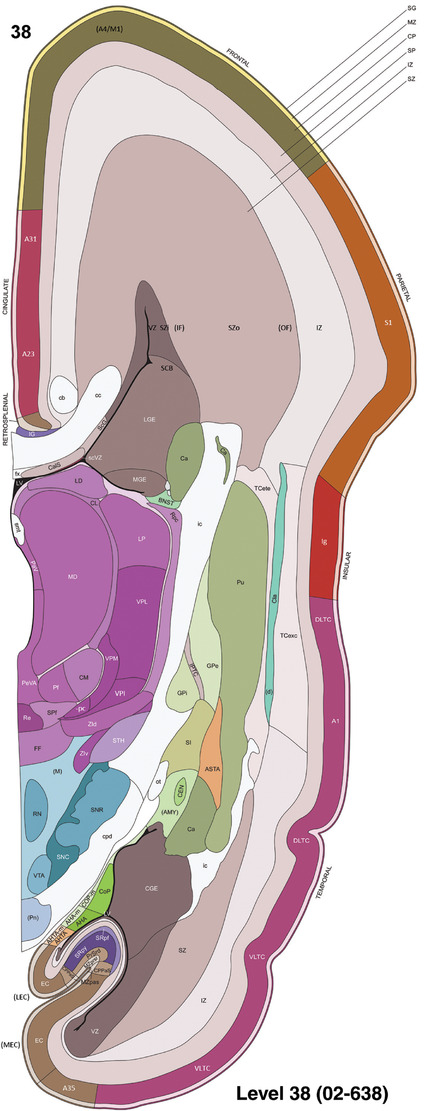
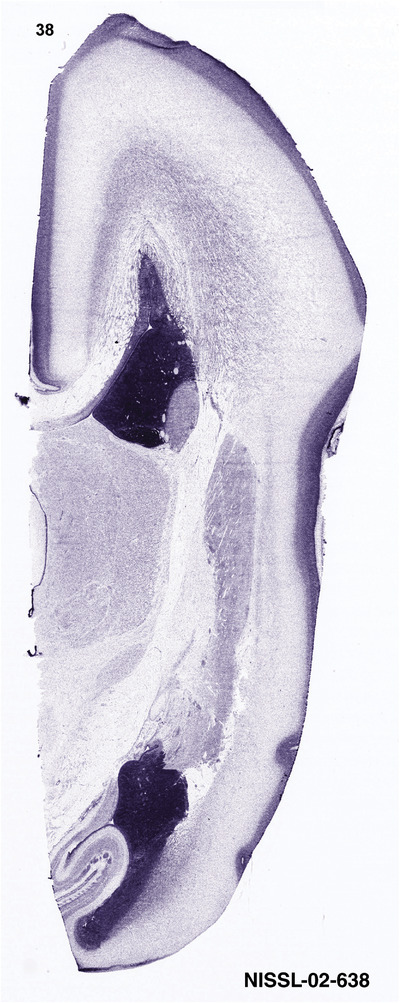
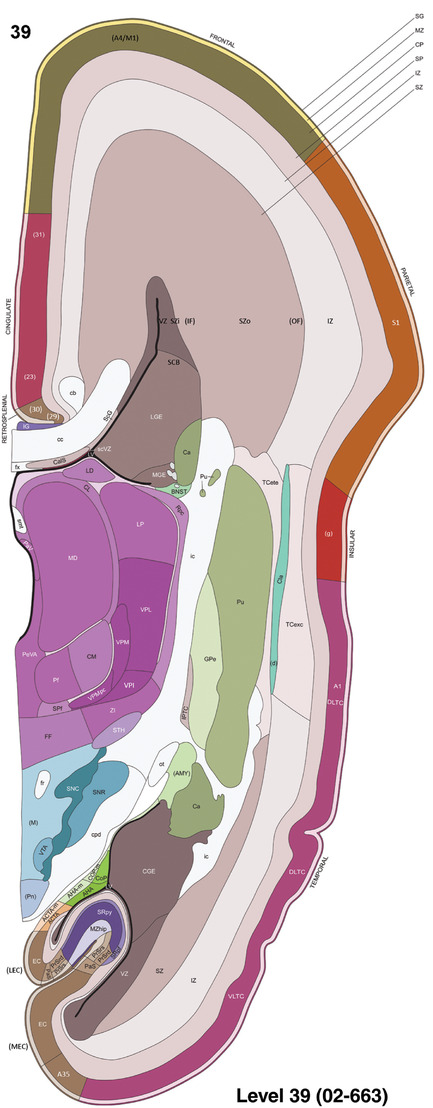
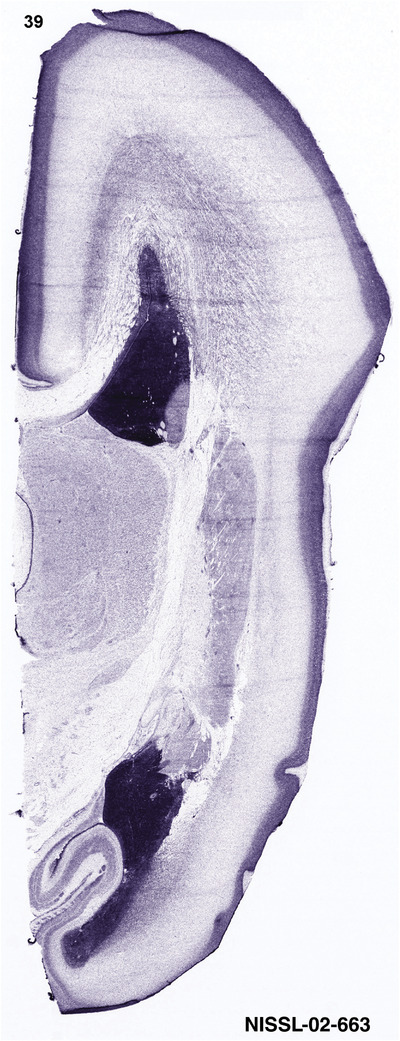
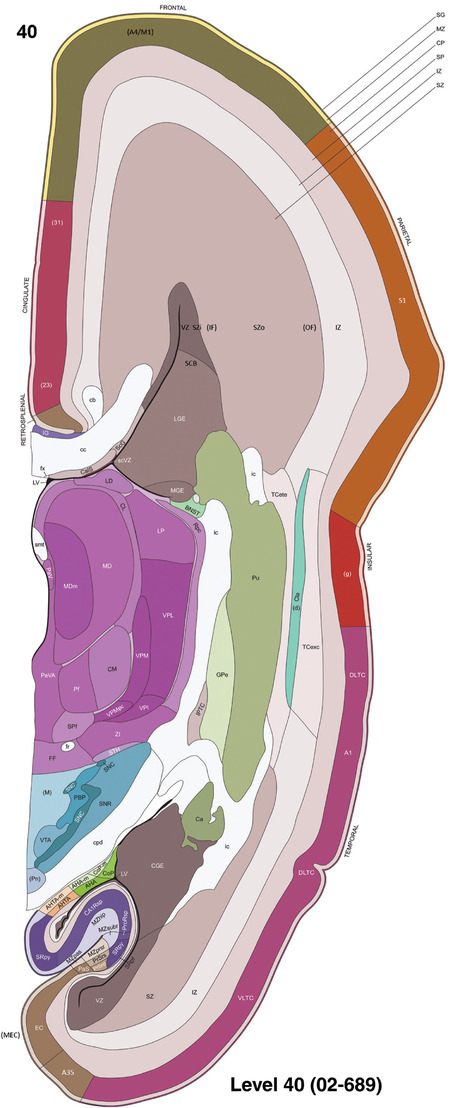
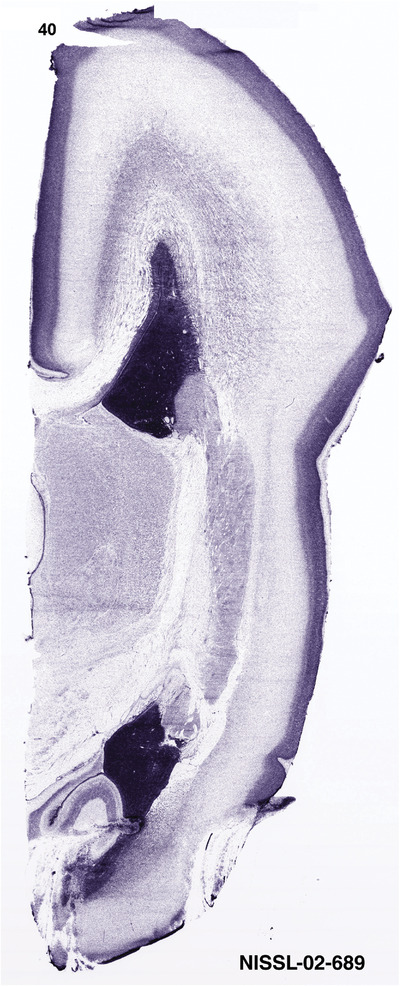
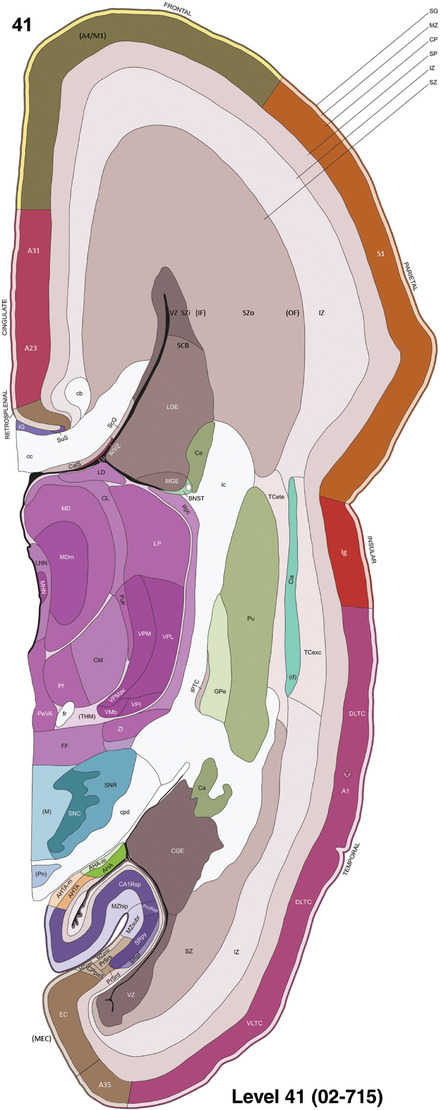
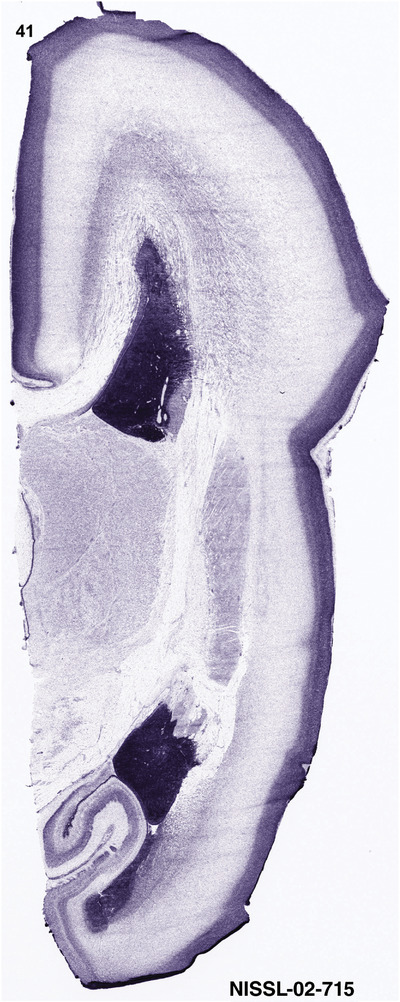
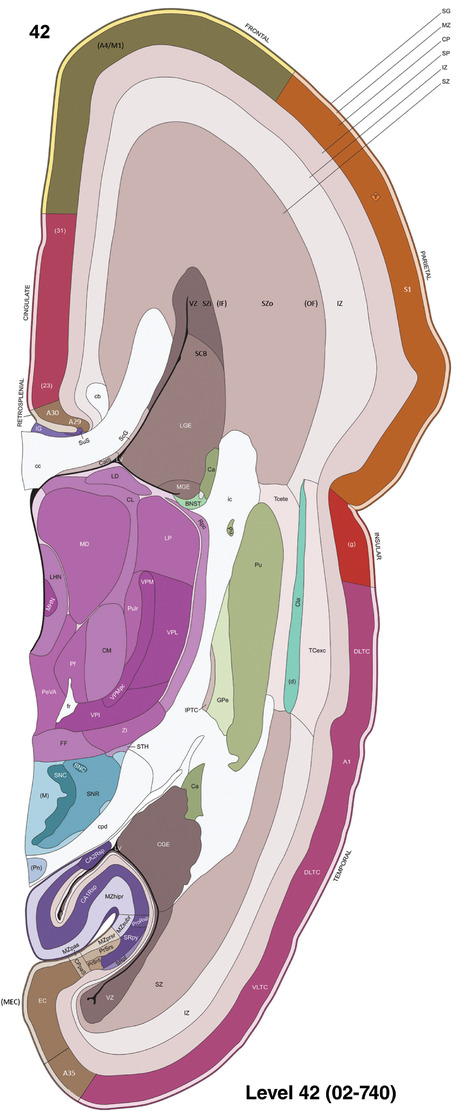
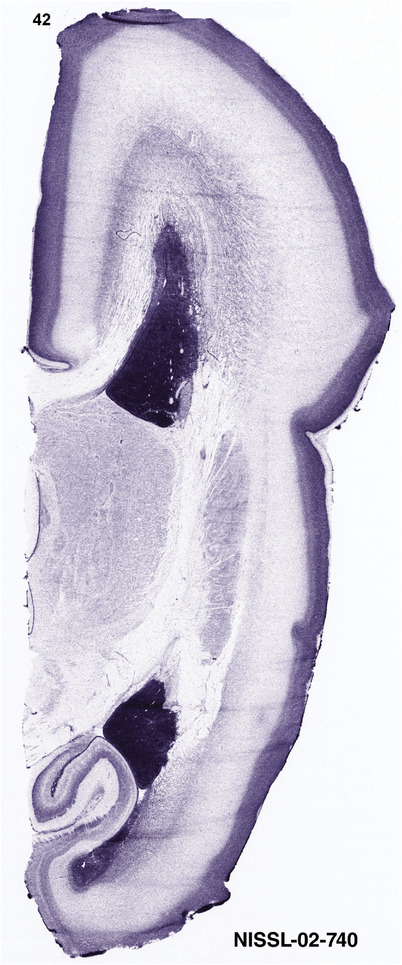
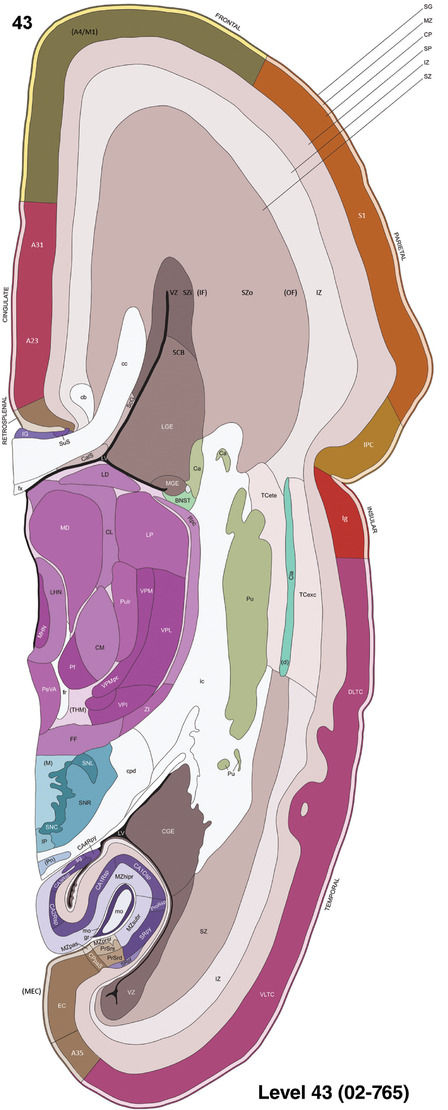
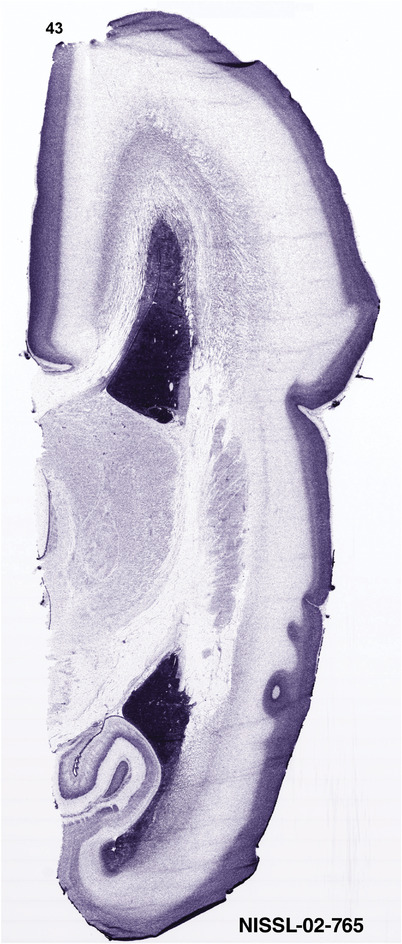
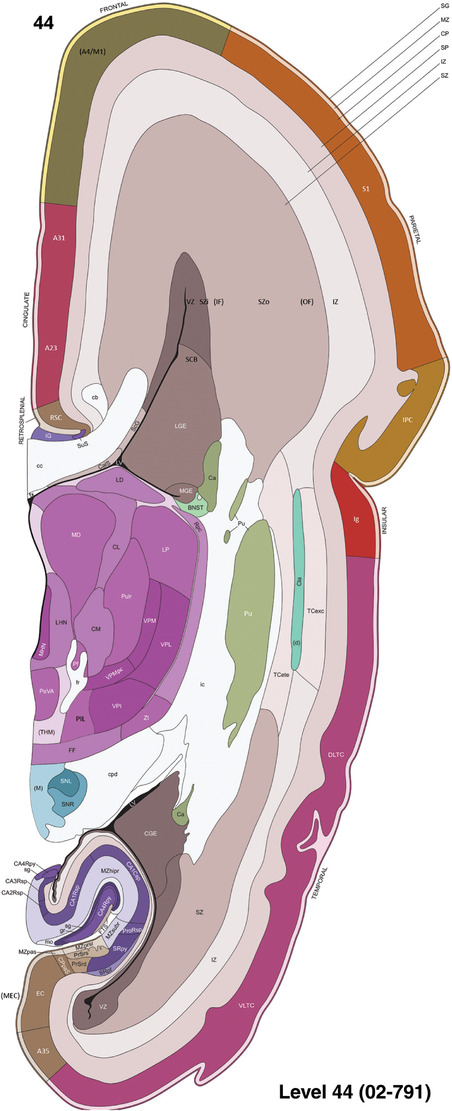
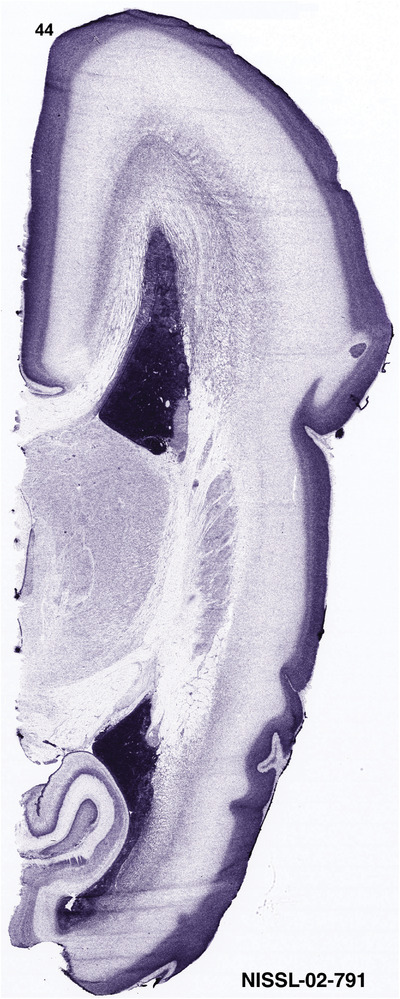
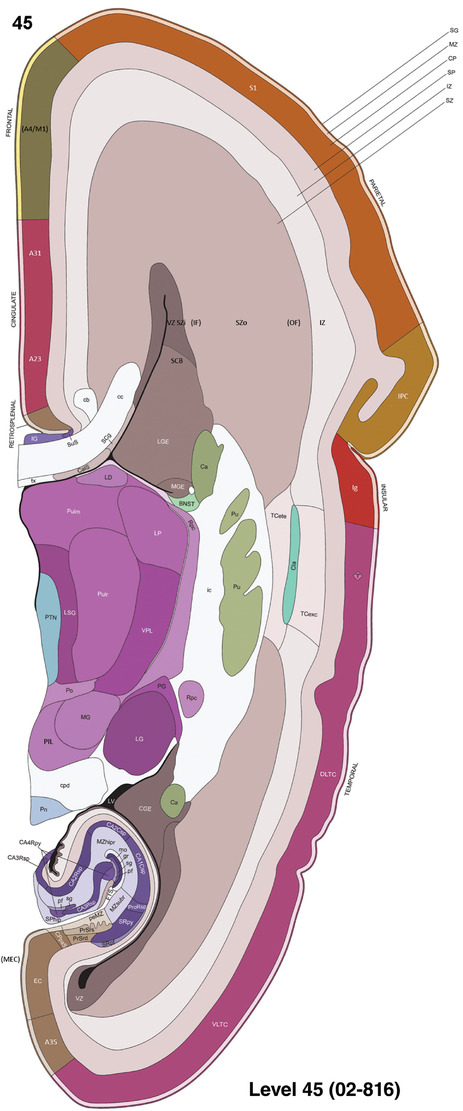
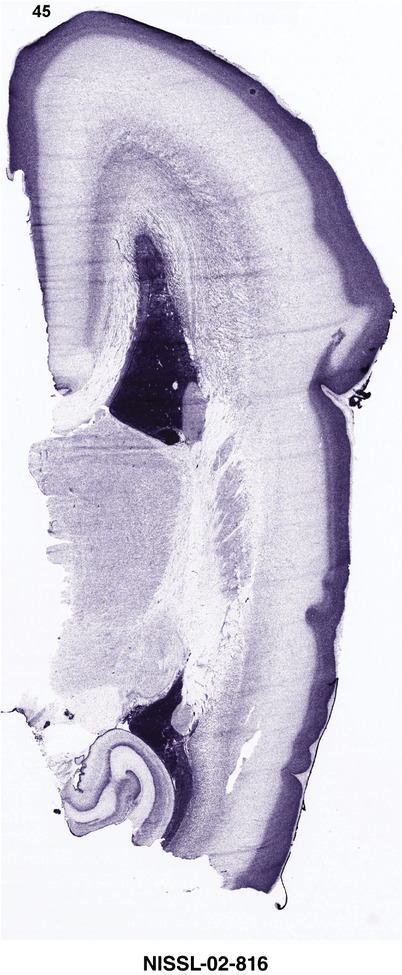
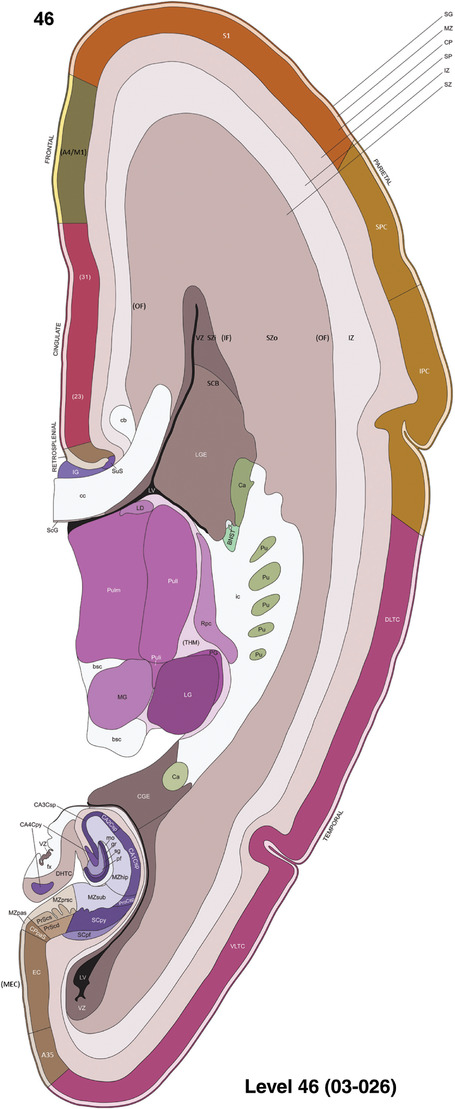
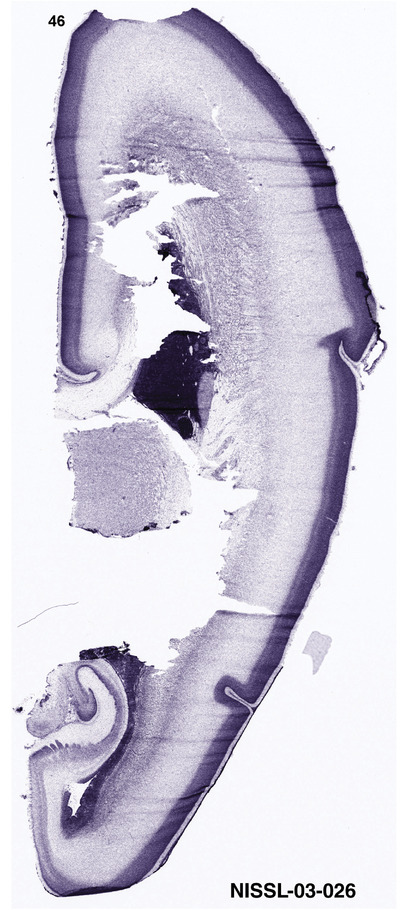
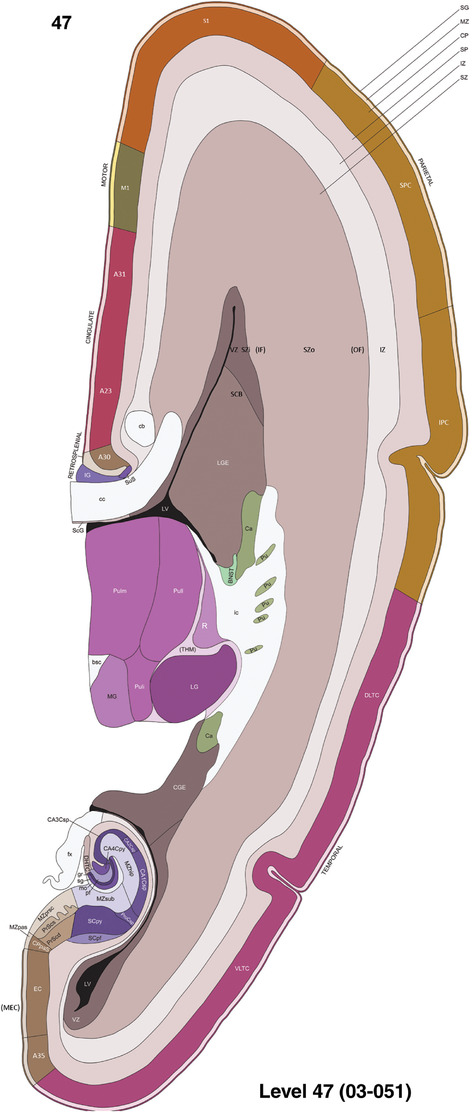
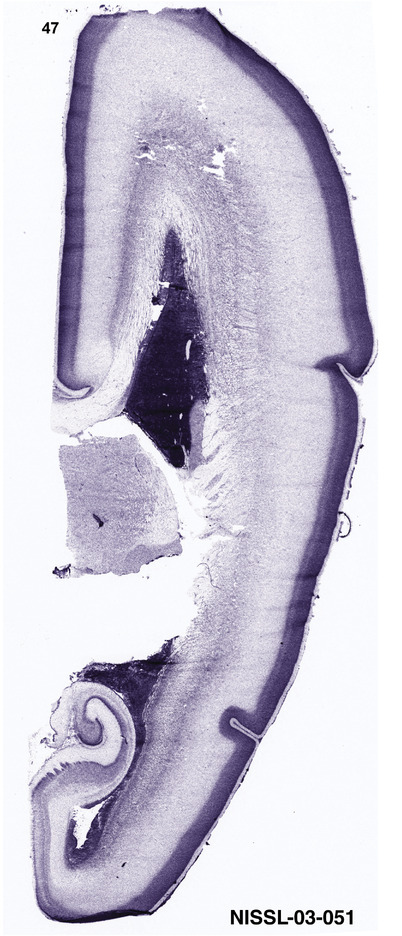
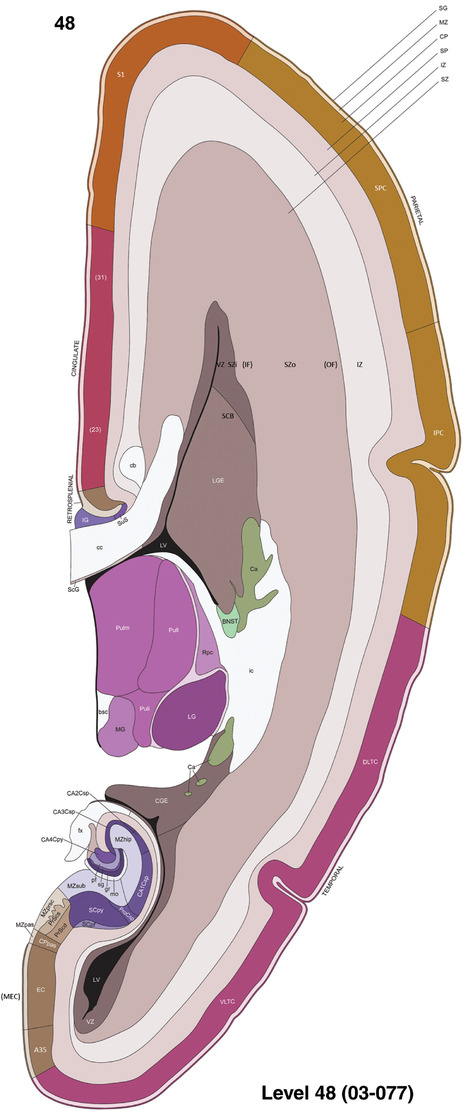
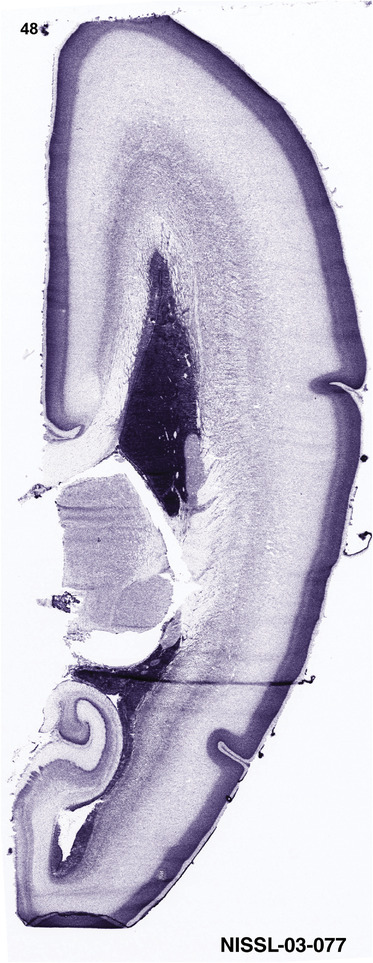
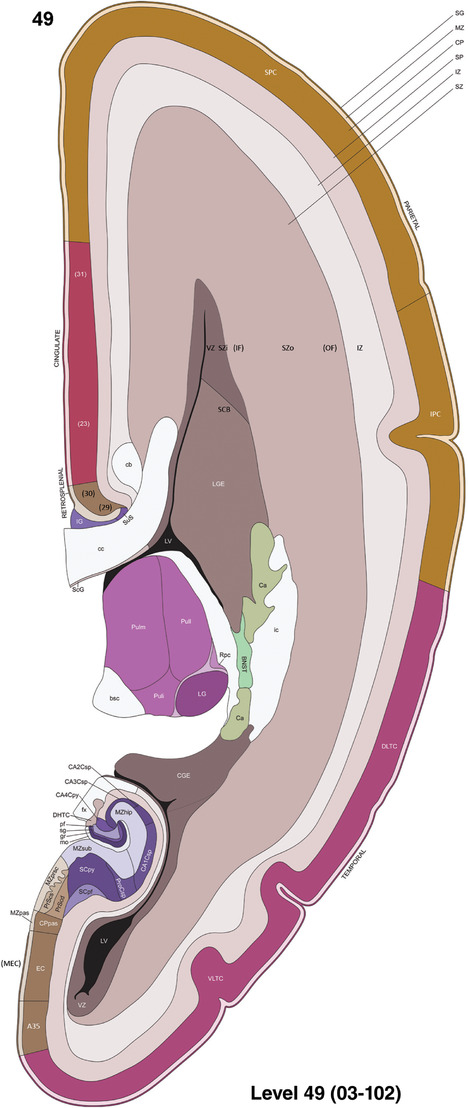
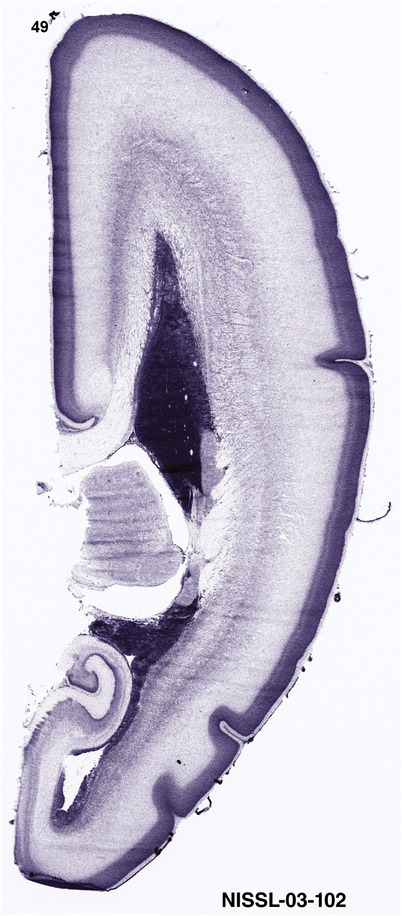
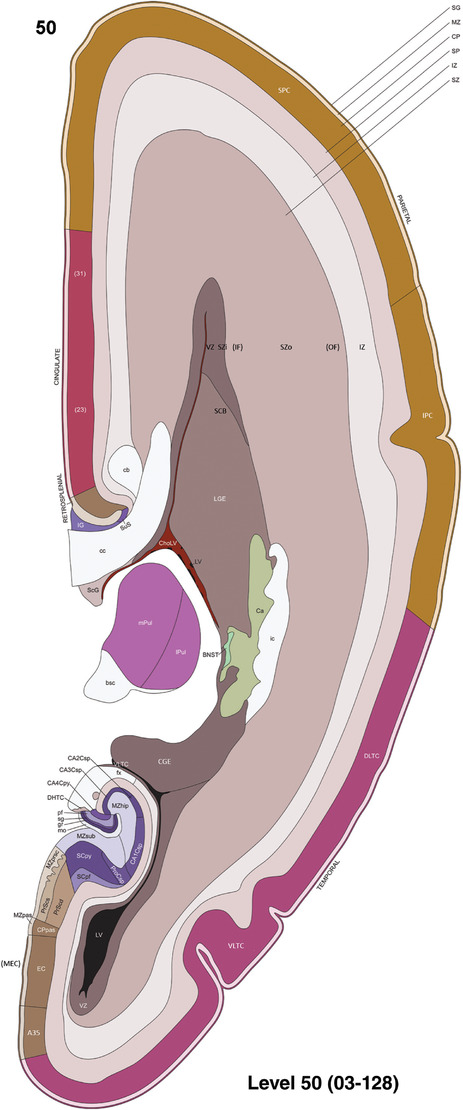
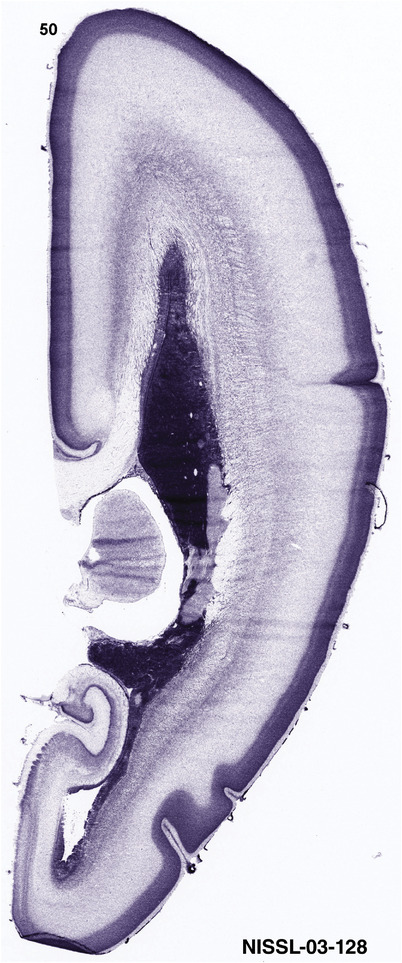
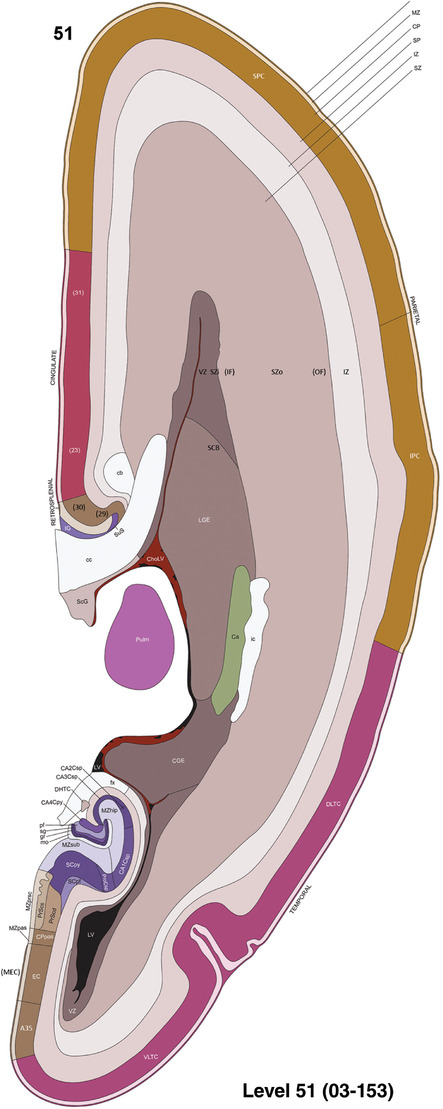
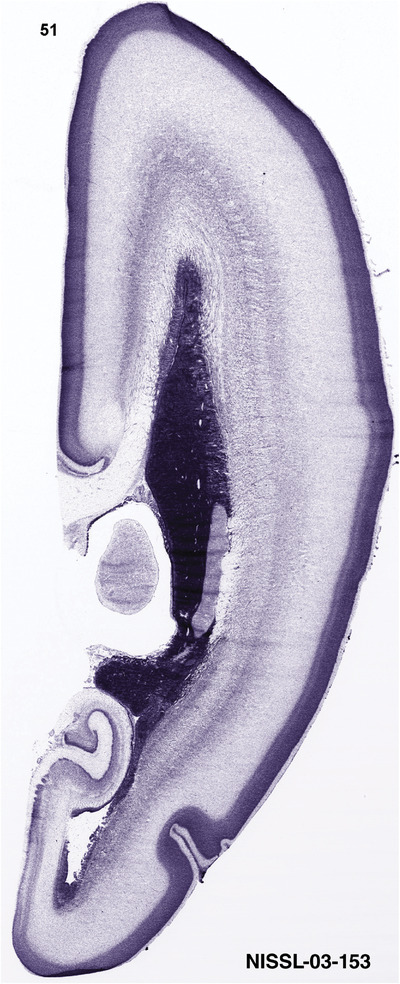
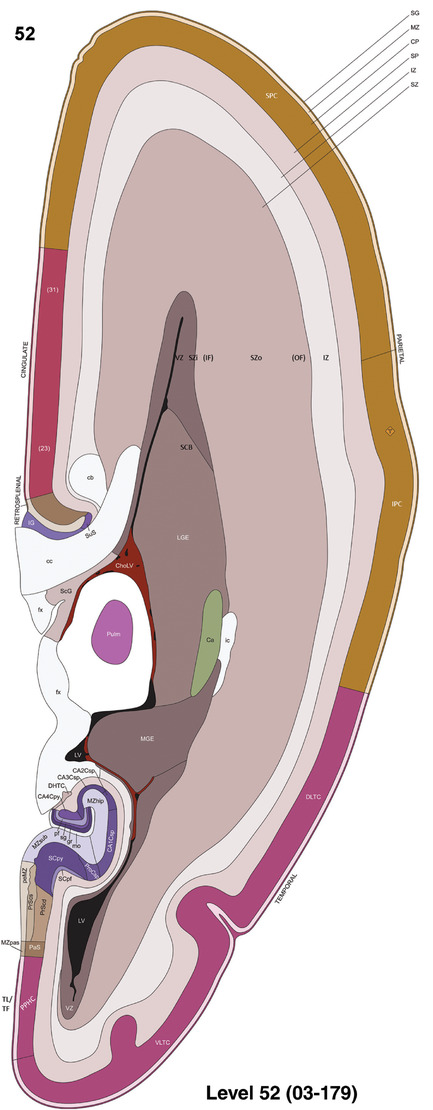
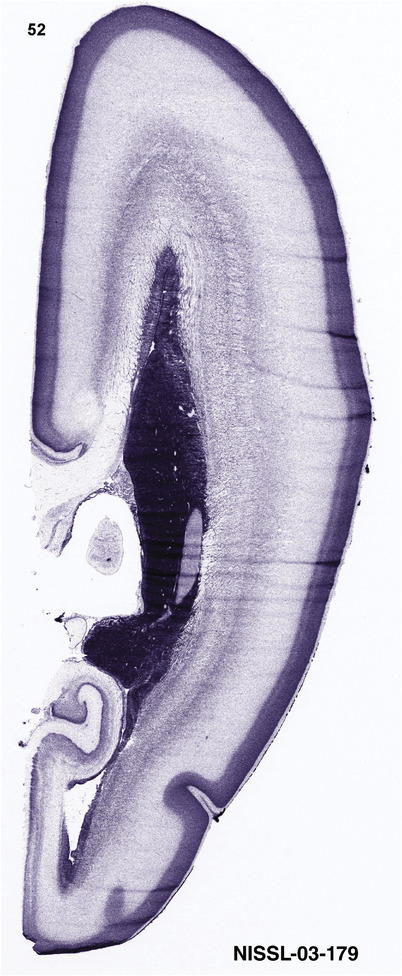
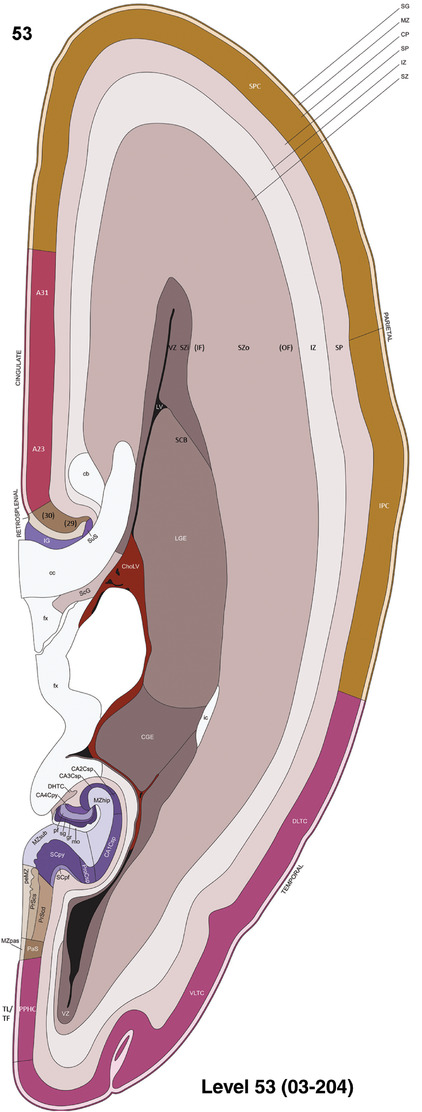
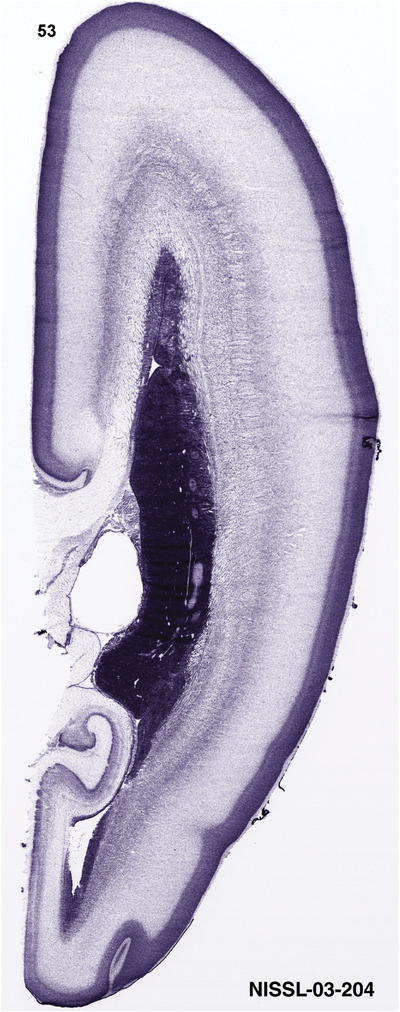
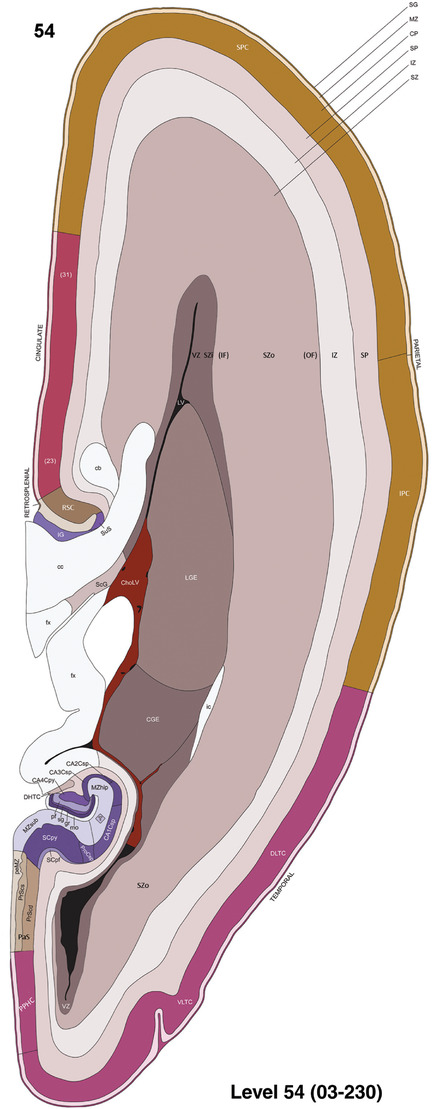
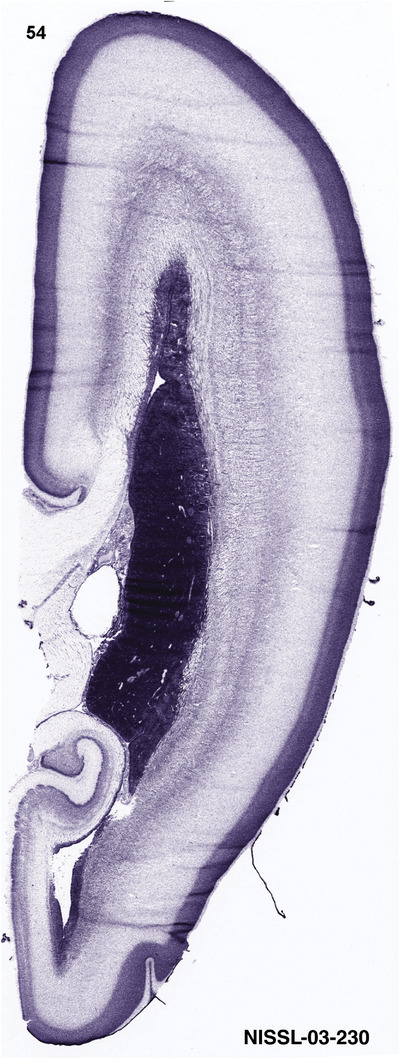
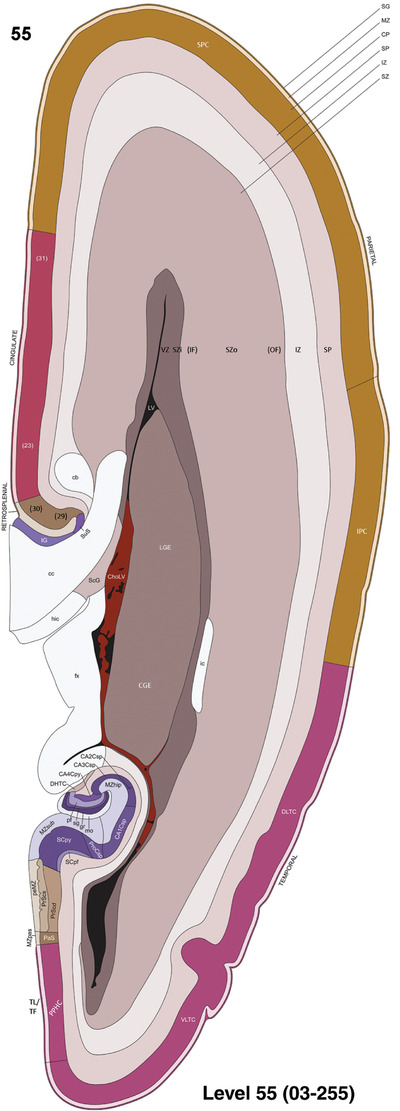
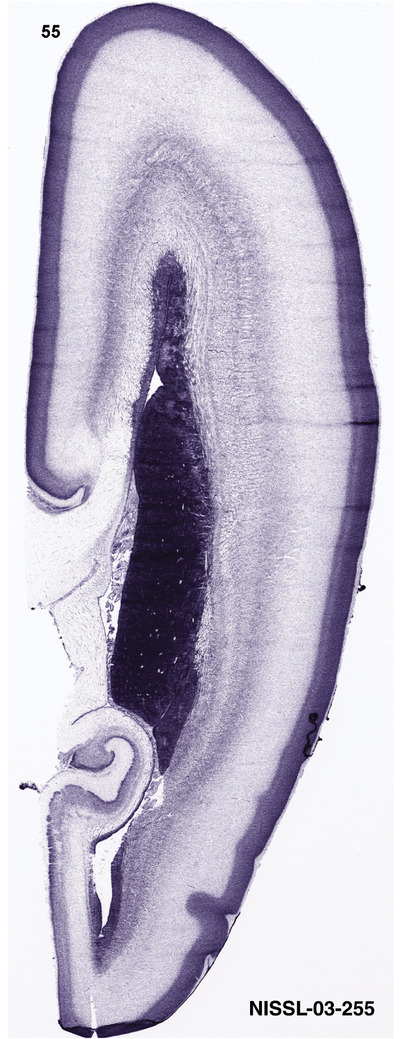
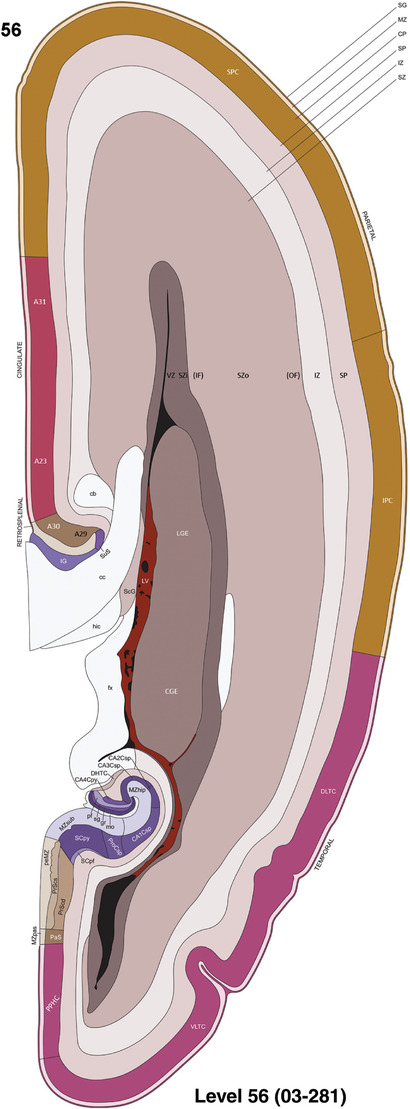
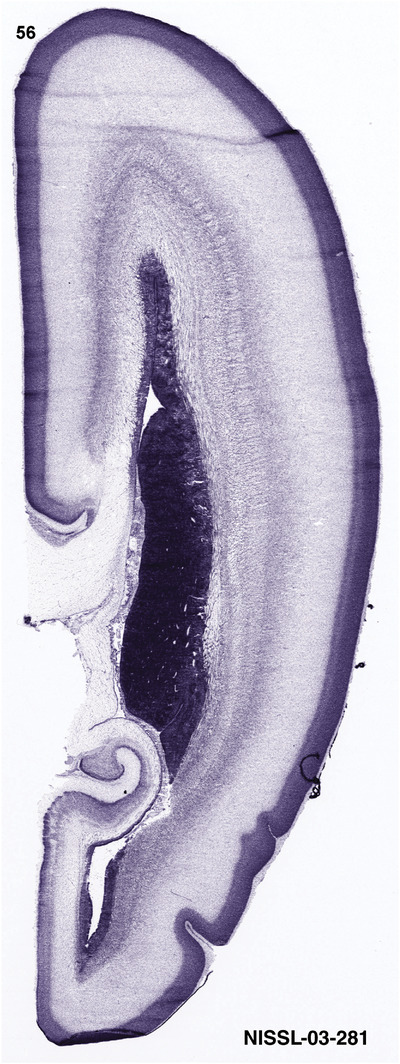
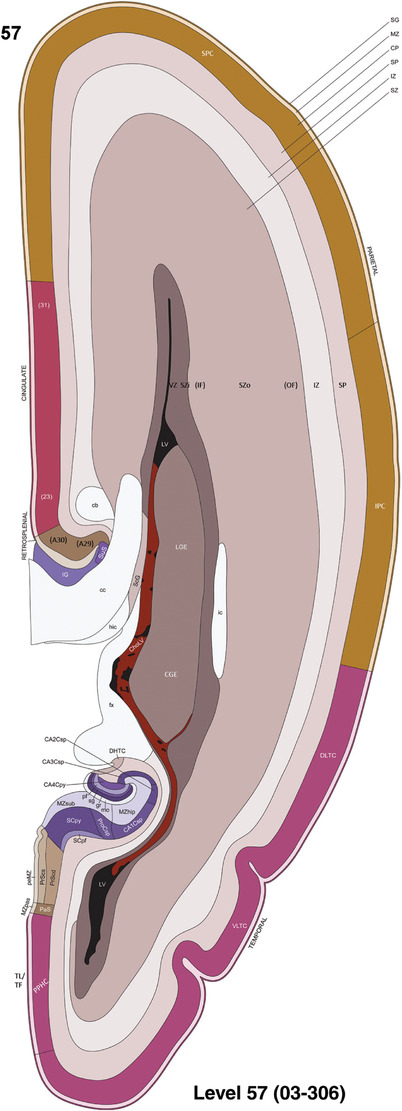
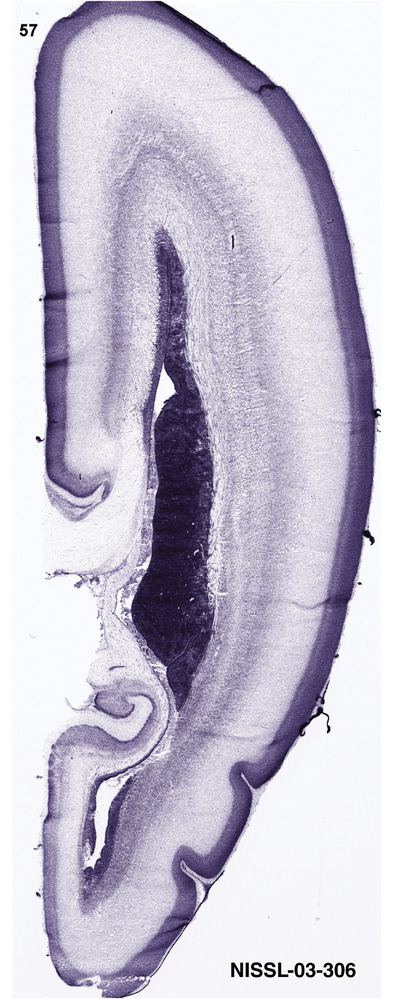
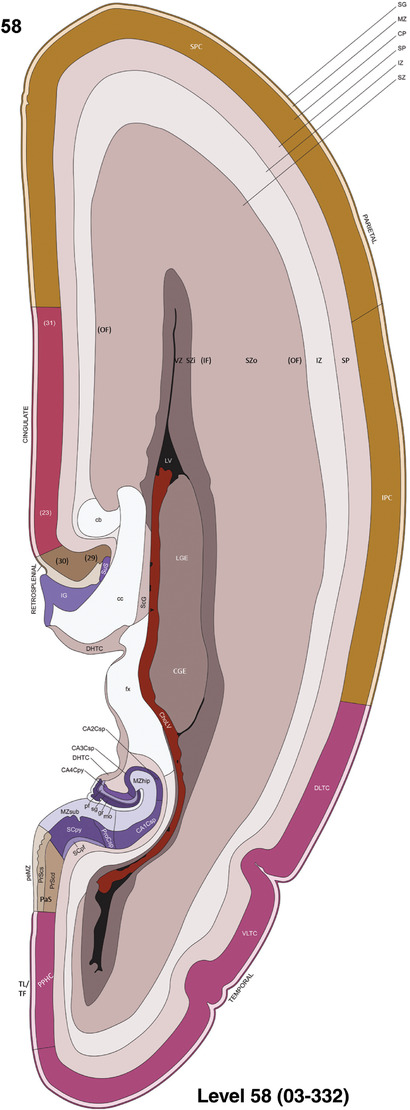
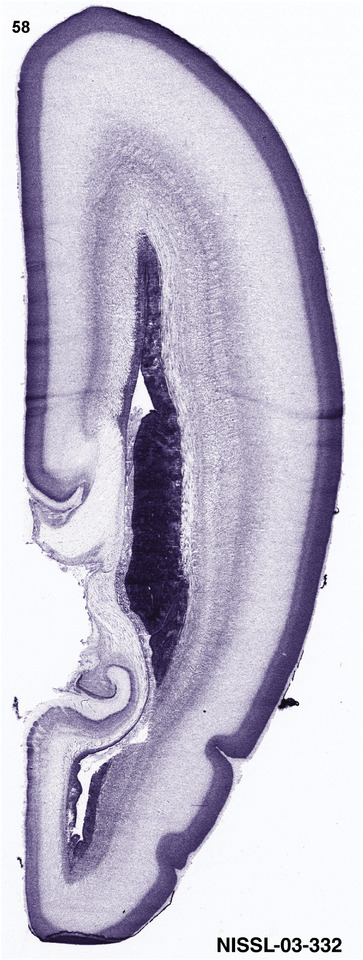
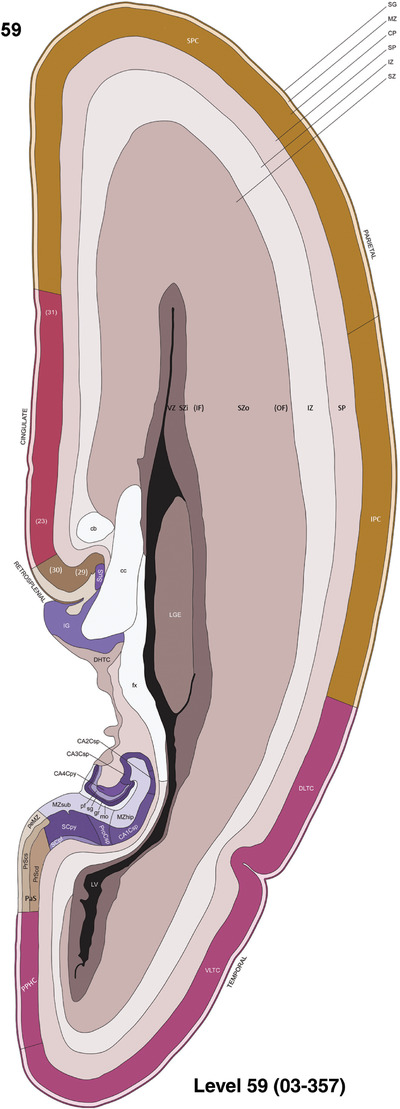
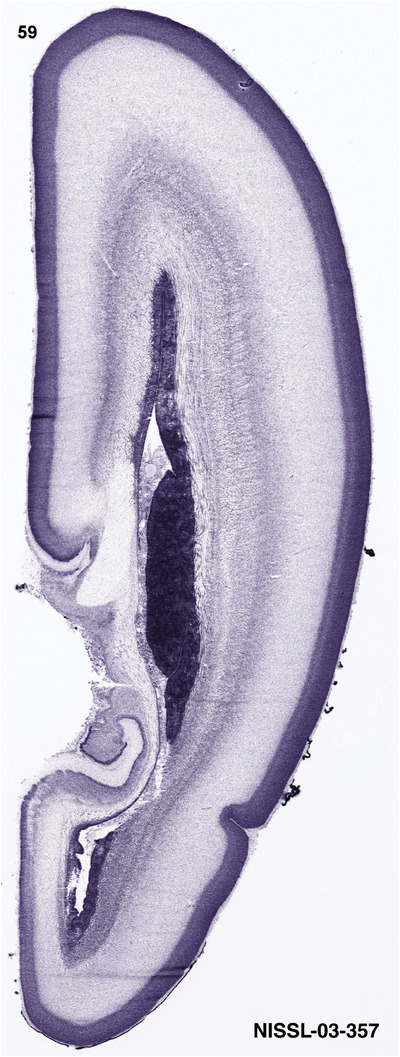
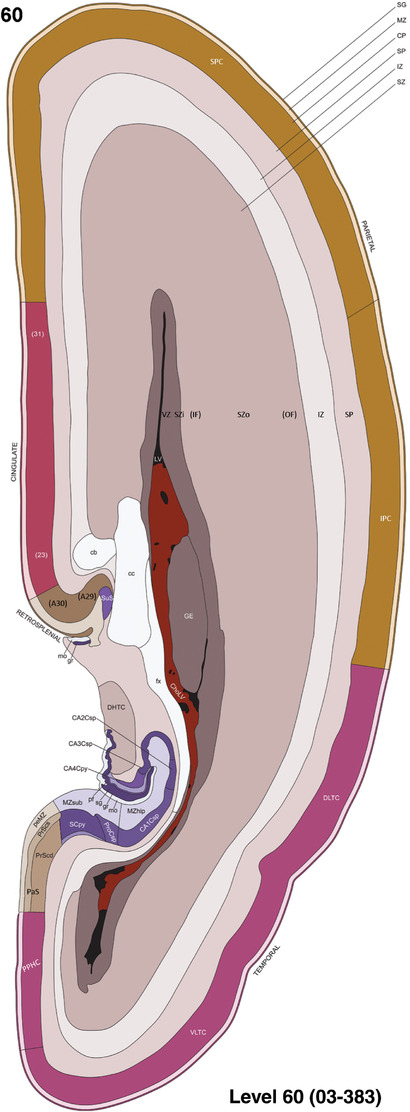
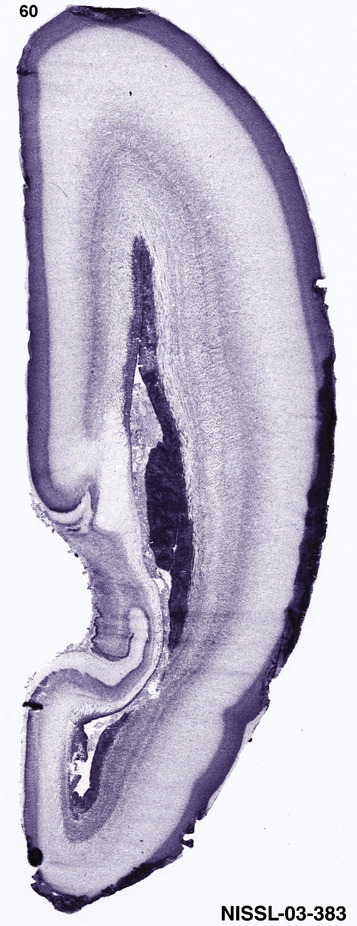
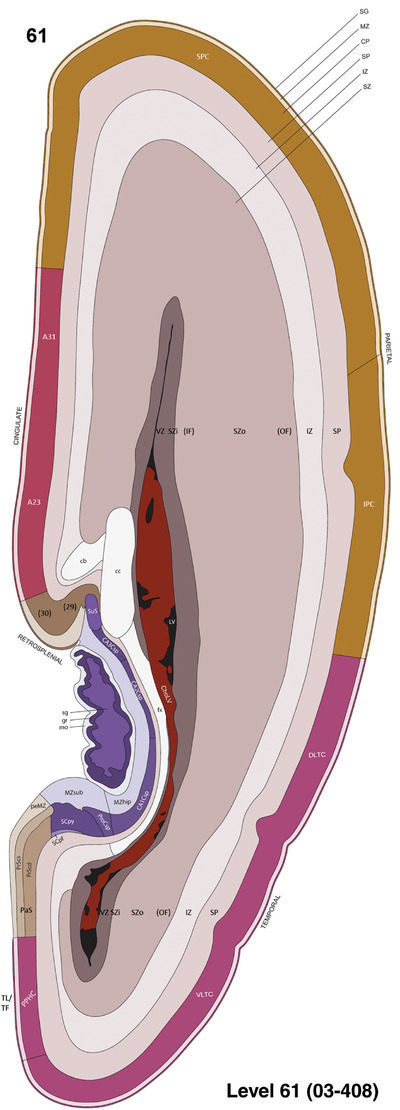
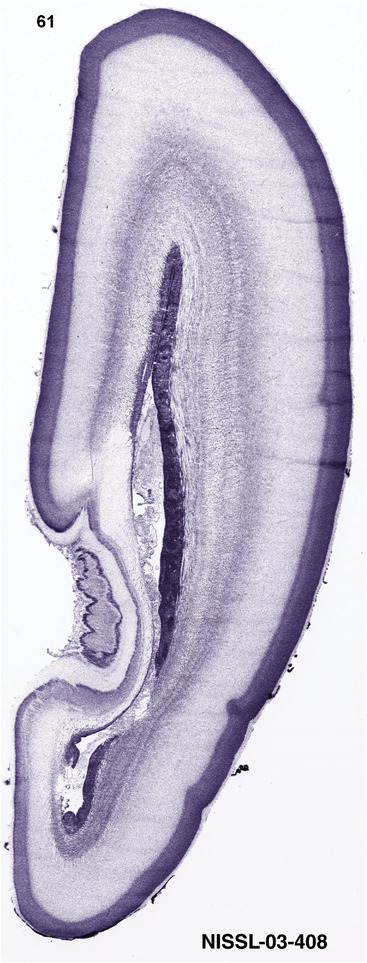
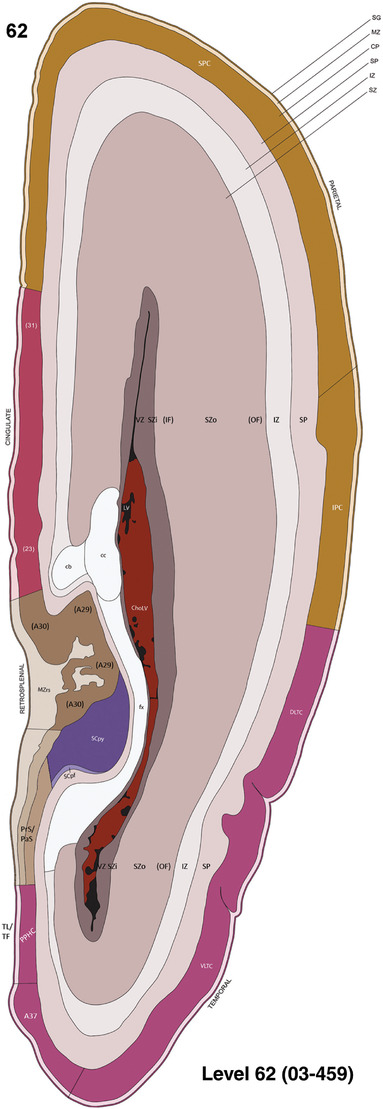
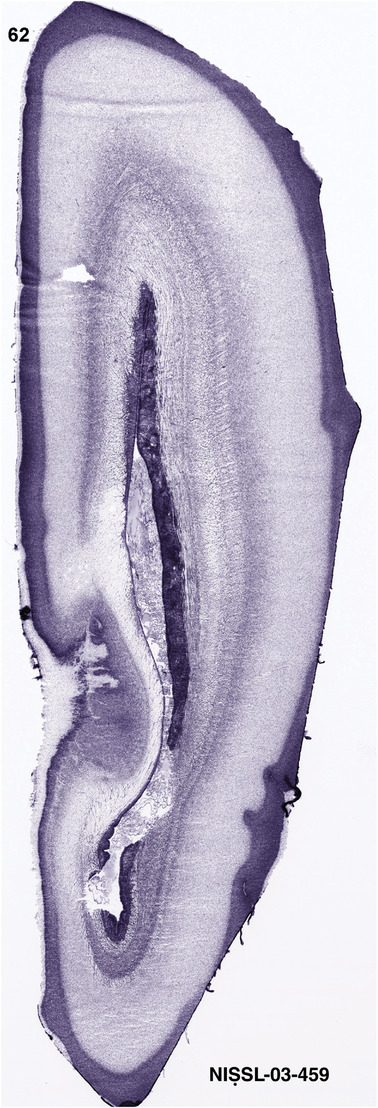
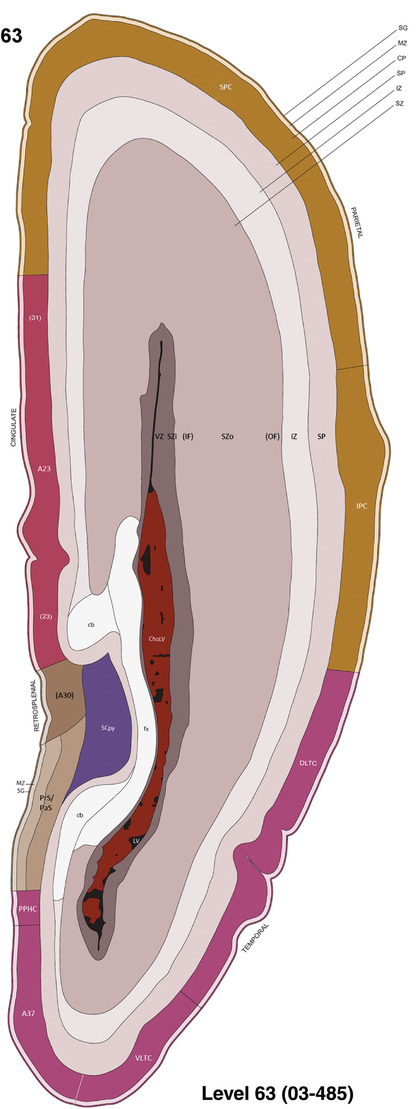
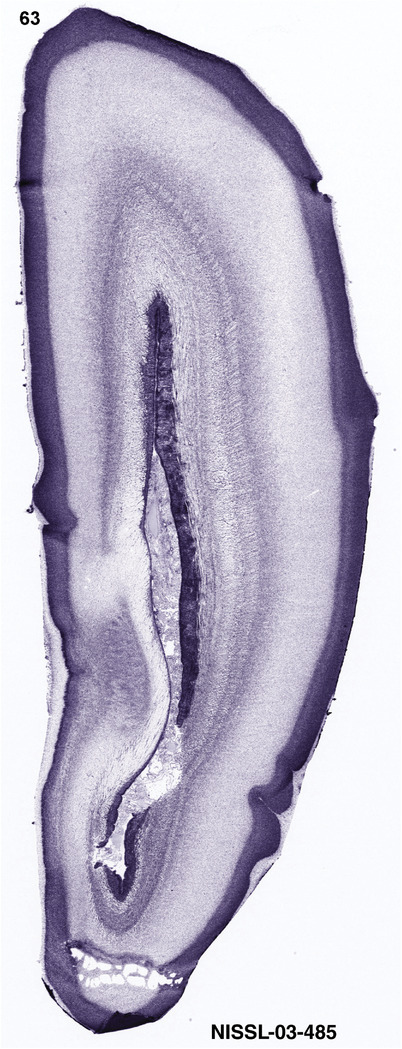
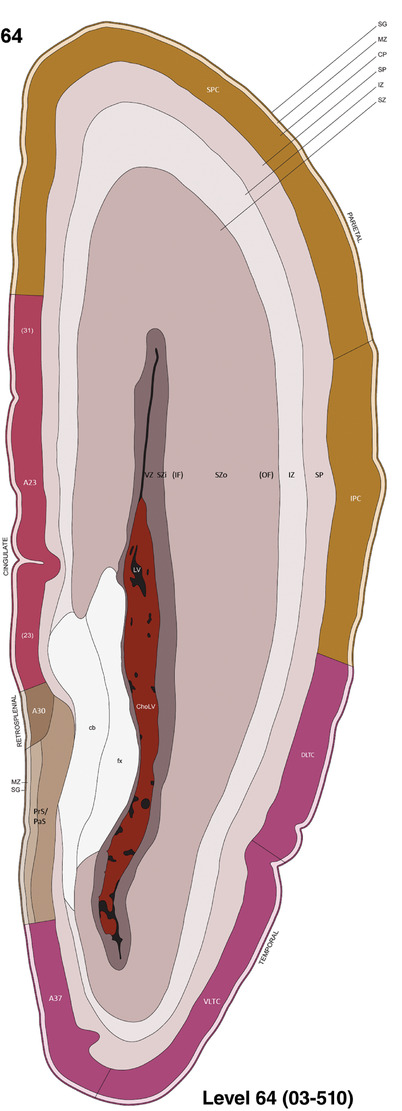
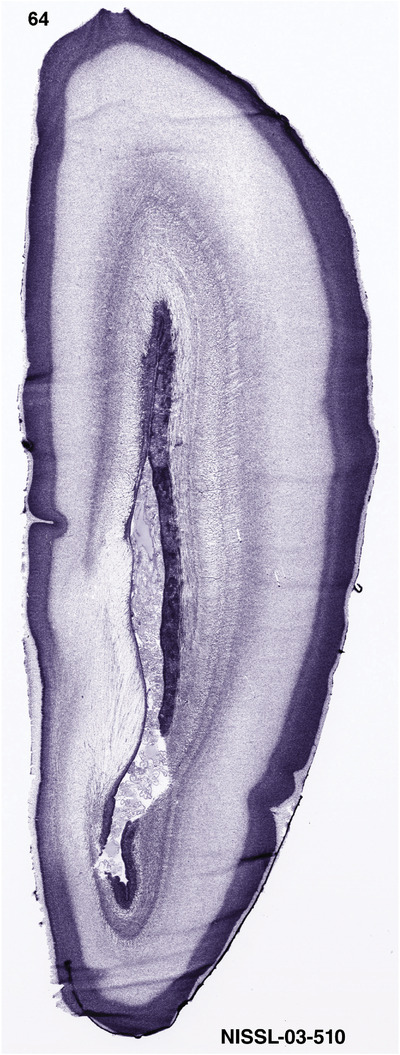
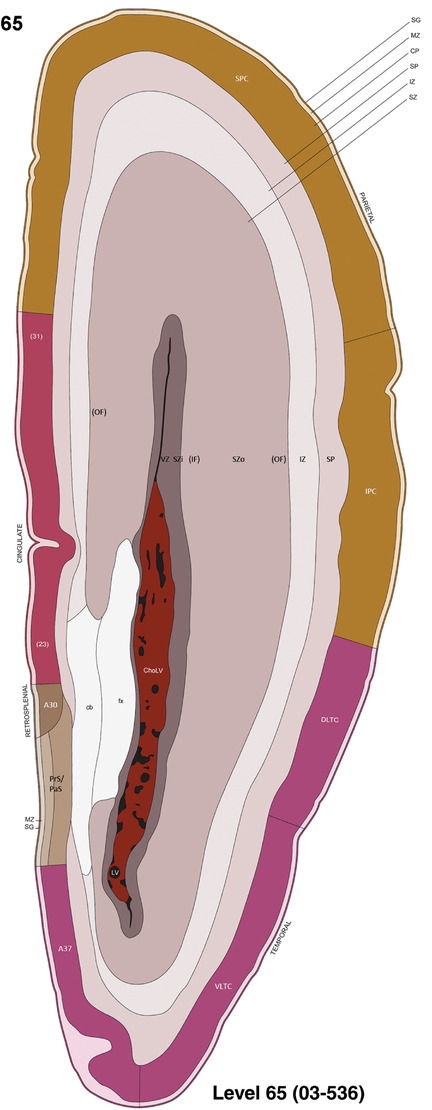
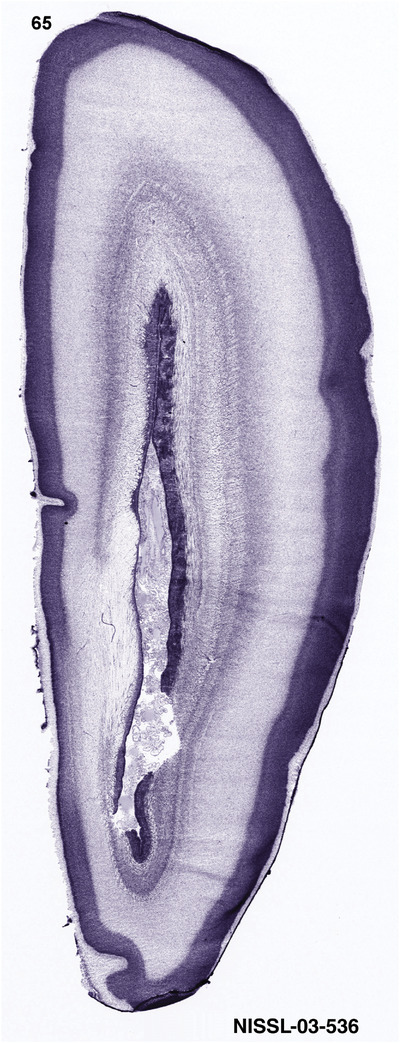
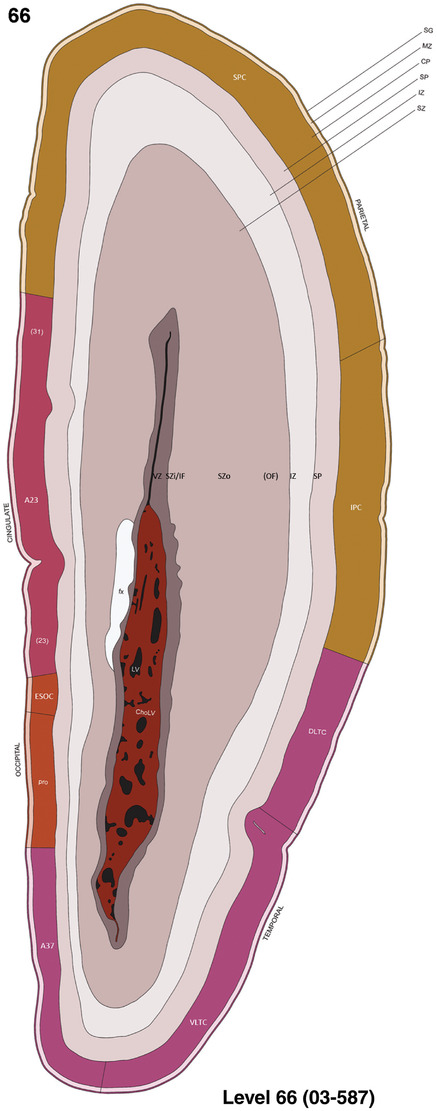
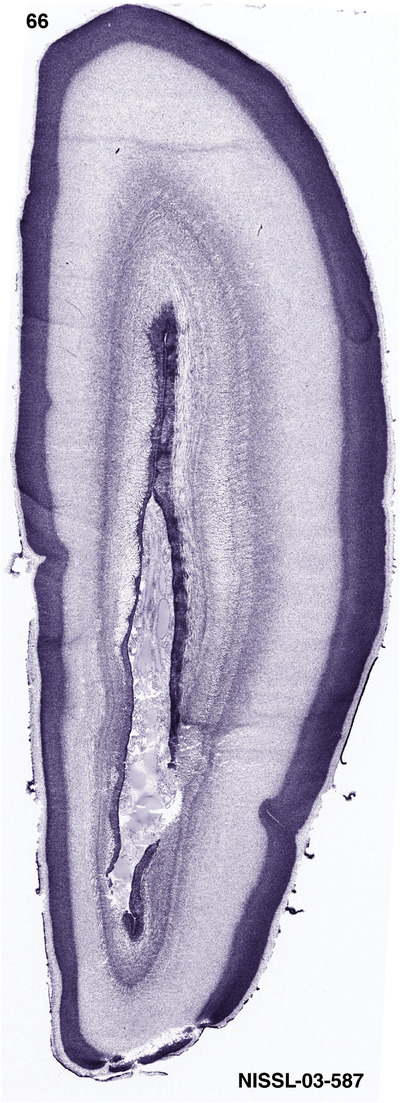
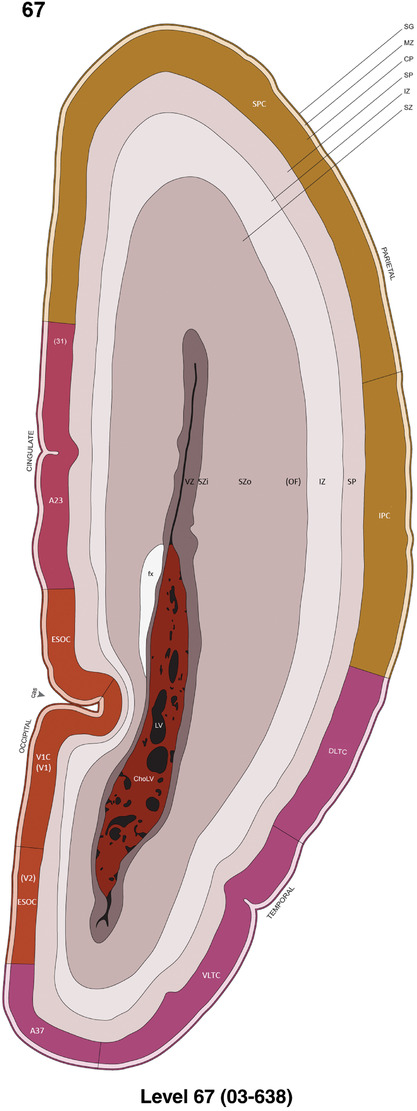
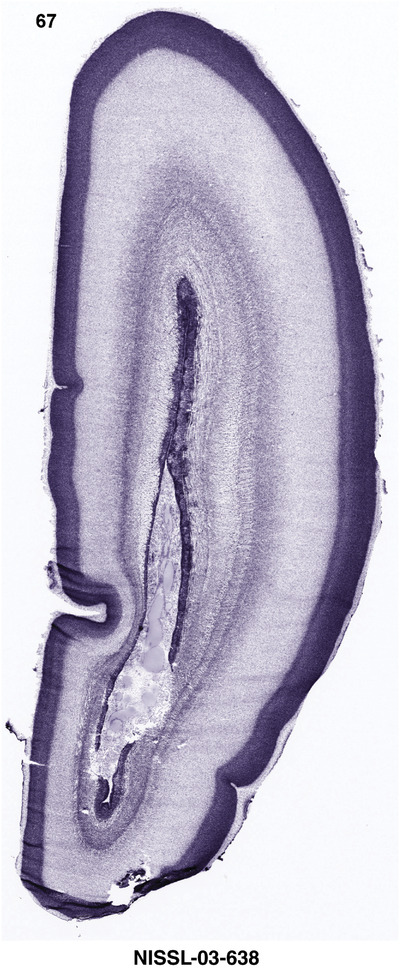
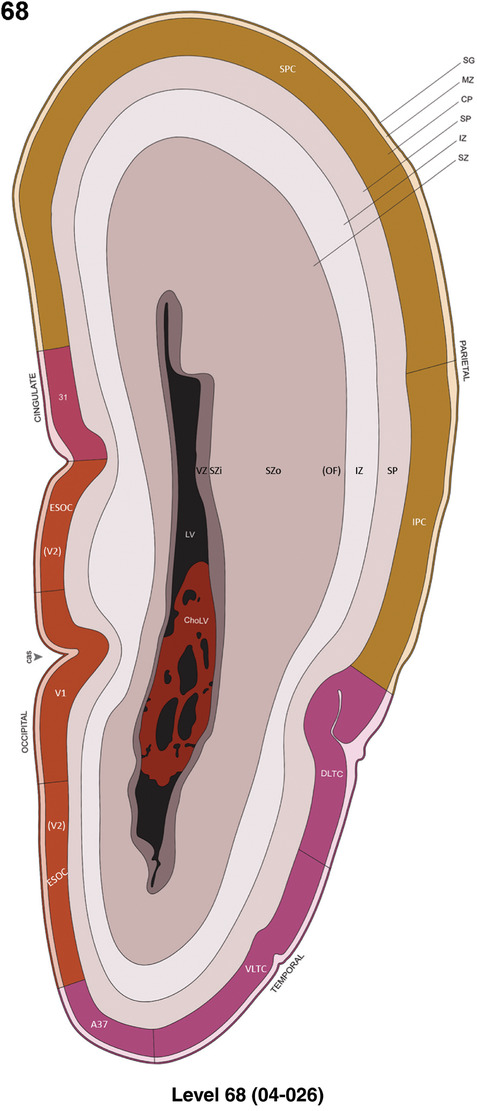
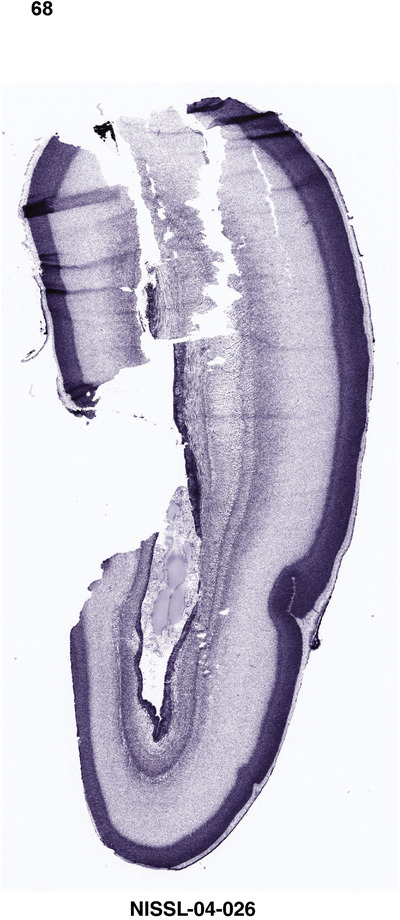
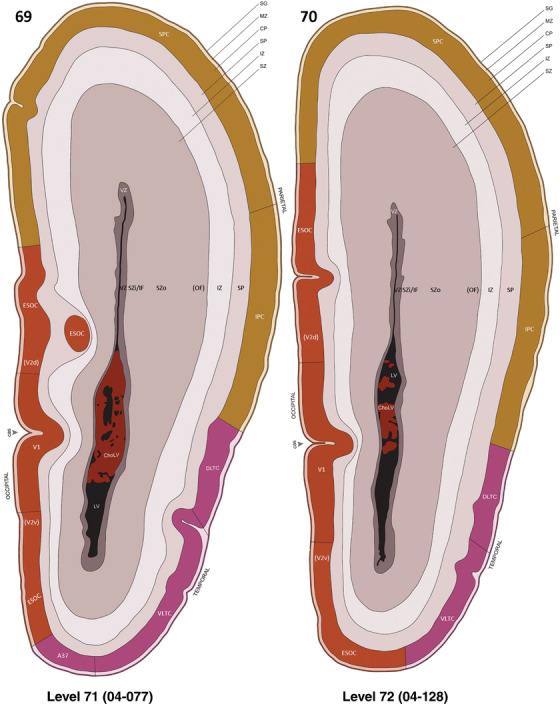
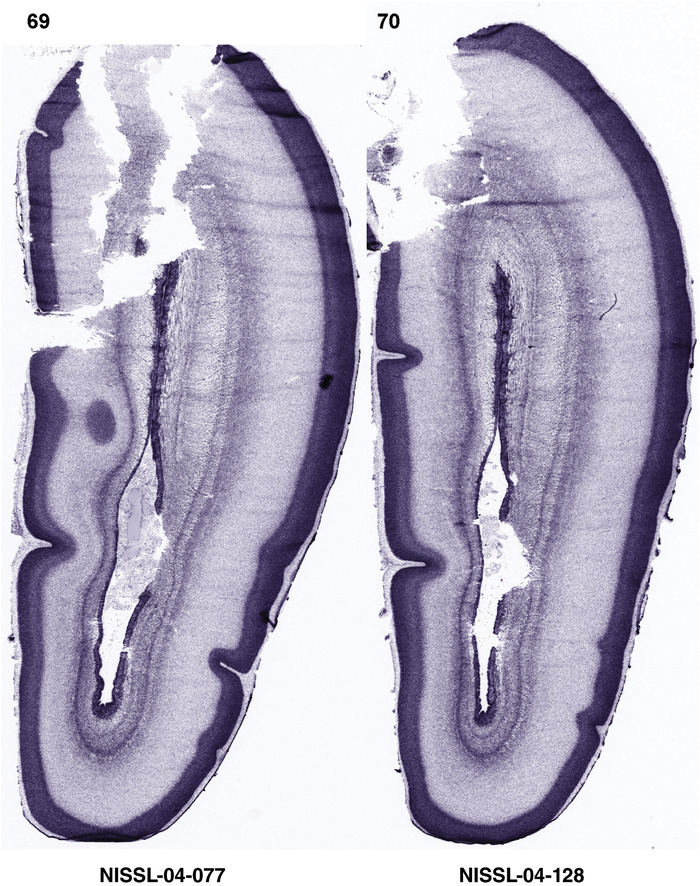
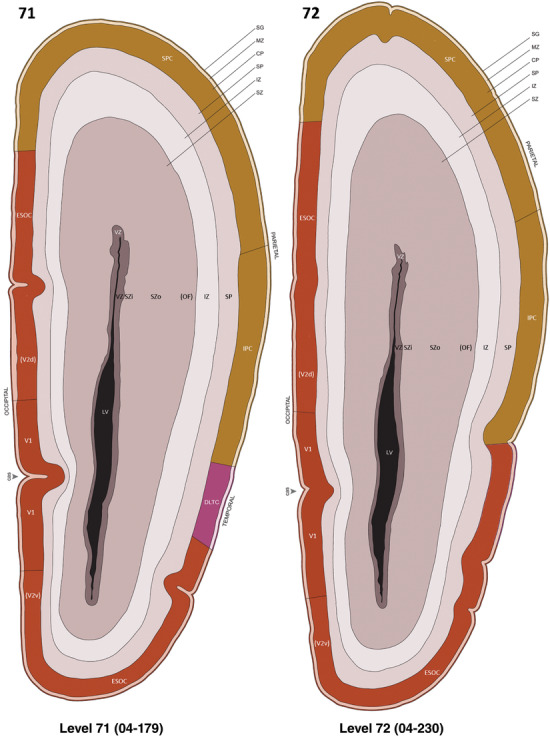
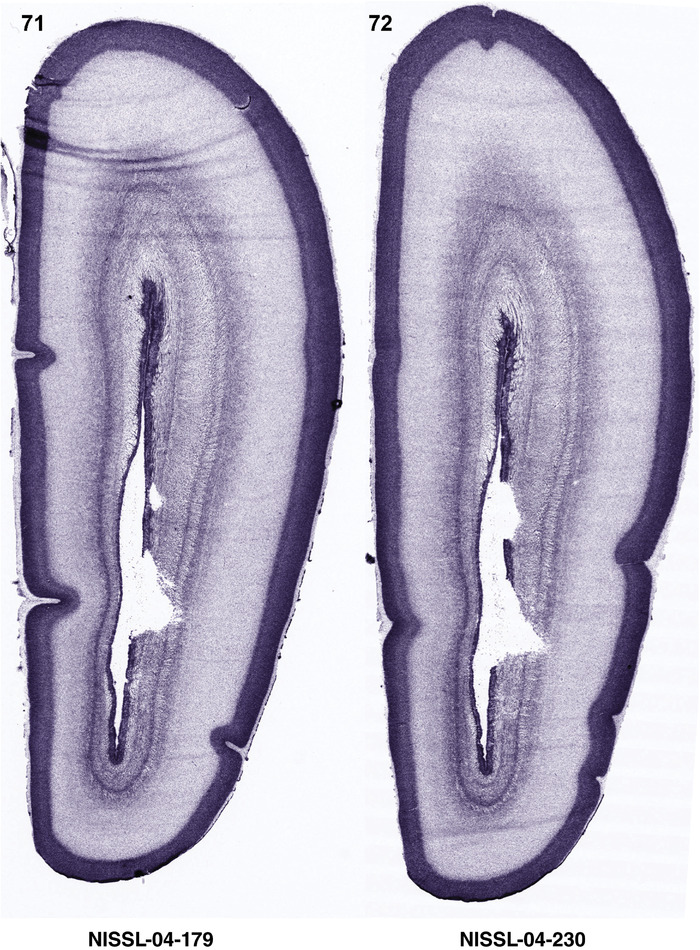
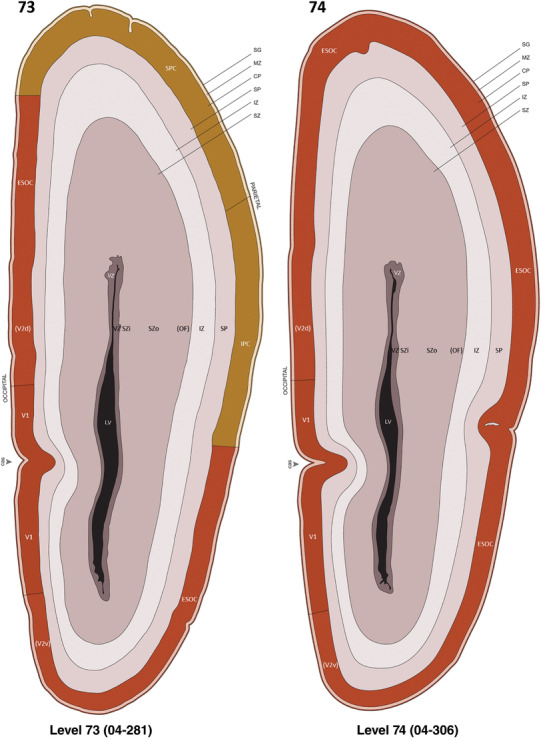
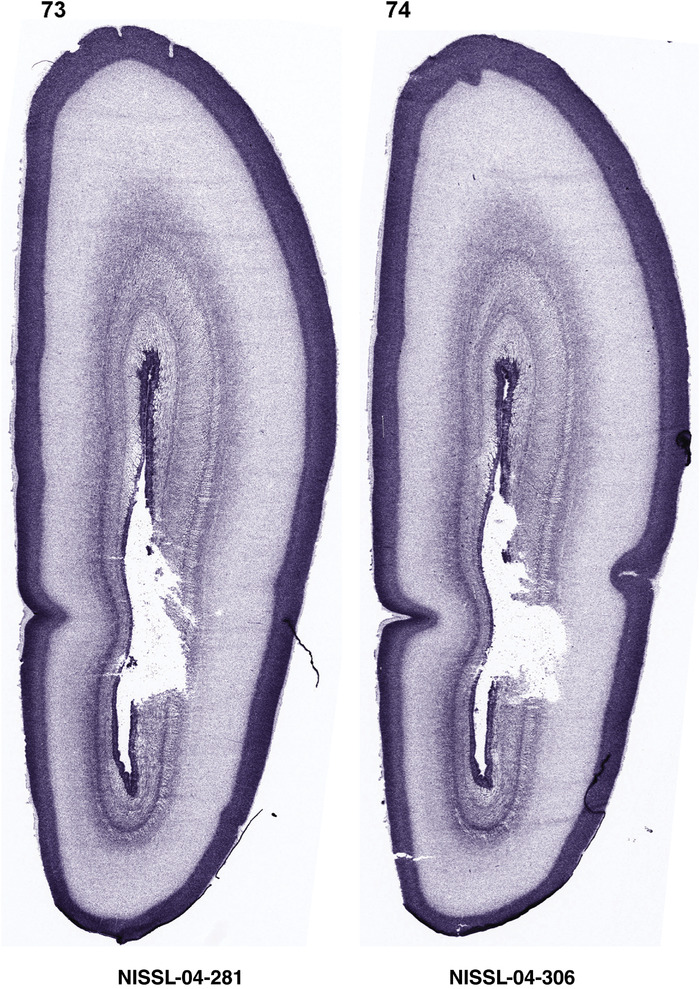
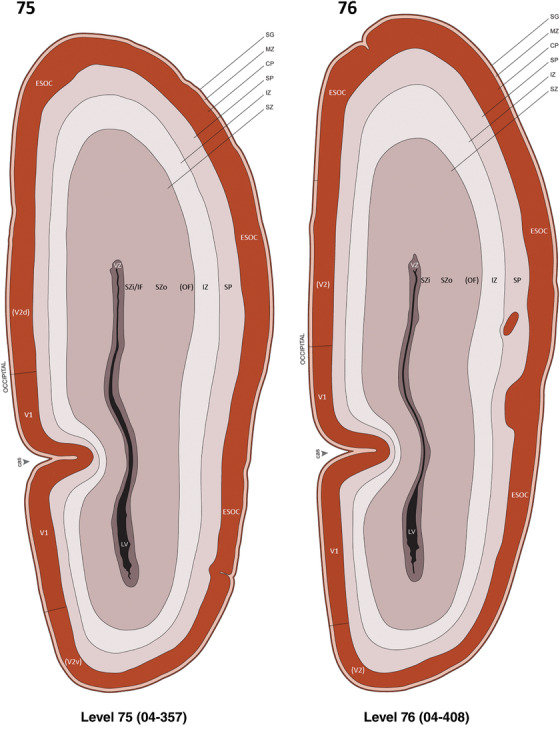
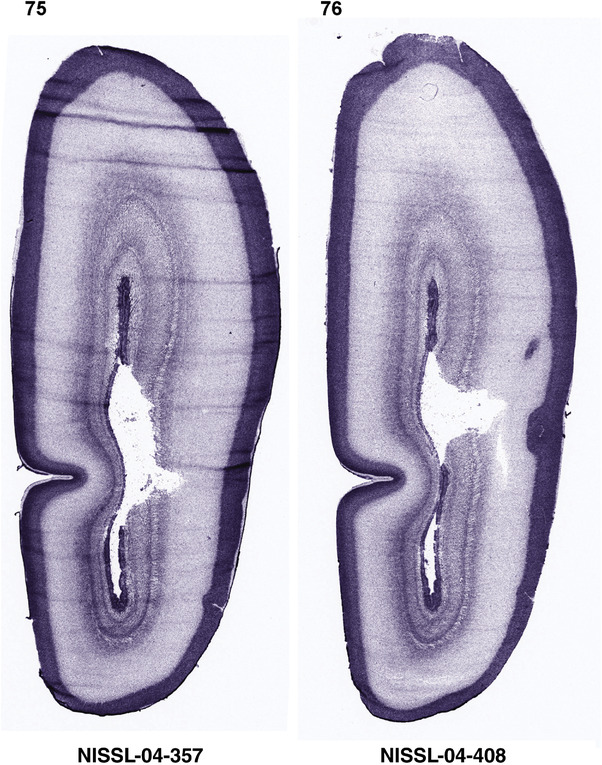
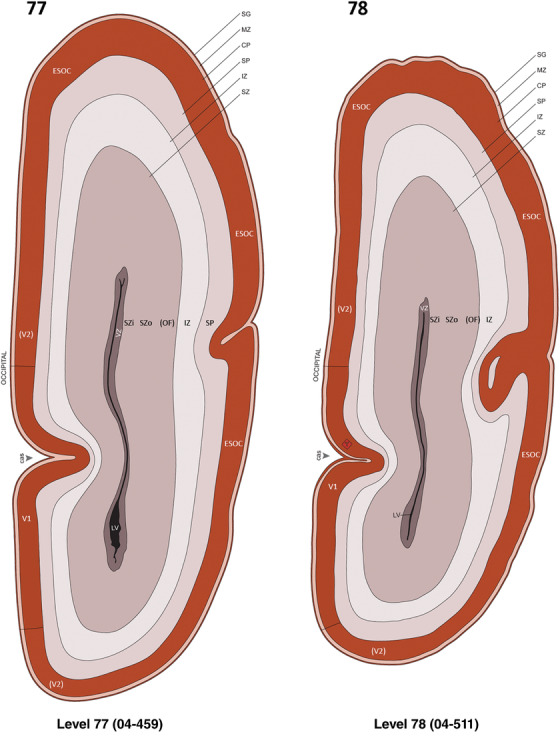
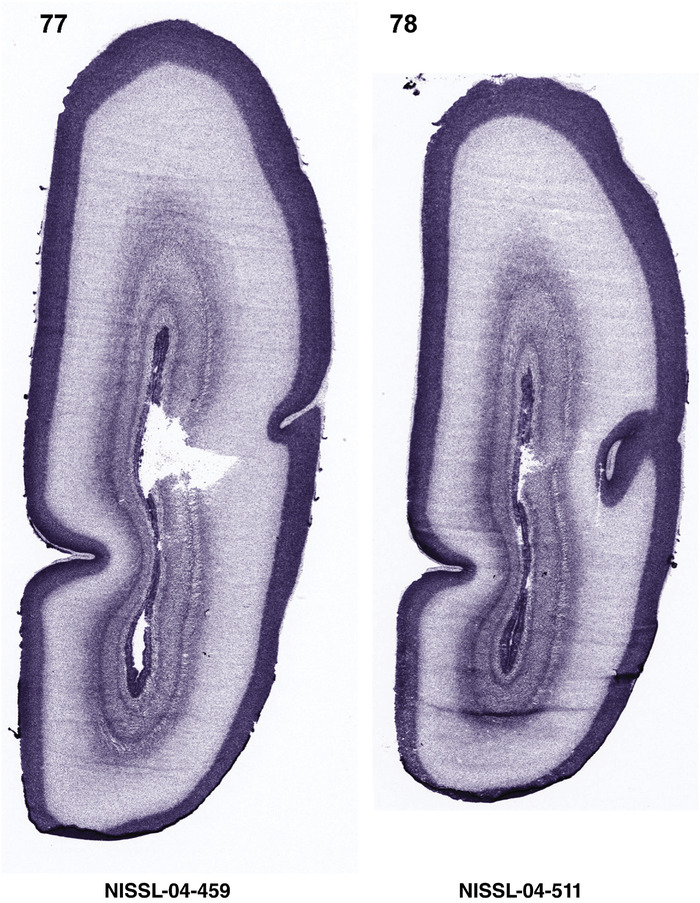
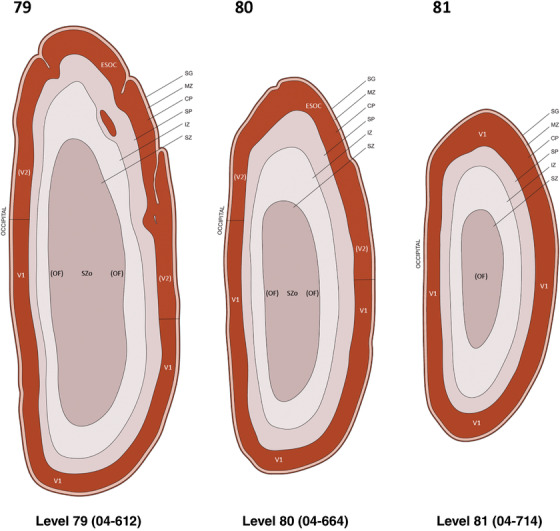
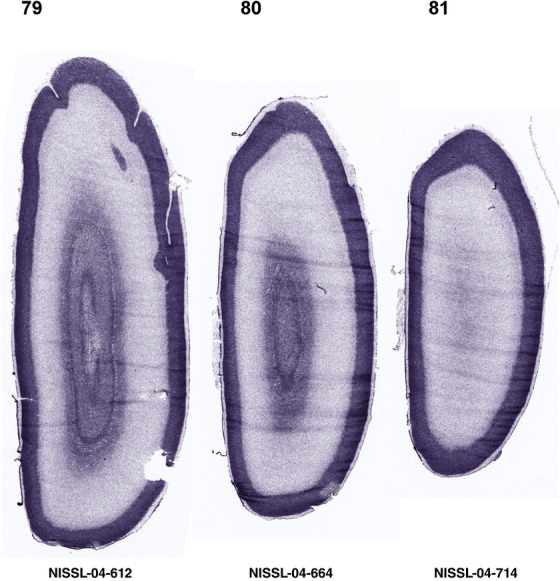
APPENDIX 4 4. Spatial expression of five representative genes in the brain at PCW 21
4.1.
Anatomical localizations of the gene expression are based on the anatomical brain atlas (Appendix 3) which is derived from the same brain hemisphere. Note that some artifacts like the blank (white) round or oval regions usually caused by air bulbs during ISH staining are indicated by (#). The spatial expression of the other 38 genes was not annotated because of limited length of this article but the sequential ISH images of these genes are linked online in this appendix. The spatial locations of their expression can be easily determined using our anatomical brain atlas (Appendix 3) as a guide, as demonstrated for the five genes displayed here.
List of five genes and their spatial expression in the brain
ENC1 [ectodermal‐neural cortex (with BTB‐like domain)] 423
(link to online high‐resolution sequential ISH images)
GRIK2 (glutamate receptor, ionotropic, kainate 2): 449
(link to online high‐resolution sequential ISH images)
NRGN neurogranin (protein kinase C substrate, RC3): 464
(link to online high‐resolution sequential ISH images)
PLXNA2 (plexin A2): 475
(link to online high‐resolution sequential ISH images)
SST (somatostatin): 491
(link to online high‐resolution sequential ISH images)
b. List of other 38 genes and their spatial expression in the brain (online link only)
CALB2 (calbindin 2): link to online ISH images.
CDH4 [cadherin 4, type 1, R‐cadherin (retinal)]: link to online ISH images.
CNTNAP2 (contactin associated protein‐like 2): link to online ISH images.
DCX (doublecortin): link to online ISH images.
DLX1 (distal‐less homeobox 1): link to online ISH images.
DLX2 (distal‐less homeobox 2): link to online ISH images.
DLX5 (distal‐less homeobox 5): link to online ISH images.
EOMES (eomesodermin) or TBR2 (T‐box brain transcription factor 2): link to online ISH images.
ERBB4 [v‐erb‐a erythroblastic leukemia viral oncogene homolog 4 (avian)]: link to online ISH images.
ETV1 (ets variant 1): link to online ISH images.
FABP7 (fatty acid‐binding protein 7, brain): link to online ISH images.
FADS2 (fatty acid desaturase 2): link to online ISH images.
FEZF2 (FEZ family zinc finger 2): link to online ISH images.
FOXG1 (forkhead box G1): link to online ISH images.
FOXP1 (forkhead box P1): link to online ISH images.
GAP43 (growth‐associated protein 43): link to online ISH images.
GFAP (glial fibrillary acidic protein): link to online ISH images.
HOXA4 (homeobox A4): link to online ISH images.
LBX1 (ladybird homeobox 1): link to online ISH images.
LHX2 (LIM homeobox 2): link to online ISH images.
LMO4 (LIM domain only 4): link to online ISH images.
MECP2 (methyl CpG binding protein 2 [Rett syndrome]): link to online ISH images
NES (nestin): link to online ISH images.
NKX2.1 (NK2 homeobox 1): link to online ISH images.
NPY (neuropeptide Y): link to online ISH images.
NRXN1 (neurexin 1): link to online ISH images.
NTRK2 (neurotrophic tyrosine kinase, receptor, type 2): link to online ISH images.
PAX6 (paired box 6): link to online ISH images.
PLXNA2 (plexin A2): link to online ISH images.
RELN (reelin): link to online ISH images.
SATB2 (SATB homeobox 2): link to online ISH images.
SHANK3 (SH3 and multiple ankyrin repeat domains 3): link to online ISH images.
SOX2 [SRY (sex determining region Y)‐box 2]: link to online ISH images.
SOX10 [SRY (sex determining region Y)‐box 10]: link to online ISH images.
SYNGAP1 [synaptic Ras GTPase activating protein 1 homolog (rat)]: link to online ISH images.
TBR1 (T‐box brain transcription factor 1): link to online ISH images.
TPP1 (tripeptidyl peptidase I): link to online ISH images.
VIM (tripeptidyl peptidase I): link to online ISH images.
ZIC1 [Zic family member 1 (odd‐paired homolog, Drosophila)]: link to online ISH images.
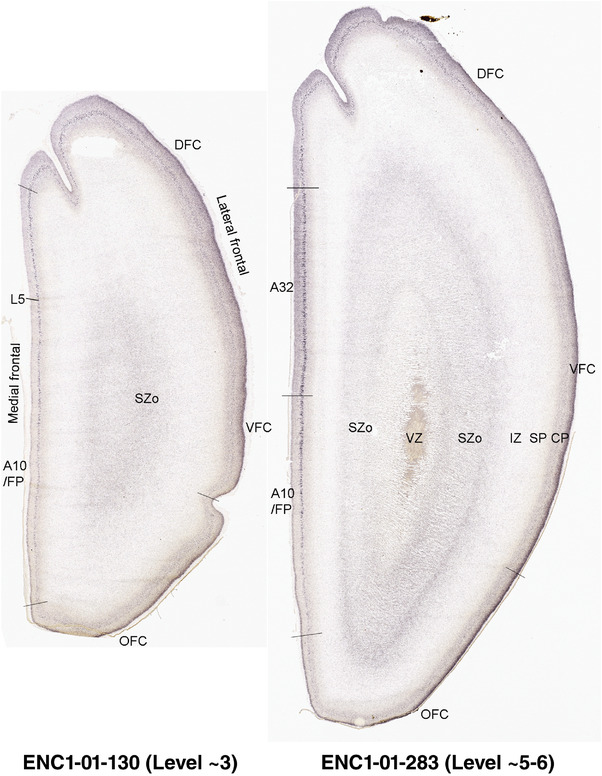
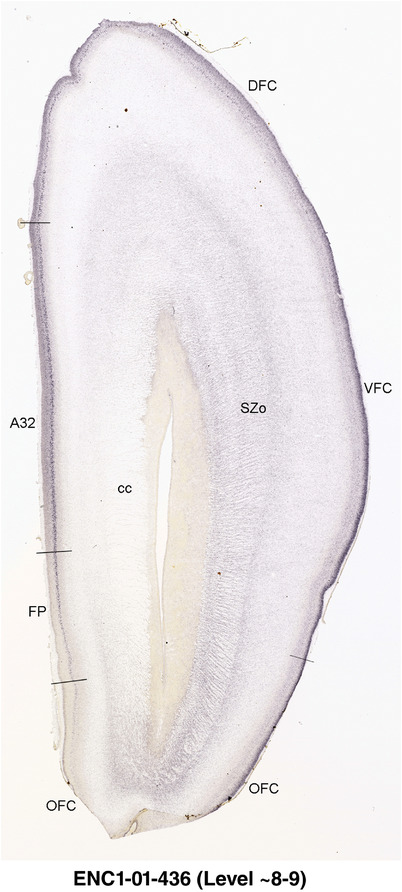
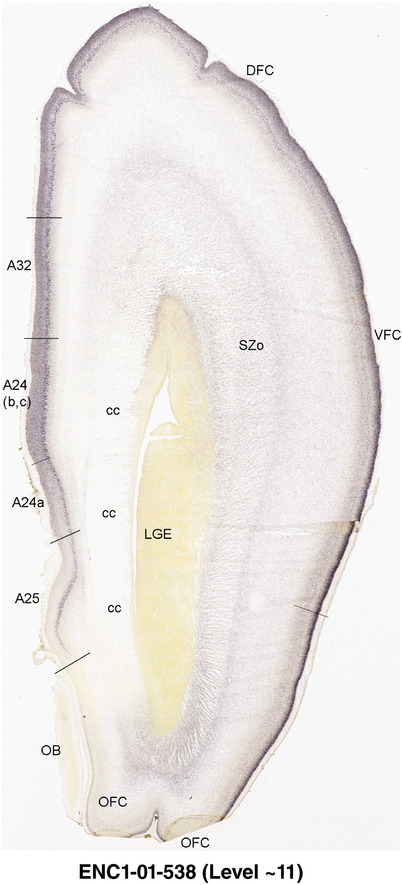
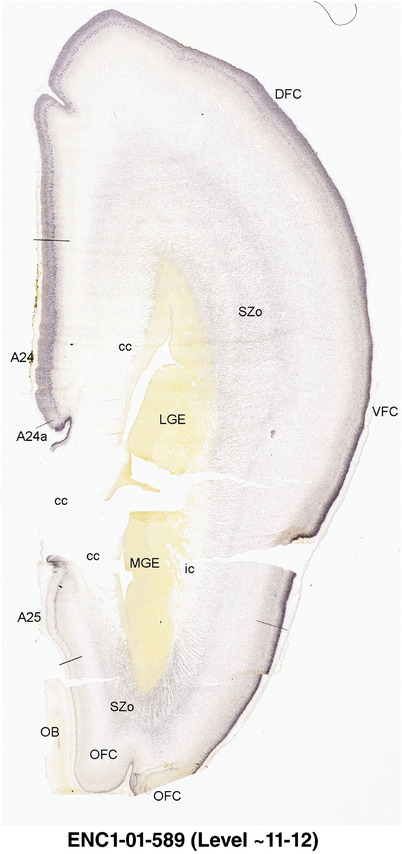
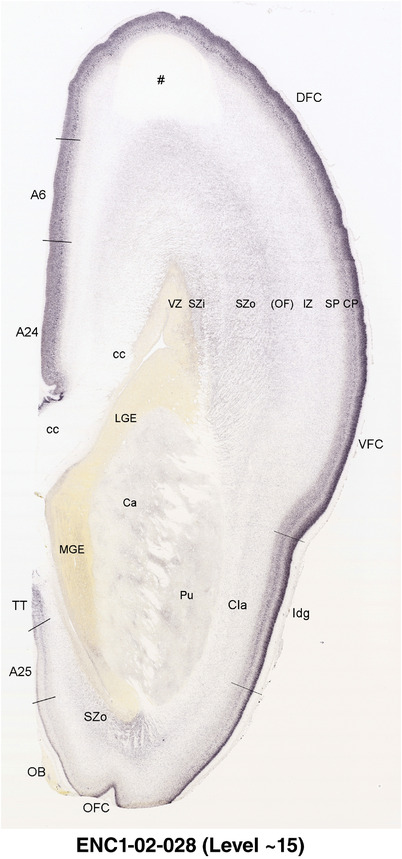
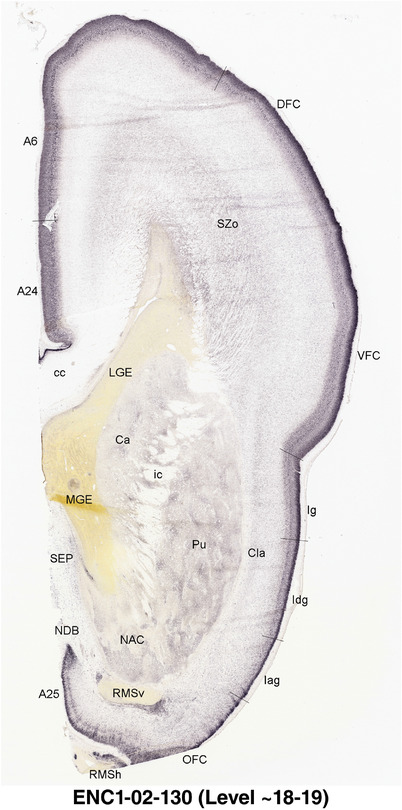
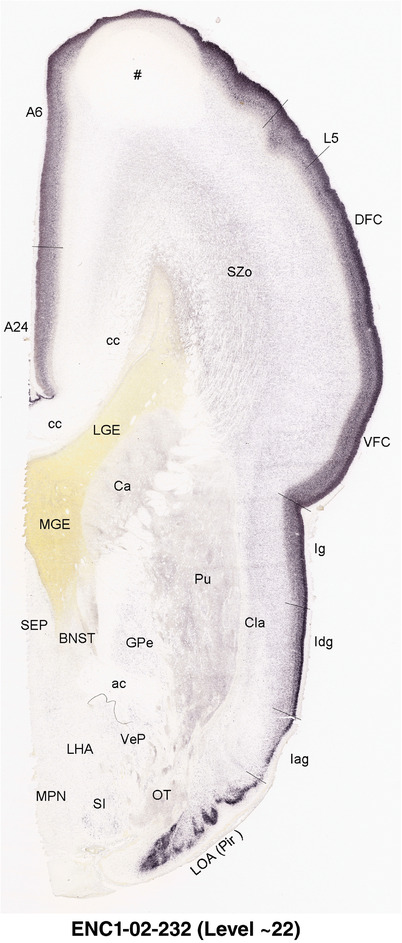
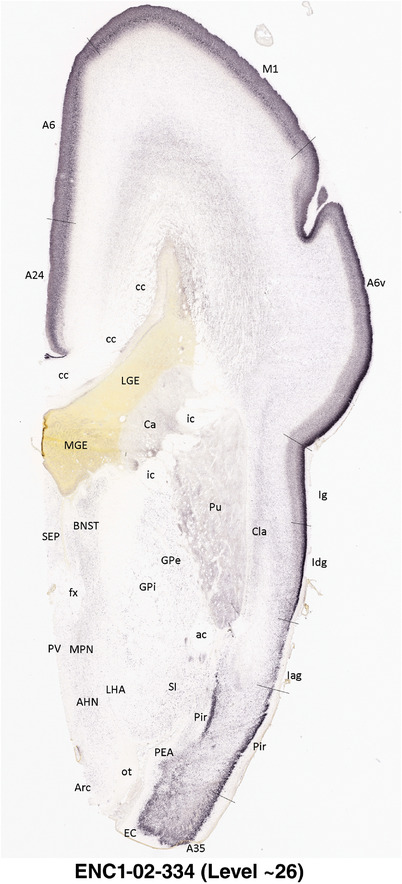
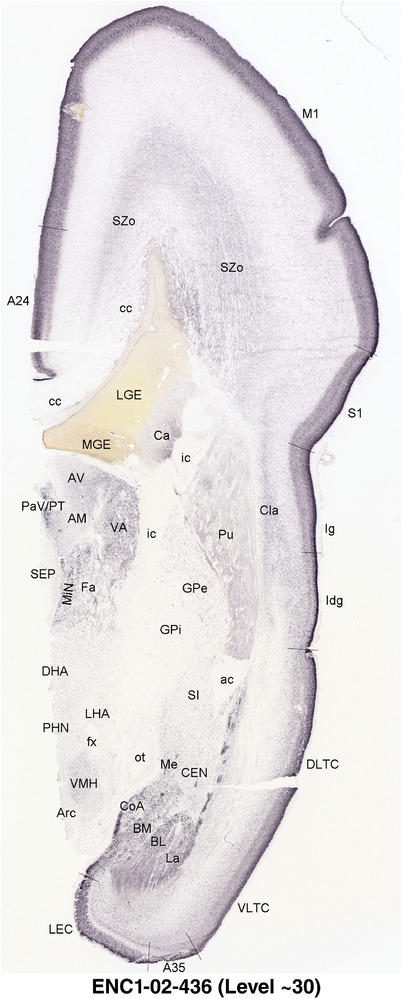
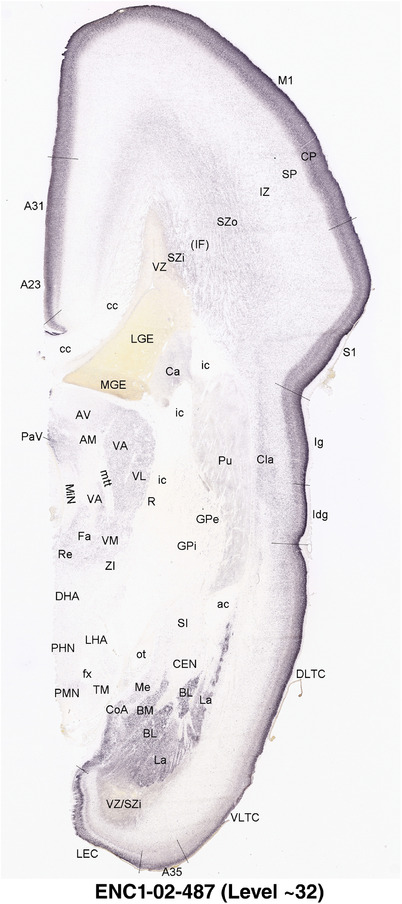
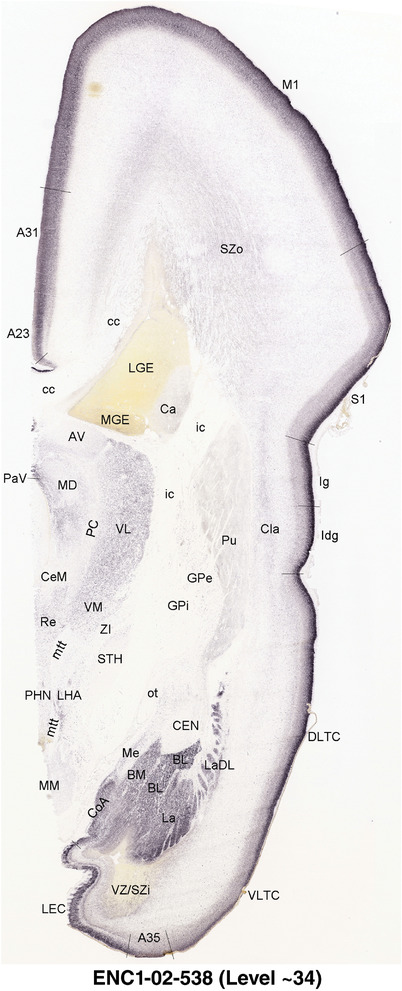
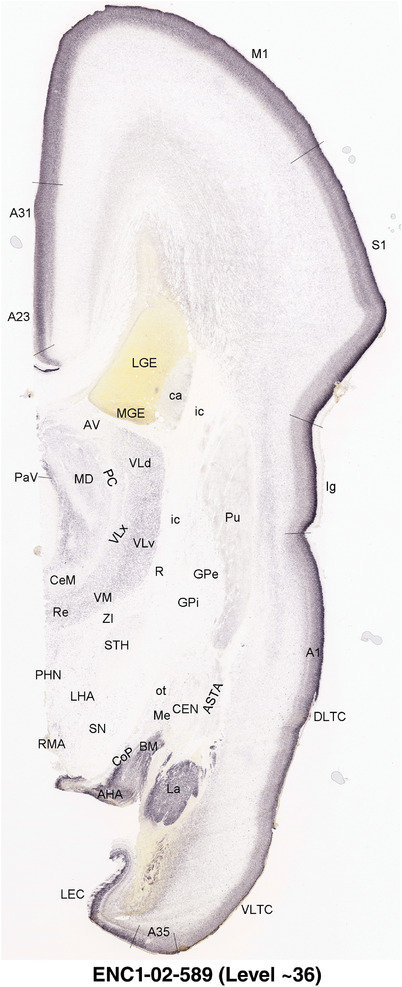
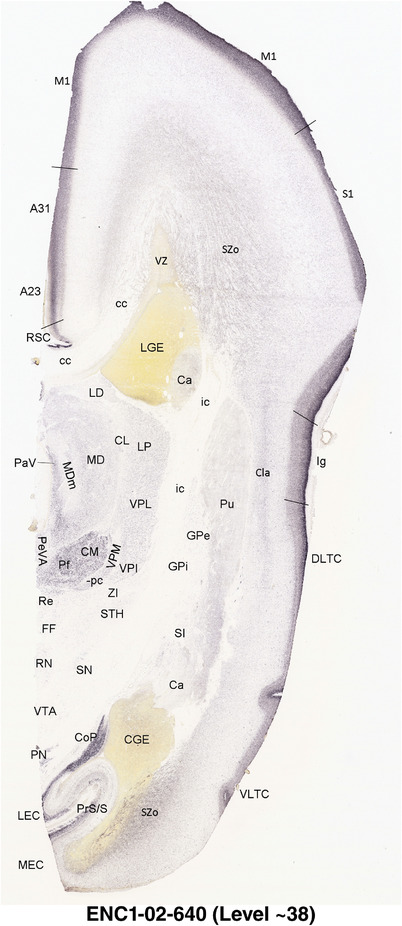
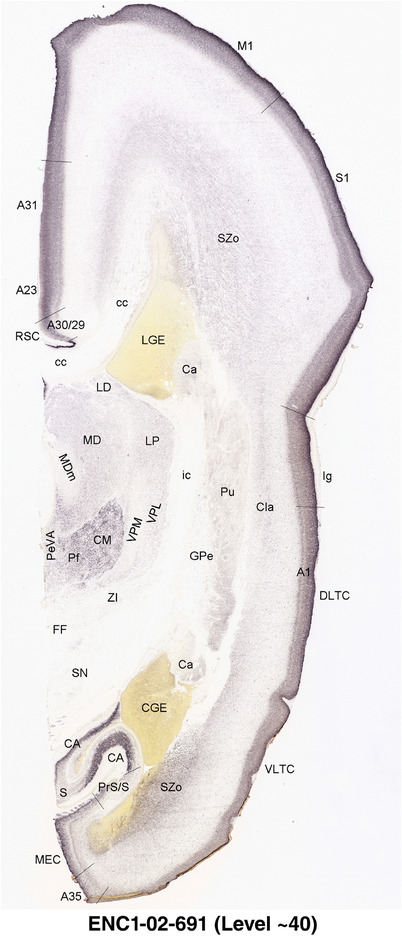
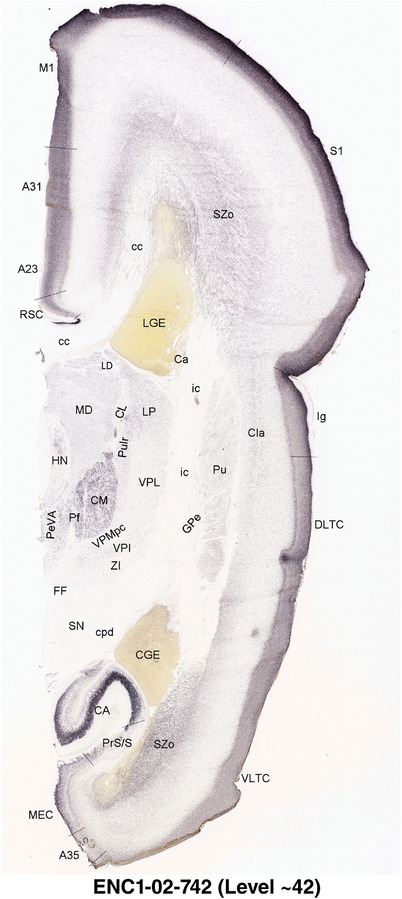
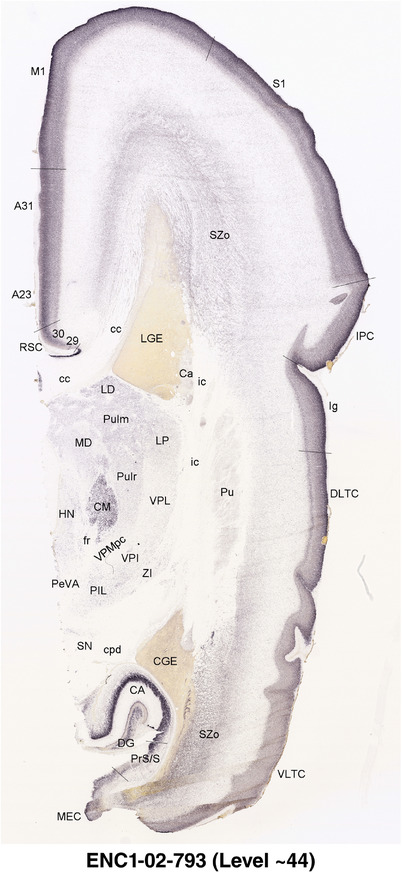
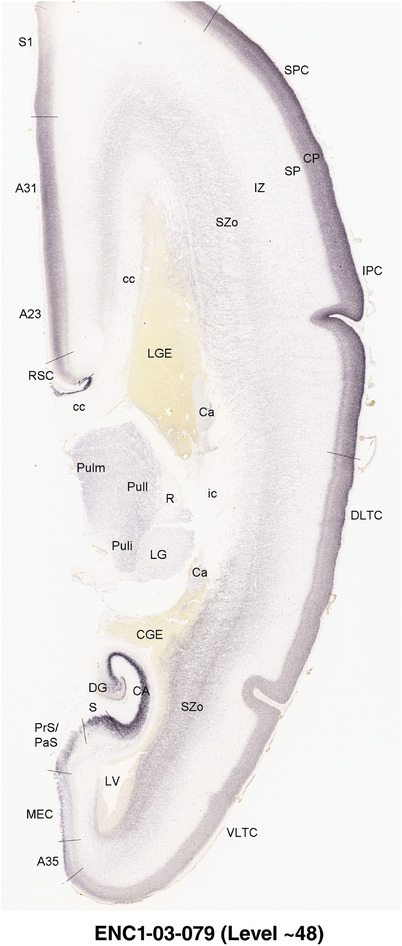
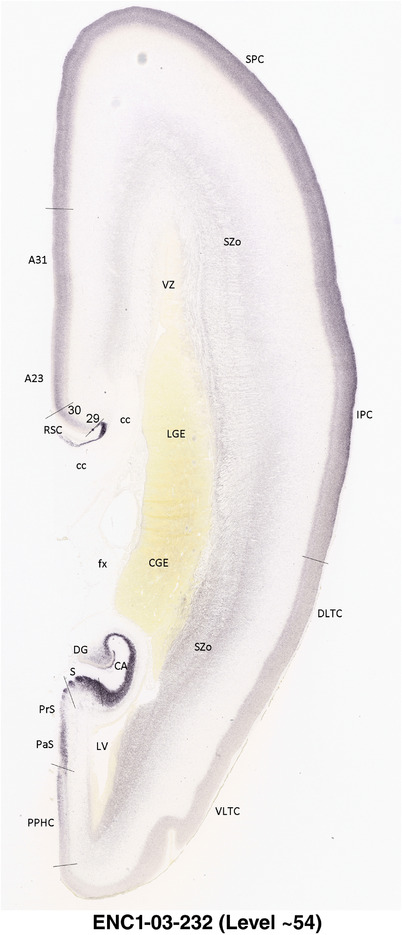
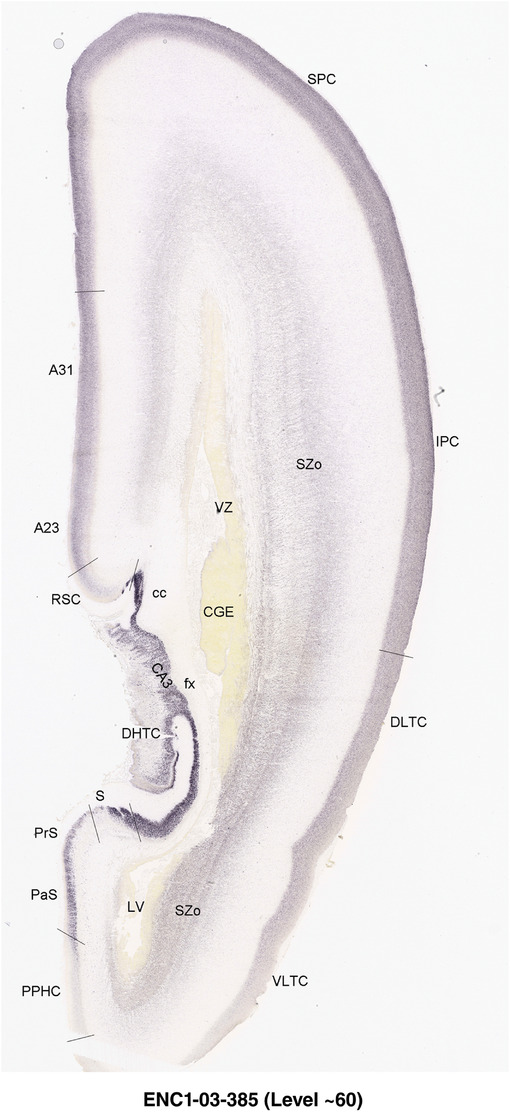
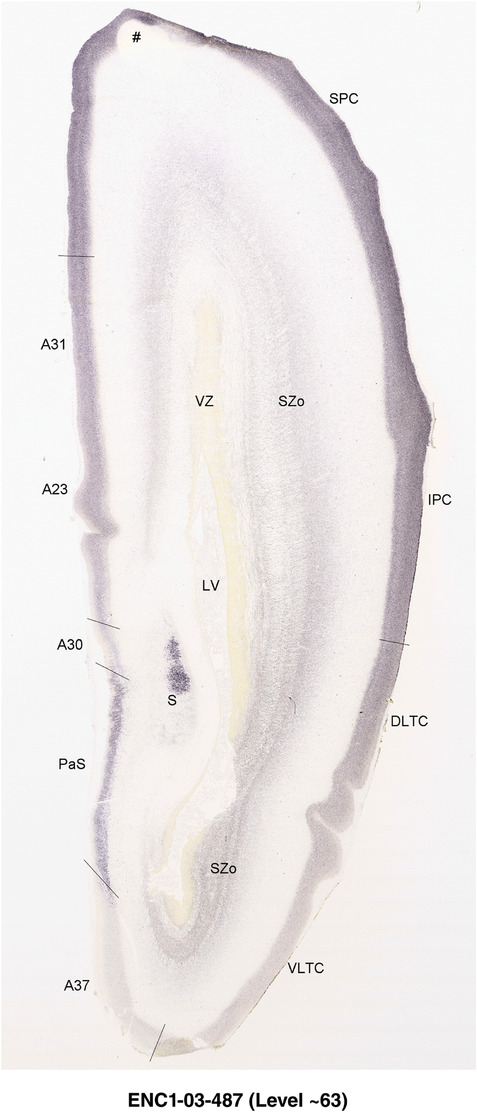
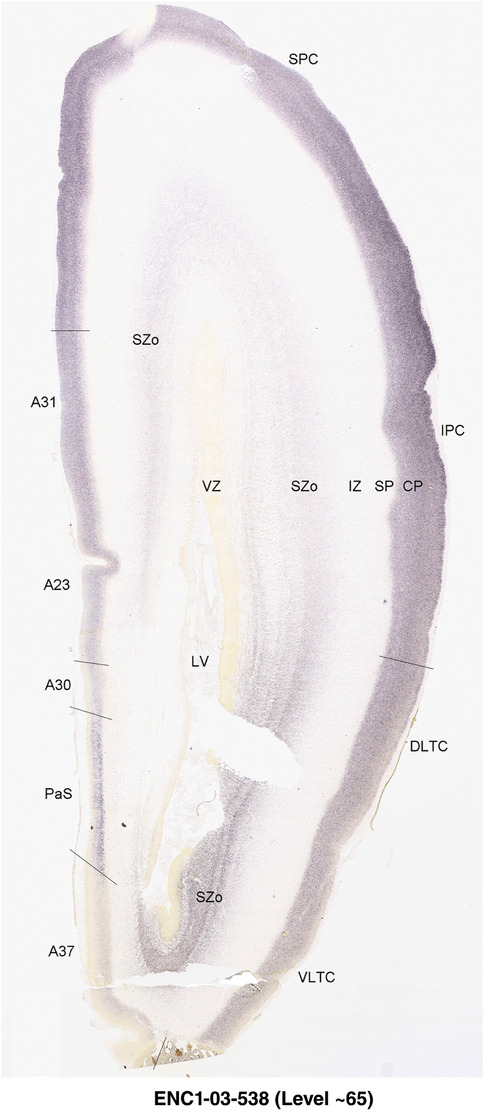
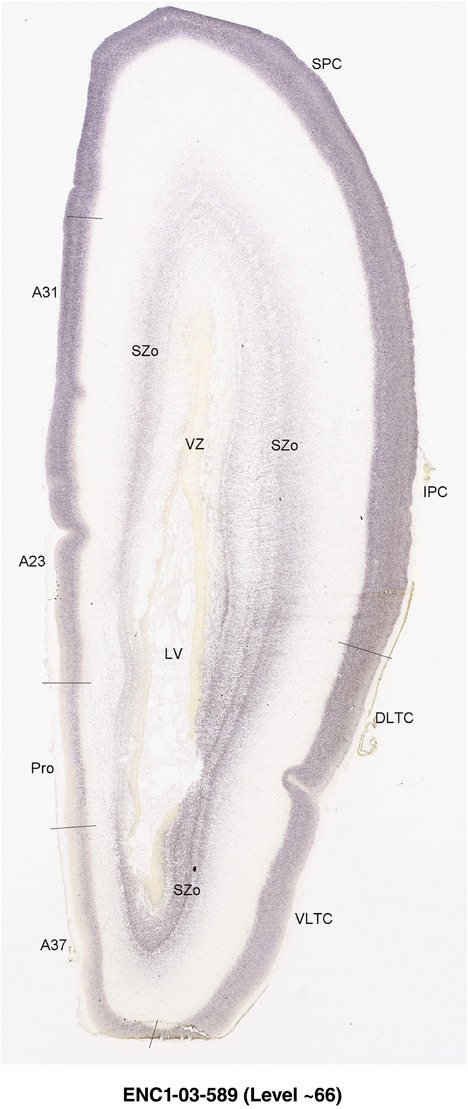
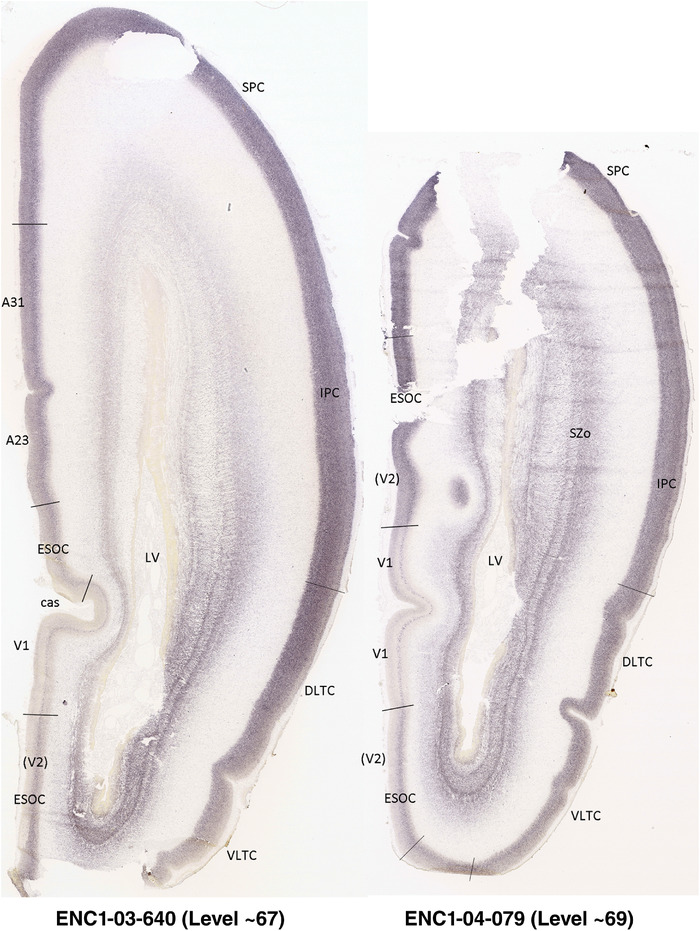
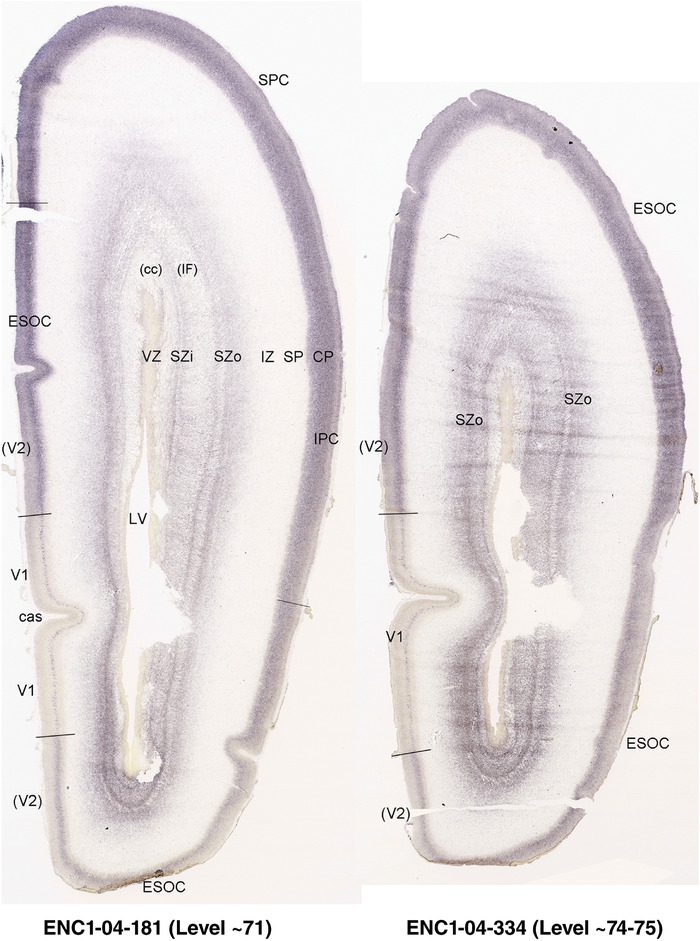
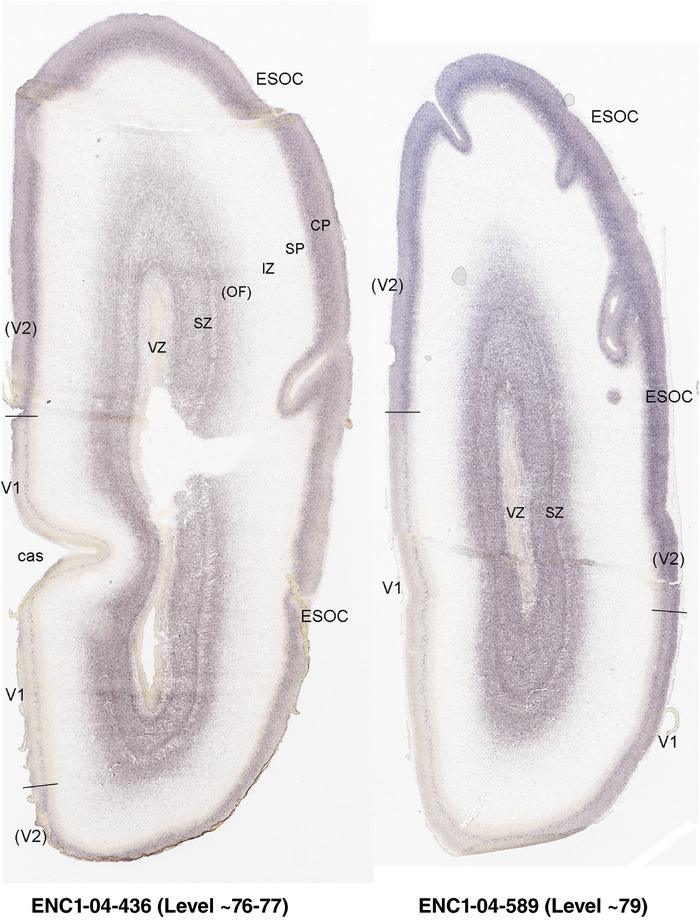
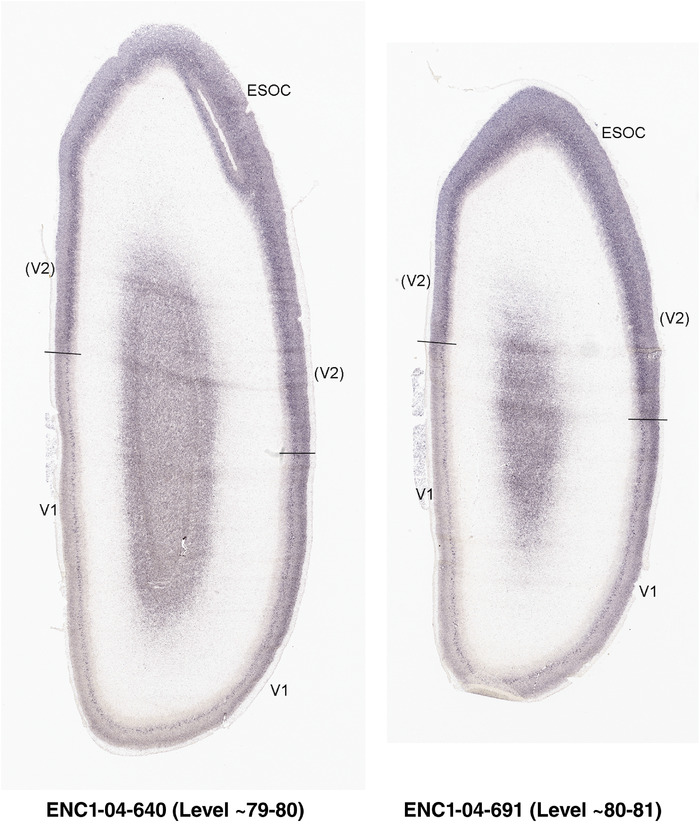
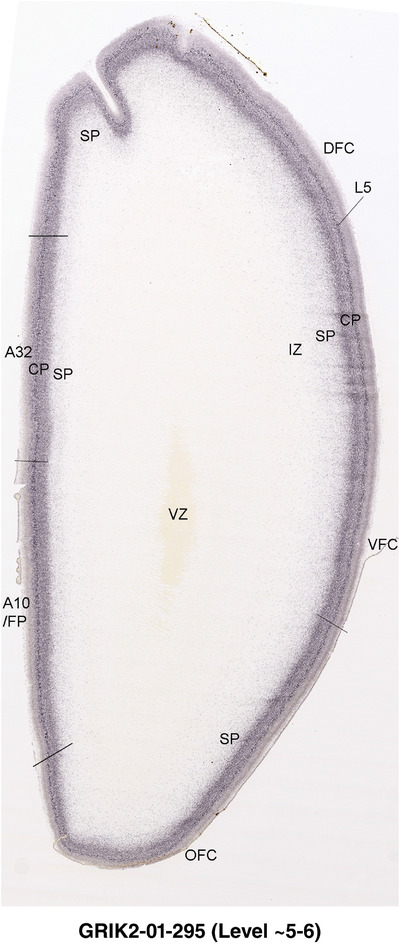
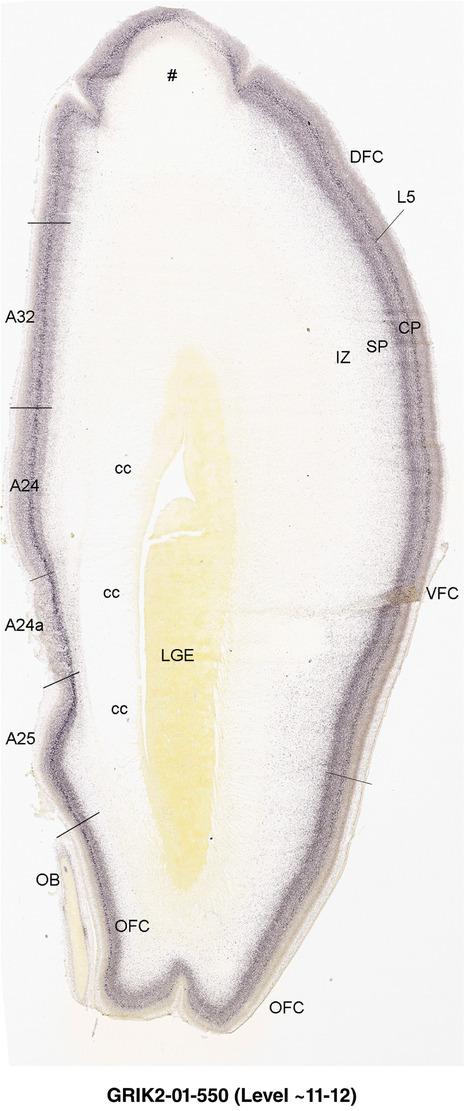
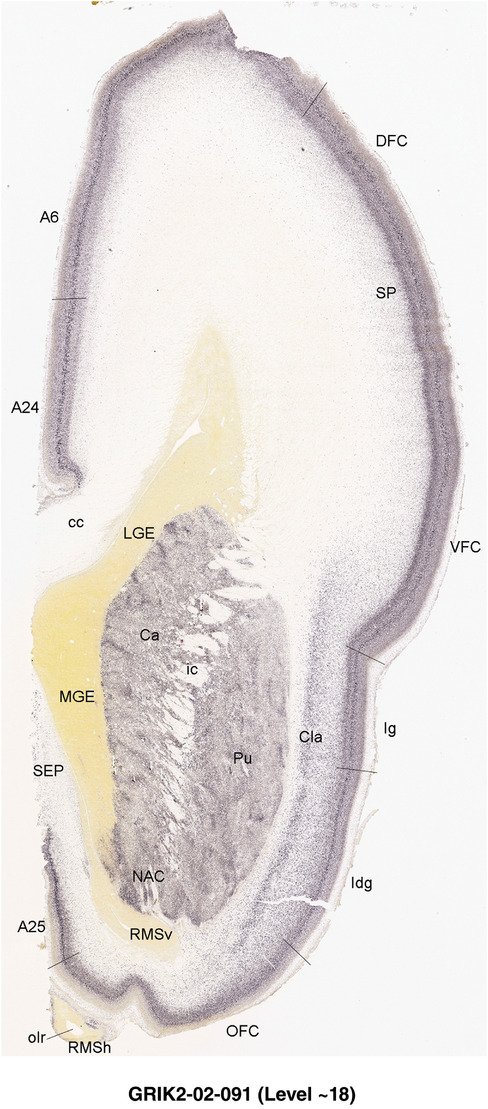
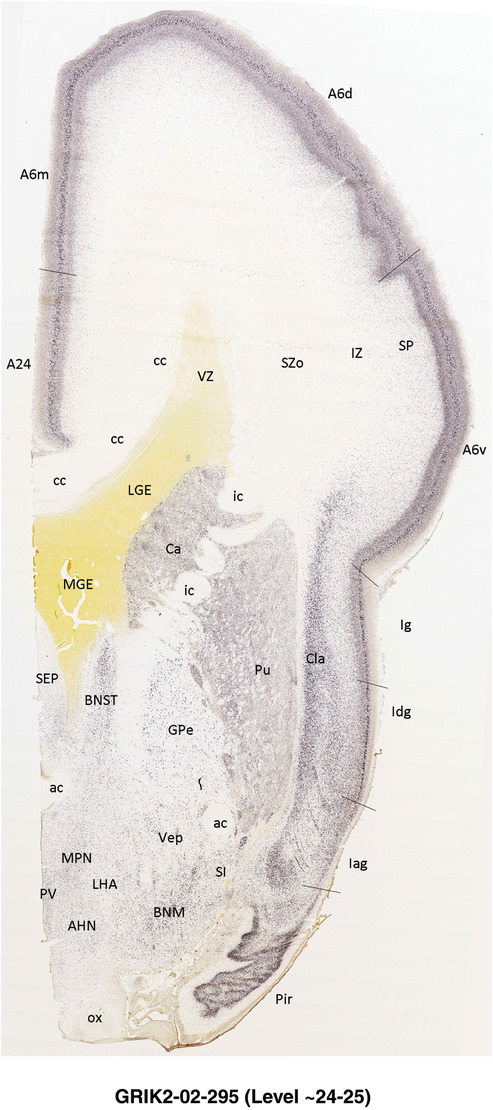
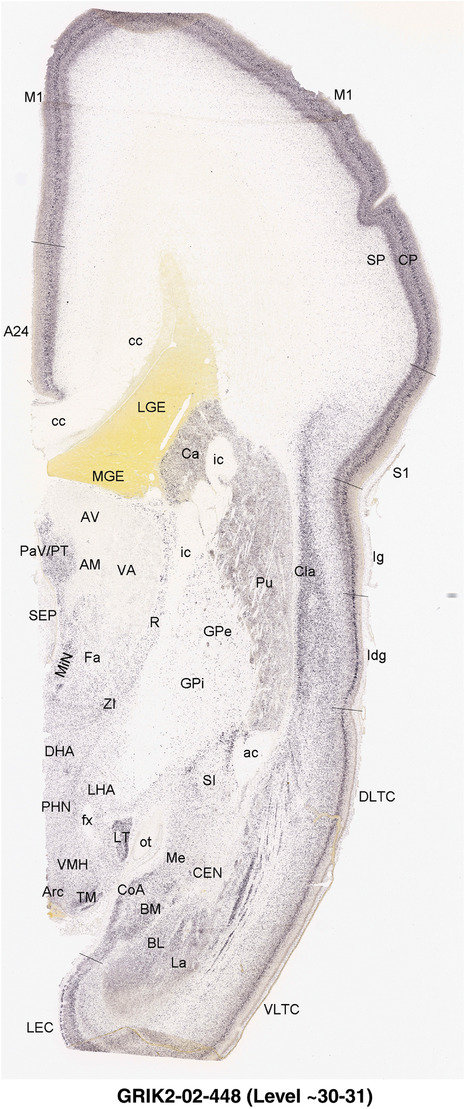
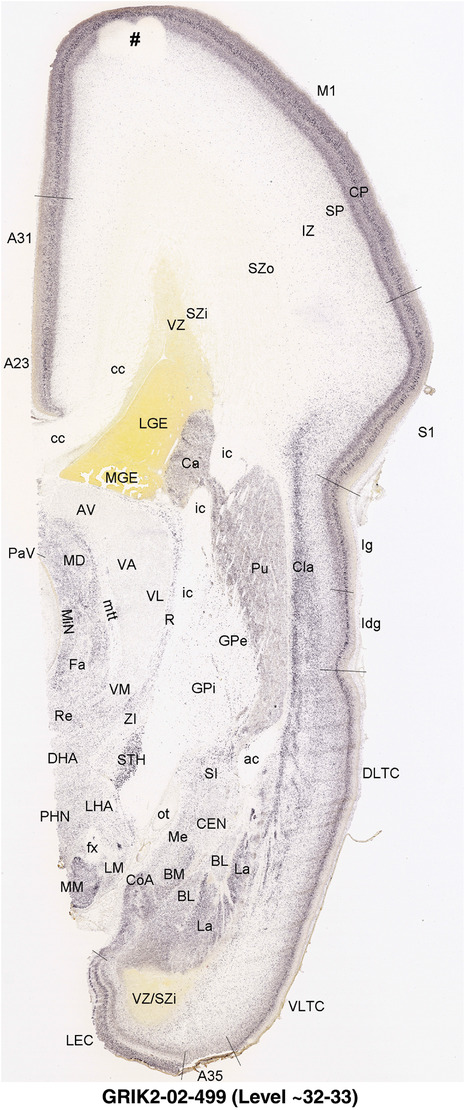
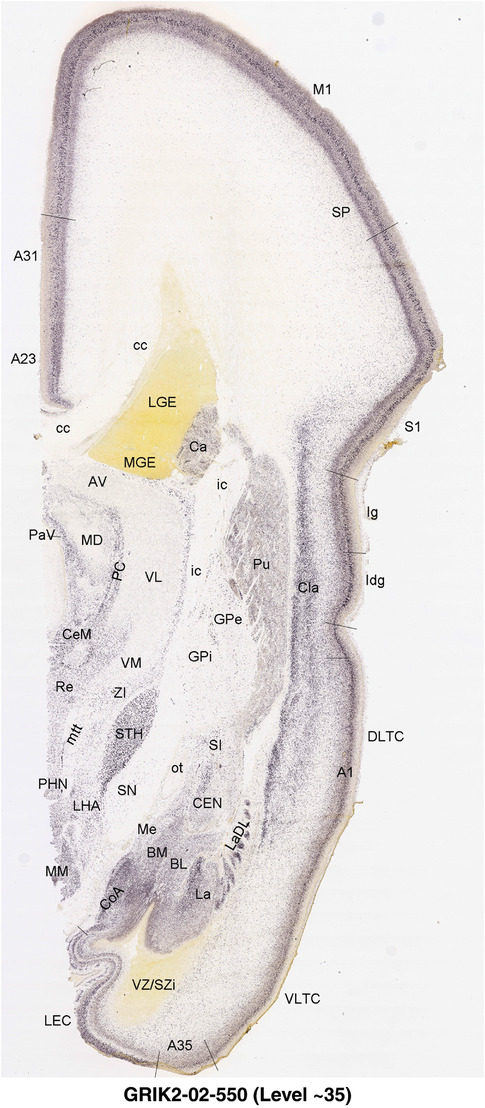
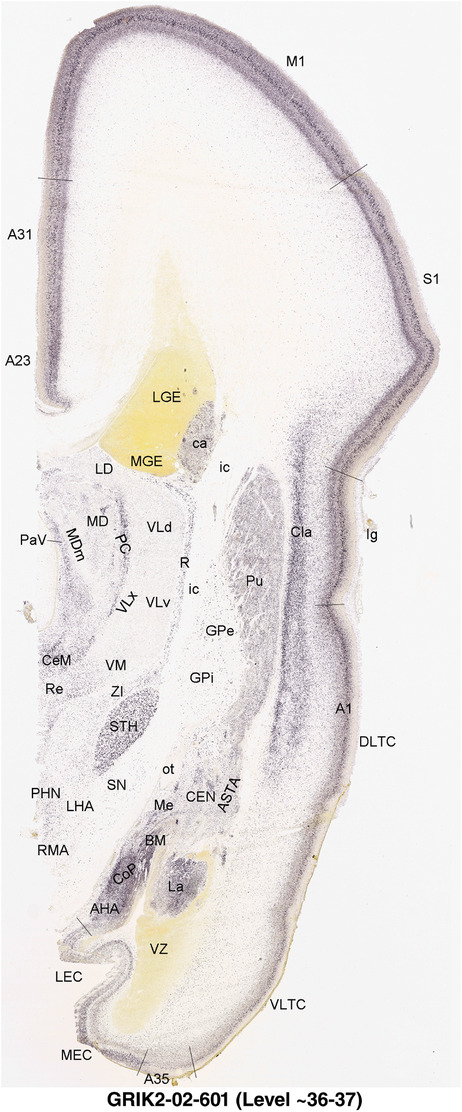
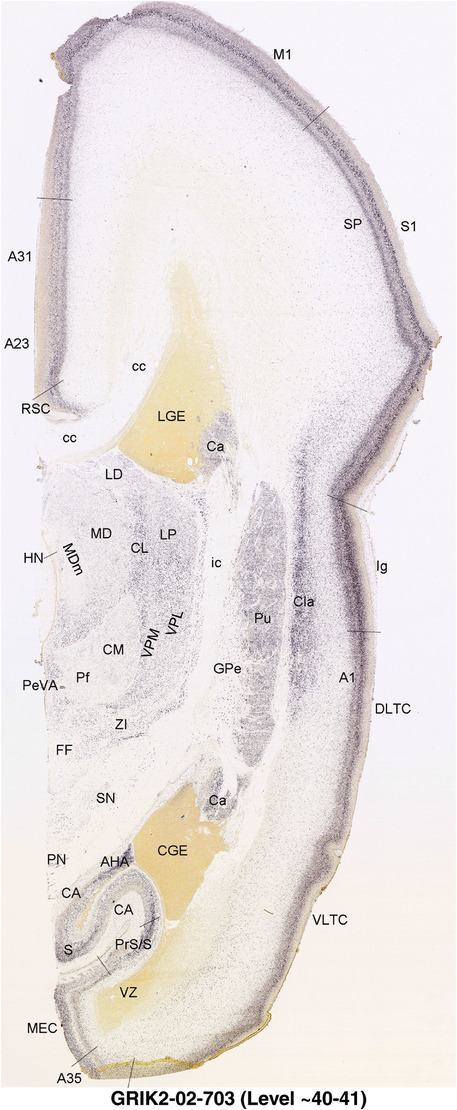
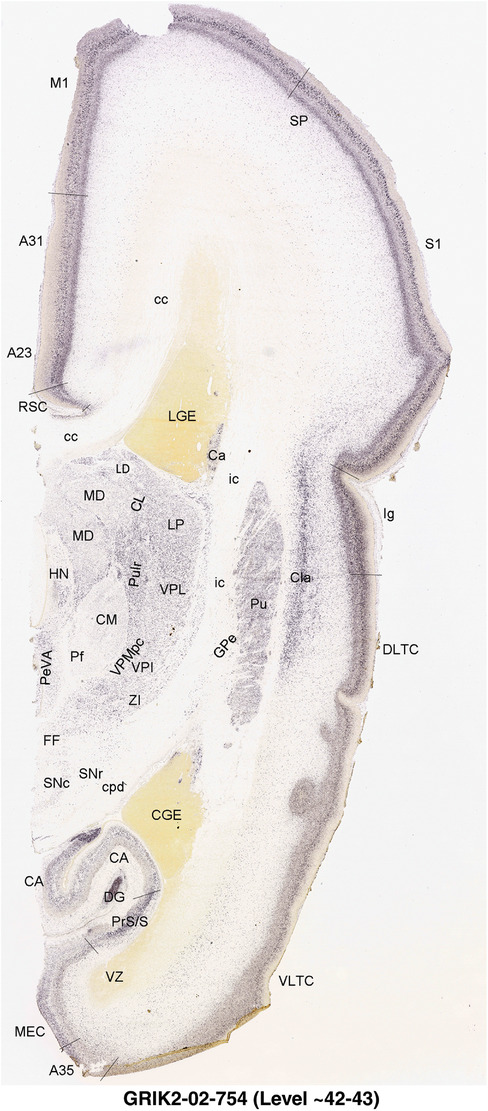
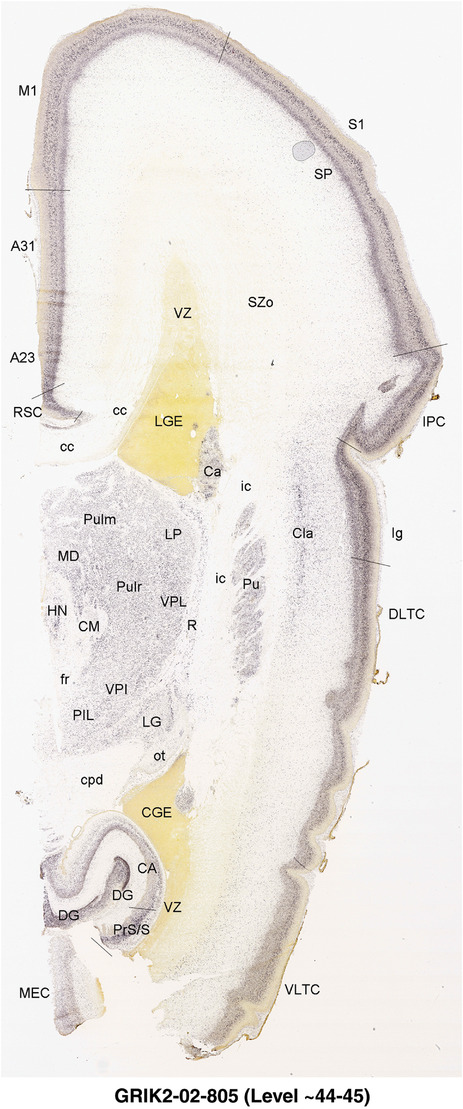
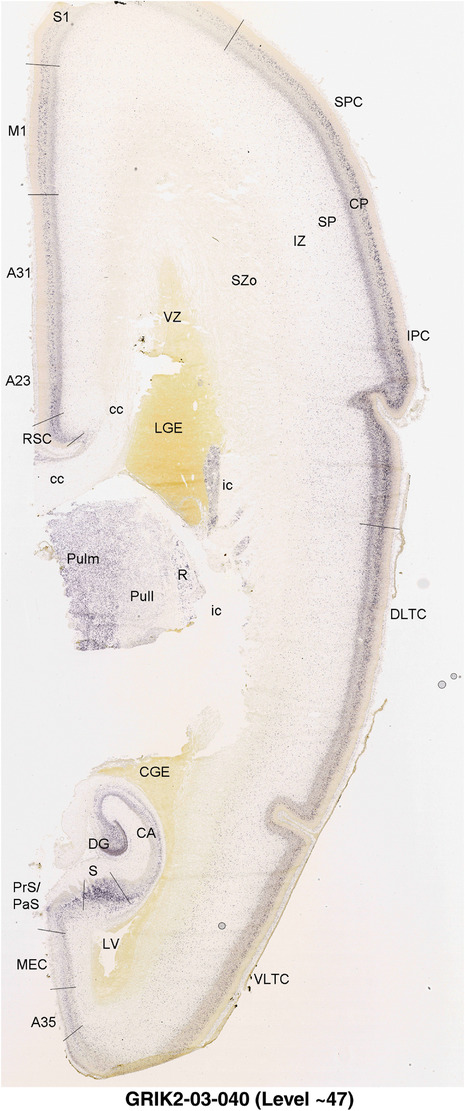
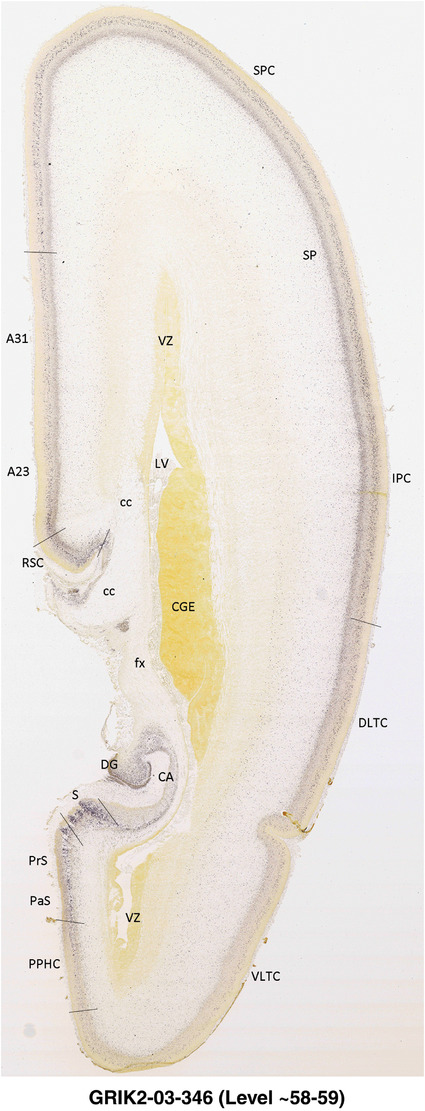
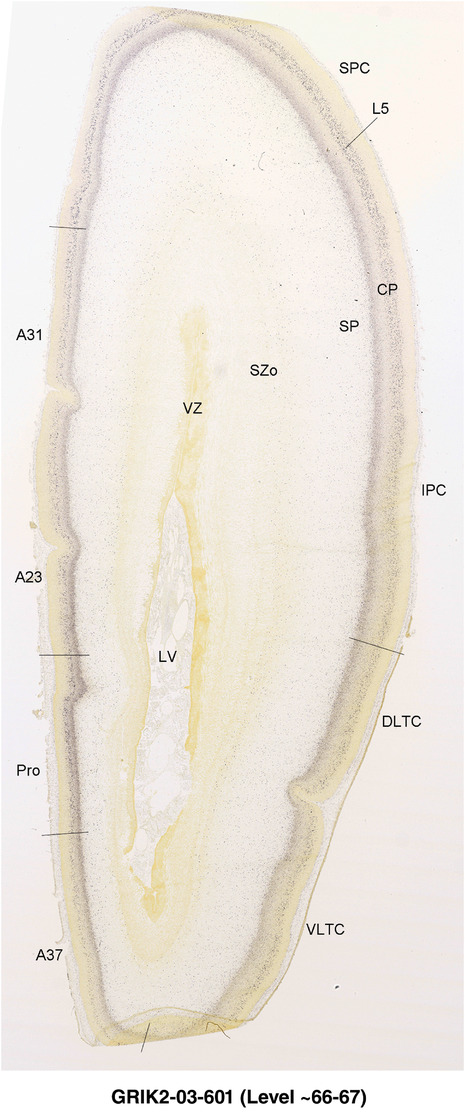
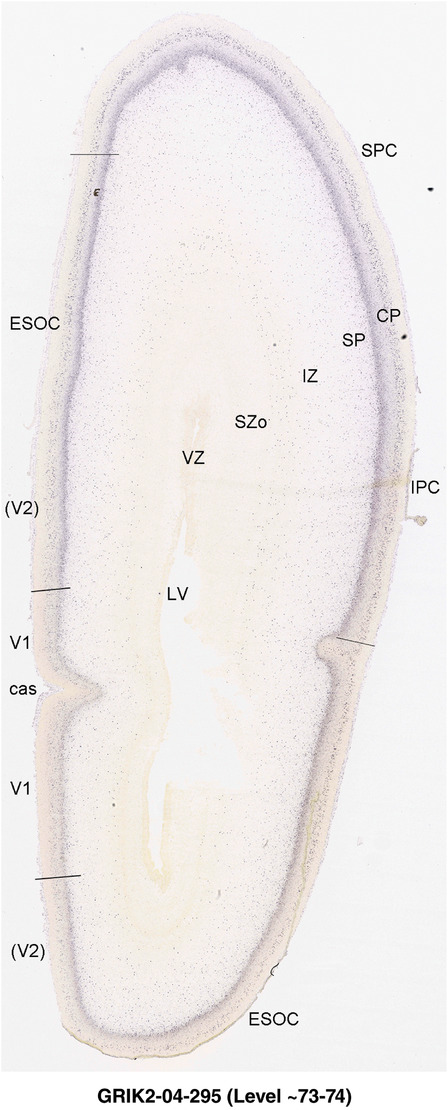
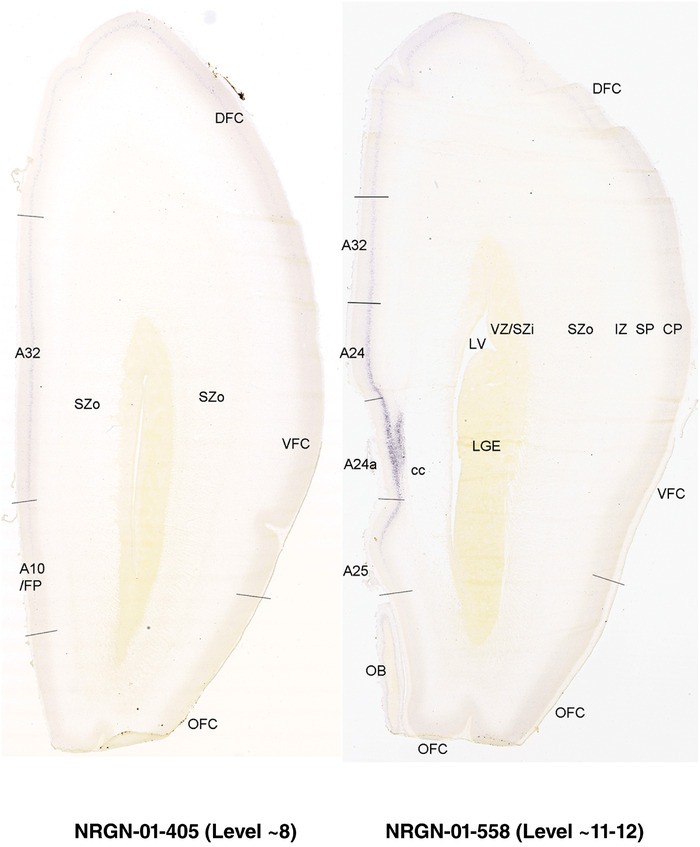
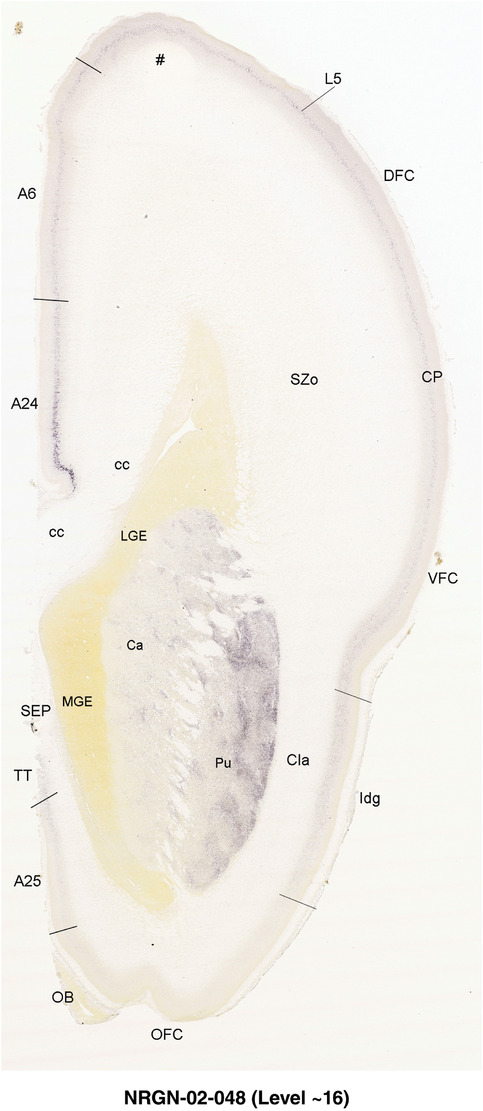
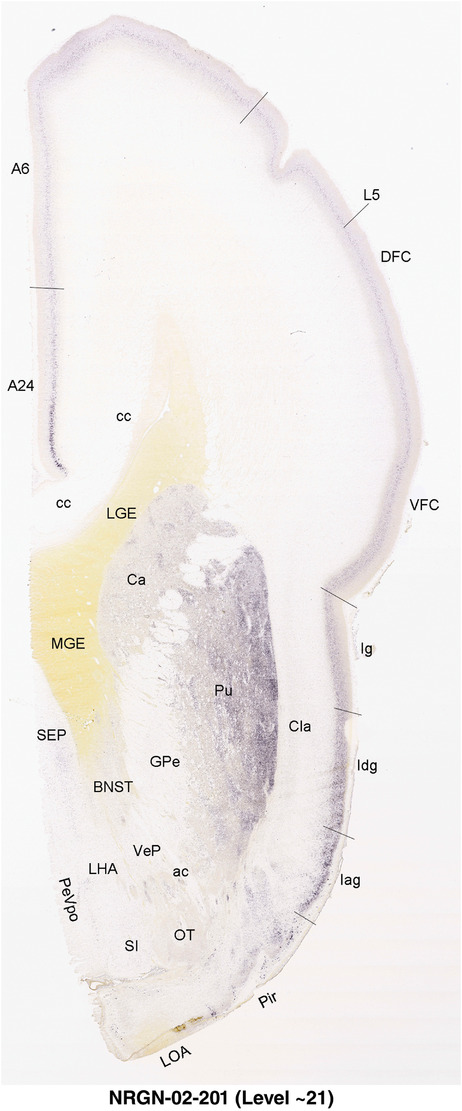
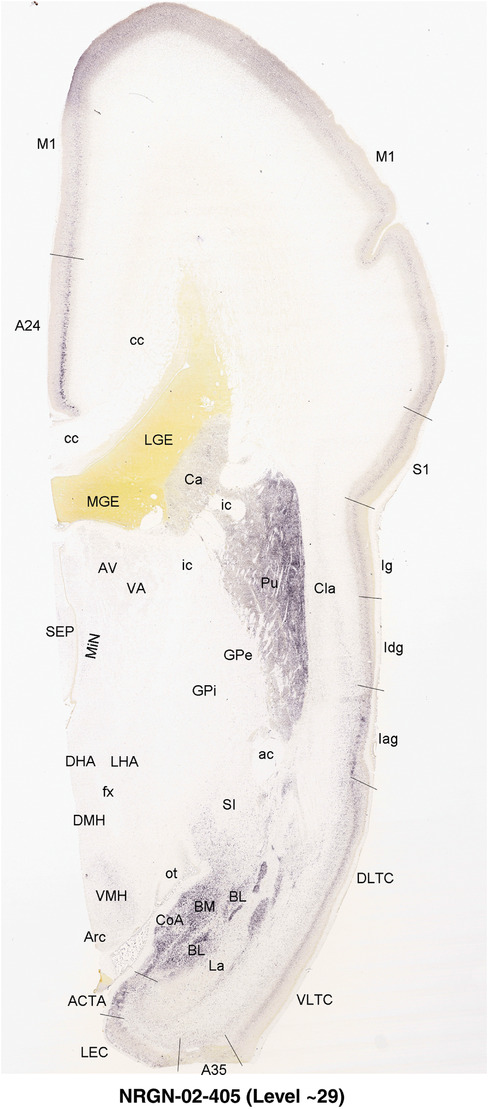
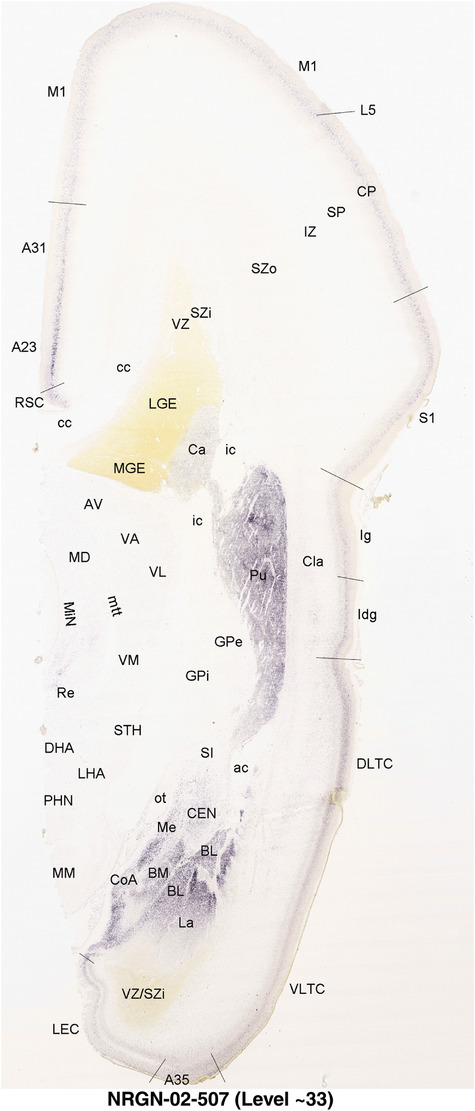
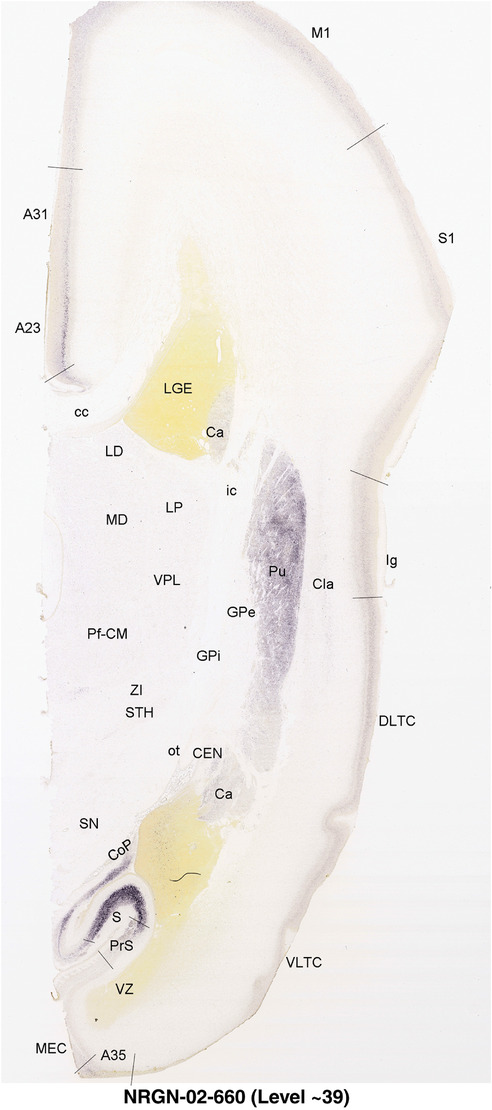
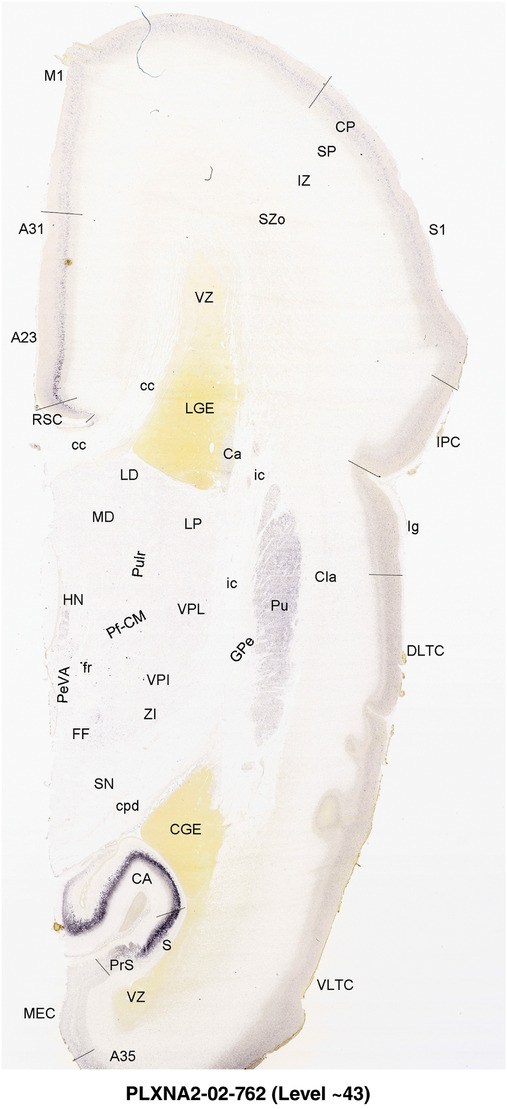
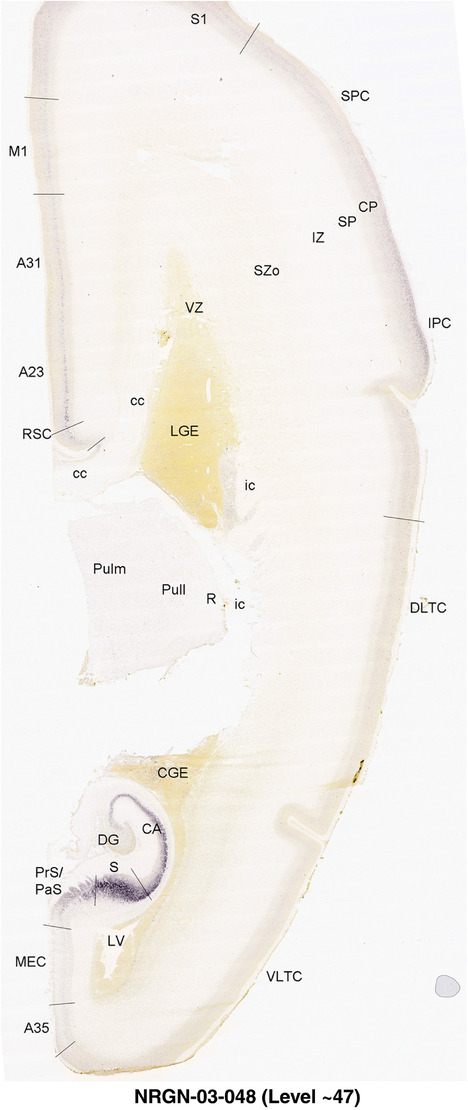
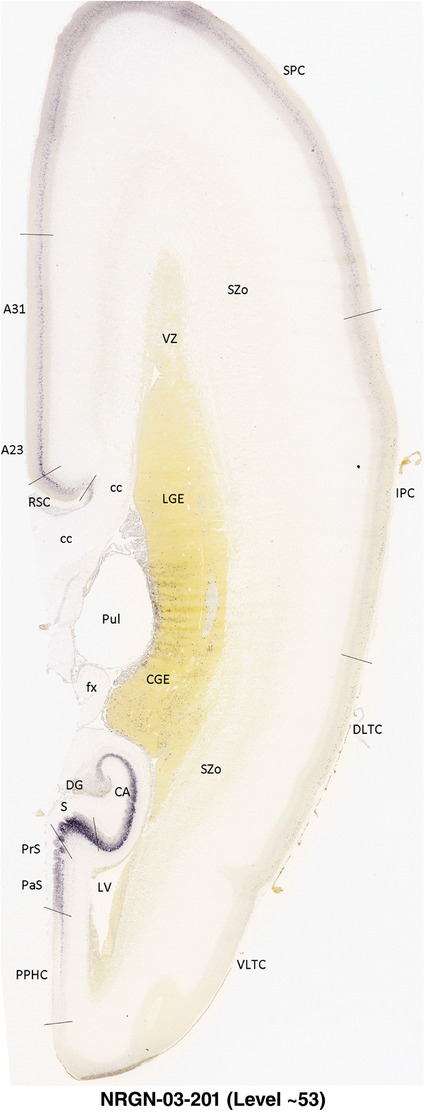
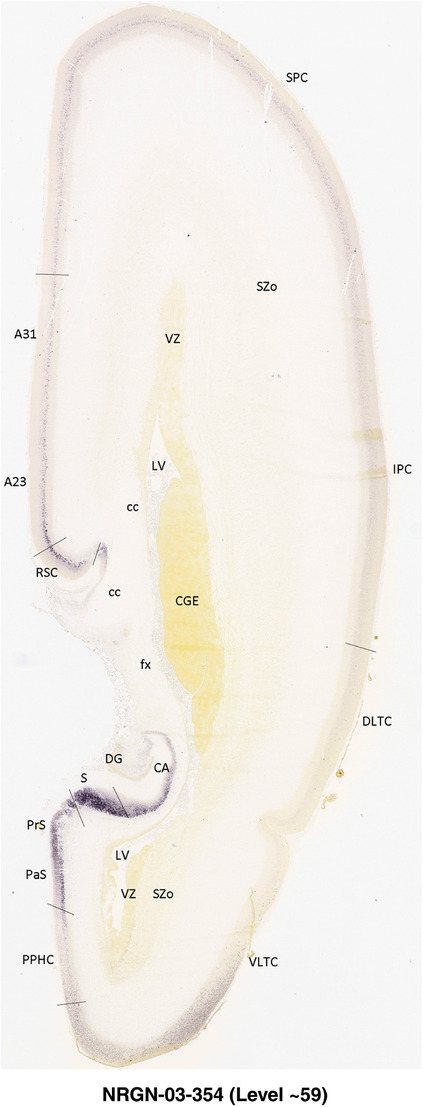
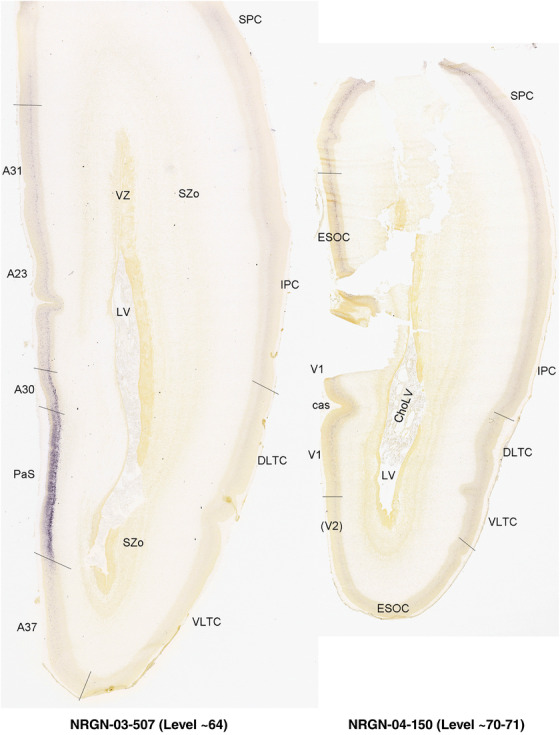
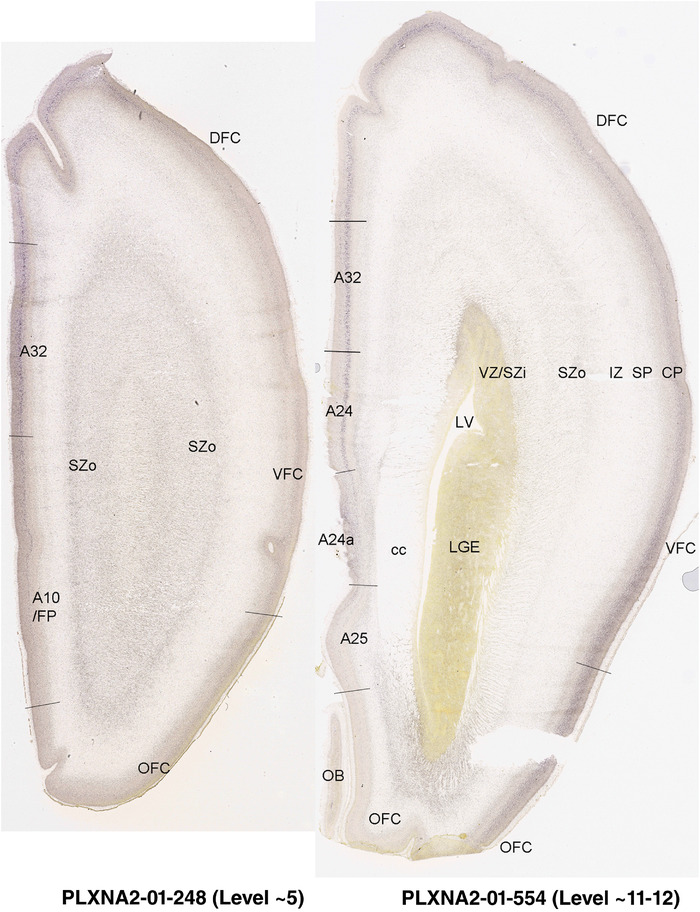
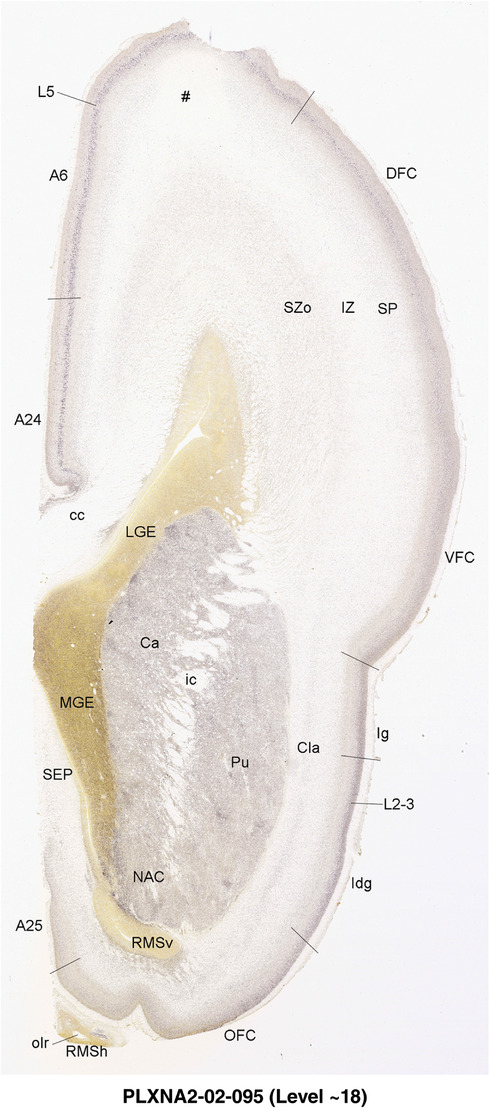
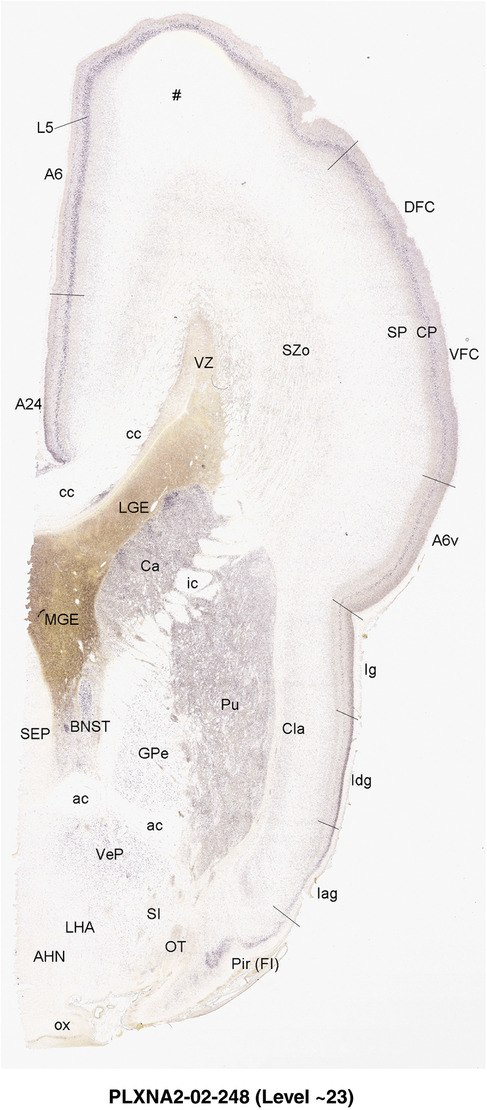
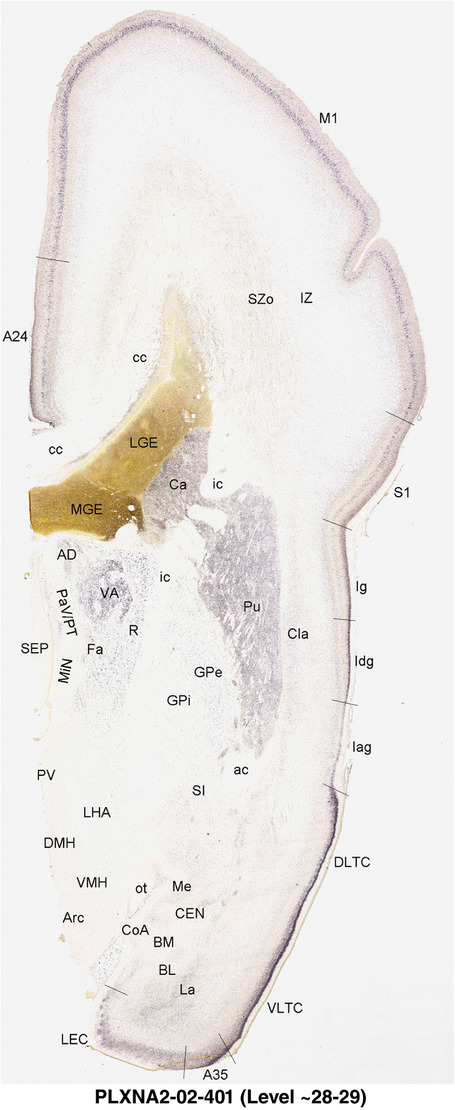
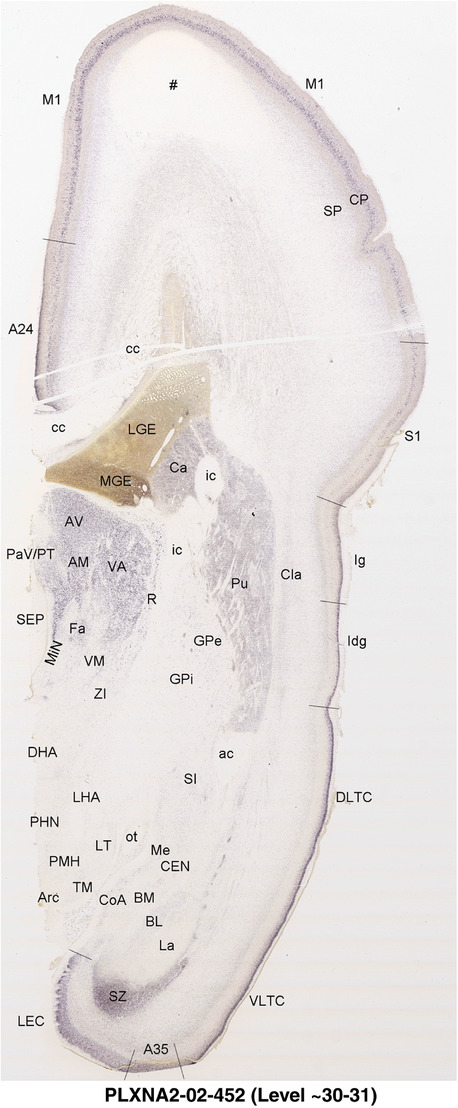
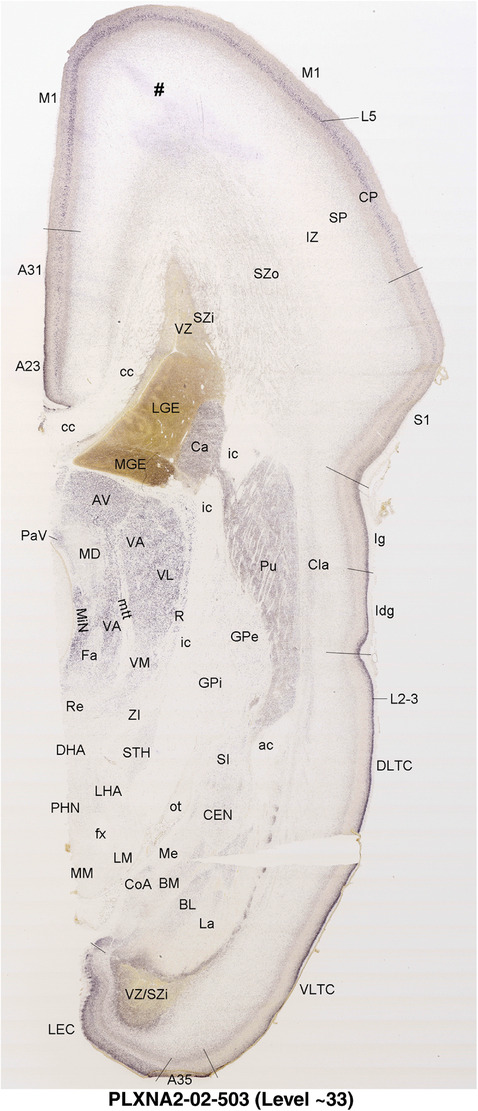
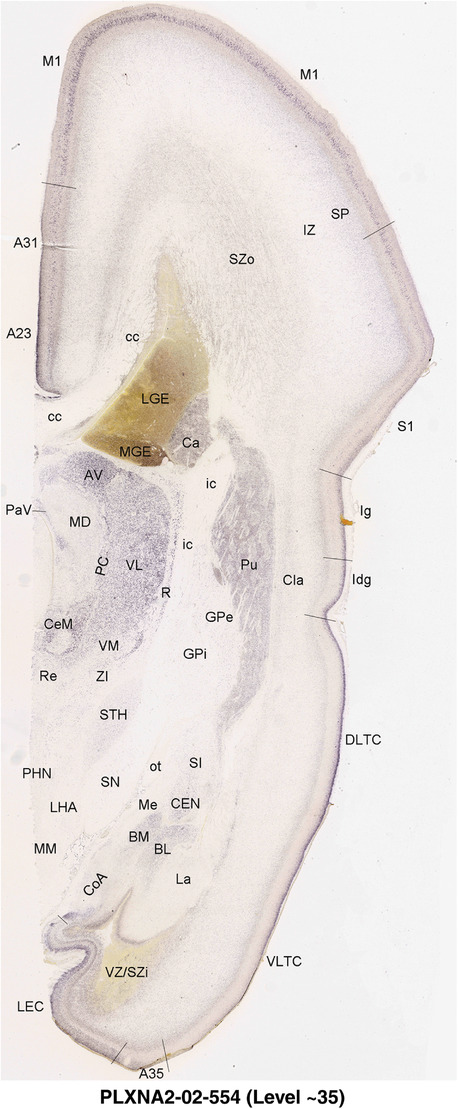
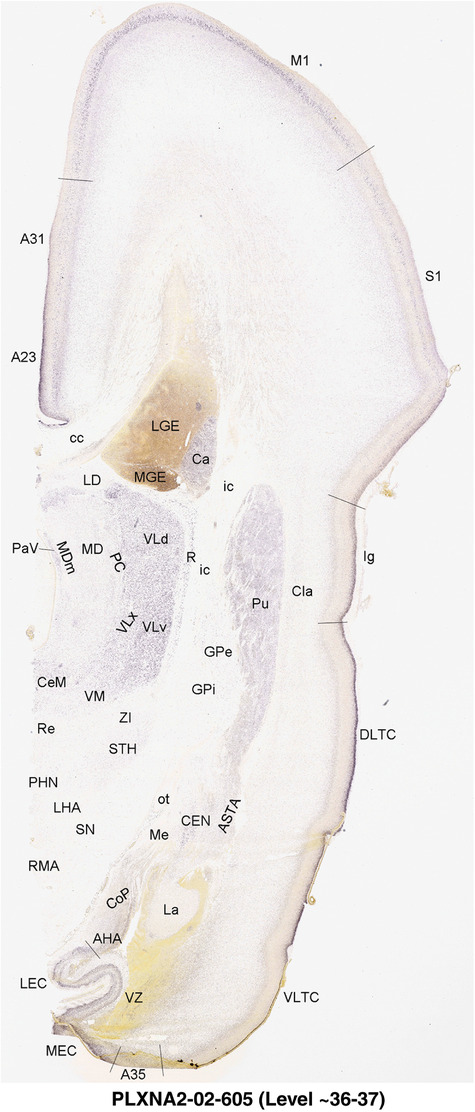
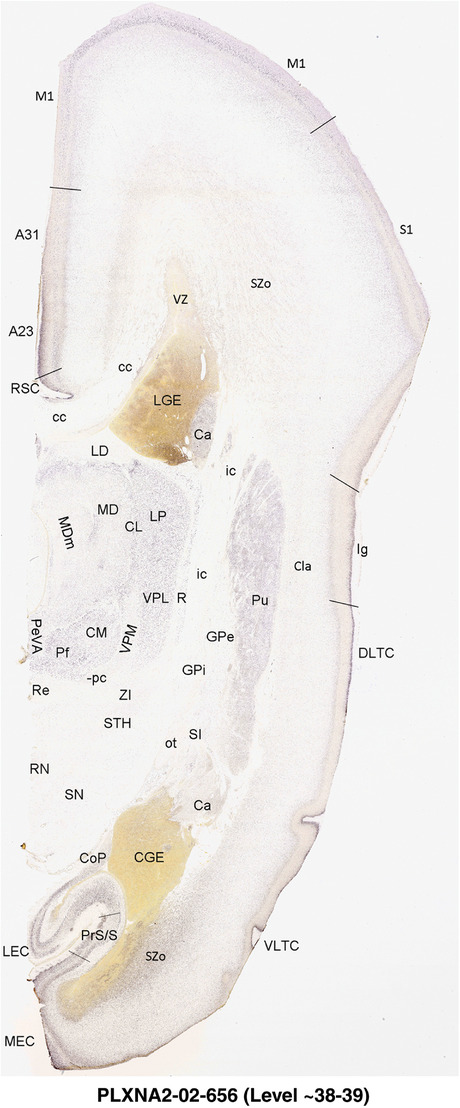
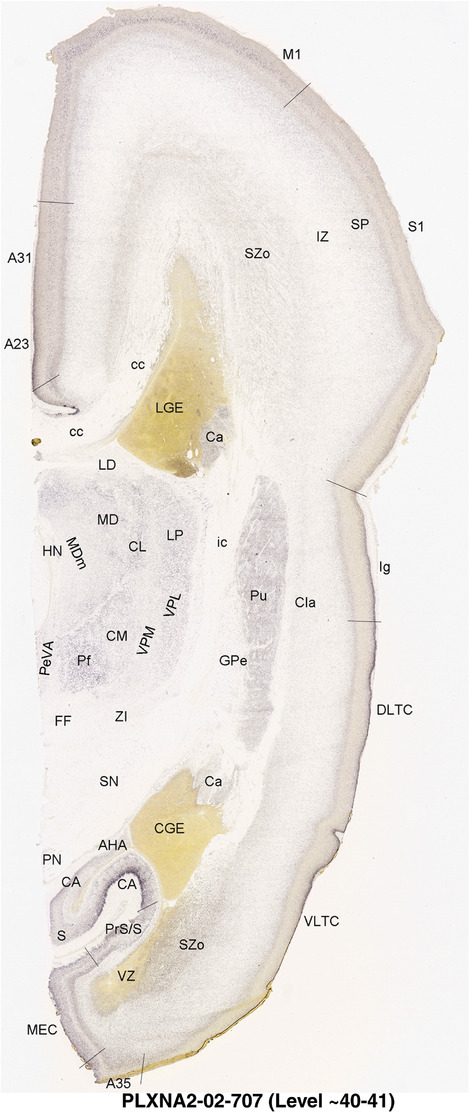
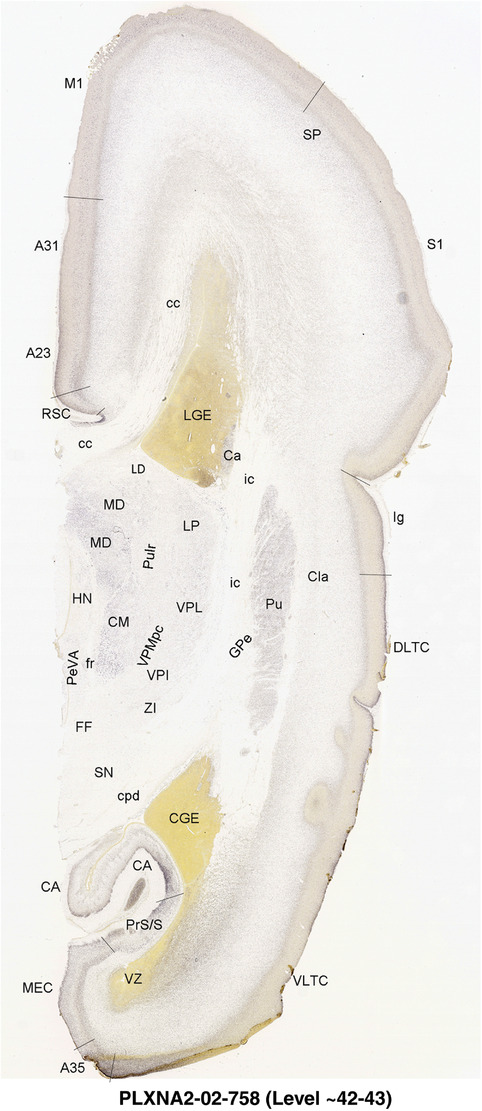
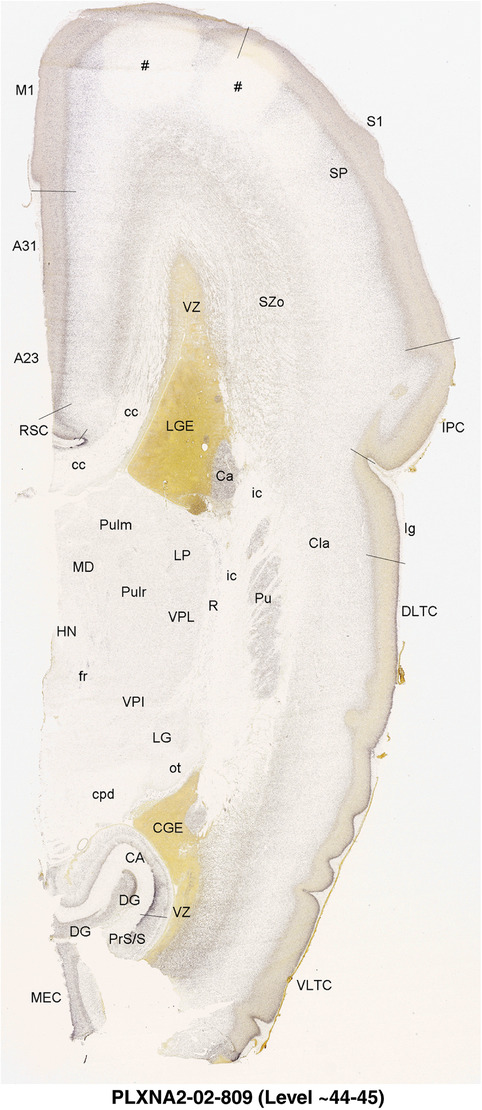
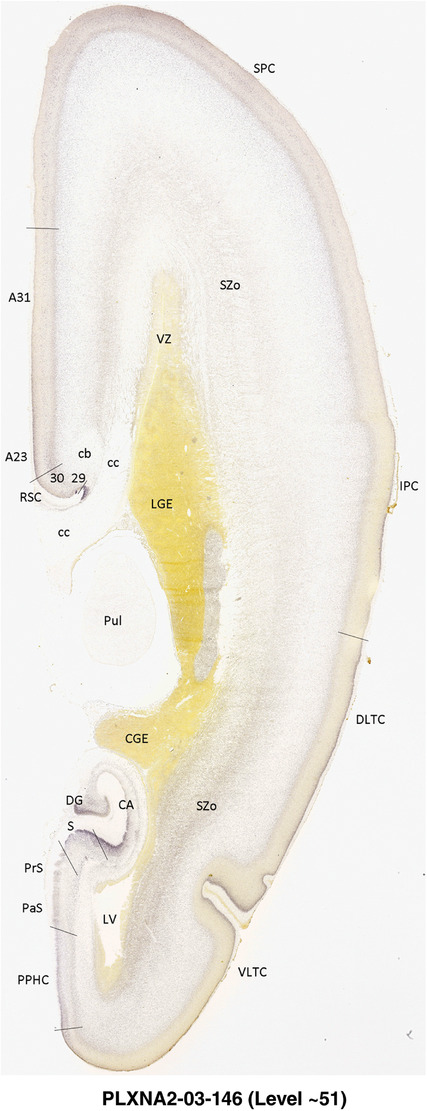
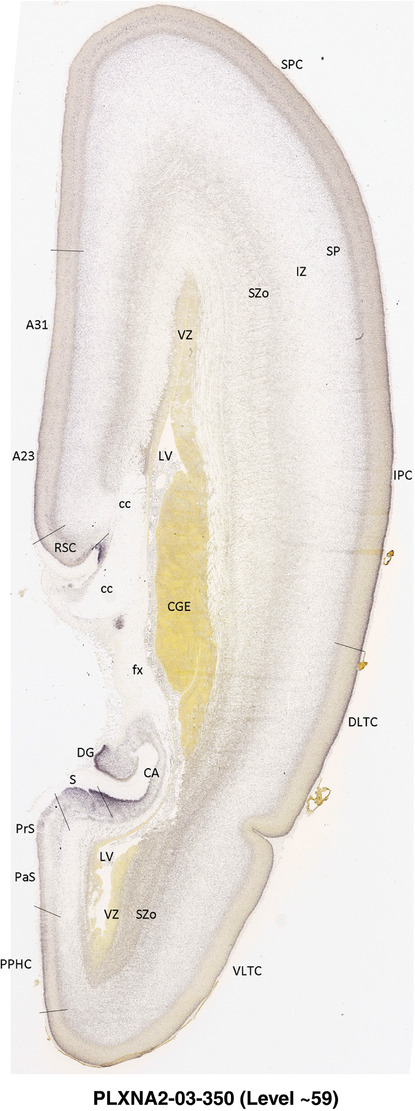
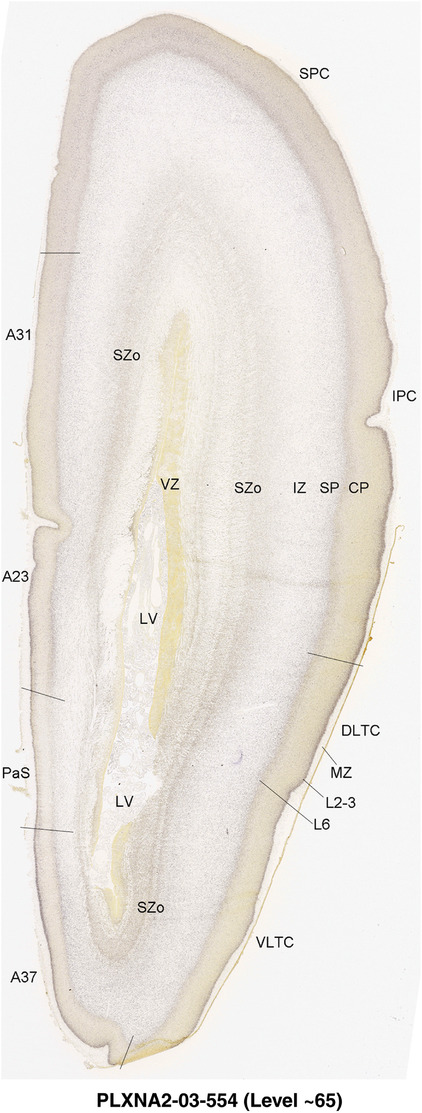
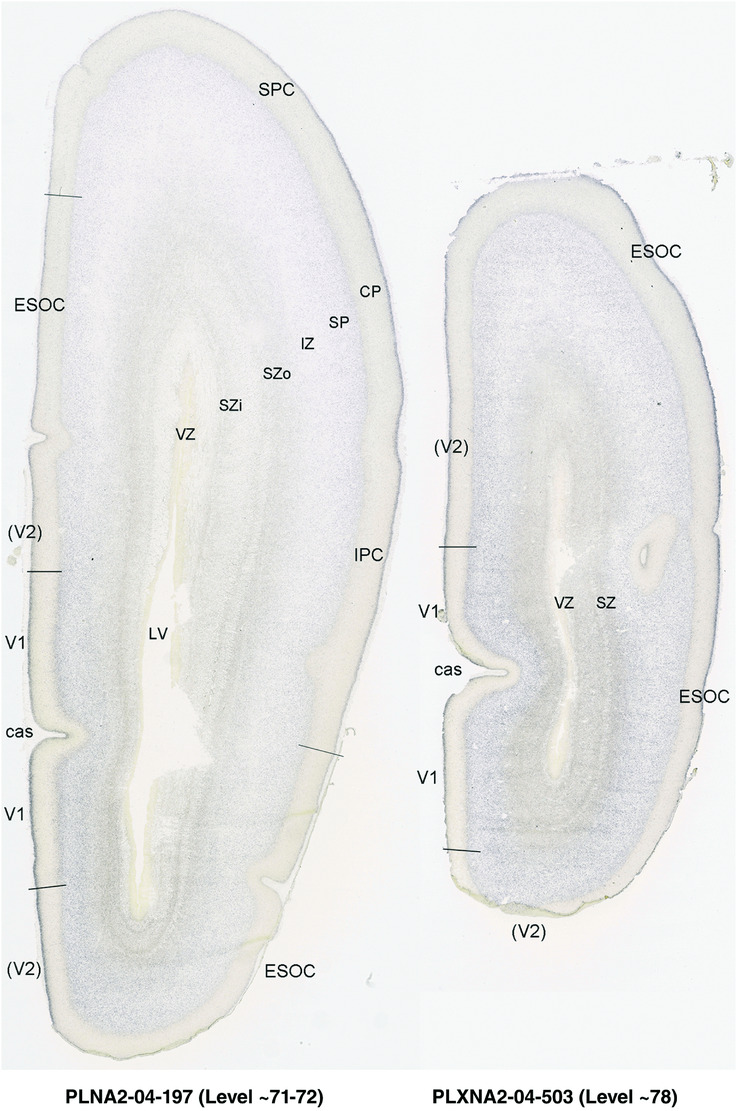
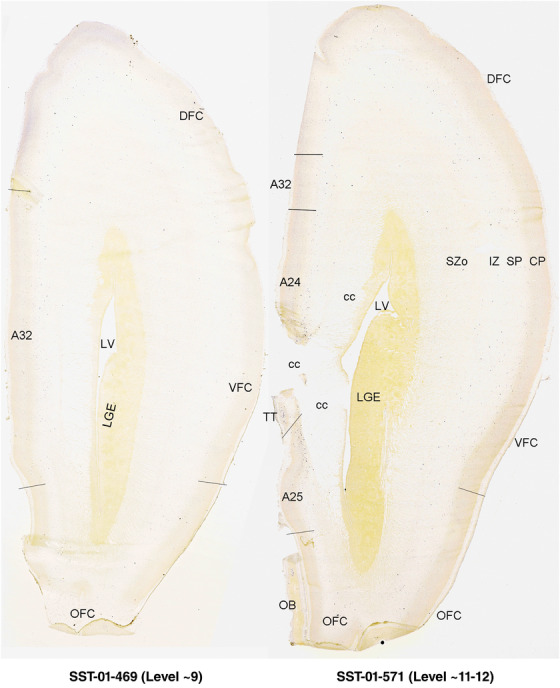
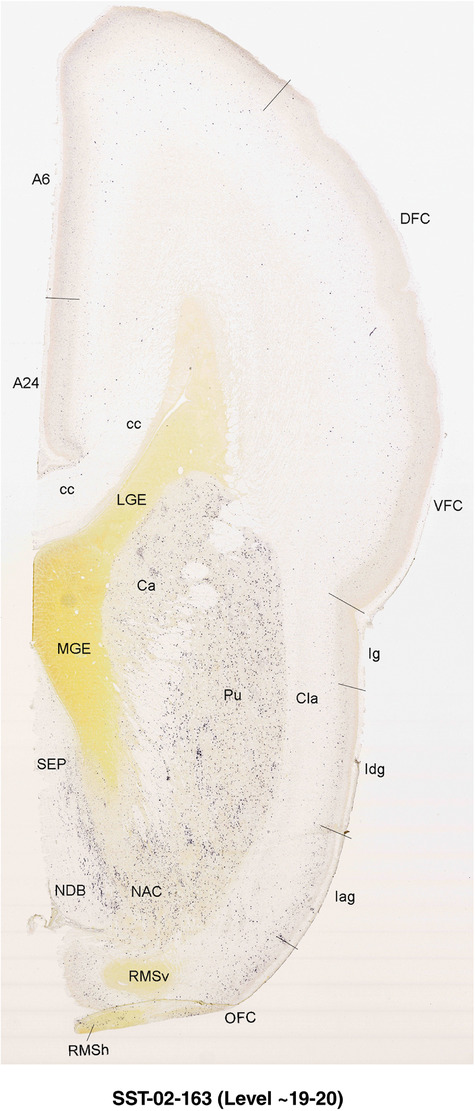
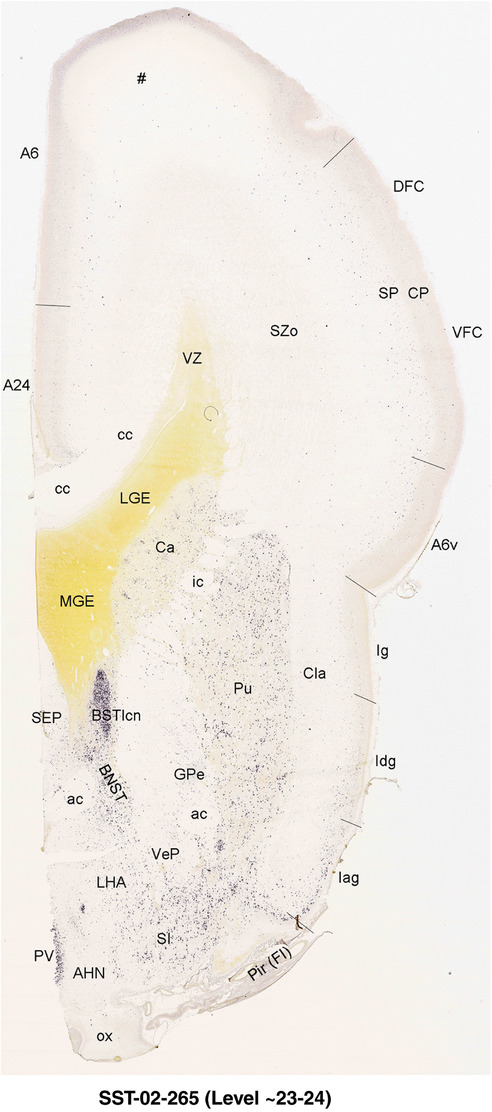
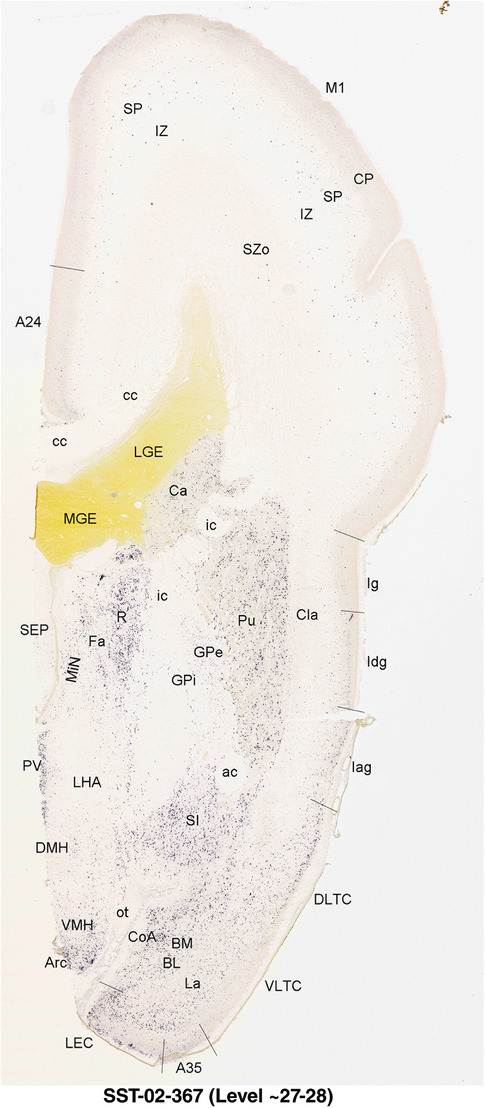
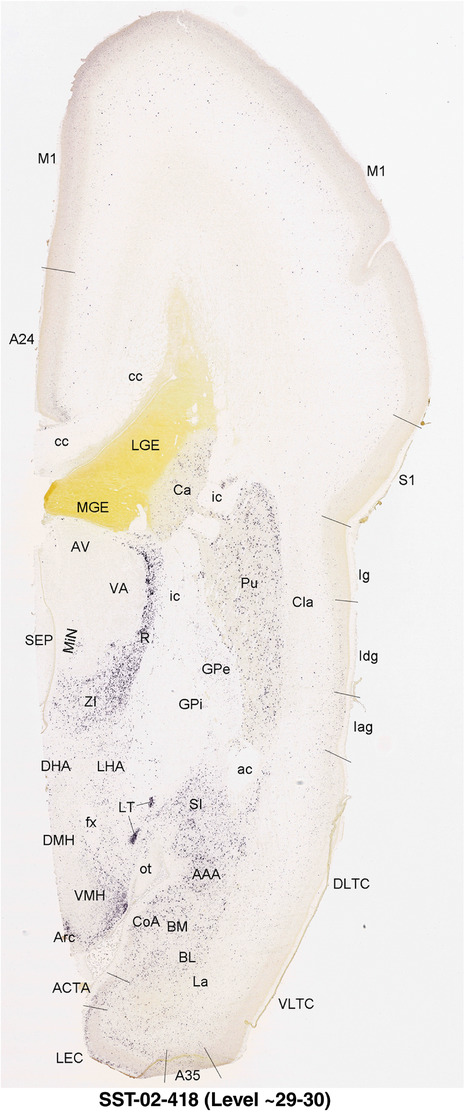
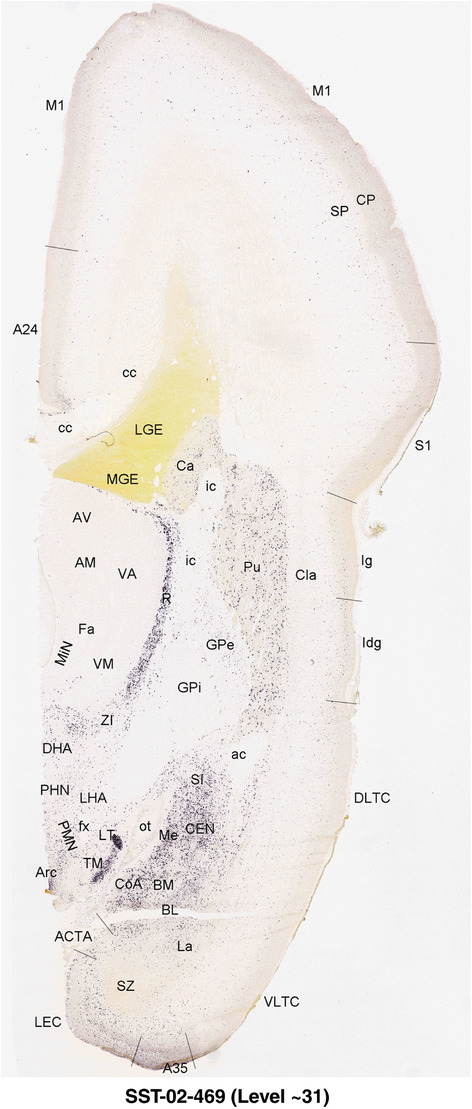
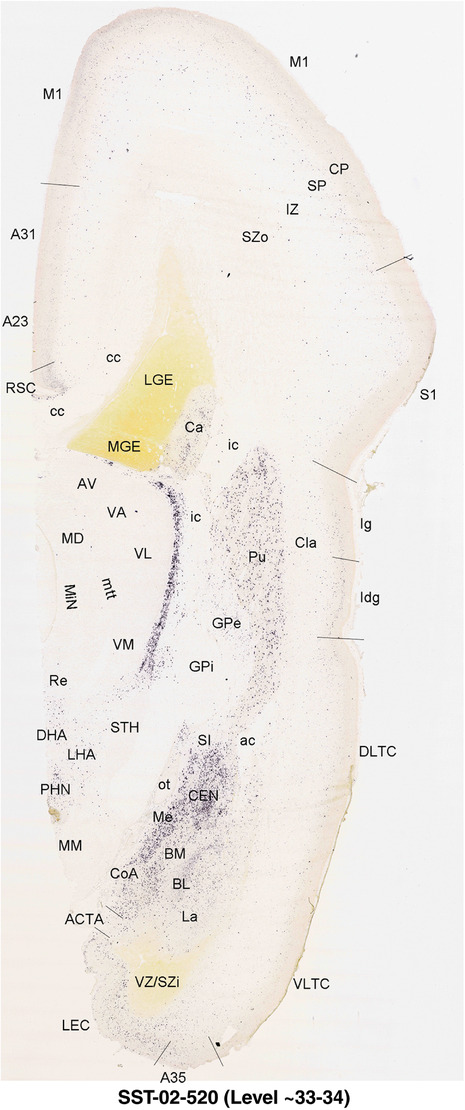
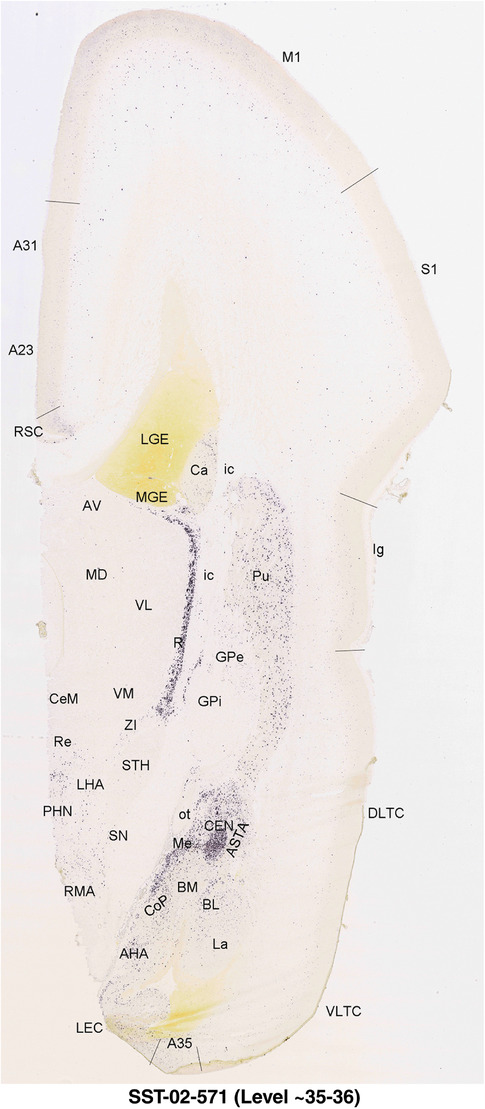
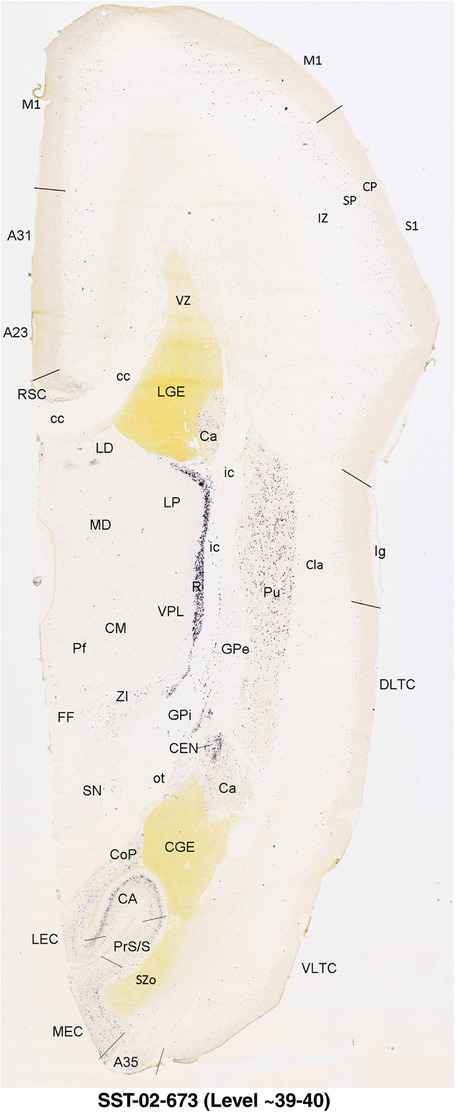
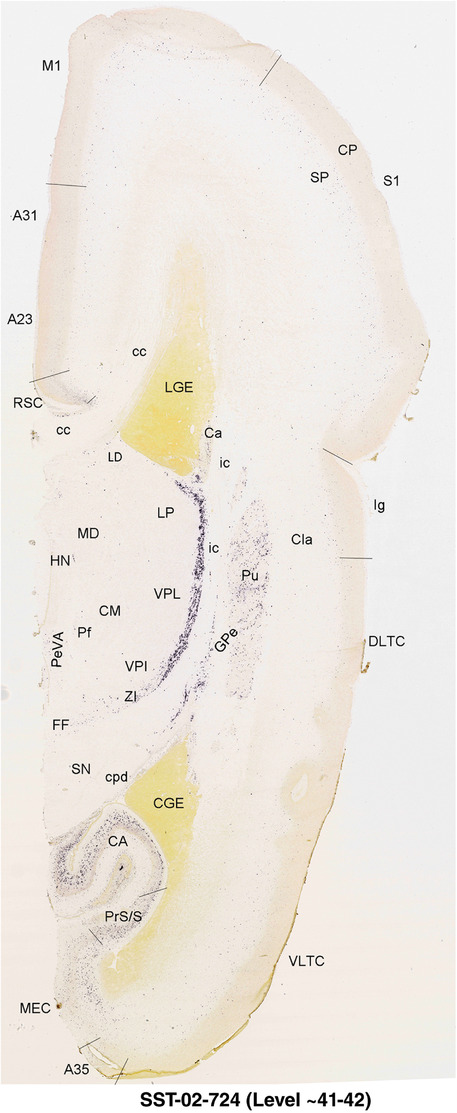
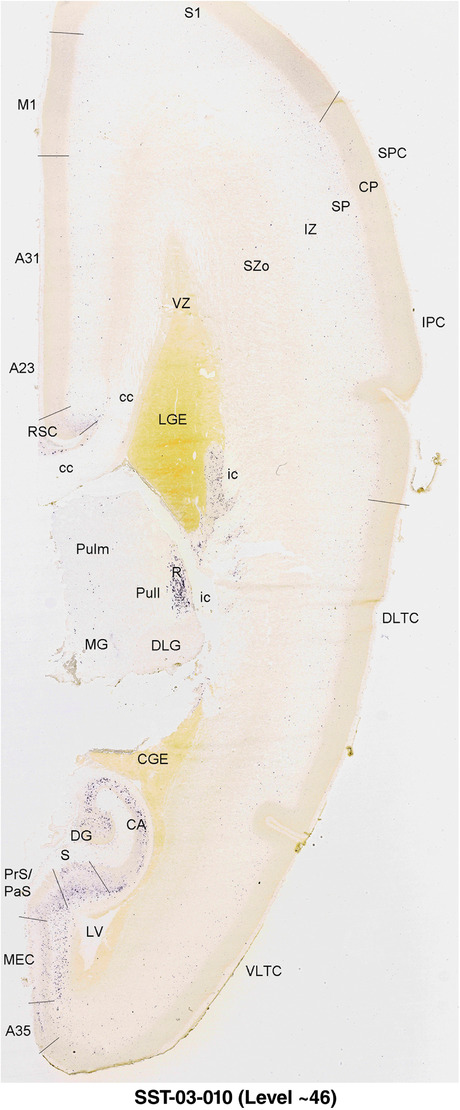
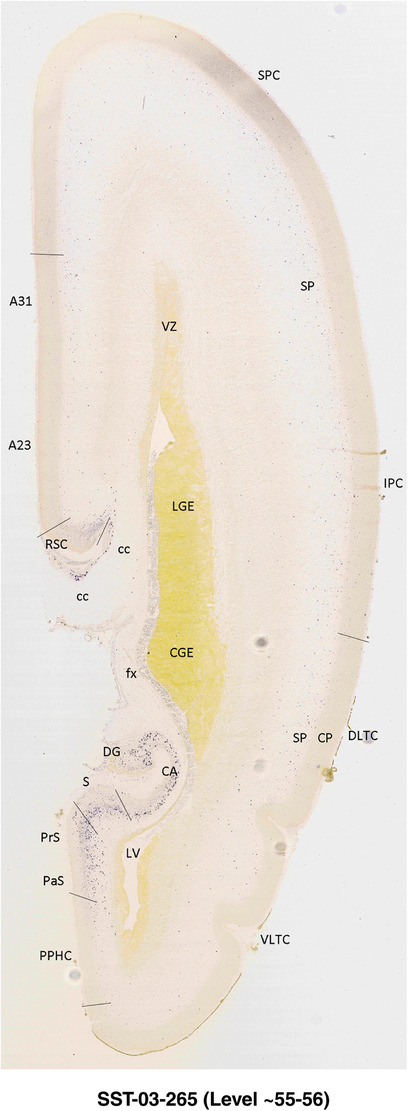
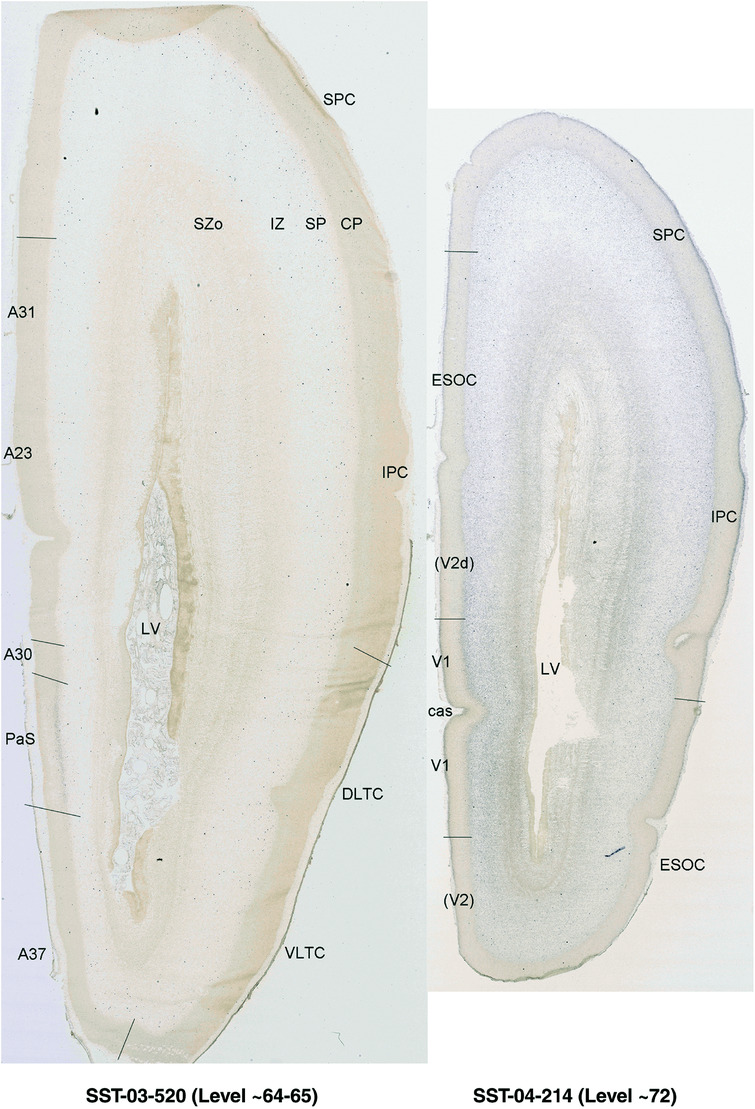
Ding, S.‐L. , Royall, J. J. , Lesnar, P. , Facer, B. A. C. , Smith, K. A. , Wei, Y. , Brouner, K. , Dalley, R. A. , Dee, N. , Dolbeare, T. A. , Ebbert, A. , Glass, I. A. , Keller, N. H. , Lee, F. , Lemon, T. A. , Nyhus, J. , Pendergraft, J. , Reid, R. , Sarreal, M. , …, Lein, E. S. (2022). Cellular resolution anatomical and molecular atlases for prenatal human brains. Journal of Comparative Neurology, 530(1), 6–503. 10.1002/cne.25243
Contributor Information
Song‐Lin Ding, Email: songd@alleninstitute.org.
Ed S. Lein, Email: EdL@alleninstitute.org.
DATA AVAILABILITY STATEMENT
The data that support the findings and atlas creation of this study are available online (www.brain‐map.org or www.brainspan.org), and available from the corresponding authors upon reasonable request.
REFERENCES
- Alzu'bi, A. , Lindsay, S. J. , Harkin, L. F. , McIntyre, J. , Lisgo, S. N. , & Clowry, G. J. (2017). The transcription factors COUP‐TFI and COUP‐TFII have distinct roles in arealisation and GABAergic interneuron specification in the early human fetal telencephalon. Cerebral Cortex, 27(10): 4971–4987. [DOI] [PMC free article] [PubMed] [Google Scholar]
- Alzu'bi, A. , Lindsay, S. , Kerwin, J. , Looi, S. J. , Khalil, F. , & Clowry, G. J. (2017). Distinct cortical and sub‐cortical neurogenic domains for GABAergic interneuron precursor transcription factors NKX2.1, OLIG2 and COUP‐TFII in early fetal human telencephalon. Brain Structure and Function, 222, 2309–2328. [DOI] [PMC free article] [PubMed] [Google Scholar]
- Alzu'bi, A. , & Clowry, G. J. (2019). Expression of ventral telencephalon transcription factors ASCL1 and DLX2 in the early fetal human cerebral cortex. Journal of Anatomy, 235 (3), 555–568. [DOI] [PMC free article] [PubMed] [Google Scholar]
- Arnold, S. E. , Hyman, B. T. , Flory, J. , Damasio, A. R. , & Van Hoesen, G. W. (1991). The topographical and neuroanatomical distribution of neurofibrillary tangles and neuritic plaques in the cerebral cortex of patients with Alzheimer's disease. Cerebral Cortex, 1, 103–116. [DOI] [PubMed] [Google Scholar]
- Bakken, T. E. , Miller, J. A. , Ding, S. L. , Sunkin, S. M. , Smith, K. A. , Ng, L. , Szafer, A. , Dalley, R. A. , Royall, J. J. , Lemon, T. , Shapouri, S. , Aiona, K. , Arnold, J. , Bennett, J. L. , Bertagnolli, D. , Bickley, K. , Boe, A. , Brouner, K. , Butler, S. , …, Lein, E. S. (2016). A comprehensive transcriptional map of primate brain development. Nature, 535(7612), 367–375. [DOI] [PMC free article] [PubMed] [Google Scholar]
- Bayer, S. A. , & Altman, J. (2003). Atlas of human central nervous system development. Volume 2: The human brain during the third trimester. CRC Press. [Google Scholar]
- Bayer, S. A. , & Altman, J. (2005). Atlas of human central nervous system development. Volume 3: The human brain during the second trimester. CRC Press. [Google Scholar]
- Bayer, S. A. , & Altman, J. (2006). Atlas of human central nervous system development. Volume 4: The human brain during the late first trimester. CRC Press. [Google Scholar]
- Bandler, R. C. , Mayer, C. , & Fishell, G. (2017). Cortical interneuron specification: the juncture of genes, time and geometry. Current Opinion of Neurobiology, 42, 17–24. [DOI] [PMC free article] [PubMed] [Google Scholar]
- Berg, J. , Sorensen, S. A. , Ting, J. T. , Miller, J. A. , Chartrand, T. , Buchin, A. , Bakken, T. E. , Budzillo, A. , Dee, N. , Ding, S. L. , Gouwens, N. W. , Hodge, R. D. , Kalmbach, B. , Lee, C. , Lee, B. R. , Alfiler, L. , Baker, K. , Barkan, E. , Beller, A. , …, Lein, E. S. (2021). Human cortical expansion involves diversification and specialization of supragranular intratelencephalic‐projecting neurons. Nature, 598(7879):151–158. [DOI] [PMC free article] [PubMed] [Google Scholar]
- BICCN (Brain Initiative Cell Census Network) . (2021). A multimodal cell census and atlas of the mammalian primary motor cortex. Nature, 598(7879):86–102. [DOI] [PMC free article] [PubMed] [Google Scholar]
- Braak, H. , & Braak, E. (1991). Neuropathological stageing of Alzheimer‐related changes. Acta Neuropathologica, 82, 239–259. [DOI] [PubMed] [Google Scholar]
- Brill, M. S. , Ninkovic, J. , Winpenny, E. , Hodge, R. D. , Ozen, I. , Yang, R. , Lepier, A. , Gascón, S. , Erdelyi, F. , Szabo, G. , Parras, C. , Guillemot, F. , Frotscher, M. , Berninger, B. , Hevner, R. F. , Raineteau, O. , & Götz, M. (2009). Adult generation of glutamatergic olfactory bulb interneurons. Nature Neuroscience, 12(12), 1524–1533. [DOI] [PMC free article] [PubMed] [Google Scholar]
- Carney, R. S. E. , Cocas, L. A. , Hirata, T. , Mansfield, K. , Joshua, G. , & Corbin, J. G. (2009). Differential regulation of telencephalic pallial–subpallial boundary patterning by Pax6 and Gsh2 . Cerebral Cortex, 19(4), 745–759. [DOI] [PMC free article] [PubMed] [Google Scholar]
- Ding, S. L. (2013). Comparative anatomy of the prosubiculum, subiculum, presubiculum, postsubiculum, and parasubiculum in human, monkey, and rodent. Journal of Comparative Neurology, 521, 4145–4162. [DOI] [PubMed] [Google Scholar]
- Ding, S. L. , Royall, J. J. , Sunkin, S. M. , Ng, L. , Facer, B. A. , Lesnar, P. , Guillozet‐Bongaarts, A. , McMurray, B. , Szafer, A. , Dolbeare, T. A. , Stevens, A. , Tirrell, L. , Benner, T. , Caldejon, S. , Dalley, R. A. , Dee, N. , Lau, C. , Nyhus, J. , Reding, M. , …, Lein, E. S. (2016). Comprehensive cellular‐resolution atlas of the adult human brain. Journal of Comparative Neurology, 524, 3127–3481. [DOI] [PMC free article] [PubMed] [Google Scholar]
- Ding, S. L. , & Van Hoesen, G. W. (2010). Borders, extent, and topography of human perirhinal cortex as revealed using multiple modern neuroanatomical and pathological markers. Human Brain Mapping, 31, 1359–1379. [DOI] [PMC free article] [PubMed] [Google Scholar]
- Ding, S. L. & Van Hoesen, G. W. (2015). Organization and detailed parcellation of human hippocampal head and body regions based on a combined analysis of cyto‐ and chemoarchitecture. Journal of Comparative Neurology, 523, 2233–2253. [DOI] [PubMed] [Google Scholar]
- Ding, S. L. , Van Hoesen, G. W. , Cassell, M. D. , & Poremba, A. (2009). Parcellation of human temporal polar cortex: a combined analysis of multiple cytoarchitectonic, chemoarchitectonic, and pathological markers. Journal of Comparative Neurology, 514(6), 595–623. [DOI] [PMC free article] [PubMed] [Google Scholar]
- Ding, S. L. , Yao, Z. , Hirokawa, K. E. , Nguyen, T. N. , Graybuck, L. T. , Fong, O. , Bohn, P. , Ngo, K. , Smith, K. A. , Koch, C. , Phillips, J. W. , Lein, E. S. , Harris, J. A. , Tasic, B. , & Zeng, H. (2020). Distinct transcriptomic cell types and neural circuits of the subiculum and prosubiculum along the dorsal‐ventral axis. Cell Reports, 31, 107648. 10.1016/j.celrep.2020.107648 [DOI] [PMC free article] [PubMed] [Google Scholar]
- Englund, C. , Fink, A. , Lau, C. , Pham, D. , Daza, R. A. , Bulfone, A. , Kowalczyk, T. , & Hevner, R. F. (2005). Pax6, Tbr2, and Tbr1 are expressed sequentially by radial glia, intermediate progenitor cells, and postmitotic neurons in developing neocortex. Journal of Neuroscience, 25, 247–251. [DOI] [PMC free article] [PubMed] [Google Scholar]
- Evans, A. C. , Janke, A. L. , Collins, D. L. , & Baillet, S. (2012). Brain templates and atlases. Neuroimage, 62, 911–922. [DOI] [PubMed] [Google Scholar]
- Eze, U. C. , Bhaduri, A. , Haeussler, M. , Nowakowski, T. J. , & Kriegstein, A. R. (2021). Single‐cell atlas of early human brain development highlights heterogeneity of human neuroepithelial cells and early radial glia. Nature Neuroscience, 24(4), 584–594. [DOI] [PMC free article] [PubMed] [Google Scholar]
- Fan, X. , Fu, Y. , Zhou, X. , Sun, L. , Yang, M. , Wang, M. , Chen, R. , Wu, Q. , Yong, J. , Dong, J. , Wen, L. , Qiao, J. , Wang, X. , & Tang, F. (2020). Single‐cell transcriptome analysis reveals cell lineage specification in temporal‐spatial patterns in human cortical development. Science Advances, 6(34), eaaz2978. 10.1126/sciadv.aaz2978 [DOI] [PMC free article] [PubMed] [Google Scholar]
- Flames, N. , Pla, R. , Gelman, D. M. , Rubenstein, J. L. , Puelles, L. , & Marin, O . (2007). Delineation of multiple subpallial progenitor domains by the combinatorial expression of transcriptional codes. Journal of Neuroscience, 27, 9682–9695. [DOI] [PMC free article] [PubMed] [Google Scholar]
- Fox, I. J. , & Kornblum, H. I. (2005). Developmental profile of ErbB receptors in murine central nervous system: implications for functional interactions. Journal of Neuroscience Research, 79(5), 584–597. [DOI] [PubMed] [Google Scholar]
- Hansen, D. V. , Lui, J. H. , Flandin, P. , Yoshikawa, K. , Rubenstein, J. L. , Alvarez‐Buylla, A. , & Kriegstein, A. R. (2013). Non‐epithelial stem cells and cortical interneuron production in the human ganglionic eminences. Nature Neuroscience, 16(11), 1576–1587. [DOI] [PMC free article] [PubMed] [Google Scholar]
- Hevner, R. F. (2019). Intermediate progenitors and Tbr2 in cortical development. Journal of Anatomy, 235, 616–625. [DOI] [PMC free article] [PubMed] [Google Scholar]
- Hodge, R. D. , Bakken, T. E. , Miller, J. A. , Smith, K. A. , Barkan, E. R. , Graybuck, L. T. , Close, J. L. , Long, B. , Johansen, N. , Penn, O. , Yao, Z. , Eggermont, J. , Höllt, T. , Levi, B. P. , Shehata, S. I. , Aevermann, B. , Beller, A. , Bertagnolli, D. , Brouner, K. , …, Lein, E. S. (2019). Conserved cell types with divergent features in human versus mouse cortex. Nature, 573(7772), 61–68. [DOI] [PMC free article] [PubMed] [Google Scholar]
- Karnovsky, M. J. , & Roots, L. (1964). A “direct coloring” thiocholine method for cholinesterases. Journal of Histochemistry and Cytochemistry, 12, 219–221. [DOI] [PubMed] [Google Scholar]
- Kohwi, M. , Osumi, N. , Rubenstein, J. L. , & Alvarez‐Buylla, A. (2005). Pax6 is required for making specific subpopulations of granule and periglomerular neurons in the olfactory bulb. Journal of Neuroscience, 25(30), 6997–7003. [DOI] [PMC free article] [PubMed] [Google Scholar]
- Kostovic, I. , & Rakic, P. (1990). Developmental history of the transient subplate zone in the visual and somatosensory cortex of the macaque monkey and human brain. Journal of Comparative Neurology, 297 (3), 441–470. [DOI] [PubMed] [Google Scholar]
- Kostović, I. , Sedmak, G. , & Judaš, M. (2019). Neural histology and neurogenesis of the human fetal and infant brain. Neuroimage, 188, 743–773. [DOI] [PubMed] [Google Scholar]
- Lein, E. S. , Hawrylycz, M. J. , Ao, N. , Ayres, M. , Bensinger, A. , Bernard, A. , Boe, A. F. , Boguski, M. S. , Brockway, K. S. , Byrnes, E. J. , Chen, L. , Chen, L. , Chen, T. M. , Chin, M. C. , Chong, J. , Crook, B. E. , Czaplinska, A. , Dang, C. N. , Datta, . S. , …, Jones, A. R. (2007). Genome‐wide atlas of gene expression in the adult mouse brain. Nature, 445(7124), 168–176. [DOI] [PubMed] [Google Scholar]
- Li, H. , Chou, S. J. , Hamasaki, T. , Perez‐Garcia, C. G. , & O'Leary, D. D. M. (2012). Neuregulin repellent signaling via ErbB4 restricts GABAergic interneurons to migratory paths from ganglionic eminence to cortical destinations. Neural Development, 7, 10. 10.1186/1749-8104-7-10 [DOI] [PMC free article] [PubMed] [Google Scholar]
- Lukaszewicz, A. , Savatier, P. , Cortay, V. , Giroud, P. , Huissoud, C. , Berland, M. , Kennedy, H. , & Dehay, C. (2005). G1 phase regulation, area‐specific cell cycle control, and cytoarchitectonics in the primate cortex. Neuron, 47, 353–364. [DOI] [PMC free article] [PubMed] [Google Scholar]
- Ma, T. , Wang, C. , Wang, L. , Zhou, X. , Tian, M. , Zhang, Q. , Zhang, Y. , Li, J. , Liu, Z. , Cai, Y. , Liu, F. , You, Y. , Chen, C. , Campbell, K. , Song, H. , Ma, L. , Rubenstein, J. L. , & Yang, Z. (2013). Subcortical origins of human and monkey neocortical interneurons. Nature Neuroscience, 16(11), 1588–1597. [DOI] [PubMed] [Google Scholar]
- Mai, J. K. , Majtanik, M. , & Paxinos, G. (2016). Atlas of the human brain (4th ed.). Elsevier Academic Press. [Google Scholar]
- Miller, J. A. , Ding, S. ‐ L. , Sunkin, S. M. , Smith, K. A. , Ng, L. , Szafer, A. , Ebbert, A. , Riley, Z. L. , Royall, J. J. , Aiona, K. , Arnold, J. M. , Bennet, C. , Bertagnolli, D. , Brouner, K. , Butler, S. , Caldejon, S. , Carey, A. , Cuhaciyan, C. , Dalley, R. A. , …, Lein, E. S. (2014). Transcriptional landscape of the prenatal human brain. Nature, 508, 199–206. [DOI] [PMC free article] [PubMed] [Google Scholar]
- Molnár, Z. , & Clowry, G. J. (2012). Cerebral cortical development in rodents and primates. Progress in Brain Research, 195, 45–70. [DOI] [PubMed] [Google Scholar]
- Molnár, Z. , Clowry, G. J. , Šestan, N. , Alzu'bi, A. , Bakken, T. , Hevner, R. F. , Hüppi, P. S. , Kostović, I. , Rakic, P. , Anton, E. S. , Edwards, D. , Garcez, P. , Hoerder‐Suabedissen, A. , & Kriegstein, A. (2019). New insights into the development of the human cerebral cortex. Journal of Anatomy, 235(3), 432–451. [DOI] [PMC free article] [PubMed] [Google Scholar]
- Nelson, B. R. , Hodge, R. D. , Daza, R. A. , Tripathi, P. P. , Arnold, S. J. , Millen, K. J. , & Hevner, R. F. (2020). Intermediate progenitors support migration of neural stem cells into dentate gyrus outer neurogenic niches. elife, 9, e53777. 10.7554/eLife.53777. [DOI] [PMC free article] [PubMed] [Google Scholar]
- Nieto, M. , Monuki, E. S. , Tang, H. , Imitola, I. , Haubst, N. , Khoury, S. J. , Cunningham, J. , Gotz, M. , & Walsh, C. A. (2004). Expression of Cux‐1 and Cux‐2 in the subventricular zone and upper layers II–IV of the cerebral cortex. Journal of Comparative Neurology, 479, 168–180. [DOI] [PubMed] [Google Scholar]
- Nowakowski, R. S. , & Rakic, P. (1981). The site of origin and rout and rate of migration of neurons to the hippocampal region of the rhesus monkey. Journal of Comparative Neurology, 196, 129–154. [DOI] [PubMed] [Google Scholar]
- Nowakowski, T. J. , Bhaduri, A. , Pollen, A. A. , Alvarado, B. , Mostajo‐Radji, M. A. , Di Lullo, E. , Haeussler, M. , Sandoval‐Espinosa, C. , Liu, S. J. , Velmeshev, D. , Ounadjela, J. R. , Shuga, J. , Wang, X. , Lim, D. A. , West, J. A. , Leyrat, A. A. , Kent, W. J. , & Kriegstein, A. R. (2017). Spatiotemporal gene expression trajectories reveal developmental hierarchies of the human cortex. Science, 358(6368), 1318–1323. [DOI] [PMC free article] [PubMed] [Google Scholar]
- Oishi, K. , Chang, L. , & Huang, H. (2019). Baby brain atlases. Neuroimage, 185, 865–880. [DOI] [PMC free article] [PubMed] [Google Scholar]
- Ortega, J. A. , Memi, F. , Radonjic, N. , Filipovic, R. , Bagasrawala, I. , Zecevic, N. , & Jakovcevski, I. (2018). The subventricular zone: a key player in human neocortical development. Neuroscientist, 24, 156–170. [DOI] [PubMed] [Google Scholar]
- Paredes, M. F. , James, D. , Gil‐Perotin, S. , Kim, H. , Cotter, J. A. , Ng, C. , Sandoval, K. , Rowitch, D. H. , Xu, D. , McQuillen, P. S. , Garcia‐Verdugo, J. M. , Huang, E. J. , & Alvarez‐Buylla, A. (2016). Extensive migration of young neurons into the infant human frontal lobe. Science, 354, aaf7073. [DOI] [PMC free article] [PubMed] [Google Scholar]
- Puelles, L. , Kuwana, E. , Puelles, E. , Bulfone, A. , Shimamura, K. , Keleher, J. , Smiga, S. , & Rubenstein, J. L. (2000). Pallial and subpallial derivatives in the embryonic chick and mouse telencephalon, traced by the expression of the genes Dlx‐2, Emx‐1, Nkx‐2.1, Pax‐6, and Tbr‐1. Journal of Comparative Neurology, 424, 409–438. [DOI] [PubMed] [Google Scholar]
- Rakić, S. , Kanatani, S. , Hunt, D. , Faux, C. , Cariboni, A. , Chiara, F. , Khan, S. , Wansbury, O. , Howard, B. , Nakajima, K. , Nikolić, M. , & Parnavelas, J. G. (2015). Cdk5 phosphorylation of ErbB4 is required for tangential migration of cortical interneurons. Cerebral Cortex, 25, 991–1003. [DOI] [PMC free article] [PubMed] [Google Scholar]
- Reinchisi, G. , Ijichi, K. , Glidden, N. , Jakovcevski, I. , & Zecevic, N. (2012). COUP‐TFII expressing interneurons in human fetal forebrain. Cerebral Cortex, 22(12), 2820–2830. [DOI] [PMC free article] [PubMed] [Google Scholar]
- Rubin, A. N. , Alfonsi, F. , Humphreys, M. P. , Choi, C. K. P. , Rocha, S. F. , & Kessaris, N. (2010). The germinal zones of the basal ganglia but not the septum generate GABAergic interneurons for the cortex. Journal of Neuroscience, 30, 12050–12062. [DOI] [PMC free article] [PubMed] [Google Scholar]
- Tarabykin, V. , Stoykova, A. , Usman, N. , & Grass, P. (2001). Cortical upper layer neurons derive from the subventricular zone as indicated by Svet1 gene expression. Development, 128, 1983–1993. [DOI] [PubMed] [Google Scholar]
- Thompson, C. L. , Ng, L. , Menon, V. , Martinez, S. , Lee, C. K. , Glattfelder, K. , Sunkin, S. M. , Henry, A. , Lau, C. , Dang, C. , Garcia‐Lopez, R. , Martinez‐Ferre, A. , Pombero, A. , Rubenstein, J. L. R. , Wakeman, W. B. , Hohmann, J. , Dee, N. , Sodt, A. J. , Young, R. , …, Jones, A. R. (2014). A high‐resolution spatiotemporal atlas of gene expression of the developing mouse brain. Neuron, 83, 309–323. [DOI] [PMC free article] [PubMed] [Google Scholar]
- Villar‐Cerviño, V. , Kappeler, C. , Nóbrega‐Pereira, S. , Henkemeyer, M. , Rago, L. , Nieto, M. A. , & Marín, O. (2015). Molecular mechanisms controlling the migration of striatal interneurons. Journal of Neuroscience, 35, 8718–8729. [DOI] [PMC free article] [PubMed] [Google Scholar]
- Wang, Q. , Ding, S. L. , Li, Y. , Royall, J. , Feng, D. , Lesnar, P. , Graddis, N. , Naeemi, M. , Facer, B. , Ho, A. , Dolbeare, T. , Blanchard, B. , Dee, N. , Wakeman, W. , Hirokawa, K. E. , Szafer, A. , Sunkin, S. M. , Oh, S. W. , Bernard, A. , …, Ng, L. (2020). The Allen mouse brain common coordinate framework: a 3D reference atlas. Cell, 181, 936–953. [DOI] [PMC free article] [PubMed] [Google Scholar]
- Winpenny, E. , Lebel‐Potter, M. , Fernandez, M. E. , Brill, M. S. , Götz, M. , Guillemot, F. , & Raineteau, O. (2011). Sequential generation of olfactory bulb glutamatergic neurons by Neurog2‐expressing precursor cells. Neural Development, 6, 12. 10.1186/1749-8104-6-12 [DOI] [PMC free article] [PubMed] [Google Scholar]
- Yao, Z. , van Velthoven, C. T. J. , Nguyen, T. N. , Goldy, J. , Sedeno‐Cortes, A. E. , Baftizadeh, F. , Bertagnolli, D. , Casper, T. , Chiang, M. , Crichton, K. , Ding, S. L. , Fong, O. , Garren, E. , Glandon, A. , Gouwens, N. W. , Gray, J. , Graybuck, L. T. , Hawrylycz, M. J. , Hirschstein, D. , …, Zeng, H. (2021). A taxonomy of transcriptomic cell types across the isocortex and hippocampal formation. Cell, 184, 3222–3241. [DOI] [PMC free article] [PubMed] [Google Scholar]
- Yau, H. ‐ J. , Wang, H. F. , Lai, C. , & Liu, F. ‐ C. (2003). Neural development of the neuregulin receptor ErbB4 in the cerebral cortex and the hippocampus: preferential expression by interneurons tangentially migrating from the ganglionic eminences. Cerebral Cortex, 13, 252–264. 10.1093/cercor/13.3.252 [DOI] [PubMed] [Google Scholar]
- Zimmer, C. , Tiveron, M. C. , Bodmer, R. , & Cremer, H. (2004). Dynamics of Cux2 expression suggests that an early pool of SVZ precursors is fated to become upper cortical layer neurons. Cerebral Cortex, 14:1408–1420. [DOI] [PubMed] [Google Scholar]
Associated Data
This section collects any data citations, data availability statements, or supplementary materials included in this article.
Data Availability Statement
The data that support the findings and atlas creation of this study are available online (www.brain‐map.org or www.brainspan.org), and available from the corresponding authors upon reasonable request.


