Visual Abstract
Keywords: PET, 18F-fluorthanatrace, PARP inhibitor, ovarian cancer, radiotracer tissue pharmacokinetics
Abstract
The poly-(adenosine diphosphate-ribose) polymerase (PARP) family of proteins participates in numerous functions, most notably the DNA damage response. Cancer vulnerability to DNA damage has led to development of several PARP inhibitors (PARPi). This class of drugs has demonstrated therapeutic efficacy in ovarian, breast, and prostate cancers, but with variable response. Consequently, clinics need to select patients likely to benefit from these targeted therapies. In vivo imaging of 18F-fluorthanatrace uptake has been shown to correspond to PARP-1 expression in tissue. This study characterized the pharmacokinetics of 18F-fluorthanatrace and tested kinetic and static models to guide metric selection in future studies assessing 18F-fluorthanatrace as a biomarker of response to PARPi therapy. Methods: Fourteen prospectively enrolled ovarian cancer patients were injected with 18F-fluorthanatrace and imaged dynamically for 60 min after injection followed by up to 2 whole-body scans, with venous blood activity and metabolite measurements. SUVmax and SUVpeak were extracted from dynamic images and whole-body scans. Kinetic parameter estimates and SUVs were assessed for correlations with tissue PARP-1 immunofluorescence (n = 7). Simulations of population kinetic parameters enabled estimation of measurement bias and precision in parameter estimates. Results: 18F-fluorthanatrace blood clearance was variable, but labeled metabolite profiles were similar across patients, supporting use of a population parent fraction curve. The total distribution volume from a reversible 2-tissue-compartment model and Logan reference tissue distribution volume ratio (DVR) from the first hour of PET acquisition correlated with tumor PARP-1 expression by immunofluorescence (r = 0.76 and 0.83, respectively; P < 0.05). DVR bias and precision estimates were 6.4% and 29.1%, respectively. SUVmax and SUVpeak acquired from images with midpoints of 57.5, 110 ± 3, and 199 ± 4 min highly correlated with PARP-1 expression (mean ± SD, r ≥ 0.79; P < 0.05). Conclusion: Tumor SUVmax and SUVpeak at 55–60 min after injection and later and DVR from at least 60 min appear to be robust noninvasive measures of PARP-1 binding. 18F-fluorthanatrace uptake in ovarian cancer was best described by models of reversible binding. However, pharmacokinetic patterns of tracer uptake were somewhat variable, especially at later time points.
Poly-adenosine diphosphate-ribose polymerase inhibitors (PARPis) have demonstrated efficacy in a variety of cancers. Three PARPis (olaparib, rucaparib, and niraparib) are currently approved by the Food and Drug Administration for selected indications for ovarian cancers, and one, talazoparib, is approved for women with locally advanced or metastatic breast cancer with germline breast cancer gene mutations. The PARPi olaparib was initially approved in 2014 for advanced ovarian cancer patients with deleterious or suspected deleterious germline breast cancer gene mutations after treatment with 3 or more lines of chemotherapy. Since then, additional indications have included patients with a response to platinum-based chemotherapy, another marker for DNA repair defects (1). However, PARPi efficacy for approved ovarian cancer indications is variable, providing the impetus to develop noninvasive biomarkers to measure the entire burden of disease and better guide selection of targeted therapies containing PARPis (2). With this goal, the PET radiotracer 18F-fluorthanatrace has been developed as a noninvasive in vivo measure of PARP-1 expression (3,4).
18F-fluorthanatrace has been evaluated in preclinical models (3) and cancer patients (4). The human ovarian cancer study of Makvandi et al. demonstrated a correlation between static PET uptake measures and PARP-1 expression in tissue as measured by immunohistochemistry and autoradiography (5). A wide range of 18F-fluorthanatrace uptake was seen in ovarian cancer patients, from a background voxel SUVmax of 2 to above 12 g/mL (5). Similar studies are under way in other cancers, including breast (6), pancreatic, prostate, and glioblastoma (2).
In this companion study, we analyzed the pharmacokinetics of 18F-fluorthanatrace PET uptake in 14 ovarian cancer patients by expanding PET data from the single static PET scan reported in Makvandi et al. (5) to include a 1-h dynamic acquisition and an optional second static scan for up to 3 same-day PET scans per subject. Our results include 7 previously reported SUVs from the parent study (5). Kinetic parameters derived from graphical and compartmental models were compared with tissue PARPi expression assays to inform selection of imaging metrics and timing for PET image acquisition. Computer simulations were used to study model behavior under typical conditions. Static SUVs and SUV–to–normal-tissue ratios were compared with kinetic parameters to guide selection of clinic-friendly imaging protocols.
MATERIALS AND METHODS
Clinical Trial
Women with known or suspected recurrent or metastatic epithelial ovarian cancer were enrolled and gave written informed consent for a University of Pennsylvania Institutional Review Board–approved prospective clinical trial of 18F-fluorthanatrace PET/CT imaging (NCT02637934) between January 2016 and January 2017 at the Hospital of the University of Pennsylvania. The study protocol is described at clinicaltrials.gov. Surgical or biopsy samples were analyzed for PARP-1 expression using immunofluorescence assays. A detailed description of this clinical trial and tissue analysis methods can be found in a previous publication by Makvandi et al., including supplemental materials (5). Patients were separated into dynamic and dosimetry imaging cohorts.
Imaging Protocol
Synthesis of 18F-fluorthanatrace was described previously (3). PET/CT imaging was performed on an Ingenuity TF scanner (Philips Healthcare) (7) over 1 field of view for 60 min after injection of 18F-fluorthanatrace (387±39 MBq). Up to 2 whole-body scans were acquired, beginning 90 and 180 min after injection. Dynamic PET acquisitions were reconstructed (7) into 50 frames: 24 of 5-s duration, 6 of 10-s duration, 3 of 20-s duration, 2 of 30-s duration, 5 of 60-s duration, and 10 of 300-s duration.
Venous Blood Sampling and Analysis
Venous blood was sampled at approximately 2, 5, 10, 30, 60, and 240 min after injection to measure radiometabolites. Activity concentrations in whole blood and plasma were counted using a WIZARD2 2480 γ-counter (Perkin Elmer). Acetonitrile-treated plasma supernatant was analyzed in a 1260 Infinity Series (Agilent Technologies) high-performance liquid chromatology system using an Agilent ZORBAX StableBond C18 column via a mobile phase of 51% methanol and 49% 0.1 M ammonium formate buffer. A sample radiochromatogram is shown in Supplemental Figure 1 (supplemental materials are available at http://jnm.snmjournals.org).
Image Analysis
PET images were processed using MIM, version 6.9 (MIM Software Inc.), with spheric volumes of interest (VOIs) drawn around tumor and background regions; a board-certified nuclear medicine physician verified placement. Time–activity curves for tumor SUVmax and SUVpeak with and without partial-volume correction were used for kinetic analysis. SUVpeak was automatically positioned as the 1-cm3 volume with the greatest mean activity for each image frame (8). Partial-volume correction of SUV measures was performed as previously described (9), using a normal-muscle background region. Image blood pool SUVpeak was measured in the iliac artery for 10 patients with abdominal imaging or in the descending aorta for 4 patients with thoracic imaging. Background muscle activity was estimated using a 20-mm-diameter VOI in the gluteal or paraspinal musculature. Tumor–to–normal-muscle activity ratios were calculated by dividing tumor activity by average background. Whole-body scan data were added to dynamic data after correcting for timing of the 2–3 bed positions covering a VOI.
Kinetic Analysis
Kinetic analysis of radiotracer uptake was performed using PMOD, version 3.7 (PMOD Technologies Ltd.). Individual parent fraction data were corrected for plasma protein binding, averaged between patients, and fitted sigmoidally, creating a population 18F-fluorthanatrace parent fraction function to correct blood inputs for labeled metabolites. Tumor blood volume fractions were assumed to vary within 0.01–0.40, with the upper bound being based on literature values for malignant ovarian cancer (10) and the lower bound being a minimal physiologically relevant value.
Image-extracted blood input curves were fitted to triexponential functions and corrected for population-averaged plasma partitioning. The initial parameters and bounds were selected to encompass expected parameter ranges (Supplemental Table 1). Compartmental models were initially fit using data from the dynamic and both static scans. For comparison, models were fit with the dynamic plus the first whole-body scan, the 0- to 60-min dynamic dataset, and the truncated 0- to 30-min dataset. Reported results are from the 0- to 60-min dynamic dataset unless stated otherwise.
Tumor kinetics were analyzed using reversible models of 18F-fluorthanatrace binding: a 2-tissue-compartment model with reversible binding (2CR) and a reversible graphical method. The graphical technique of Logan et al. (11) was used to estimate the tumor distribution volume ratio (DVR) without needing blood activity or metabolite measurements and to compensate for possible low-level nonspecific uptake. Since the initial equilibration time t* for the population was 40 min, this model was not evaluated on 0- to 30-min data. The positive efflux rate term k′2 for transfer from muscle to plasma was averaged and used for all patients via a multilinear reference tissue model (12).
Statistics
Comparisons between kinetic model complexity and effectiveness were evaluated via a PMOD-calculated Akaike information criterion (13).
Static tumor SUV, tumor–to–normal-muscle ratios, 2CR distribution volume (VT), and Logan reference model DVR estimations were each tested for a correlation with 7 PARP-1 tumor immunofluorescence values, using the immunofluorescence methods reported in the supplemental materials of Makvandi et al. (5).
The 2-tailed Pearson r was calculated in SPSS25 (IBM Armonk) and used to assess correlations between tissue immunofluorescence and imaging data; correlations with a P value of at least 0.05 were considered significant against the null hypothesis of r = 0.
Kinetic Model Performance
Sensitivity curves were calculated as percentage change in model output corresponding to a 1% change in each parameter. The repeatability of kinetic parameter estimation was analyzed using simulated data based on ranges of individual kinetic parameters via methods of Viswanath et al. (14). Bias was averaged across each of 100 noise realizations, and averaged across 200 runs. Precision for each run was calculated as the average SD across all noise realizations, divided by the true value.
RESULTS
Twenty women with recurrent or metastatic epithelial ovarian cancer, and ranging in age from 21 to 70 y, were enrolled. A trial diagram overview was published previously (5). Eighteen patients were imaged with 18F-fluorthanatrace PET/CT, and 16 completed venous blood sampling with no reported adverse events.
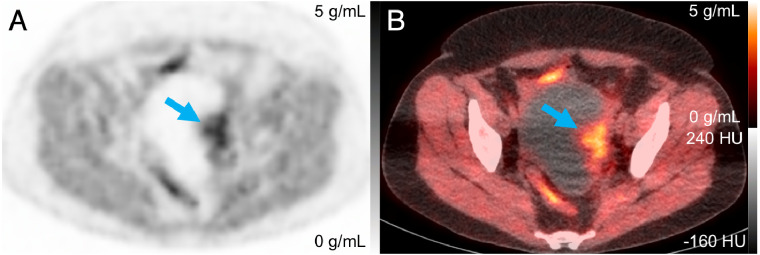
Of the 18 patients, a dynamic imaging cohort of 14 was scanned for 60 min after injection, followed by scanning at 90 and 180 min after injection, from the skull base to the mid thigh (whole body static scans). Blood data from 4 subjects in the dosimetry cohort were included in population blood results. Tumors were visible in dynamic fields of view for 10 patients, 7 of whom had surgical tumor tissue samples and accompanying PARP-1 immunofluorescence assays. Static scans measured tumor activity at 110 ± 3 min (mean ± SD) and 199 ± 4 min after injection. Representative PET and PET/CT images are in Figure 1.
FIGURE 1.
PET (A) and PET/CT (B) images of patient 4 at 108 min after injection, with arrow indicating tumor with SUVmax of 5.6 g/mL.
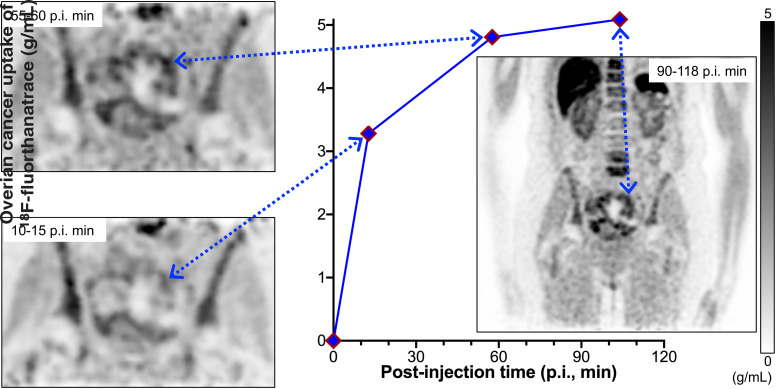
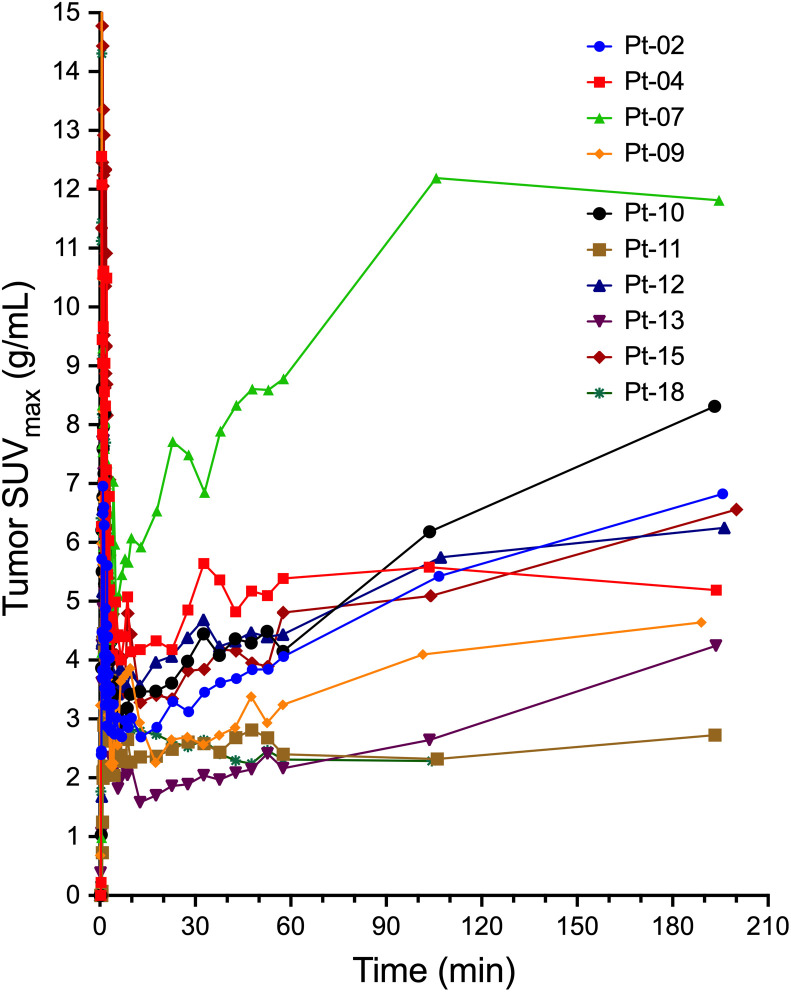
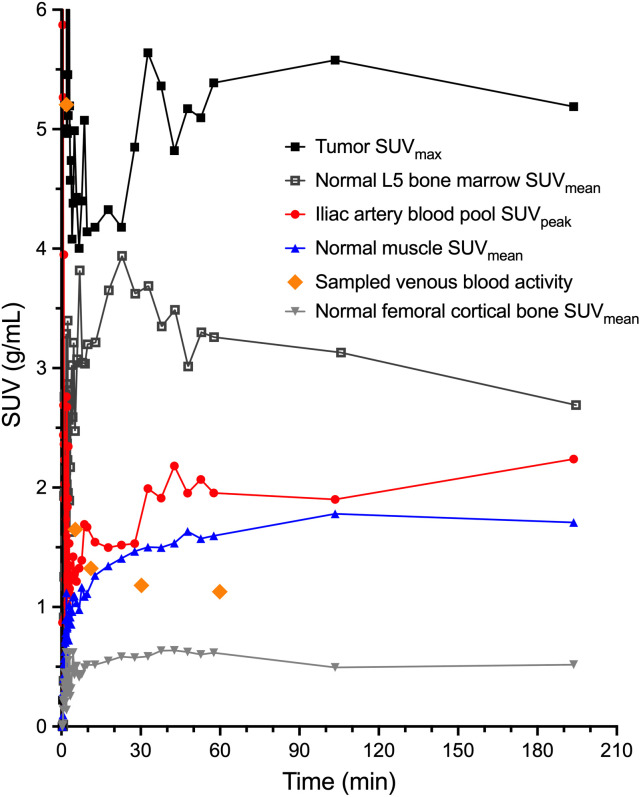
Tumor 18F-fluorthanatrace uptake, as measured by SUVmax and SUVpeak, generally increased over the 60-min dynamic scan and the subsequent static scans, with more variable behavior after 60 min (Fig. 2). SUVmax at 55–60 min after injection was 4.2 ± 2.0 g/mL, and SUVpeak was 3.4 ± 1.6 g/mL. Normal-muscle, bone, and blood pool activities (representative patient in Fig. 3) were fairly stable over time and were used for kinetic modeling and SUV ratios. Tumor–to–normal-muscle SUV ratios were 2.6 ± 1.1 for SUVmax and 2.1 ± 0.9 for SUVpeak. Partial-volume corrections based on tumor size and normal-muscle background uptake resulted in SUV increases (Supplemental Table 2).
FIGURE 2.
18F-fluorthanatrace index lesion maximum uptake over time for 10 subjects. First 60 min of scanning are from dynamic acquisition, followed by static scan tumor measurements at 110 ± 3 and 199 ± 4 min from 2 subsequent whole-body PET scans. Pt = patient.
FIGURE 3.
Patient 4 time–activity curves for 1-h dynamic acquisition after injection and 2 subsequent whole-body PET/CT scans.
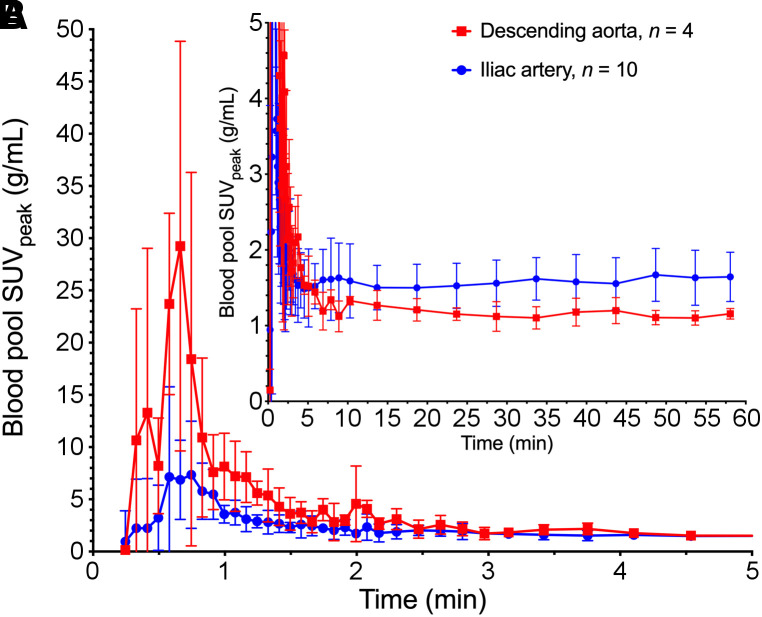
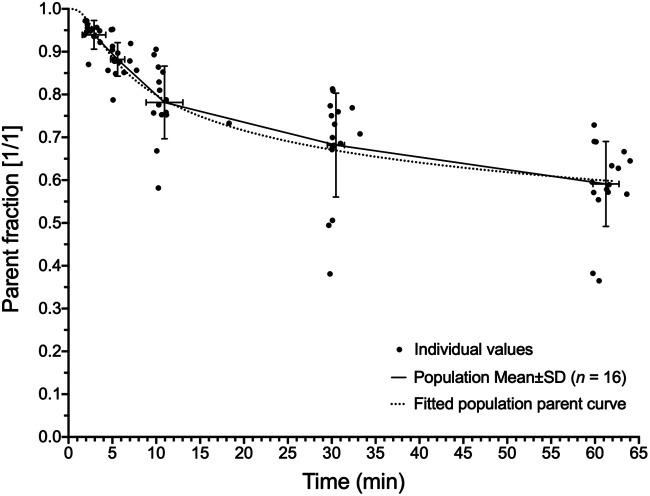
Blood sampling and processing were performed on 16 patients. Results from samples at 240 min after injection were omitted because of high error from low counts. 18F-fluorthanatrace blood inputs demonstrated some variability between patients. There were also noted differences based on the location of the blood pool VOI, related to partial-volume effects and dispersion of tracer from the larger aorta to the iliac arteries (Fig. 4; Supplemental Fig. 2). Plasma–to–whole-blood partitioning was stable throughout imaging, at a ratio of 1.26 ± 0.02 (Supplemental Fig. 3), and between patients, at a ratio of 1.26 ± 0.08 (n = 16), and was input into kinetic models as a constant parameter. 18F-fluorthanatrace was metabolized, reaching an average parent percentage of 59% ± 10% at 60 min as seen in Figure 5. The resulting population parent fraction curve was used to correct image-derived, individual blood input function for metabolites before kinetic analyses. Metabolites were not included in the model tissue compartments, assuming there was no specific uptake of polar metabolites.
FIGURE 4.
Population-averaged blood input functions for descending aorta (n = 4) and iliac artery (n = 10). Values are mean ± SD. A is from 0 to 5 min after injection and scaled to highlight initial bolus. B is from 0 to 60 min and scaled to show late activity.
FIGURE 5.
18F-fluorthanatrace population parent fraction curve. Fitting was performed on population mean values, using sigmoidal function. Fitted equation was used for parent fraction corrections for all kinetic modeling blood input curves and was of form [(1 − t3/(t3 + 10A)]B + C)/(1 + C), where A = 6.504, B = 0.053, and C = 1 × 10⁻⁸, with time after injection, t (in seconds).
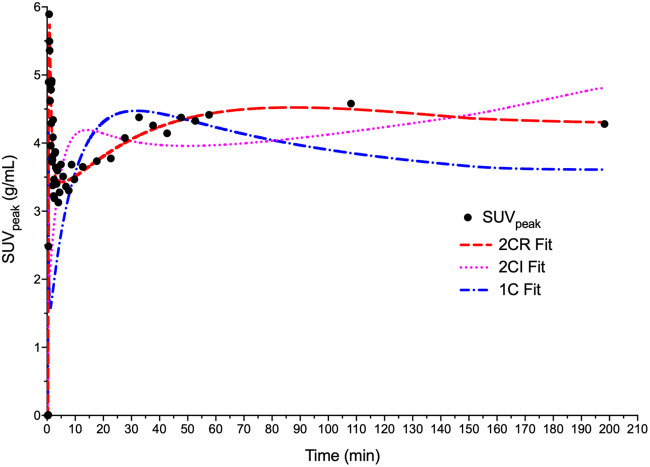
Model-fit Akaike information criterion values (13) were 273 ± 24 for the 2CR model, 292 ± 18 for the 2-tissue compartment model with irreversible binding (k4 = 0), and 340 ± 34 for the 1-tissue-compartment model. Example fits for model curves in a representative tumor are provided in Figure 6. In 33 of 39 cases, 2CR outperformed the irreversible model and had lower Akaike information criterion values than the 1-tissue-compartment model in every case. 2CR was therefore used for all subsequent compartmental analysis.
FIGURE 6.
Patient 4–modeled time–activity curves with 1-tissue-compartment reversible, 2CR, and 2-tissue compartment irreversible model fits. Akaike information criterion values were 432, 336, and 401 for 1-tissue-compartment reversible, 2CR, and 2-tissue-compartment irreversible models, respectively. 1C = 1-tissue-compartment reversible; 2CI = 2-tissue-compartment irreversible.
Sensitivity curves for 2CR parameters are provided in Supplemental Figure 4. Blood volume fraction and K1 exhibited an early influence, followed by K1/k2, k3, and k4.
When the model parameters VT and DVR of the fitted tumor SUVmax and SUVpeak time–activity curves with and without partial-volume correction were compared with the reference standard PARP-1 immunofluorescence, SUVpeak-based kinetics correlations were slightly higher; therefore, reported kinetic analyses and simulations used SUVpeak.
The Logan reference tissue model with normal muscle was tested as a graphical model of reversible tracer binding that does not require blood sampling. The population k′2 value applied in Logan reference tissue modeling was 0.022 ± 0.022 min−1 using positive k′2 values from 7 patients. Logan normal-muscle DVR was 2.2 ± 1.2 (n = 9, excluding 1 patient with excessive motion).
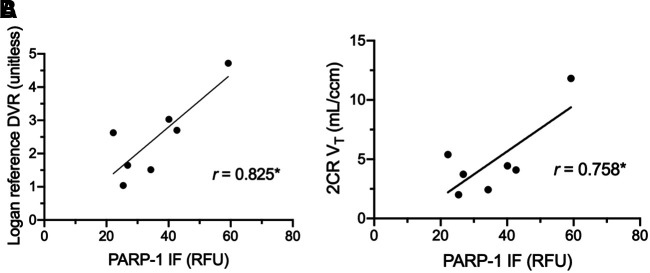
Associations between PARP-1 immunofluorescence and tumor uptake, with both static uptake measures and kinetic parameters, were examined. Associations between static measures of tumor uptake and PARP-1 immunofluorescence varied with image timing. SUVmax and SUVpeak obtained after 55 min (57.5, ∼110, and ∼119 min) demonstrated statistically significant correlations (Table 1). Partial-volume corrections did not substantially change correlations. Tumor–to–normal-muscle uptake ratios showed similar or slightly decreased associations with PARP-1 expression, as compared with uncorrected SUVs (Table 1). VT significantly correlated with tissue PARP-1 immunofluorescence for only the 1-h dynamic dataset (r = 0.76, P < 0.05; Table 2; Fig. 7A). DVR using normal muscle correlated significantly with tissue immunofluorescence (r = 0.83, P < 0.05, n = 7) but not with SUVs at 55–60 min (r = 0.41, P > 0.05, n = 10), until after dynamic acquisition input data were expanded to include measures from 1 or 2 subsequent whole-body scans (r ≥ 0.81, P < 0.05, n = 10) (Table 3; Fig. 7B).
TABLE 1.
Correlations Between 18F-Fluorthanatrace SUVs (g/mL) and Unitless SUV Ratios at Different Mid-Bin Times Against PARP-1 Immunofluorescence (n = 7)
| PARP-1 immunofluorescence versus… | ||||
|---|---|---|---|---|
| Parameter | 32.5 min* | 57.5 min* | 110 ± 3 min | 199 ± 4 min |
| SUVmax | 0.656 | 0.796† | 0.800† | 0.819† |
| SUVpeak | 0.686 | 0.787† | 0.855† | 0.825† |
| PVC SUVmax | 0.657 | 0.795† | 0.799† | 0.818† |
| PVC SUVpeak | 0.684 | 0.786† | 0.854† | 0.823† |
| SUVmax/NM | 0.445 | 0.696 | 0.741 | 0.706 |
| SUVpeak/NM | 0.512 | 0.707 | 0.808† | 0.734 |
| PVC SUVmax/NM | 0.454 | 0.700 | 0.318 | 0.531 |
| PVC SUVpeak/NM | 0.515 | 0.710 | 0.808† | 0.737 |
Duration of dynamic frame was 5 min.
P < 0.05.
PVC = partial-volume correction; NM = normal-muscle reference tissue.
TABLE 2.
Kinetic Measures from Different Total Duration Input Data Correlations with PARP-1 Immunofluorescence
| PARP-1 immunofluorescence versus… | ||||
|---|---|---|---|---|
| Parameter | 0–30 min | 0–60 min | 0–60 + 110 min | 0–60 + 110 + 199 min |
| 2CR* VT (mL/cm3) | 0.415 | 0.758† | 0.407 | 0.555 |
| Logan NM DVR‡ | — | 0.825† | 0.869† | 0.822† |
k4 > 0.
P < 0.05.
Graphical methods not performed for 0- to 30-min dataset.
NM = normal-muscle reference tissue.
FIGURE 7.
Correlation plots between kinetic parameters and PARP-1 immunofluoresence (n = 7) in relative fluorescence units (RFU) for Logan reference tissue DVR (A) and 2CR VT (B). *P < 0.05.
TABLE 3.
Kinetic Measure Correlations with SUVpeak (n = 10)
| Parameter | 57.5 min SUVpeak | 110 ± 3 min SUVpeak | 199 ± 4 min SUVpeak |
|---|---|---|---|
| 2CR* VT (0–60 min) | 0.929† | 0.974† | 0.940† |
| 2CR* VT (0–60 + 110 min) | 0.082 | 0.259 | 0.365 |
| 2CR* VT (0–60 + 110 + 199 min) | 0.548 | 0.722† | 0.781† |
| Logan NM DVR (0–60 min) | 0.410 | 0.265 | 0.083 |
| Logan NM DVR (0–60 + 110 min) | 0.879† | 0.976† | 0.969† |
| Logan NM DVR (0–60 + 110 + 199 min) | 0.806† | 0.915† | 0.974† |
k4 > 0.
P < 0.05.
NM = normal-muscle reference tissue.
Bias and precision estimates from simulations in Table 4 found that Logan DVR had the lowest bias, 6%, and the best precision, 29%.
TABLE 4.
Estimates of Kinetic Model Parameter Bias and Precision
| Parameter | Bias | Precision |
|---|---|---|
| 2CR VT (mL/cm3) | 250% | 635% |
| 2CR K1 (mL/cm3/min) | −8% | 54% |
| Logan DVR (unitless) | 6% | 29% |
DISCUSSION
We studied several PET measures of 18F-fluorthanatrace uptake in ovarian cancer to inform recommendations on metrics and imaging protocols for measuring PARP-1 expression. SUVs and kinetic parameters from dynamic imaging analysis correlated with PARP-1 immunofluorescence pathology measures. However, additional 18F-fluorthanatrace imaging studies of patients participating in PARPi treatment trials will be required to determine whether 18F-fluorthanatrace imaging can serve as a biomarker for response to PARPi therapy.
The superior fit for 2CR to patients’ tumors (Fig. 6), superior Akaike information criterion values versus other compartmental models, and high association of reversible model tumor DVR with PARP-1 immunofluorescence support characterization of 18F-fluorthanatrace as having substantial reversible binding in vivo during the imaging session. Makvandi et al. reported a correlation (r2 = 0.60; n = 10 lesions) between PARP-1 immunofluorescence and SUVmax (5). Our corresponding r2 of 0.64 (or equivalently, r = 0.80 in Table 1) is slightly different because of our smaller n (7, only including cancerous lesions within fields of view for the dynamic scans). More clinic-friendly SUVmax and SUVpeak measures’ high correlation with PARP-1 expression supports their use as potentially robust and repeatable metrics for measurement of in vivo PARP-1, with the benefit that SUVs do not require assumptions of reversible or irreversible binding.
Although best described by a reversible model, late uptake of 18F-fluorthanatrace also suggests a degree of irreversible binding, possibly indicative of PARP trapping, as many patients’ time–activity curves showed increases in uptake on static scans at 110 and 199 min (Fig. 2). The impact of this variability on the accuracy of kinetic estimates of tracer binding may be complicated by model and input function source selections, as the compartmental model was more sensitive to k3 and k4 parameters at later times (Supplemental Fig. 4) when variable uptake of metabolites or issues with the image-derived input functions could interfere with parameter estimates. Without prior dynamic data in humans or preclinically based models to provide physiologic bounds on model fitting, these parameters were highly variable within this patient population. Simulations, Table 4, and Supplemental Figure 5 show the potential for large errors in fitted 2CR VT. This dataset is not sufficient to rule out an element of irreversible binding of 18F-fluorthanatrace to PARP-1 within the time frame of 200 min after injection.
Although both DVR measures from 0–60 min uptake and SUVs from 55–60 min summed uptake correlated with PARP-1 immunofluorescence tissue assay results, these measures did not correlate with each other. Adding late uptake time points from whole-body scan measures to the dynamic dataset, however, resulted in a significant correlation between DVR and SUVs (r > 0.81, P < 0.01). Conversely, adding static scans to the dynamic dataset for the 2CR model resulted in decreased correlations between VT and both PARP-1 immunofluorescence and SUVs (Table 3). DVR’s better correlations to SUV when using longer-duration datasets could be due to the fact that the DVR graphical reference technique did not require metabolite corrections. It is also possible that DVRs are better able to account for some nonselective, irreversible parent or metabolite binding at later time points via use of a reference region. Another possibility is the existence of an inflection point in the binding characteristics that is not captured with the gap in imaging between 60 and about 110 min, which may impact VT estimations.
Metabolism, plasma–to–whole-blood partitioning, and plasma protein binding of 18F-fluorthanatrace were similar within this population, supporting use of averaged population values and functions for kinetic analyses (Fig. 5; Supplemental Fig. 3). Our reported 18F-fluorthanatrace plasma–to– whole-blood partitioning ratio of 1.26 in Supplemental Figure 3 was similar to a ratio of 1.28 (reported as a 0.781 blood-to-plasma ratio) for another rucaparib analog radiotracer, 14C-rucaparib, in a cohort of 6 patients with confirmed advanced solid tumor (15). This 14C-rucaparib study (15) also used mass spectrometry to determine that 64% ± 13.7% of the labeled components was the parent radiotracer in pooled plasma samples from 1 to 24 h after injection, which was similar to our reported average parent 18F-fluorthanatrace percentage of 59% ± 10% at 1 h. We have not identified these metabolites or their binding properties, except that they are more polar than 18F-fluorthanatrace, similarly to rucaparib metabolites, which are carboxylated at the n-methyl substituent.
Individual image-derived blood input curves were influenced by VOI positioning, suggesting that partial-volume effects may influence our blood pool measurements in the lower torso. This is most apparent in later time points, when the blood pool approaches the activity level of the surrounding tissue and remains above the sampled blood activity (Figs. 3 and 4). Decreased adjacent background activity (spillover) for VOIs in the descending aorta, as compared with VOIs in the iliac arteries, potentially biased measured activity based on differences in the arterial internal diameters. A reduced artery size contributes to increased partial-volume effects, and the 1-cm3, or 12.4-mm diameter, peak VOIs used for calculating blood activity are above the luminal diameter of the common iliac artery, reported to be 8.8 ± 1.2 mm in women (16), and thus more impacted than the larger descending aorta at 13.7 ± 1.9 to 16.6 ± 3.0 mm. The full-width-at-half-maximum resolution of the Ingenuity PET scanner, 4.8 mm (7), also limits the ability to use significantly smaller VOIs within small vessels. Using venous blood sampling instead of arterial sampling also limits our ability to verify the arterial blood input function extracted from image blood pools.
Variable levels of background uptake in surrounding tissue support use of background corrections to quantitate 18F-fluorthanatrace uptake. In this study of ovarian cancer, however, partial-volume corrections had little impact on correlations with tissue PARP-1 expression, in contrast to work in breast cancer imaging of 18F-fluorthanatrace uptake (6), potentially because of very low levels of background uptake in breast tissue in comparison to higher background uptake in muscle surrounding most ovarian lesions. Partial-volume correction of tumor–to–normal-muscle ratios similarly did not have a substantial effect on correlations with PARP-1 immunofluorescence (Table 1).
We found somewhat variable tumor kinetics late after tracer injection, potentially resulting from the variable trapping of the PARPi analog, 18F-fluorthanatrace, or tissue uptake of metabolites, which account for 30%–50% of circulating blood radioactivity at 60 min. This concern and the good correlation between the 57.5-min 18F-fluorthanatrace SUVmax and SUVpeak measures with PARP-1 immunofluorescence tissue assay results support a recommendation for imaging at 60 min after injection for static uptake measures. To better inform image quantification and kinetic analysis methods, additional studies with longer dynamic acquisitions of at least 90 min, with arterial blood sampling and a higher percentage of tumors receiving ex vivo assays of PARP-1 expression, would be helpful. However, it may prove difficult to recruit sufficient cancer patients who could tolerate longer imaging times and accept more invasive arterial blood sampling. Preclinical experiments to assess the degree to which 18F-fluorthanatrace binding within cells is reversible during the first 2 h of 18F-fluorthanatrace uptake would inform future selection of kinetic analysis techniques and possibly the ideal postinjection time range for static SUV measures of tumor uptake.
CONCLUSION
Pharmacokinetics of ovarian cancer uptake of 18F-fluorthanatrace suggest that SUVs from whole-body PET scans acquired 60 min after injection are a robust metric for noninvasively quantifying PARP-1 expression in vivo. Although the Logan normal-muscle reference tissue model is a promising kinetic analysis technique for quantitating 18F-fluorthanatrace uptake, there is not yet sufficient evidence that kinetic estimates or tumor–to–normal-muscle SUV ratios represent substantial enough improvements over more clinic-friendly SUVmax or SUVpeak tumor measures to justify dynamic scanning for larger-scale trials of 18F-fluorthanatrace PET. More preclinical and human 18F-fluorthanatrace studies would be valuable to elucidate underlying reversible and irreversible 18F-fluorthanatrace binding mechanisms and guide future 18F-fluorthanatrace studies, especially in the study of PARPi dosing and pharmacodynamics and utility as a biomarker.
DISCLOSURE
Robert Mach and David Mankoff (spouse) declare financial conflicts of interest related to ownership in Trevarx Biomedical, Inc., which holds a license for 18F-fluorthanatrace. Erin Schubert and Robert Doot (spouse) have been paid consultants for Trevarx Biomedical, Inc. Lilie Lin has received funds from Astrazenca for travel to meetings and to support an investigator-initiated clinical trial of immunotherapy combined with radiotherapy. This research was supported by the USA National Cancer Institute (P30CA016520), the National Institute on Drug Abuse (K01DA040023 [Robert Doot]), and the National Center for Advancing Translational Sciences (KL2TR001879 [Austin Pantel] and UL1TR000003) of the National Institutes of Health and by the Kaleidoscope of Hope Foundation, Marsha Rivkin Foundation, University of Pennsylvania (Penn) Institute for Translational Medicine and Therapeutics, and Penn Radiology Department. Lilie Lin is supported by the Kaleidoscope of Hope Foundation and the Marsha Rivkin Foundation. This research was also sponsored by the National Center for Research Resources. No other potential conflict of interest relevant to this article was reported.
ACKNOWLEDGMENTS
We thank Elizabeth S. McDonald for helpful discussions on 18F-fluorthanatrace uptake in breast cancer, Regan Sheffer for protocol development and data collection, Jenny Cai and Matthew A. Fillare for research coordination, Kuiying Xu for synthesis of radiotracer precursors, Chia-Ju Hsieh for help in blood data collection, the University of Pennsylvania cyclotron facility for radiotracer manufacture, and the Nuclear Medicine–Advanced Image Analysis Laboratory for providing workstations and software used for image analyses.
KEY POINTS.
QUESTION: Can characterization of the pharmacokinetics of ovarian cancer uptake of 18F-fluorthanatrace inform selection of uptake quantitation methods and postinjection timing of PET acquisitions?
PERTINENT FINDINGS: Prospective clinical trial of human ovarian cancer patients found SUV and DVR quantitation of 18F-fluorthanatrace tumor uptake to be significantly correlated with PARP-1 expression.
IMPLICATIONS FOR PATIENT CARE: 18F-fluorthanatrace scans may one day select patients likely to benefit from PARPi therapy and serve as a tool to monitor response.
REFERENCES
- 1. Franzese E, Centonze S, Diana A, et al.PARP inhibitors in ovarian cancer. Cancer Treat Rev. 2019;73:1–9. [DOI] [PubMed] [Google Scholar]
- 2. Ambur Sankaranarayanan R, Kossatz S, Weber W, Beheshti M, Morgenroth A, Mottaghy FM. Advancements in PARP1 targeted nuclear imaging and theranostic probes. J Clin Med. 2020;9:2130. [DOI] [PMC free article] [PubMed] [Google Scholar]
- 3. Zhou D, Chu W, Xu J, et al.Synthesis, [18F] radiolabeling, and evaluation of poly (ADP-ribose) polymerase-1 (PARP-1) inhibitors for in vivo imaging of PARP-1 using positron emission tomography. Bioorg Med Chem. 2014;22:1700–1707. [DOI] [PMC free article] [PubMed] [Google Scholar]
- 4. Michel LS, Dyroff S, Brooks FJ, et al.PET of poly (ADP-ribose) polymerase activity in cancer: preclinical assessment and first in-human studies. Radiology. 2017;282:453–463. [DOI] [PMC free article] [PubMed] [Google Scholar]
- 5. Makvandi M, Pantel A, Schwartz L, et al.A PET imaging agent for evaluating PARP-1 expression in ovarian cancer. J Clin Invest. 2018;128:2116–2126. [DOI] [PMC free article] [PubMed] [Google Scholar]
- 6. McDonald ES, Doot RK, Pantel AR, et al.Positron emission tomography imaging of poly–(adenosine diphosphate–ribose) polymerase 1 expression in breast cancer: a nonrandomized clinical trial. JAMA Oncol. 2020;6:921–923. [DOI] [PMC free article] [PubMed] [Google Scholar]
- 7. Kolthammer JA, Su K-H, Grover A, Narayanan M, Jordan DW, Muzic RF. Performance evaluation of the Ingenuity TF PET/CT scanner with a focus on high count-rate conditions. Phys Med Biol. 2014;59:3843–3859. [DOI] [PMC free article] [PubMed] [Google Scholar]
- 8. Wahl RL, Jacene H, Kasamon Y, Lodge MA. From RECIST to PERCIST: evolving considerations for PET response criteria in solid tumors. J Nucl Med. 2009;50(suppl 1):122S–150S. [DOI] [PMC free article] [PubMed] [Google Scholar]
- 9. Peterson LM, Mankoff DA, Lawton T, et al.Quantitative imaging of estrogen receptor expression in breast cancer with PET and 18F-fluoroestradiol. J Nucl Med. 2008;49:367–374. [DOI] [PubMed] [Google Scholar]
- 10. Thomassin-Naggara I, Balvay D, Aubert E, et al.Quantitative dynamic contrast-enhanced MR imaging analysis of complex adnexal masses: a preliminary study. Eur Radiol. 2012;22:738–745. [DOI] [PubMed] [Google Scholar]
- 11. Logan J, Fowler JS, Volkow ND, Wang GJ, Ding YS, Alexoff DL. Distribution volume ratios without blood sampling from graphical analysis of PET data. J Cereb Blood Flow Metab. 1996;16:834–840. [DOI] [PubMed] [Google Scholar]
- 12. Ichise M, Liow JS, Lu JQ, et al.Linearized reference tissue parametric imaging methods: application to [11C]DASB positron emission tomography studies of the serotonin transporter in human brain. J Cereb Blood Flow Metab. 2003;23:1096–1112. [DOI] [PubMed] [Google Scholar]
- 13. Akaike H. A new look at the statistical model identification. IEEE Trans Automat Contr. 1974;19:716–723. [Google Scholar]
- 14. Viswanath V, Zhou R, Lee H, et al.Kinetic modeling of 18F-(2S,4R)4-fluoroglutamine in mouse models of breast cancer to estimate glutamine pool size as an indicator of tumor glutamine metabolism. J Nucl Med. 2021;62:1154–1162. [DOI] [PMC free article] [PubMed] [Google Scholar]
- 15. Liao M, Watkins S, Nash E, et al.Evaluation of absorption, distribution, metabolism, and excretion of [14C]-rucaparib, a poly(ADP-ribose) polymerase inhibitor, in patients with advanced solid tumors. Invest New Drugs. 2020;38:765–775. [DOI] [PMC free article] [PubMed] [Google Scholar]
- 16. Pedersen OM, Aslaksen A, Vik-Mo H. Ultrasound measurement of the luminal diameter of the abdominal aorta and iliac arteries in patients without vascular disease. J Vasc Surg. 1993;17:596–601. [DOI] [PubMed] [Google Scholar]


