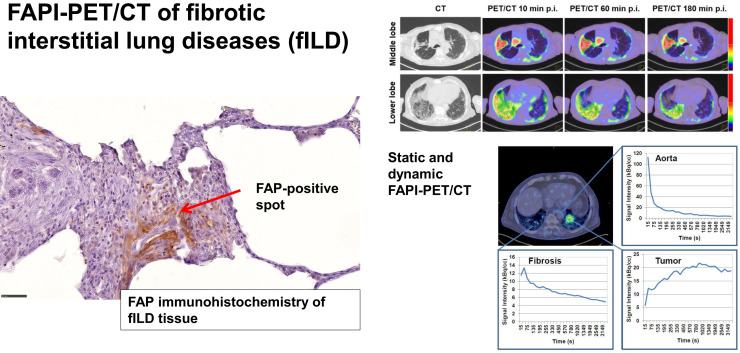
Visual Abstract
Keywords: fibroblast activation protein, interstitial lung disease, lung cancer
Abstract
Interstitial lung diseases (ILDs) comprise over 200 parenchymal lung disorders. Among them, fibrosing ILDs, especially idiopathic pulmonary fibrosis, are associated with a poor prognosis, whereas some other ILDs, such as sarcoidosis, have a much better prognosis. A high proportion manifests as fibrotic ILD (fILD). Lung cancer (LC) is a frequent complication of fILD. Activated fibroblasts are crucial for fibrotic processes in fILD. The aim of this exploratory study was to evaluate the imaging properties of static and dynamic fibroblast activation protein (FAP) inhibitor (FAPI) PET/CT in various types of fILD and to confirm FAP expression in fILD lesions by FAP immunohistochemistry of human fILD biopsy samples and of lung sections of genetically engineered (Nedd4-2−/−) mice with an idiopathic pulmonary fibrosislike lung disease. Methods: PET scans of 15 patients with fILD and suspected LC were acquired 10, 60, and 180 min after the administration of 150–250 MBq of a 68Ga-labeled FAPI tracer (FAPI-46). In 3 patients, dynamic scans over 40 min were performed instead of imaging after 10 min. The SUVmax and SUVmean of fibrotic lesions and LC were measured and CT-density–corrected. Target-to-background ratios (TBRs) were calculated. PET imaging was correlated with CT-based fibrosis scores. Time–activity curves derived from dynamic imaging were analyzed. FAP immunohistochemistry of 4 human fILD biopsy samples and of fibrotic lungs of Nedd4-2−/− mice was performed. Results: fILD lesions as well as LC showed markedly elevated 68Ga-FAPI uptake (density-corrected SUVmax and SUVmean 60 min after injection: 11.12 ± 6.71 and 4.29 ± 1.61, respectively, for fILD lesions and 16.69 ± 9.35 and 6.44 ± 3.29, respectively, for LC) and high TBR (TBR of density-corrected SUVmax and SUVmean 60 min after injection: 2.30 ± 1.47 and 1.67 ± 0.79, respectively, for fILD and 3.90 ± 2.36 and 2.37 ± 1.14, respectively, for LC). SUVmax and SUVmean decreased over time, with a stable TBR for fILD and a trend toward an increasing TBR in LC. Dynamic imaging showed differing time–activity curves for fILD and LC. 68Ga-FAPI uptake showed a positive correlation with the CT-based fibrosis index. Immunohistochemistry of human biopsy samples and the lungs of Nedd4-2−/− mice showed a patchy expression of FAP in fibrotic lesions, preferentially in the transition zone to healthy lung parenchyma. Conclusion: 68Ga-FAPI PET/CT imaging is a promising new imaging modality for fILD and LC. Its potential clinical value for monitoring and therapy evaluation of fILD should be investigated in future studies.
Interstitial lung diseases (ILDs) comprise over 200 parenchymal lung disorders. Among them, fibrosing ILDs, especially idiopathic pulmonary fibrosis (IPF), are associated with a poor prognosis, whereas some other ILDs, such as sarcoidosis, have a much better prognosis (1,2). A high proportion manifests as fibrotic ILD (fILD), and despite conventional therapy, fILD has a potential for disease progression, which is associated with worsened lung function and quality of life as well as early death (3). IPF is a subtype of fILD with a typically chronic, irreversible, and progressive clinical course (4,5); a variable disease course; and a poor prognosis (4,6,7). But also in other fILDs, including rheumatoid arthritis–associated ILD (8), systemic sclerosis–associated ILD (9), and unclassifiable ILD (10), progression has been observed in a proportion of patients. Lung cancer (LC), a frequent complication of fILD, crucially contributes to the poor prognosis of these patients (11).
The standard imaging technique for the assessment of fILD is high-resolution CT (7). CT is an essential component for the diagnosis of ILD, and radiologic patterns are predictors for outcomes and therapy effects (12). Yet, CT is unable to assess disease activity in fILDs. Next to CT, 18F-FDG PET/CT is used for the imaging of fILDs, based on increased glucose metabolism in fibrotic pulmonary lesions (13–16), and may add value to CT for risk stratification and evaluation of antifibrotic therapies (13). But both CT and 18F-FDG PET have inherent limitations for the evaluation of fILDs, as CT can show only morphologic changes of the lung, which occur relatively late during fibrosis (14), and 18F-FDG PET/CT depicts inflammatory reactions but not an activated fibrotic process itself (17,18).
There is growing evidence that activated fibroblasts play a crucial role in the pathogenesis and progression of fibrotic processes in fILD (15,19–21). Activated fibroblasts contribute to various physiologic and pathologic processes, including fibrosis, inflammation, and cancer (22,23). They are characterized by expression of fibroblast activation protein (FAP). It has been shown that FAP can be specifically targeted by radioactive tracer molecules (24,25). The first pilot studies showed elevated uptake of FAP inhibitor (FAPI) tracers in various tumor entities (25,26). In these studies, elevated tracer uptake was observed not only in tumors but also in reactive processes, fibrotic lesions, and inflammatory lesions (27).
On the basis of these findings, we hypothesized that 68Ga-FAPI PET/CT may be a useful imaging and diagnostic tool for fILD. The aim of our analysis was to evaluate the imaging properties of static and dynamic 68Ga-FAPI PET/CT in various types of fILD and to confirm FAP expression of fILD lesions by FAP immunohistochemistry of human fILD biopsy samples and of lung sections of genetically engineered (Nedd4-2−/−) mice with IPF.
MATERIALS AND METHODS
Study Design and Patient Characterization
This was an exploratory, hypothesis-generating retrospective translational study. The institutional review board approved this study (study number S-115/2020), and all subjects gave written informed consent.
Between July 2018 and August 2019, 15 patients (aged 56–80 y; average, 71.2 y) with different fILD subtypes were examined by 68Ga-FAPI PET/CT. These patients were selected from 1,135 patients with suspected LC who were examined in our institution between July 2018 and August 2019. Of these, 1,104 (97.3%) were examined by 18F-FDG PET/CT and 31 (2.7%) by 68Ga-FAPI PET/CT, including the 15 patients with fILD who were retrospectively analyzed in this study. In all these patients, the clinical indication for 68Ga-FAPI PET/CT imaging was suspected LC. The individual decision for 68Ga-FAPI PET/CT and not 18F-FDG PET/CT for these patients was made by a local interdisciplinary tumor board because of our previous experiences with 68Ga-FAPI PET/CT in LC (28) and the potential diagnostic benefit for fILD. ILD diagnoses were made by an interdisciplinary team on the basis of the clinical presentation and the radiologic pattern on CT—and, in 8 of the 15 patients, on additional lung biopsy—before PET imaging according to international guidelines (8). Biopsy samples of sufficient size for immunohistochemistry were available for 4 patients. Details on the clinical and pathologic characteristics and imaging protocols for each patient are given in Supplemental Table 1 (supplemental materials are available at http://jnm.snmjournals.org).
Static and Dynamic FAP-Specific PET/CT Imaging
Diagnostic imaging was performed under the conditions of the updated Declaration of Helsinki, § 37 (“Unproven Interventions in Clinical Practice”) and in accordance with the German Pharmaceuticals Law, §13 (2b), for medical reasons. The radiotracer FAPI-46 labeled with 68Ga as previously described (29) was applied intravenously (80 nmol/GBq). Static PET/CT scans of 12 patients were obtained 10, 60, and 180 min after tracer administration with a Biograph mCT Flow PET/CT Scanner (Siemens Medical Solutions) using the following parameters: slice thickness of 5 mm, increment of 3–4 mm, soft-tissue reconstruction kernel, and CARE Dose4D. Immediately after CT scanning, a whole-body PET scan was acquired in 3 dimensions (matrix, 200 × 200) in FlowMotion at 0.7 cm/min. The emission data were corrected for randoms, scatter, and decay. Reconstruction was performed with an ordered-subset expectation maximization algorithm with 2 iterations and 21 subsets and Gauss-filtered to a transaxial resolution of 5 mm in full width at half maximum. Attenuation correction was performed using the low-dose nonenhanced CT data. For dynamic PET/CT scans of 3 patients, a list-mode acquisition of 40 min was performed as previously described (30,31), followed by static imaging after 60 and 180 min.
CT
Nonenhanced full end-inspiratory thin-section low-dose CT was routinely performed with the patient supine as previously described (32). Patients were scanned on a 128-slice Definition AS scanner (Siemens Healthcare AG) with a dose-modulated protocol at 120 kV, 40 mAs (effective), a collimation of 0.6 mm, and a pitch of 0.8.
Image Analysis and Quantification
Volumes of Interest (VOIs) in PET Data
SUVs were quantitatively assessed by an experienced nuclear physician (who had read more than 3,000 PET examinations), a medical student, and a board-certified nuclear physician working in consensus and using a VOI technique. For the VOI in fibrotic areas, a 20-mm sphere was drawn within a total of 55 lesions with a morphologically typical fibrotic appearance on CT. Tumor VOIs were defined by an automatic isocontour with a cutoff at 50% of SUVmax. The SUVs of fibrotic areas and tumors were corrected for healthy-appearing lung parenchyma as background.
Density Correction of SUVs
To correct the signal intensity in 68Ga-FAPI PET according to CT density, the SUVs of each voxel were corrected for the tissue fraction within the CT scans that were acquired during the PET/CT scan according to a method already published and validated (33,34).
Dynamic PET Imaging Analysis
Time–activity curves of 68Ga-FAPI uptake were obtained by applying the VOIs of 14 fibrotic lesions and 3 tumors to the entire dynamic dataset. The times to peak value (minutes from the beginning of the dynamic acquisition to the SUVmax of the lesion) were derived from the time–activity curves. Dynamic data analysis was done using PMOD software (PMOD Technologies Ltd.).
CT-Based Automatic Lobe Segmentation and Fibrosis (FIB)/Ground-Glass Opacity (GGO) Indices
Lungs and individual lobes were fully automatically segmented on inspiratory nonenhanced thin-section CT images by the in-house program YACTA (version 2.7.1.3) as described in previous publications (35,36). We defined the FIB index as the percentage of lung voxels greater than −775 HU and the GGO index as the percentage of voxels in the HU interval −885 to −775. The FIB index and the GGO index were calculated for each lobe separately.
Coregistration Studies of 68Ga-FAPI PET/CT Images and CT Images
To achieve anatomically identical segments of 68Ga-FAPI PET/CT images and diagnostic CT images, both were coregistered using 3DSlicer, version 4.6.2 (www.slicer.org). First, the low-dose CT images of the PET/CT scan were intramodally coregistered with the CT images on the basis of 11 manually selected anatomic landmarks using affine transformation. Second, the transformation was applied to the PET images to achieve intermodal coregistration. Coregistered PET images and CT images were loaded into the PMOD software, and SUVmean was extracted from the same CT-based pulmonary lobe segmentations as were used for GGO and FIB indexing. A representative example of the intermodal coregistration of high-resolution CT and 68Ga-FAPI PET images is shown in Supplemental Figure 1.
Animal Studies
The animal studies were approved by the animal welfare authority responsible for the University of Heidelberg (Regierungspräsidium Karlsruhe). We used Nedd4-2−/− mice, an established animal model of an IPF-like lung disease (37). To induce the conditional deletion of Nedd4-2, 4- to 6-wk-old mice were exposed to a 1 mg/mL solution of doxycycline hydrochloride (Sigma) dissolved in a 5% sucrose solution supplied as drinking water in light-protected bottles. Doxycycline solutions were prepared freshly and changed at least every 3 d. For immunohistochemical studies, 4- to 6-wk-old mice were treated for 3–4 mo with doxycycline until clinically symptomatic and then killed for tissue collection. The mice were housed in a specific pathogen-free animal facility and had free access to food and water.
Immunohistochemistry of Human and Mouse Tissue
Biopsy yielded sufficient fILD tissue in 4 patients. The interval between biopsy and 68Ga-FAPI PET/CT was 15.50 ± 10.96 mo. All samples were provided by the Tissue Bank of the National Center for Tumor Diseases, in accordance with the regulations of the tissue bank and the approval of the ethics committee of Heidelberg University.
In human tissue, we used the primary anti-FAP antibody ab207178 (EPR20021; Abcam) diluted 1:100 and the primary anti-α-smooth muscle actin (SMA) antibody ab5694 (Abcam) diluted 1:200, and staining was performed as previously described (38). For animal tissue, we used the rabbit anti-FAP antibody ab53066 (Abcam), and staining was performed as previously described (37). For FAP and α-SMA immunohistochemistry, negative controls were obtained by omitting the primary antibody. All images were scanned and digitalized using a NanoZoomer S60 digital slide scanner (Hamamatsu Photonics).
Statistical Analysis
We performed descriptive analyses for patients and their characteristics. For determination of SUVs, median and range were used. The correlation between 68Ga-FAPI uptake within or outside the tumor and fibrotic lesions was determined using 2-sided t tests after testing for a normal distribution. A P value of less than 0.05 was defined as statistically significant. Pearson correlation analysis was performed between 68Ga-FAPI PET parameters and FIB/GGO indices. Microsoft Excel, version 2010, was used for statistical analyses.
RESULTS
Static PET Imaging
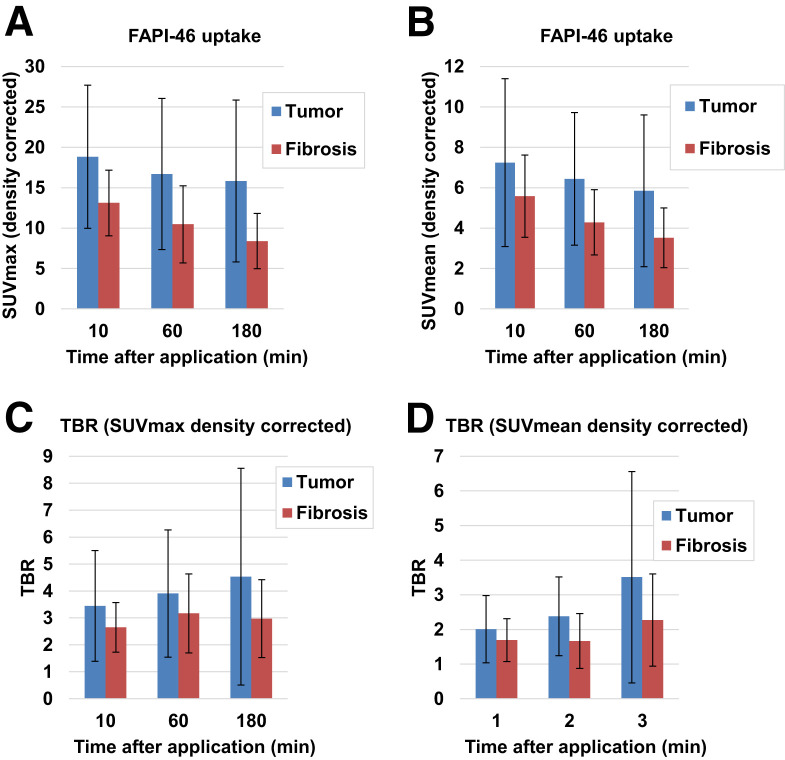
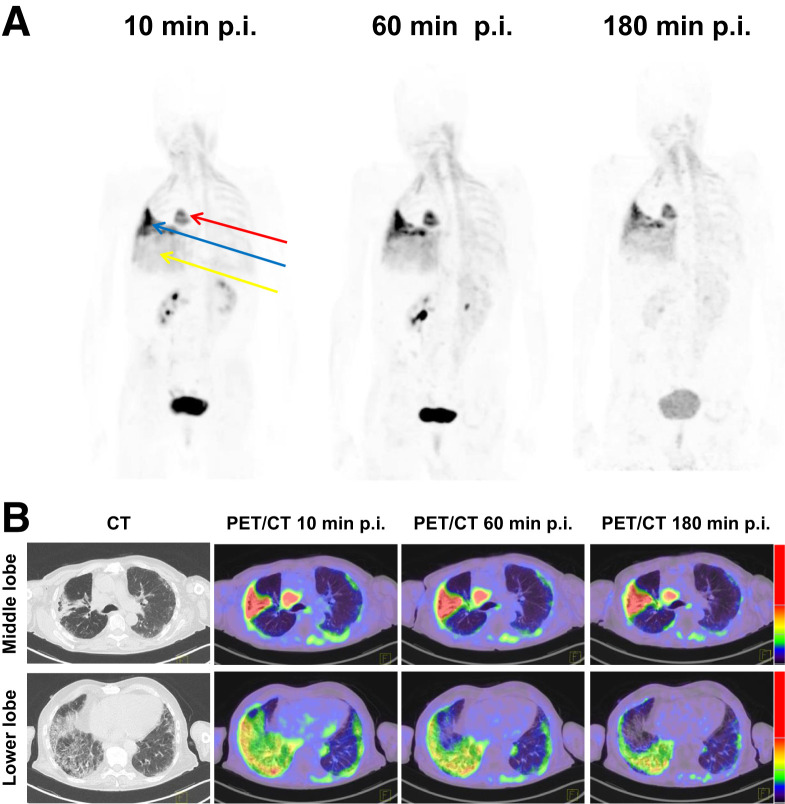
In static imaging, both fILD and LC lesions showed considerably elevated tracer uptake after 10, 60, and 180 min. The density-corrected SUVmax and SUVmean of fILD and LC lesions decreased over time, with the decrease being more pronounced in fILD than in LC (Figs. 1A and 1B). Because of decreasing background activity over time (Supplemental Fig. 2), fILD showed relatively stable target-to-background ratios (TBRs), whereas the TBR (SUVmax and SUVmean) of LC showed a tendency to increase over time (Figs. 1C and 1D). A lesionwise overview of all SUVs and TBRs is given in Supplemental Table 2. The 68Ga-FAPI uptake and TBRs (60 min after injection) of IPF did not significantly differ from those of fILDs (Supplemental Fig. 3). Figure 2 shows an exemplary case—a patient with clinically progressive rheumatoid arthritis–associated ILD and non–small cell lung carcinoma. In this patient, fILD lesions were found in the middle lobe of the right lung and in the basal parts of the right lung. Both of these lesions showed elevated tracer uptake, with the uptake in the middle lobe being much greater than that in the basal parts, potentially indicating that fILD was activated in the middle lobe. The tumor lesion was intensively 68Ga-FAPI–positive (Figs. 2A and 2B).
FIGURE 1.
Average (±SD) density-corrected SUVmax (A), SUVmean (B), and TBRs for SUVmax (C) and SUVmean (D) for tumor and fibrosis in 15 patients at 10, 60, and 180 min after application of 68Ga-FAPI.
FIGURE 2.
(A) Representative maximum-intensity-projection PET images after injection of 68Ga-FAPI in 75-y-old man with rheumatoid arthritis–associated ILD and non–small cell lung carcinoma (red arrow). Clinically, patient had significant decrease in forced vital capacity (from 70% to 38%) over the last 4 mo before FAPI PET/CT and complained about progressive weight loss and exertional dyspnea, which denotes progressive phenotype according to criteria of INBUILD study (45). We observed intensively 68Ga-FAPI–positive pulmonary fibrosis in right middle lobe (blue arrow) and moderately 68Ga-FAPI–positive pulmonary fibrosis in right lower lobe (yellow arrow). (B) Representative axial CT images and PET/CT images of intensively 68Ga-FAPI–positive (middle lobe) and moderately 68Ga-FAPI–positive (lower lobe) pulmonary fibrosis lesions of same patient. Intensively 68Ga-FAPI–positive lesion in right middle lobe may be a correlate of increased fibrotic activity, leading to observed clinical progression of fILD in this case. p.i. = after injection.
Dynamic PET Imaging
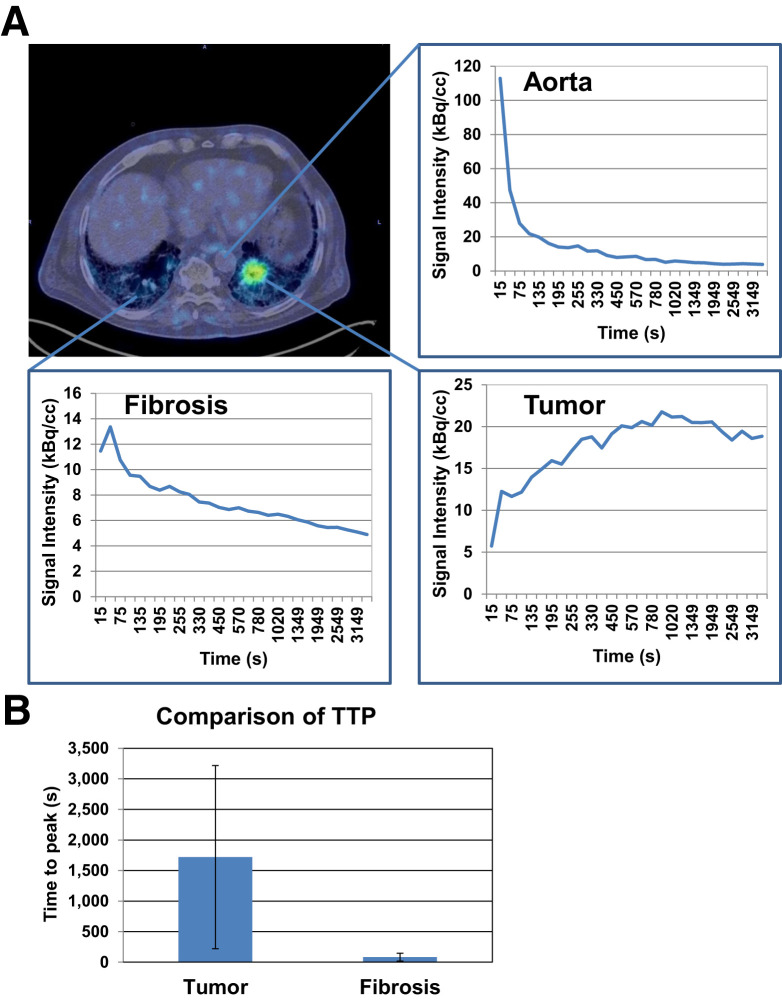
Time–activity curves for fILD and LC differed significantly. fILD lesions showed an early peak correlating with the aortic perfusion peak, followed by a slowly decreasing signal intensity over time. In contrast, LC showed an increasing time–activity curve with a delayed peak, followed by a gradual washout phase (Fig. 3A). These differences are reflected by delayed times to peak value in LC, compared with fILD lesions (Fig. 3B).
FIGURE 3.
(A) Axial PET/CT image and corresponding time–activity curves showing uptake of 68Ga-FAPI over time in aorta, left-sided LC lesion, and fibrotic area in right lung. (B) Comparison of average time to peak (±SD) of 3 fibrotic areas and 3 LC lesions as measured by dynamic PET imaging. TTP = time to peak.
Correlation Between PET Imaging and FIB/GGO Indices of Pulmonary Lobes
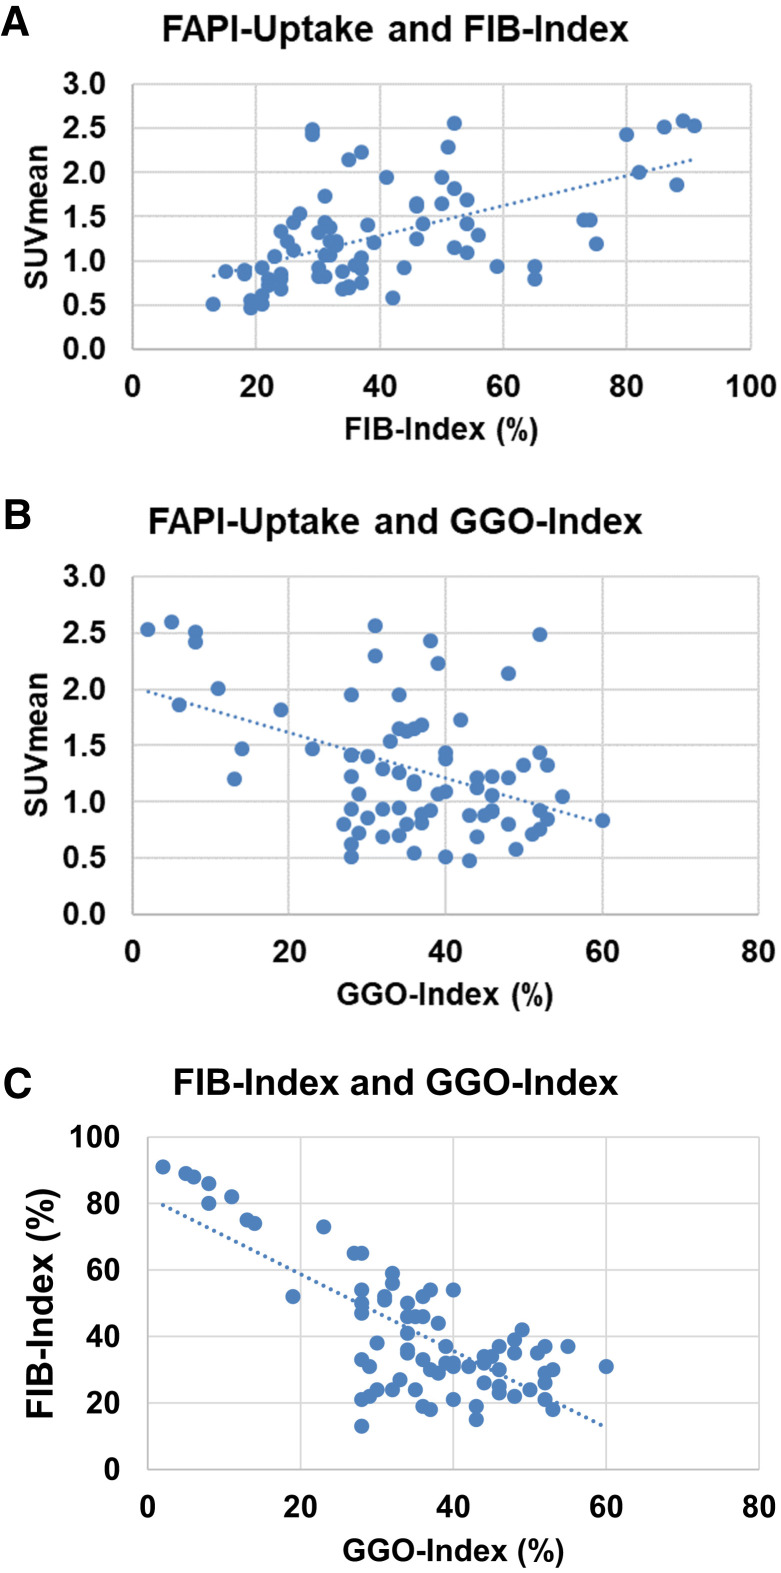
To correlate 68Ga-FAPI PET signal intensities with CT-morphology–based parameters, we correlated the SUVmean of 75 pulmonary lobes with corresponding FIB/GGO indices. Density-corrected SUVmean showed a moderately positive correlation (r = 0.57) with the FIB index (Fig. 4A). The correlations of SUVmean and GGO index were moderately negative (r = −0.44) (Fig. 4B). Additional quartilewise analysis of SUVmean and FIB/GGO indices also displayed these correlations (Supplemental Fig. 4). Analysis of SUVmax and FIB/GGO indices showed similar tendencies relative to the correlation of SUVmean and FIB/GGO indices but no strong or moderate correlations (r = 0.13 for SUVmax vs. FIB index and −0.19 for SUVmax vs. GGO index). Of note, the correlation of FIB index and GGO index was strongly negative (r = −0.75) in our dataset (Fig. 4C).
FIGURE 4.
(A and B) Scatterplots of SUVmean derived from 68Ga-FAPI PET/CT and corresponding FIB indices (A) and GGO indices (B) in 75 lobe volumes of 15 patients with fILD and suspected LC. (C) Scatterplot of FIB indices and GGO indices of same lobe volumes.
Immunohistochemistry of Human fILD Biopsies
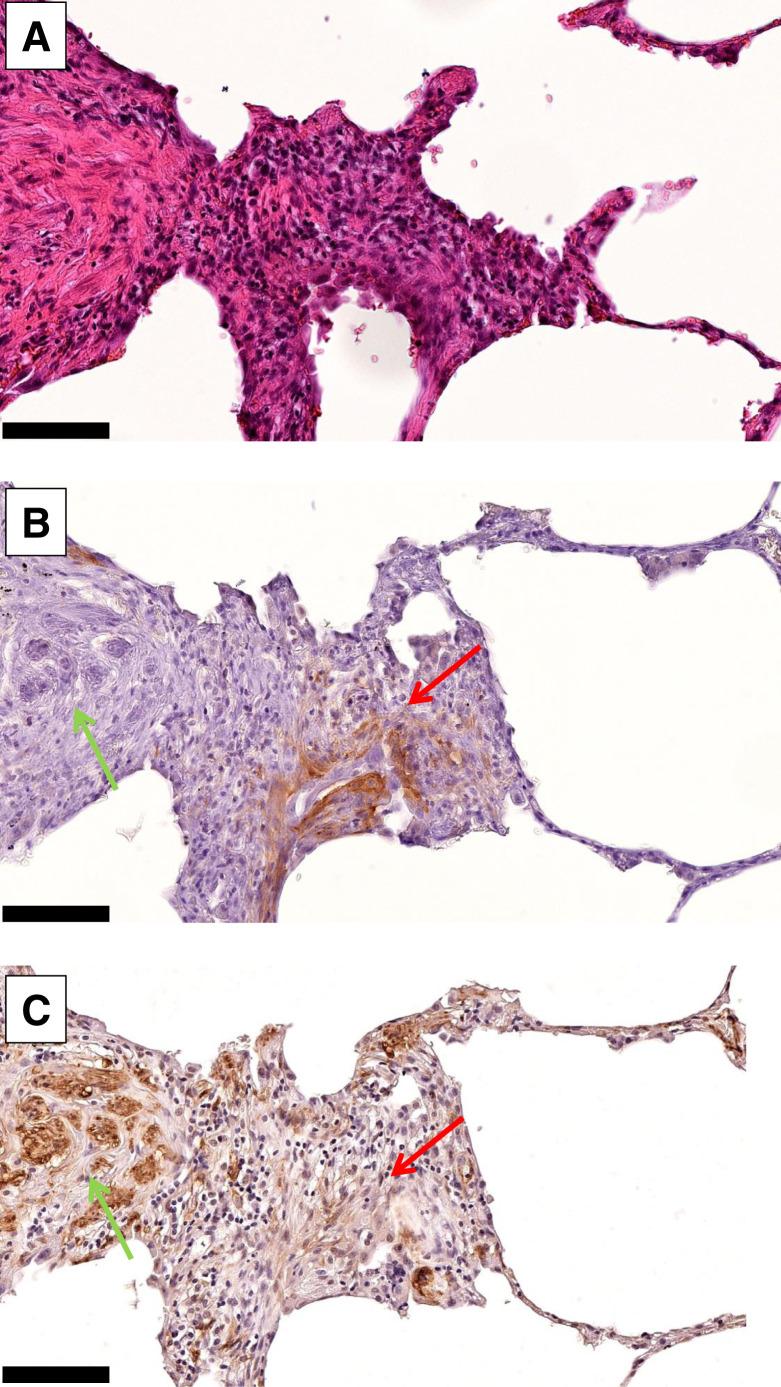
In human fILD sections, we observed FAP-positive areas in the transition zone between healthy lung tissue and fibrotic areas. FAP-positive cells and α-SMA–positive cells were widely inversely distributed within the fibrotic sections. Of note, blood vessels in the fibrotic areas were FAP-negative. Figures 5A–5C show exemplary images of a FAP-positive fibrotic spot in a biopsy punch.
FIGURE 5.
Hematoxylin and eosin staining (A), FAP immunohistochemistry (B), and α-SMA immunohistochemistry (C) of exemplary FAP-positive spot in fILD lesion of 71-y-old (at time of biopsy) man with IPF, who was diagnosed with small cell lung carcinoma after 68Ga-FAPI PET/CT. High FAP expression (red arrows) and high α-SMA expression (green arrows) are widely inversely distributed in fibrotic tissue (×20; scale bars, 50 μm).
FAP Expression in Fibrotic Lungs of Nedd4-2−/− Mice
Immunohistochemistry of whole lung sections of Nedd4-2−/− mice with IPF-like lung disease showed differential expression of FAP in fibrotic lesions and in healthy lung parenchyma. Although healthy lung parenchyma showed low FAP expression, fibrotic areas showed inhomogeneous FAP positivity (Supplemental Fig. 5A). Next to perivascular FAP positivity (Supplemental Fig. 5B), we found FAP overexpressed predominantly in the transition zone to normal parenchyma (Supplemental Fig. 5C), similarly to the expression in human fILD tissue.
DISCUSSION
Potential Role of 68Ga-FAPI PET/CT in the Management of fILD
Our results show that 68Ga-FAPI PET/CT can be used to visualize fibrotic areas and LC lesions in patients with fILD. A potential role for 68Ga-FAPI PET/CT in the management of fILD, particularly as a potential prognosticator and way to evaluate response to therapy, should be evaluated. Of special interest will be determining which beneficial information 68Ga-FAPI PET/CT may add to the gold standard modality CT and to 18F-FDG PET/CT. With respect to CT, we observed a positive correlation between 68Ga-FAPI signal intensities and the CT-based FIB index, indicating that 68Ga-FAPI PET and CT are, in principle, comparable in the detection of fILD. A potential benefit of 68Ga-FAPI PET/CT over CT could be the distinction between inactive and activated, progressive fibrosis, as suggested by Figure 2. 18F-FDG PET/CT has frequently been applied in patients with fILD (13,33,39). 18F-FDG PET/CT is of prognostic value for fILD patients (13,15). However, it has recently been demonstrated that 18F-FDG uptake does not change after therapy with the antifibrotic drugs nintedanib or pirfenidone and that 18F-FDG uptake cannot predict treatment response (33). As 68Ga-FAPI PET does not display elevated glucose metabolism but visualizes reactive fibroblasts (a key player in fibrosis), 68Ga-FAPI PET may be more suitable for the imaging of fibrotic activity and the evaluation of therapy response than is 18F-FDG PET, which depicts only the inflammatory component (17,18). In a recent pilot study, Bergmann et al. could demonstrate in 21 patients with the fILD subtype systemic sclerosis–associated ILD that tracer accumulation in 68Ga-FAPI PET/CT is associated with disease progression independently of established predictors of progression and that 68Ga-FAPI uptake decreases after antifibrotic treatment (40). These findings strongly support the hypothesis that 68Ga-FAPI PET/CT imaging reflects fibrotic activity in fILD and therefore is an extremely promising imaging modality for this disease. For future systematic evaluation of 68Ga-FAPI PET/CT for fILDs, preclinical experiments that include treatment and evaluation of the therapy response must precede human studies. The Nedd4-2−/− mouse model could be useful for such experiments, as it showed 68Ga-FAPI–positive fibrotic pulmonary lesions with an expression pattern similar to that in human fILD. Next to imaging of the fibrotic process itself, 68Ga-FAPI PET/CT may serve as an excellent all-in-one monitoring tool for the detection of LC in fILD patients, as recent studies showed the value of 68Ga-FAPI PET/CT for the assessment of LC (26,41), and this value is confirmed by our data.
Imaging at Different Time Points
68Ga-FAPI PET/CT is a promising imaging modality both for malignancies and for nontumorous conditions. However, to date, the optimal time point for acquisition of 68Ga-FAPI PET/CT images is not clear. In our study, we observed the highest tracer uptake by LC and fibrotic lesions at the earliest time point (10 min) and a decreasing uptake after 60 and 180 min. However, the TBR of LC tended to increase over time, and fibrotic lesions showed a relatively stable TBR over time. This finding indicates that washout is slower in LC lesions than in lung tissue and that the washout kinetics in the fibrotic lesions and in lung tissue do not differ significantly. These findings are in line with our recently published study in which we evaluated 68Ga-FAPI uptake over time in pancreatic ductal adenocarcinomas and pancreatitis (27). There, over time, we observed slightly decreasing uptake but increasing TBRs in the tumors and decreasing uptake in the pancreatitis. The results of these studies on tumors and chronic inflammatory or fibrotic processes indicate that imaging and analysis of TBR at different time points could be helpful for discriminating between malignant and chronic inflammatory or fibrotic 68Ga-FAPI–positive lesions.
Dynamic Imaging
Next to imaging at different time points, dynamic PET imaging can deliver important information additional to that from static PET imaging, as it allows evaluating tracer uptake over time and washout processes for the characterization of PET-positive lesions. In brain tumor imaging with amino acid tracers, dynamic imaging is of great value for the differentiation of low-grade versus high-grade tumors and progress versus pseudoprogression (42,43). In this project, we published the first (to our knowledge) clinical experiences with dynamic 68Ga-FAPI PET/CT—experiences that must be considered preliminary as they are based on a small number of patients. But 2 hypotheses can be generated from our dynamic data on LC and fILD.
The first thesis is that the peak of the uptake in LC lesions is between about 10 and 30 min and that washout in the blood is relatively fast in the first minutes, after which the time–activity curve for the blood volume slowly decreases. Therefore, it seems likely that the optimal imaging time point with the highest SUVs and best TBR for tumor lesions could be significantly earlier than 60 min after injection, which has been used in most studies in analogy to the common acquisition time point in 18F-FDG PET/CT. Imaging time points later than 60 min after injection may lead to decreased SUVs but an even improved TBR. With respect to clinical practice, later time points are less favorable if the detection rate of tumor lesions is not better than at earlier time points. Analyses of the detection rates and TBR at different time points up to 180 min after injection are ongoing to define the optimal imaging time point for 68Ga-FAPI PET/CT.
The second thesis is that time–activity curves based on dynamic imaging data show that the activity in fibrotic lesions decreases relatively quickly, comparable to the activity decrease in the blood volume. In contrast, LC lesion activity peaked at about 10–30 min after injection and then slowly decreased over time. Thus, a significantly decreasing activity over time, within the first 40 min, may indicate that a lesion is more likely to be fibrotic than malignant, and a stable or only slightly decreasing activity may indicate that a lesion is more likely to be malignant.
Both theses need to be evaluated by future prospective dynamic 68Ga-FAPI PET/CT imaging studies that include higher numbers of individuals with malignant tumors and noncancer lesions.
Limitations
Despite the promising results of this analysis, several limitations must be mentioned. First, because the total number of patients, 15, was relatively small and the number of patients examined by dynamic 68Ga-FAPI PET/CT was only 3, our data must be considered preliminary and conclusions can be drawn only with caution. Another major limitation is that there was a certain heterogeneity in the patient population because we included various types of fILDs. However, many fILDs have detrimental outcomes similar to those of IPF when it comes to a progressive phenotype, thus underscoring the need to visualize disease activity in fILDs. Moreover, subgroup analysis (68Ga-FAPI uptake and TBR of IPF vs. other fILDs, Supplemental Fig. 3) of our dataset showed no significant differences between different types of ILDs. Nevertheless, our results need confirmation by studies with larger cohorts of ILD patients. Next, the patients underwent 68Ga-FAPI PET/CT but not a corresponding 18F-FDG PET/CT study, as 2 PET/CT examinations using ionizing radiation were not possible in the clinical setting of this project. Nevertheless, a systematic intraindividual comparison of 68Ga-FAPI PET/CT and 18F-FDG PET/CT in fILD would be an interesting and relevant topic for future studies, especially as previous studies showed significant differences between these 2 tracers for the evaluation of malignant and nonmalignant diseases (18,41,44). Another limitation is that biopsies of fILD tissue significantly preceded 68Ga-FAPI PET imaging; we therefore could not determine whether there was a correlation between 68Ga-FAPI PET signal intensities and immunohistochemical expression of FAP. 68Ga-FAPI–guided biopsies of fILD tissue and radiologic–pathologic correlations would be a promising approach for future studies on 68Ga-FAPI PET in fILD.
CONCLUSION
68Ga-FAPI PET/CT is a promising new imaging modality for fILD and LC displaying activated fibroblasts that are involved in fibrotic processes, as well as in desmoplastic reactions in tumors. Imaging at different time points and dynamic imaging provide additional information on tracer kinetics and may be helpful for discriminating malignant from nonmalignant 68Ga-FAPI–positive lesions. The clinical value of 68Ga-FAPI PET/CT for fILD as a potential predictor of prognosis and therapy response should be evaluated in future studies.
DISCLOSURE
This work was funded by the Federal Ministry of Education and Research, grant 13N 13341. Uwe Haberkorn, Clemens Kratochwil, and Frederik Giesel have filed a patent application for quinoline-based FAP-targeting agents for imaging and therapy in nuclear medicine and have shares of a consultancy group for iTheranostics. No other potential conflict of interest relevant to this article was reported.
KEY POINTS.
QUESTION: Is 68Ga-FAPI PET/CT a potential new imaging method for patients with fibrotic interstitial diseases?
PERTINENT FINDINGS: We did a retrospective analysis of 68Ga-FAPI PET imaging of 15 patients with fILD and suspected LC. Fibrotic areas and tumor lesions both showed elevated 68Ga-FAPI uptake but had different tracer kinetics.
IMPLICATIONS FOR PATIENT CARE: 68Ga-FAPI PET/CT is a promising imaging method for patients with fILDs and should be further investigated.
REFERENCES
- 1. Travis WD, Costabel U, Hansell DM, et al.An official American Thoracic Society/European Respiratory Society statement: update of the international multidisciplinary classification of the idiopathic interstitial pneumonias. Am J Respir Crit Care Med. 2013;188:733–748. [DOI] [PMC free article] [PubMed] [Google Scholar]
- 2. Behr J, Prasse A, Wirtz H, et al.Survival and course of lung function in the presence or absence of antifibrotic treatment in patients with idiopathic pulmonary fibrosis: long-term results of the INSIGHTS-IPF registry. Eur Respir J. 2020;56:1902279. [DOI] [PubMed] [Google Scholar]
- 3. George PM, Spagnolo P, Kreuter M, et al.Progressive fibrosing interstitial lung disease: clinical uncertainties, consensus recommendations, and research priorities. Lancet Respir Med. 2020;8:925–934. [DOI] [PubMed] [Google Scholar]
- 4. Raghu G, Collard HR, Egan JJ, et al.An official ATS/ERS/JRS/ALAT statement: idiopathic pulmonary fibrosis—evidence-based guidelines for diagnosis and management. Am J Respir Crit Care Med. 2011;183:788–824. [DOI] [PMC free article] [PubMed] [Google Scholar]
- 5. Richeldi L, Collard HR, Jones MG. Idiopathic pulmonary fibrosis. Lancet. 2017;389:1941–1952. [DOI] [PubMed] [Google Scholar]
- 6. Ley B, Collard HR, King TE, Jr. Clinical course and prediction of survival in idiopathic pulmonary fibrosis. Am J Respir Crit Care Med. 2011;183:431–440. [DOI] [PubMed] [Google Scholar]
- 7. Raghu G, Remy-Jardin M, Myers JL, et al.Diagnosis of idiopathic pulmonary fibrosis: an official ATS/ERS/JRS/ALAT clinical practice guideline. Am J Respir Crit Care Med. 2018;198:e44–e68. [DOI] [PubMed] [Google Scholar]
- 8. Zamora-Legoff JA, Krause ML, Crowson CS, Ryu JH, Matteson EL. Progressive decline of lung function in rheumatoid arthritis-associated interstitial lung disease. Arthritis Rheumatol. 2017;69:542–549. [DOI] [PMC free article] [PubMed] [Google Scholar]
- 9. Hoffmann-Vold AM, Allanore Y, Alves M, et al.Progressive interstitial lung disease in patients with systemic sclerosis-associated interstitial lung disease in the EUSTAR database. Ann Rheum Dis. 202;80:219–227. [DOI] [PMC free article] [PubMed] [Google Scholar]
- 10. Guler SA, Ellison K, Algamdi M, Collard HR, Ryerson CJ. Heterogeneity in unclassifiable interstitial lung disease: a systematic review and meta-analysis. Ann Am Thorac Soc. 2018;15:854–863. [DOI] [PubMed] [Google Scholar]
- 11. Kreuter M, Ehlers-Tenenbaum S, Palmowski K, et al.Impact of comorbidities on mortality in patients with idiopathic pulmonary fibrosis. PLoS One. 2016;11:e0151425. [DOI] [PMC free article] [PubMed] [Google Scholar]
- 12. Hansell DM, Goldin JG, King TE, Jr, Lynch DA, Richeldi L, Wells AU. CT staging and monitoring of fibrotic interstitial lung diseases in clinical practice and treatment trials: a position paper from the Fleischner Society. Lancet Respir Med. 2015;3:483–496. [DOI] [PubMed] [Google Scholar]
- 13. Win T, Screaton NJ, Porter JC, et al.Pulmonary 18F-FDG uptake helps refine current risk stratification in idiopathic pulmonary fibrosis (IPF). Eur J Nucl Med Mol Imaging. 2018;45:806–815. [DOI] [PMC free article] [PubMed] [Google Scholar]
- 14. Win T, Thomas BA, Lambrou T, et al.Areas of normal pulmonary parenchyma on HRCT exhibit increased FDG PET signal in IPF patients. Eur J Nucl Med Mol Imaging. 2014;41:337–342. [DOI] [PMC free article] [PubMed] [Google Scholar]
- 15. Nobashi T, Kubo T, Nakamoto Y, et al. 18F-FDG uptake in less affected lung field provides prognostic stratification in patients with interstitial lung disease. J Nucl Med. 2016;57:1899–1904. [DOI] [PubMed] [Google Scholar]
- 16. Groves AM, Win T, Screaton NJ, et al.Idiopathic pulmonary fibrosis and diffuse parenchymal lung disease: implications from initial experience with 18F-FDG PET/CT. J Nucl Med. 2009;50:538–545. [DOI] [PubMed] [Google Scholar]
- 17. Luo Y, Pan Q, Yang H, Peng L, Zhang W, Li F. Fibroblast activation protein-targeted PET/CT with 68Ga-FAPI for imaging IgG4-related disease: comparison to 18F-FDG PET/CT. J Nucl Med. 2021;62:266–271. [DOI] [PubMed] [Google Scholar]
- 18. Hao B, Wu X, Pang Y, et al.[18F]FDG and [68Ga]Ga-DOTA-FAPI-04 PET/CT in the evaluation of tuberculous lesions. Eur J Nucl Med Mol Imaging. 2021;48:651–652. [DOI] [PubMed] [Google Scholar]
- 19. Kottmann RM, Kulkarni AA, Smolnycki KA, et al.Lactic acid is elevated in idiopathic pulmonary fibrosis and induces myofibroblast differentiation via pH-dependent activation of transforming growth factor-beta. Am J Respir Crit Care Med. 2012;186:740–751. [DOI] [PMC free article] [PubMed] [Google Scholar]
- 20. Bondue B, Sherer F, Van Simaeys G, et al.PET/CT with 18F-FDG- and 18F-FBEM-labeled leukocytes for metabolic activity and leukocyte recruitment monitoring in a mouse model of pulmonary fibrosis. J Nucl Med. 2015;56:127–132. [DOI] [PubMed] [Google Scholar]
- 21. Visscher DW, Myers JL. Histologic spectrum of idiopathic interstitial pneumonias. Proc Am Thorac Soc. 2006;3:322–329. [DOI] [PubMed] [Google Scholar]
- 22. Hamson EJ, Keane FM, Tholen S, Schilling O, Gorrell MD. Understanding fibroblast activation protein (FAP): substrates, activities, expression and targeting for cancer therapy. Proteomics Clin Appl. 2014;8:454–463. [DOI] [PubMed] [Google Scholar]
- 23. Egger C, Cannet C, Gerard C, et al.Effects of the fibroblast activation protein inhibitor, PT100, in a murine model of pulmonary fibrosis. Eur J Pharmacol. 2017;809:64–72. [DOI] [PubMed] [Google Scholar]
- 24. Lindner T, Loktev A, Altmann A, et al.Development of quinoline-based theranostic ligands for the targeting of fibroblast activation protein. J Nucl Med. 2018;59:1415–1422. [DOI] [PubMed] [Google Scholar]
- 25. Loktev A, Lindner T, Mier W, et al.A tumor-imaging method targeting cancer-associated fibroblasts. J Nucl Med. 2018;59:1423–1429. [DOI] [PMC free article] [PubMed] [Google Scholar]
- 26. Giesel FL, Kratochwil C, Lindner T, et al. 68Ga-FAPI PET/CT: biodistribution and preliminary dosimetry estimate of 2 DOTA-containing FAP-targeting agents in patients with various cancers. J Nucl Med. 2019;60:386–392. [DOI] [PMC free article] [PubMed] [Google Scholar]
- 27. Röhrich M, Naumann P, Giesel FL, et al.Impact of 68Ga-FAPI PET/CT imaging on the therapeutic management of primary and recurrent pancreatic ductal adenocarcinomas. J Nucl Med. 2021;62:779–786. [DOI] [PMC free article] [PubMed] [Google Scholar]
- 28. Kratochwil C, Flechsig P, Lindner T, et al. 68Ga-FAPI PET/CT: tracer uptake in 28 different kinds of cancer. J Nucl Med. 2019;60:801–805. [DOI] [PMC free article] [PubMed] [Google Scholar]
- 29. Loktev A, Lindner T, Burger EM, et al.Development of fibroblast activation protein-targeted radiotracers with improved tumor retention. J Nucl Med. 2019;60:1421–1429. [DOI] [PMC free article] [PubMed] [Google Scholar]
- 30. Röhrich M, Huang K, Schrimpf D, et al.Integrated analysis of dynamic FET PET/CT parameters, histology, and methylation profiling of 44 gliomas. Eur J Nucl Med Mol Imaging. 2018;45:1573–1584. [DOI] [PubMed] [Google Scholar]
- 31. Kratochwil C, Combs SE, Leotta K, et al.Intra-individual comparison of 18F-FET and 18F-DOPA in PET imaging of recurrent brain tumors. Neuro Oncol. 2014;16:434–440. [DOI] [PMC free article] [PubMed] [Google Scholar]
- 32. Jobst BJ, Weinheimer O, Trauth M, et al.Effect of smoking cessation on quantitative computed tomography in smokers at risk in a lung cancer screening population. Eur Radiol. 2018;28:807–815. [DOI] [PubMed] [Google Scholar]
- 33. Bondue B, Castiaux A, Van Simaeys G, et al.Absence of early metabolic response assessed by 18F-FDG PET/CT after initiation of antifibrotic drugs in IPF patients. Respir Res. 2019;20:10. [DOI] [PMC free article] [PubMed] [Google Scholar]
- 34. Holman BF, Cuplov V, Millner L, et al.Improved correction for the tissue fraction effect in lung PET/CT imaging. Phys Med Biol. 2015;60:7387–7402. [DOI] [PubMed] [Google Scholar]
- 35. Konietzke P, Weinheimer O, Wielputz MO, et al.Validation of automated lobe segmentation on paired inspiratory-expiratory chest CT in 8-14 year-old children with cystic fibrosis. PLoS One. 2018;13:e0194557. [DOI] [PMC free article] [PubMed] [Google Scholar]
- 36. Wielpütz MO, Eichinger M, Weinheimer O, et al.Automatic airway analysis on multidetector computed tomography in cystic fibrosis: correlation with pulmonary function testing. J Thorac Imaging. 2013;28:104–113. [DOI] [PubMed] [Google Scholar]
- 37. Duerr J, Leitz DHW, Szczygiel M, et al.Conditional deletion of Nedd4-2 in lung epithelial cells causes progressive pulmonary fibrosis in adult mice. Nat Commun. 2020;11:2012. [DOI] [PMC free article] [PubMed] [Google Scholar]
- 38. Röhrich M, Loktev A, Wefers AK, et al.IDH-wildtype glioblastomas and grade III/IV IDH-mutant gliomas show elevated tracer uptake in fibroblast activation protein-specific PET/CT. Eur J Nucl Med Mol Imaging. 2019;46:2569–2580. [DOI] [PubMed] [Google Scholar]
- 39. Fraioli F, Lyasheva M, Porter JC, et al.Synergistic application of pulmonary 18F-FDG PET/HRCT and computer-based CT analysis with conventional severity measures to refine current risk stratification in idiopathic pulmonary fibrosis (IPF). Eur J Nucl Med Mol Imaging. 2019;46:2023–2031. [DOI] [PMC free article] [PubMed] [Google Scholar]
- 40. Bergmann C, Jörg H W, et al. 68Ga-FAPI-04 PET-CT for molecular assessment of fibroblast activation and risk evaluation in systemic sclerosis-associated interstitial lung disease: a single-centre, pilot study. Lancet Rheumatol 2021;3:E185–E194. [DOI] [PubMed] [Google Scholar]
- 41. Chen H, Pang Y, Wu FAPJ, et al.Comparison of [68Ga]Ga-DOTA-FAPI-04 and [18F] FDG PET/CT for the diagnosis of primary and metastatic lesions in patients with various types of cancer. Eur J Nucl Med Mol Imaging. 2020;47:1820–1832. [DOI] [PubMed] [Google Scholar]
- 42. Langen KJ, Stoffels G, Filss C, et al.Imaging of amino acid transport in brain tumours: positron emission tomography with O-(2-[18F]fluoroethyl)-L-tyrosine (FET). Methods. 2017;130:124–134. [DOI] [PubMed] [Google Scholar]
- 43. Galldiks N, Lohmann P, Albert NL, Tonn JC, Langen KJ. Current status of PET imaging in neuro-oncology. Neurooncol Adv. 2019;1:vdz010. [DOI] [PMC free article] [PubMed] [Google Scholar]
- 44. Luo Y, Pan Q, Yang H, Peng L, Zhang W, Li F. Fibroblast activation protein-targeted PET/CT with 68Ga-FAPI for imaging IgG4-related disease: comparison to 18F-FDG PET/CT. J Nucl Med. 2021;62:266–271. [DOI] [PubMed] [Google Scholar]
- 45. Flaherty KR, Wells AU, Cottin V, et al.Nintedanib in progressive fibrosing interstitial lung diseases. N Engl J Med. 2019;381:1718–1727. [DOI] [PubMed] [Google Scholar]


