

Abstract

Recently, molecular dynamics (MD) simulations have been utilized to investigate the barrier properties of human skin stratum corneum (SC) lipid bilayers. Different MD methods and force fields have been utilized, with predicted permeabilities varying by few orders of magnitude. In this work, we compare constrained MD simulations with restrained MD simulations to obtain the potential of the mean force and the diffusion coefficient profile for the case of a water molecule permeating across an SC lipid bilayer. Corresponding permeabilities of the simulated lipid bilayer are calculated via the inhomogeneous solubility diffusion model. Results show that both methods perform similarly, but restrained MD simulations have proven to be the more robust approach for predicting the potential of the mean force profile. Critical to both methods are the sampling of the whole trans-bilayer axis and the following symmetrization process. Re-analysis of the previously reported free energy profiles showed that some of the discrepancies in the reported permeability values is due to misquotation of units, while some are due to the inaccurately obtained potential of the mean force. By using the existing microscopic geometrical models via the intercellular lipid pathway, the permeation through the whole SC is predicted from the MD simulation results, and the predicted barrier properties have been compared to experimental data from the literature with good agreement.
Introduction
Skin is the main barrier for protecting the human body from external agents. It regulates the body temperature and maintains the body homeostasis.1 The skin is subjected to a large variety of mechanical and chemical stresses, such as temperature, shear friction and pressure, airborne chemicals, and biological hazards like bacteria and viruses. The thickness of the human skin can be of more than 1 mm. However, most of its barrier ability resides in the outermost layer, namely the stratum corneum (SC), which consists of a thin (ca. 20 μm) layer of terminally differentiated cells, named corneocytes, embedded in a heterogeneous lipid matrix.2 The current state of the art indicates that the rate regulating step in percutaneous absorption is related to the characteristics of the lipid matrix where corneocytes are embedded.3
Electron microscopy (EM) studies show that intercorneocytes lipids are organised as stacked sheets parallelly surrounding the corneocyte cells with repeating lamellar patterns, known as the long and the short periodicity phases.4,5 These sheets contain mainly three lipid family types: ceramides, free fatty acids, and cholesterol, in roughly equimolar ratios.6,7 Despite the progress in exploiting different techniques, such as early X-ray diffraction8 or more recently cryo-EM,9 due to its complexity, the precise structure of the lipid lamellae is only partially known. In the last 50 years many models have been proposed to explain the low permeability and high flexibility of the SC lipid matrix.10−14 Lately, a combined approach of in silico simulations and experimental cryo-EM imaging suggested that the sheets are organised in lamellae with splayed ceramides and very low water content.15
The molecular mechanisms underlying the SC barrier property and how to regulate the permeation of selected chemicals have received wide attention from the scientific and industrial community in applications such as drug delivery, skin care, and environmental safety.16,17 Barrier properties, such as lipid/water partition coefficients and SC permeability to chemicals are studied extensively in vitro, ex vivo, and in vivo.18,19
Recently, molecular dynamics (MD) simulations have been used to simulate the SC lipid bilayer structure and investigate the role of the different lipid families. Ceramides have been found to be responsible for the low permeability and high rigidity of SC lipid bilayers.20−22 Free fatty acids favor tighter packing, increasing h-bonding especially among ceramides, while cholesterol fluidizes the membrane and increases the bilayer’s phase transition temperature.23
A main interest of MD simulation is to understand the molecular basis of skin barrier property. For this purpose, MD simulations have been exploited to obtain the potential of the mean force (ΔG), the trans-membrane diffusion coefficient (Dz), and the permeability (P) across lipid bilayer systems.20,24 In reported studies, both the simulated lipid bilayers and the simulation approaches varied, and significantly different values of predicted permeability have been reported.
Das et al.24 first used constrained MD simulations to predict the permeability of water across SC lipid bilayers. The bilayers of varying composition with ceramides in a hairpin conformation were simulated via a combination of the united-atom force field GROMOS-8725 and an additional set of force field parameters for the lipids.26,27 ΔG and Dz of water across the lipid bilayer were calculated via the potential of the mean constraint force (PMcF)28,29 and the Kubo relation,29,30 respectively. They also calculated the lateral diffusion coefficient of the permeating water molecule via the Einstein’s mean squared displacements (MSD) relation.31 They reported a value of permeability of P = 1.1 × 10⁻⁸ cm s–1 for a pure ceramide bilayer and a significantly increased P = 8.2 × 10⁻⁸ cm s–1 for an equimolar ceramide/cholesterol/lignoceric acid lipid bilayer, both at T = 350 K. Their pioneering study also suggests a decrease of 2 orders of magnitude of the permeability from 350 to 300 K, that is, a predicted permeability for an SC lipid bilayer of ca. 10–9 to 10–10 cm s–1 at physiologic temperature (ca. 305 K).
The same lipid bilayer system, forcefield, and simulation method were used by Del Regno and Notman,32 who studied the water permeation pathway through the SC lipid bilayers of equimolar composition at different hydration levels, and by Gupta et al.,33 who simulated the permeation of water across SC lipid bilayers of pure ceramides with different tail lengths. Del Regno and Notman32 reported a permeability P = 3.3 × 10⁻¹⁰ cm s–1 at T = 305 K for an equimolar SC lipid bilayer, coherently with the latterly reported permeability value from Das et al. However, Gupta et al.33 reported a value of P = 1.12 × 10⁻⁶ cm s–1 for a pure ceramide bilayer at T = 310 K.
Later, Gupta et al. extended their MD simulation to the permeation of other chemicals34 described via GROMOS-54a6/54a7 parameters.35 They predicted a permeability of P = 7.08 × 10⁻⁵ cm s–1 for water across an equimolar lipid bilayer in hairpin geometry at T = 310 K. The reported permeability values from Gupta et al. are 4 to 5 orders of magnitude higher than the values reported by Das et al. and by Del Regno and Notman.
Recently, Wang and Klauda36 reported MD simulations of ethanol permeation across pure ceramide bilayers of different tail lengths in a hairpin configuration using the all-atom CHARMM36 forcefield.37,38 ΔG and Dz were derived from restrained MD simulations via the weighted histogram analysis method (WHAM)39,40 and the position autocorrelation function (pACF) relation,41,42 respectively. They predicted permeability coefficient of P = 6.3 × 10⁻⁶ cm s–1 at T = 305 K for an ethanol molecule. Much of the reported MD simulations considered the short periodicity phase. Wang and Klauda43 also modeled the long periodicity phase of SC lipids, using the same forcefield and methods they reported earlier. The authors obtained a permeability value for an ethanol molecule of ca. P = 2 × 10⁻⁵ cm s–1 at T = 305 K. Their values agreed reasonably with that from Gupta et al.34 of P = 1.12 × 10⁻⁵ cm s–1 at T = 310 K despite the different techniques, system, and forcefield adopted.
The CHARMM36 forcefield was also used by Lundborg et al. to predict the permeability of water15 and other chemicals44 across several lipid bilayer systems with varying lipid ratios and hairpin or splayed ceramides. They used the forward–reverse method45,46 in steered MD simulations to derive both ΔG and Dz. For a water molecule at T = 303.15 K, they predicted the permeability value of P = 1.1 × 10⁻⁵ cm s–1 for an equimolar lipid-ratio hairpin bilayer, of the same order of magnitude of that of Gupta et al.,33,34 and of P = 8.8 × 10⁻⁹ cm s–1 for a splayed SC lipid bilayer model, albeit the lower permeability of the latter can be related to its different geometry and low water content.
These differences in predicted barrier properties motivated us to evaluate the MD methods for the prediction of permeability by using the same bilayer system. It is worth pointing out that many methods have been developed over the years to simulate a lipid bilayer, differing in the type of bias applied and in how the solute crosses the bilayer. Examples include steered MD methods based on the fluctuation theorem,47,48 nonequilibrium relationships,45 and accelerated sampling techniques.49 Notably, with the growing computational power simulations have been also reported on the permeability with unbiased MD simulations, based on induced concentration gradients and/or particular counting techniques.50,51 In this work, we focused on two of the most common approaches, the constrained and restrained MD simulations, reported for the SC lipid bilayer permeability prediction.
We first compared two different approaches to calculate ΔG, namely (i) the PMcF method and (ii) the WHAM. The Bennett acceptance ratio (BAR)52 is used as a benchmark to evaluate free energy profiles’ convergence. We then compared two methods for calculating the trans-lipid bilayer diffusion coefficient Dz, namely (i) the Kubo relation and (ii) the pACF relation. In addition, we tested the MSD method for the lateral diffusion coefficient. Results are obtained for the same reference system of a water molecule permeating across an equimolar SC lipid bilayer with hairpin ceramides described in CHARMM36.
Methods
Generation of the Starting Bilayer System
The SC lipid bilayer is modeled as an equimolar system of lignoceric acid (FFA), ceramide CER [NS] 24:0/18:1 (CER), and cholesterol (CHOL). This configuration has been extensively used in previous modeling studies.24,32,34,53,54 Ceramides are in a hairpin configuration. The system has water molecules on both sides of the hydrophilic heads at the ratio of roughly 30 water molecules per lipid.
All MD simulations are carried out using GROMACS2018.3.55 The CHARMM36 forcefield is used for lipid molecules.37,38 CHARMM TIP3P (mTIP3P)56 parameters are used for water. The initial configuration is built using CHARMM-GUI,57 and it is composed of 150 lipids (50 CER, 50 FFA, and 50 CHOL), equally divided in two leaflets, and 4500 water molecules. The final size of the box after equilibration is ca. 5 × 5 × 11 nm3.
3D periodic boundary conditions are used. The time step is 2 fs. Electrostatic and van der Waals interactions are calculated via the PME method58 with a cutoff distance of 1.2 nm and a smooth force-switch from 1 nm to 1.2 nm for van der Waals interactions. Energy and pressure long-range dispersion corrections are off. H-bonds are constrained using the LINCS algorithm.59 Temperature is set to T = 303.15 K and is controlled via a Berendsen thermostat60 with a time constant of 0.2 ps during equilibration runs. It is then changed to a Nose–Hoover thermostat61 for production runs with a time constant of 2.0 ps. Lipids and water are coupled separately to the thermostat. Pressure is controlled by a semi-isotropic Berendsen barostat with a time constant of 1 ps during equilibration and then by a Parrinello–Rahman semi-isotropic barostat62 during the production run with a time constant of 5 ps, compressibility of 4.5 × 10⁻⁵ bar –1, and pressure of 1 atm.
The first equilibration runs are provided by CHARMM-GUI and run in GROMACS. They consist of an energy minimization via a steepest descent algorithm and a series of short (2.5–5 ns) NVT and NpT runs where the position restraints on lipids are gradually turned off. Finally, a NpT unconstrained production run of 250 ns is executed at T = 303.15 K and 1 atm. The obtained system configuration is compared with the literature to assess the reach of equilibrium (Figure S1). The last frame of the production run, shown in Figure 1, is used as the starting configuration for the different computational methods tested.
Figure 1.

Last frame of the equimolar lipid bilayer system at a 250 ns unconstrained MD simulation. Molecules are represented via their van der Waals radii. Colour legend: oxygen (red), hydrogen (white), nitrogen (blue), and carbon atoms for CHOL (orange), CER (green), and FFA (violet).
Set-Up of Starting Configurations
Using the equilibrated bilayer system (Figure 1) as the starting configuration, a number of MD simulations using the constrained and restrained MD approaches have been conducted, as summarised in Figure 2. The reaction coordinate (RC) is the trans-bilayer axis z with the origin at bilayer’s center of mass (COM). In both constrained and restrained MD simulations, the RC is first split into sections or windows. In each simulation, a water molecule is inserted in a window, and its COM is constrained or restrained along the RC. Following an initial equilibration run, the force acting on the permeant’s COM and its position are collected. In postprocessing, the results from sampling all the windows are combined into global ΔG and Dz profiles.
Figure 2.
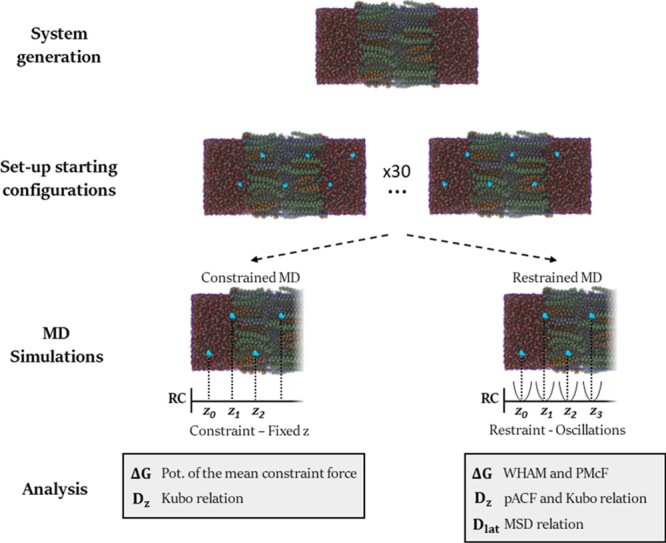
Schematic of the different approaches used to calculate ΔG, Dz, and Dlat. The molecules are represented via their van der Waals radii. Colour legend: oxygen (red), hydrogen (white), nitrogen (blue), and carbon atoms for CHOL (orange), CER (green), and FFA (violet). The system is partially transparent to better show the inserted water molecules (in cyan), which are at different depths.
In this work, the total RC length sampled is 9 nm which corresponds to ninety 0.1 nm equally spaced windows. This length is enough to ensure that the whole bilayer and bulk water regions are explored. To speed up the sampling, each simulation contains six inserted water molecules. The distance among these molecules is at least 1.5 nm, which is greater than the real space electrostatics cutoff. To achieve better statistics, the whole trans-bilayer axis is sampled.63 A set of 30 simulation configurations is built in total to cover the RC twice while maintaining the minimum 1.5 nm distance among the positioned permeant molecules.
Water molecules are inserted at a given z position and displaced on x and y by scaling their van der Waals radii to 25% via GROMACS command gmx insert-molecules. Coulomb and van der Waals interactions are turned on in four sets of 50 ps energy minimization/NVT/NpT batch simulations with a coupling constant λ = 0.25, 0.5, 0.75, and 1.0, respectively, where λ = 1 corresponds to fully restored interactions.
Constrained MD Simulations
In constrained MD simulations, the COM of the inserted water molecules is constrained by specifying constraint as a pull coordinate type in GROMACS. The constrained MD simulations are conducted for the whole set of 30 lipid bilayer configurations, and each one is run for 40 ns. The z component of the force acting on the COM of the water molecules is collected every step (0.002 ps), and the force average is calculated every five steps (0.01 ps). The system coordinates are stored every 100 steps (0.2 ps). To investigate the effect of longer equilibrium times, an additional simulation set of 40 ns length is collected using as a starting point the simulations’ final frames after 100 ns of restrained MD equilibration run (see next section).
ΔG is derived via the PMcF method using the equation as below28,29
| 1 |
where ⟨F(z)⟩t is the time average of the force acting on the permeant’s COM at z. The integral is computed by starting from a reference point zout outside the membrane in a bulk solution.
Because the force average ⟨F(z)⟩t can be noisy in the first nanoseconds, the value is estimated by discarding the first half of the curve and averaging on the second half. The procedure is repeated for every window in each simulation. Eventually, all the values are collected and binned, and errors are estimated by taking average and standard deviation of the mean of values falling in the same bin. Finally, ΔG is derived via eq 1 by numerically integrating the obtained curve via the trapezium rule. The error on ΔG is calculated by propagating the variance of the average force profile through the integration.
Dz is derived from the Kubo relation via the following equation29,30,64
| 2 |
where δF(z0, t) = F(z0, t) – ⟨F(z0)⟩t is the force ACF and R is the universal gas constant.
The force ACF is calculated over the first 5 ns of a production run via the GROMACS′ tool gmx analyze and then numerically integrated with the trapezium rule. As for ΔG, the calculated values are binned, and errors are estimated by taking the average and the standard deviation of the mean of values falling in the same bin.
ΔG and Dz are calculated as reported for both the collected data sets, that is, with and without longer equilibration times.
Restrained MD Simulations
In restrained MD simulations, the COM of the inserted water molecules is restrained via a harmonic potential with a force constant of k = 1000 kJ mol–1 nm–2. The restrained MD simulations are conducted for the whole set of 30 lipid bilayer configurations. Each configuration of the lipid bilayer systems set is run for 140 ns. The z component of the force acting on the COM of the water molecules and their z positions are collected every five steps (0.01 ps). The coordinates of the system are stored every 100 steps (0.2 ps).
ΔG is derived via the weighted histogram method (WHAM).65,66 The first 100 ns of data are discarded as equilibration and the profile is eventually derived from the last 40 ns via the GROMACS tool gmx wham67 (Figures S5 and S6). Errors are calculated by bootstrapping the data 100 times.
Dz is derived via the pACF method as41,42
| 3 |
where δz(t) = z(t) – ⟨z⟩t is the position ACF and var(z) is the variance of z position data.
The Kubo relation from eq 2 have been used in SC MD studies only with constrained MD simulations.24,32−34 In this work, we investigate its applicability also to restrained MD studies.
To study the effect of long equilibration times on Dz profiles, two data sets are extracted from the 140 ns restrained MD simulations. The first one is extracted from the first 5 ns (0 to 5 ns) and the second one is extracted after 100 ns of additional equilibrium time (100 to 105 ns). Both Kubo and position-ACF methods are applied on these data sets. Force and position ACFs are calculated via the GROMACS′ tool gmx analyze and numerically integrated with the trapezium rule to derive Dz via eqs 2 and 3, respectively.
To investigate the effect of the magnitude of the force constant k, two additional simulations are conducted by changing the constant to k = 4184 kJ mol–1 nm–2. The starting point is the first frame of the two extracted subsets. The run length is extended to 6 ns, where the first nanosecond is discarded as equilibration time. Values are then binned, and errors are estimated by taking the average and standard deviation of the mean of values falling in the same bin.
The lateral diffusion coefficient Dlat is derived via the MSD relations31 as
| 4 |
where N is the system’s dimension and r(t) the position of the permeant’s COM at time t. The average ⟨−⟩ is carried out over different molecules.
Dlat is calculated over the last 40 ns of the restrained MD production run. To achieve better statistics, the data of each molecule in each window is split into eight 5 ns sub-runs of which the last 10% is discarded to statistically decorrelate succeeding sub-runs. The time limit in eq 4 can be initially quite noisy, therefore, the first half of the MSD data is discarded, and the coefficient is calculated by averaging the second half. Calculated values are then binned, and errors estimated by taking the average and the standard deviation of the mean of values falling in the same bin.
BAR Simulations
To calculate the decoupling free energy of mTIP3P water, a cubic box of 4 nm edge is filled with 2200 water molecules circa. The box is energy minimized, followed by 100 ps NVT and 1 ns NpT simulations at T = 303.15 K and 1 atm to fully equilibrate the box. The Coulomb and van der Waals interactions of a single water molecule are then turned off by using the free energy module of GROMACS with a λ parameter switched from 1 (interactions on) to 0 (interactions off) in 20 subsequent steps of Δλ = 0.05. For every λ, the system is equilibrated before a 1 ns NpT production run.68 To calculate the decoupling energy of mTIP3P water from the lipid bilayer center, a water molecule is inserted at the position of the bilayer’s COM and restrained along z with a spring potential with k = 100 kJ mol–1 nm–2. The same procedure of decoupling water in the water box is followed. Additionally, the applied restraint is also turned off. The free energy difference is computed via the GROMACS gmx bar analysis module, which is based on the BAR method.52
Barrier Property Calculations
The permeability P of permeant across the lipid bilayer is calculated via the inhomogeneous solubility diffusion model as28,29
 |
5 |
where L is the thickness of the lipid bilayer. Errors on P are calculated by propagating the variance of ΔG and Dz through the integration.
To calculate the lipid/water partition coefficient Klip/wat into the lipid bilayer, the system is split along the RC into n = 90 slices, which correspond to the equispaced simulation windows. The contribution of each volume slice to the total partition coefficient is calculated from the free energy difference as69
| 6 |
where nlip and nwat are the total number of slices containing the lipid and the water phase, respectively, with n = nlip + nwat, and ΔG(zi) is the free energy difference at the RC position zi. The lipid/water phase separation is set for a threshold of |ΔG| > 0.2 kJ mol–1.69 The exact derivation of eq 6 is discussed in the Supporting Information.
The average diffusion coefficient across the lipid bilayer ⟨Dz⟩ is calculated as70
| 7 |
where L = 5 nm is the thickness of the lipid bilayer, here defined as the distance among the density peaks of the nitrogen atoms in the ceramide heads (Figure S1).
Analysis and Visualization Tools
An in-house python script code has been developed to calculate ΔG via PMcF, Dz via the Kubo and position-ACF relations, Dlat via MSD relation, and the resulting permeability P. The code is freely available for download and its usage is covered in the Supporting Information.
The lipid bilayer are visualized with VMD71 and images rendered via Tachyon.72 Data analysis of the bilayer structure is carried out using GROMACS, VMD, or MEMBLUGIN.73 Plots are prepared and exported via gnuplot74 or matplotlib in python3.75
Results and Discussion
Diffusion Coefficient Profiles
The Kubo relation has been tested on constrained MD simulations and restrained MD simulations with different harmonic force constants k. The relation, reported in eq 2, is based on the integration of the force ACF acting on the COM of the restrained/constrained water molecule. Figure 3 shows that the convergence of the force ACF depends on whether the water molecule is constrained or restrained and whether it is surrounded by water or lipids. In bulk water, the force ACF fully converged in less than 5 ps. However, it converged much more slowly in the bilayer region. In the restrained case with k = 1000 kJ mol–1 nm–2, the ACF convergence time reached 50 ps.
Figure 3.

Rate of convergence of the force ACFs for the Kubo relation from constrained and restrained MD simulations in (a) bulk water, (b) at the head region of the bilayer, and (c) between the two leaflets. The lines represent the normalized values of the force ACF for a water molecule restrained with a spring force constant of 1000 kJ mol–1 nm–2 (blue, dotted), 4184 kJ mol–1 nm–2 (orange, dashed), and constrained (green, dash-dotted).
Generally, higher spring constants lead to shorter convergence times. The force constraint can be seen, in fact, as the restraint limit for k → ∞, which has the fastest convergence rate and is the least noisy. A similar trend is expressed by the position ACF (results not reported), indicating that both forces and positions are similarly perturbed. All force and position ACFs decrease to 5% or less of their initial values after tint = 50 ps and are therefore considered as converged.
Figure 4 shows how the total integration time tint of the ACFs affects the Dz profiles calculated with both Kubo and pACF methods. No large significant differences have been found by comparing the perpendicular diffusion profiles obtained from different ACF-based methods, provided that the ACF integration reached the point of full ACF convergence. The same holds for the Dz profiles calculated on different data sets, that is, after 100 ns of equilibration (Figure S2).
Figure 4.

Effect of integration time tint on the transmembrane diffusion profile Dz obtained from restrained and constrained MD simulations. (a) Kubo relation from constrained, (b) Kubo relation from restrained, and (c) pACF method from restrained MD. Colour legend: tint = 10 ps (blue squares), 30 ps (orange circles), and 50 ps (green triangles). In the restrained cases k = 1000 kJ mol–1 nm–2.
Thus, ACFs do not require long equilibration times to be properly sampled. The force constant does not perturb the profile obtained but affects the rate of convergence of the ACFs. Both Kubo and pACF methods returned similar results. The Kubo relation can also be applied in restrained MD simulations, provided that the fully converged force ACF is integrated.
Figure 5 shows Dz for all the methods tested. All the profiles share the same quantitative behavior, that is, a steep reduction inside the leaflets (|z| ≤ 3 nm) that reaches a minimum in the ordered tail region (|z| ≈ 2 nm), followed by an increase in proximity of the bilayer’s center (z ≈ 0 nm).
Figure 5.

Transmembrane diffusion profile Dz obtained from the Kubo relation in constrained MD (blue squares), the Kubo relation in restrained MD (yellow circles), and the pACF relation in restrained MD (green triangles). ACFs are integrated for 50 ps and are derived from the first data set. The force constant of the spring restraint is k = 1000 kJ mol–1 nm–2.
The reason why Kubo and pACF methods in restrained MD simulations are similar is twofold. First, as discussed before, the force constant k has no influence on the diffusion values calculated for restrained MD simulations. The constrained can be regarded as a special case of the restrained MD simulations with k → ∞. Second, forces and positions are naturally correlated following the second Newton’s law in MD simulations. It is therefore expected that the corresponding force and position ACFs lead to the same qualitative behavior.
Figure 6a shows the time course of the lateral diffusion coefficient in bulk water, at the ordered tail region and at the tails from eq 4. The resulting Dlat profile obtained from restrained MD via the MSD method is shown in Figure 6b. Remarkably, the lateral diffusion profile Dlat resembles qualitatively the perpendicular diffusion profiles presented in Figure 5. The lateral diffusion coefficients in bulk regions are similar to the Dz from Kubo and pACF methods. In the bilayer region from the interface (|z| = 3 nm) to the head regions (|z| ≈ 2.5 nm), Dlat decreases and reaches a minimum in the ordered tails region (|z| ≈ 1.5 to 2 nm). Once in the interleaflet region (|z| ≈ 0 nm), which is in a liquid-crystalline disordered state, the lateral diffusion recovers the same order of magnitude of diffusion in bulk water.
Figure 6.

(a) Instantaneous Dlat values calculated from eq 4 for selected examples, in bulk water (blue), at bilayer’s COM (green), and in the ordered tail region (orange). Data before t = 2 ns is discarded as equilibration. (b) Full Dlat profile symmetrized and with error bars (standard deviation).
The experimental value for the self-diffusion of water is D ≈ 2.6 × 10⁻⁵ cm2 s–1 at T = 303.15 K76 but the mTIP3P water model adopted is known to overpredict it. The reported value for the self-diffusion of mTIP3P water at the same temperature is D ≈ 6.5 × 10⁻⁵ cm2 s–177 more than twice higher than the experimental value.
The average diffusion values in bulk water (|z| > 4 nm) for the methods tested are reported in Figure 7a. In general, Kubo and pACF methods give slightly lower values but compare well with the expected value for the selected water model in both constrained and restrained MD simulations.
Figure 7.

(a) Water self-diffusion constant DH2O obtained for the methods tested by averaging the profiles reported in Figures 5 and 6 for bulk water regions (|z| > 4 nm). The dashed black line is the self-diffusion for the mTIP3P water model.77 (b) Average perpendicular diffusion coefficient ⟨Dz⟩ from Figures 5 and 6 for the methods tested. The dashed black line is the value estimated with the model of Mitragotri.70
Recently, the self-diffusion of this same water model with the same forcefield via the pACF method was also compared to self-diffusion obtained via MSD, and the results were in excellent agreement.41 The value calculated via MSD in this work is slightly lower probably because of the small number of molecules used to compute the average in eq 4.
Experimental NMR measurements in phospholipids78 and mechanistic models of SC79−81 suggest that the lateral diffusion coefficient of water among lipid bilayers is lower than bulk water and higher than the perpendicular one. This is the case for all the perpendicular diffusion profiles obtained in this study with the different methods with respect to the lateral diffusion profile obtained via the MSD method.
For small solutes (<500 Da), Mitragotri proposed a model based on the scaled particle theory to calculate the average diffusion coefficient ⟨Dz⟩ across an SC lipid bilayer.70 For a water molecule (18.015 Da), the model predicts the value ⟨Dz⟩ ≈ 6.4 × 10⁻⁶ cm2 s–1. The values calculated via eq 7 by averaging Dz from Figure 5 for the different methods are shown in Figure 7b. Both the results calculated by constrained and restrained MD methods are lower but of the same order of magnitude with respect to the predicted value of Mitragotri’s model, indicating that the diffusive behavior is well represented by the MD simulation in the bilayer system. The values are lower because in Mitragotri’s model all directions are being averaged, while the MD results are obtained only in the trans-bilayer direction.
It is also worth noting from the next section that all ΔG profiles are flat at the bilayer center (see Figure 8), suggesting that in this region the lateral and perpendicular diffusion coefficients are similar. The condition is met by Dz for both Kubo and pACF methods.
Figure 8.

Potential of the mean force ΔG calculated via PMcF from constrained MD simulations (PMcF, blue squares) and via WHAM from restrained MD simulations (WHAM, orange triangles). The PMcF profile is taken from the second data set (longer equilibration time), both are symmetrized, and the bulk reference energy is set to zero. The arrow represents the free energy difference ΔGBAR calculated via BAR analysis.
Potential of the Mean Force Profiles
In general, the computational time needed to sample a smooth free energy profile is much longer than that required to sample the corresponding perpendicular diffusion coefficient. Here, the total run time of the restrained approach is ca. 4.5 μs exceeding that for the constrained simulation ca. 1.5 μs. Figure 8 reports ΔG for all the methods tested in this study. The total energy difference calculated via BAR is ΔGBAR = 30.48 ± 0.12 kJ mol–1 and is shown by the black arrow.
Both profiles via the PMcF method from constrained MD and WHAM from restrained MD share the same qualitative behavior, as in the previously cited literature. They have a global flat minimum in the bulk water region (|z| ≥ 3 nm), then sharply increase in the ordered tail region (|z| ≈ 1.5 nm) and decrease again in the interleaflet region (z ≈ 0 nm), reaching a local minimum. The trend of the ΔG profiles is the exact opposite of that of Dz and Dlat profiles (see Figures 5 and 6).
However, with respect to the bilayer’s COM (z ≈ 0 nm), ΔG calculated via the WHAM (ΔG(0) = 29.8 ± 1.7 kJ mol–1) in restrained MD simulations compares well with the value obtained via BAR analysis (ΔGBAR = 30.48 ± 0.12 kJ mol–1), but the PMcF method from the constrained MD simulations returned a systematically lower value (ca. −2.6 kJ mol–1 at |z| < 1 nm) of the free energy profile inside the bilayer.
It is worth noting that in this work the ΔG profile computed via the PMcF method largely depends on the symmetrization of the average force profile (Figures S3 and S4). In principle one could directly symmetrize ΔG but in this case it seems more appropriate to symmetrize the force average versus position curve and then integrate. Directly symmetrizing later ΔG would mean that eventual defects in the sampled windows are weighted throughout the integration of eq 1.
Moreover, the profile calculated via PMcF in constrained MD from the first data set (without equilibrium) shows a large skewness of ca. 10 kJ mol–1, which is not present anymore in the second data set after the equilibration (Figure S4). This means that, although the average values of force have reached a constant value, and therefore the sampling is deemed sufficient, there are still long-time relaxation mechanisms hindering the symmetry of the profile. The starting points of the second set for the constrained MD simulations are extracted after 100 ns of restrained MD, where the inserted water molecules had more freedom to rearrange in the bilayer and in turn the bilayer better adapted to the presence of the permeants. In this case, the obtained profile is reasonably symmetric, pointing at a better sampling of the underlying energy profile.
Another consideration which is seldomly overlooked is the inhomogeneity of the bilayer. In this work, several molecules have been placed at different xy positions for a given z (in different sampling windows) to better collect and then depict the average profiles along the transmembrane axis. This is a trade-off that must be accepted when using the inhomogeneous solubility diffusion model, which requires a homogeneous system along the xy plane for a given z, condition which is just a crude approximation in such mixed bilayers. In light of this, symmetrization seems even more appropriate to aid the statistics and average the properties sampled better. Nevertheless, it should be used reasonably and not as a tool to flat out unwanted details.
These criticalities also widely support why the whole RC should be explored before symmetrization. For example, if one had collected only half of the RC length from the first data set of constrained equilibrium simulations and then symmetrized to obtain the full profile, the resulting ΔG would be considerably different depending on which of the two halves was sampled.
Permeability and Partition Predictions
The permeability values P for a water molecule across the simulated SC lipid bilayer are derived by numerically integrating eq 5, where the lipid/water partition coefficients Klip/watMD are derived via eq 6. Both ΔG and Dz profiles are symmetrized. The second data set is used wherever applicable. The predicted values are collected in Table 1.
Table 1. Permeability P for a Water Molecule Across a SC Lipid Bilayer and Lipid/Water Partition Coefficient log10Klip/watMD Predicted by Different MD Simulation Methods.
| MD method | methods: ΔG + Dz | P (10–5 cm s–1) | log10Klip/watMD |
|---|---|---|---|
| constrained | PMcF + Kubo | 2.79 ± 0.52 | –0.88 ± 0.24 |
| restrained | WHAM + Kubo – 1k | 2.10 ± 0.39 | –0.86 ± 0.24 |
| restrained | WHAM + pACF – 1k | 1.89 ± 0.34 | –0.86 ± 0.24 |
Although the ΔG profiles are different inside the lipid bilayer, the predicted permeabilities are comparable, with the result from constrained MD higher than the restrained one coherently with its lower energy profile. This is due to the small energy difference (<1 kBT) in the highest energy regions of the lipid ordered tails (at |z| < 1 to 2 nm), which have the largest weight in the integration of eq 5, and the fact that restrained MD simulations predict on average slightly lower trans-bilayer Dz values (see Figure 7b).
Experimental lipid/water partition coefficient Klip/watexp in the SC have been reported in the literature and the data showed good correlation with its octanol/water partition coefficient Kow as
| 8 |
with α = 0.6918 or α = 0.70,70 where the multiplicative factor 0.9 keeps into account that water and lipids have different densities and that the partition is based on mass ratios.18
By considering that for water log10KOW = −1.38,82 from eq 8 follows that log10Klip/watexp ≈ −1.0. The predicted MD results from Table 1 are all higher but compatible with the expected partition coefficient. Note that the partition coefficients from the MD simulations in eq 6 scale as the inverse exponential of the free energy profile. Therefore, most of the contribution comes from the head region of the leaflets, that is from water molecules bound to the hydrophilic heads of the lipids. The ΔG profiles from both methods are identical in this region, leading to similar predicted partition coefficients.
Reported experimental values of the SC permeability to water PSC varied in the literature19,83 and the averaged value corresponds to ca. PSC ≈ 10–7 cm s–1. It should be made clear that it is not possible to directly compare lipid bilayers’ permeability from Table 1 to the permeability of the whole SC tissue.
One idealized assumption is to consider transdermal permeation happens only through the lipid matrix, which is composed by stacked bilayers of the same periodicity and without geometrical defects, and that bilayers are only crossed transversally. By taking into account an average of 80 lipid bilayers across the SC,36 the SC permeability P80 can be estimated from the MD simulation results by dividing the bilayer permeability P by a factor of 80. The values of P80 predicted by both restrained and constrained MD methods are reported in Table 2.
Table 2. Permeabilities for a Water Molecule Across the Whole SC Predicted by Different MD Simulation Methods.
| MD method | methods: ΔG + Dz | P80 (× 10–7 cm s–1) | PMitra (× 10–7 cm s–1) |
|---|---|---|---|
| constrained | PMcF + Kubo | 3.49 ± 0.65 | 1.07 ± 0.57 |
| restrained | WHAM + Kubo – 1k | 2.63 ± 0.49 | 1.91 ± 1.11 |
| restrained | WHAM + pACF – 1k | 2.36 ± 0.43 | 1.62 ± 0.94 |
A step further can be made by considering the mechanistic model of permeation proposed by Mitragotri70
| 9 |
which relates the skin permeability P of a small (<500 Da) solute with its lipid/water partition coefficient Klip/wat and the diffusion coefficient ⟨Dz⟩ across an SC lipid bilayer. Here, the product hτ* takes into account the SC lipid pathway tortuosity, and has been estimated to be ca. hτ* = 3.6 cm for the human skin.70 The values PMitra predicted by the different MD approaches are collected in Table 2 and are obtained by plugging in eq 9 the averaged diffusion coefficient from Figure 7b and the lipid/water partition coefficient from Table 1.
Despite the very crude approximations, the predicted permeabilities compare well with respect to the experimental value. Interestingly, the two results also compare well with each other, although the permeation processes considered are different. In the case of P80, the water molecule is crossing perpendicularly all the SC lipid bilayer to reach the viable epidermis. In the other case, the main diffusion process is parallel to the lipids, that is, the water molecule partitions into lipids and then follows the tortuous intercorneocyte lipid path described by the term hτ* in eq 9.
Comparison with the Previous Literature
As reported in the introduction, values in the MD computational literature for the permeability of a SC lipid bilayer to a water molecule span several orders of magnitude. To draw a meaningful comparison with previous published results, in Table 3 we collected the published values of permeability of a water molecule for a lipid bilayer system similar to that used in this work. All values are reported for the same temperature of T = 303 K (see also Table S1).
Table 3. Permeability Coefficients P for a Water Molecule Across a Hairpin SC Lipid Bilayer Collected from the Literaturea.
| model | P [cm s–1] | method | forcefield | ref |
|---|---|---|---|---|
| 1:0:0 | 5.4 × 10⁻¹⁰ | C | GR87 + BR | (24) |
| 1:0:0 | 5.9 × 10⁻⁷ | C | GR87 + BR | (33) |
| 1:1:1b | 1.1 × 10⁻⁵ | S | CHARMM36 | (15) |
| 1:1:1 | 4.0 × 10⁻⁹ | C | GR87 + BR | (24) |
| 1:1:1 | 2.7 × 10⁻¹⁰ | C | GR87 + BR | (32) |
| 1:1:1 | 3.7 × 10⁻⁵ | C | GR54a6/a7+BR | (34) |
| 2:2:1 | 4.9 × 10⁻⁹ | C | GR87 + BR | (24) |
All values are reported for T = 303 K by applying a temperature correction as in15,84 if needed (see Table S1 and related section for further comments). The model indicates system’s composition in terms of the molar ratio CER/CHOL/FFA, with CER [NS] 24:0/18:1, cholesterol, and protonated lignoceric acid. The method indicates the MD method used, constrained MD (C, PMcF + Kubo) and steered MD (S, forward–reverse method [43]). Forcefield abbreviations are: GROMOS-87 (GR87,25), GROMOS-54a6/a7 (GR54a6/a7,35), CHARMM36,37,38 and the Berger set for lipids (BR26), which also includes the parameters set for free fatty acids and cholesterol from ref (27).
Ceramide is CER [NP] 24:0/18:0.
The results can be split in two main groups. Das et al.24 and Del regno and Notman32 predicted permeabilities of ca. 10–9 to 10–10 cm s–1 for hairpin mixed bilayers. They both used constrained MD simulations to obtain both ΔG and Dz profiles. On the other hand, the same methods used by Gupta et al.34 and other steered MD methods exploited by Lundborg et al.15 led both groups to predicted permeabilities of ca. 10–5 cm s–1 for the same systems, that is, 4 to 5 orders of magnitude higher.
By assuming 80 stacked lipid bilayers across the SC as in foregoing section and by using the MD results for the 1:1:1 hairpin system from Gupta et al. and Lundborg et al., the corresponding SC permeabilities P80 are ca. P80 = 4.6 × 10⁻⁷ cm s–1 and P80 = 1.4 × 10⁻⁷ cm s–1, respectively. These results compare well with the experimental value of skin permeability of ca. 10–7 cm s–1. On the contrary, by using the MD simulation results for the 1:0:0 pure ceramide system of Gupta et al.,33 the obtained permeability is P80 = 7.4 × 10⁻⁹ cm s–1. It is worth noting that pure ceramide bilayers could be used as a limiting case because it is well known that intercorneocyte SC lipids also include cholesterol and free fatty acids in roughly equimolar ratios.3,5−7,85
The reported permeability results from Das et al.24 and Del Regno and Notman32 for a single 1:1:1 lipid bilayer are already lower than the experimental value of the whole SC. Use of their reported lipid bilayer permeability values of P ≈ 10–9 cm s–1 (Das et al.) and P = 3.3 × 10⁻¹⁰ cm s–1 (Del Regno and Notman), leads to P80 ≈ 10–11 cm s–1 and P80 = 3.4 × 10⁻¹² cm s–1, respectively. Those values are ca. 3 orders of magnitude lower than the experimental value. It is probably the unit was misquoted in the reported permeability results of Das et al.24 and Del Regno and Notman.32 We further performed digitization of the originally reported ΔG and Dz profiles and obtained lipid bilayer permeability of P = 4 × 10⁻⁵ cm s–1 for Das et al. and P = 3 × 10⁻³ cm s–1 for Notman and Del Regno, respectively (Table S1 and corresponding paragraph in the Supporting Information). The recalculated permeability values for both the mixed system (1:1:1) of Das et al. now agree with those reported by Gupta et al., Lundborg et al., and this work. However, the recalculated value of P = 2.7 × 10⁻³ cm s–1 of Del Regno and Notman is now 2 orders of magnitude higher. This mismatch might be due to the predicted ΔG, which in its higher regions is ca. 10 kJ mol–1 lower than those predicted by Das et al.,24 Gupta et al.34 and this work. This indicates the importance of the accuracy of the predicted ΔG profiles from MD simulations in predicting skin barrier property.
Conclusions
Several MD simulations of skin lipid bilayer systems have been reported but the corresponding reported values of trans-bilayer permeability varied by several orders of magnitude. In this work, we compared constrained and restrained MD simulation methods for predicting the barrier property of the skin lipid bilayer. An SC lipid bilayer with equimolar lipid ratios and hairpin ceramides is used and the permeability of the simulated bilayer system is examined for a water molecule via the inhomogeneous solubility diffusion model.
For the prediction of trans-bilayer water diffusion coefficients, restrained MD methods returned results in close agreement with the constrained MD ones. Notably, the Kubo relation has proved to be applicable in both constrained and restrained MD simulations. In general, the resulting profiles are not affected by the choice of the force constant k, provided that the fully converged ACF is integrated.
The potential of the mean force ΔG via the WHAM from restrained MD is generally higher than that via PMcF from constrained MD inside the bilayer region, although the shape is similar. Both profiles have tall thin peaks in correspondence of the high ordered tail region and significantly decrease among the leaflets. Direct comparison with BAR calculations indicate WHAM as the most precise approach for ΔG prediction, but computationally is also the most expensive.
A detailed analysis of permeability values from the MD literature have been conducted, and re-analysis of the reported profiles solved some of the discrepancies previously found. Overall, the predicted permeabilities from this work are in good agreement with other reported results, despite differences in the water model, forcefield, and/or MD approach.
The predicted partition and average diffusion coefficients agree with those expected from QSAR18 and mechanistic modeling.70 Strikingly, by considering the “brick-and-mortar” microstructure of the SC, the resulting permeabilities for the whole SC from MD simulation also compare well with the experimental results. However, it should be noted that the comparison with experimental data has been obtained for a hairpin lipid bilayer with a ternary lipid mixture in a fully hydrated configuration. Although the mixture is surely more realistic than a pure ceramide bilayer, the restricted lipid type pool necessarily constitutes a simplification of the real SC lipid composition, most notably with the absence of long-chained ceramides, e.g., CER [EOS], which play a role in the formation of SC inter-corneocyte lipid structures.86 The structure investigated, that is, the one of a classic lipid bilayer, is a good approximation of the short periodicity phase of SC lipids, but not of the long one, which is assumed to be in a splayed conformation and with a low water content,9,15,87 well below the fully hydrated limit implemented. Both lipid composition and structure could play a role in the final value of permeability obtained, and further studies with more complex structures and more realistic lipid compositions are needed to better unravel the complex mechanism behind SC lipid permeability.
In conclusion, although both constrained and restrained MD methods predicted similar permeabilities, this study suggests WHAM is the more robust for ΔG calculation. Recently, WHAM was found to give better predictions also with respect to other methods based on nonequilibrium thermodynamical relationships.88 Restrained MD data can then be equally coupled with the Kubo or the position ACF relations to evaluate Dz, and the bilayer’s permeability via the inhomogeneous solubility diffusion model.
Acknowledgments
This research has received funding from the European Union’s Horizon 2020 research and innovation programme under the Marie Skłodowska-Curie grant agreement no. 811965; project STINTS (Skin Tissue Integrity under Shear).
Glossary
Abbreviations
- ACF
autocorrelation function
- BAR
Bennett’s acceptance ration
- CER
ceramide
- CHOL
cholesterol
- COM
center of mass
- EM
electron microscopy
- FFA
free fatty acid
- MD
molecular dynamics
- MSD
mean squared displacements
- pACF
position autocorrelation function
- PMcF
potential of the mean constraint force
- RC
reaction coordinate
- SC
stratum corneum
- WHAM
weighted histogram method
Supporting Information Available
The Supporting Information is available free of charge at https://pubs.acs.org/doi/10.1021/acsomega.1c04684.
Python script to calculate lateral and perpendicular diffusion profiles and potential of the mean force via pACF, Kubo, MSD, and PMcF methods as explained in the main paper (TXT)
Check of system equilibration; derivation of partition coefficient; all diffusion, force and potential of the mean force profiles symmetrized and unsymmetrized for all the data sets; WHAM convergence; permeability data from the literature and temperature correction; and python script README (PDF)
The authors declare no competing financial interest.
Supplementary Material
References
- Madison K. C. Barrier function of the skin: “la raison d’etre” of the epidermis. J. Invest. Dermatol. 2003, 121, 231–241. 10.1046/j.1523-1747.2003.12359.x. [DOI] [PubMed] [Google Scholar]
- Berthaud F.; Boncheva M. Correlation between the properties of the lipid matrix and the degrees of integrity and cohesion in healthy human Stratum corneum. Exp. Dermatol. 2011, 20, 255–262. 10.1111/j.1600-0625.2010.01164.x. [DOI] [PubMed] [Google Scholar]
- Elias P. M.; Feingold K. R.. Skin barrier; CRC Press, 2005. [Google Scholar]
- Breathnach A. S.; Goodman T.; Stolinski C.; Gross M. Freeze-fracture replication of cells of stratum corneum of human epidermis. J. Anat. 1973, 114, 65–81. [PMC free article] [PubMed] [Google Scholar]
- Elias P. M. Structure and function of the stratum corneum extracellular matrix. J. Invest. Dermatol. 2012, 132, 2131–2133. 10.1038/jid.2012.246. [DOI] [PMC free article] [PubMed] [Google Scholar]
- Wertz P. W.; van den Bergh B. The physical, chemical and functional properties of lipids in the skin and other biological barriers. Chem. Phys. Lipids 1998, 91, 85–96. 10.1016/s0009-3084(97)00108-4. [DOI] [PubMed] [Google Scholar]
- McGrath J. A.; Eady R. A. J.; Pope F. M.. Anatomy and organization of human skin. Rook’s Textbook of Dermatology; Wiley-Blackwell, 2004; pp 3.1–3.15. [Google Scholar]
- Bouwstra J. A.; Gooris G. S.; van der Spek J. A.; Bras W. Structural investigations of human stratum corneum by small-angle X-ray scattering. J. Invest. Dermatol. 1991, 97, 1005–1012. 10.1111/1523-1747.ep12492217. [DOI] [PubMed] [Google Scholar]
- Iwai I.; Han H.; Hollander L. d.; Svensson S.; Öfverstedt L.-G.; Anwar J.; Brewer J.; Bloksgaard M.; Laloeuf A.; Nosek D.; Masich S.; Bagatolli L. A.; Skoglund U.; Norlén L. The human skin barrier is organized as stacked bilayers of fully extended ceramides with cholesterol molecules associated with the ceramide sphingoid moiety. J. Invest. Dermatol. 2012, 132, 2215–2225. 10.1038/jid.2012.43. [DOI] [PubMed] [Google Scholar]
- Norlen L. Skin barrier structure and function: the single gel phase model. J. Invest. Dermatol. 2001, 117, 830–836. 10.1046/j.1523-1747.2001.01463.x. [DOI] [PubMed] [Google Scholar]
- Bouwstra J.; Gooris G.; Ponec M. The lipid organisation of the skin barrier: liquid and crystalline domains coexist in lamellar phases. J. Biol. Phys. 2002, 28, 211–223. 10.1023/a:1019983715589. [DOI] [PMC free article] [PubMed] [Google Scholar]
- McIntosh T. J. Organization of skin stratum corneum extracellular lamellae: diffraction evidence for asymmetric distribution of cholesterol. Biophys. J. 2003, 85, 1675–1681. 10.1016/s0006-3495(03)74597-4. [DOI] [PMC free article] [PubMed] [Google Scholar]
- Swartzendruber D. C.; Wertz P. W.; Kitko D. J.; Madison K. C.; Downing D. T. Molecular models of the intercellular lipid lamellae in mammalian stratum corneum. J. Invest. Dermatol. 1989, 92, 251–257. 10.1111/1523-1747.ep12276794. [DOI] [PubMed] [Google Scholar]
- Forslind B. A domain mosaic model of the skin barrier. Acta Derm.-Venereol. 1994, 74, 1–6. 10.2340/000155557416. [DOI] [PubMed] [Google Scholar]
- Lundborg M.; Narangifard A.; Wennberg C. L.; Lindahl E.; Daneholt B.; Norlén L. Human skin barrier structure and function analyzed by cryo-EM and molecular dynamics simulation. J. Struct. Biol. 2018, 203, 149–161. 10.1016/j.jsb.2018.04.005. [DOI] [PubMed] [Google Scholar]
- Barry B. W. Breaching the skin’s barrier to drugs. Nat. Biotechnol. 2004, 22, 165–167. 10.1038/nbt0204-165. [DOI] [PubMed] [Google Scholar]
- Samson N.; Fink B.; Matts P. J. Visible skin condition and perception of human facial appearance. Int. J. Cosmet. Sci. 2010, 32, 167–184. 10.1111/j.1468-2494.2009.00535.x. [DOI] [PubMed] [Google Scholar]
- Wang L.; Chen L.; Lian G.; Han L. Determination of partition and binding properties of solutes to stratum corneum. Int. J. Pharm. 2010, 398, 114–122. 10.1016/j.ijpharm.2010.07.035. [DOI] [PubMed] [Google Scholar]
- Blank I. H.; Moloney J. 3rd; Emslie A. G.; Simon I.; Apt C. The diffusion of water across the stratum corneum as a function of its water content. J. Invest. Dermatol. 1984, 82, 188–194. 10.1111/1523-1747.ep12259835. [DOI] [PubMed] [Google Scholar]
- Notman R.; den Otter W. K.; Noro M. G.; Briels W. J.; Anwar J. The permeability enhancing mechanism of DMSO in ceramide bilayers simulated by molecular dynamics. Biophys. J. 2007, 93, 2056–2068. 10.1529/biophysj.107.104703. [DOI] [PMC free article] [PubMed] [Google Scholar]
- Pandit S. A.; Scott H. L. Molecular-dynamics simulation of a ceramide bilayer. J. Chem. Phys. 2006, 124, 14708. 10.1063/1.2140689. [DOI] [PubMed] [Google Scholar]
- Imai Y.; Liu X.; Yamagishi J.; Mori K.; Neya S.; Hoshino T. Computational analysis of water residence on ceramide and sphingomyelin bilayer membranes. J. Mol. Graphics Modell. 2010, 29, 461–469. 10.1016/j.jmgm.2010.09.002. [DOI] [PubMed] [Google Scholar]
- Gupta R.; Rai B. Molecular Dynamics Simulation Study of Skin Lipids: Effects of the Molar Ratio of Individual Components over a Wide Temperature Range. J. Phys. Chem. B 2015, 119, 11643–11655. 10.1021/acs.jpcb.5b02093. [DOI] [PubMed] [Google Scholar]
- Das C.; Olmsted P. D.; Noro M. G. Water permeation through stratum corneum lipid bilayers from atomistic simulations. Soft Matter 2009, 5, 4549–4555. 10.1039/b911257j. [DOI] [Google Scholar]
- Van Gunsteren W. F.; Berendsen H. J. C.. Gromos-87 manual. BIOMOS bv Nijenborgh, 1987; Vol. 4, p 9747.
- Berger O.; Edholm O.; Jähnig F. Molecular dynamics simulations of a fluid bilayer of dipalmitoylphosphatidylcholine at full hydration, constant pressure, and constant temperature. Biophys. J. 1997, 72, 2002–2013. 10.1016/s0006-3495(97)78845-3. [DOI] [PMC free article] [PubMed] [Google Scholar]
- Höltje M.; Förster T.; Brandt B.; Engels T.; von Rybinski W.; Höltje H.-D. Molecular dynamics simulations of stratum corneum lipid models: fatty acids and cholesterol. Biochim. Biophys. Acta, Biomembr. 2001, 1511, 156–167. 10.1016/S0005-2736(01)00270-X. [DOI] [PubMed] [Google Scholar]
- Berendsen H. J. C.; Marrink S.-J. Molecular dynamics of water transport through membranes: Water from solvent to solute. Pure Appl. Chem. 1993, 65, 2513–2520. 10.1351/pac199365122513. [DOI] [Google Scholar]
- Marrink S.-J.; Berendsen H. J. C. Simulation of water transport through a lipid membrane. J. Phys. Chem. 1994, 98, 4155–4168. 10.1021/j100066a040. [DOI] [Google Scholar]
- Kubo R. The fluctuation-dissipation theorem. Rep. Prog. Phys. 1966, 29, 255. 10.1088/0034-4885/29/1/306. [DOI] [Google Scholar]
- Einstein A.Investigations on the Theory of the Brownian Movement; Courier Corporation, 1956. [Google Scholar]
- Del Regno A.; Notman R. Permeation pathways through lateral domains in model membranes of skin lipids. Phys. Chem. Chem. Phys. 2018, 20, 2162–2174. 10.1039/c7cp03258g. [DOI] [PubMed] [Google Scholar]
- Gupta R.; Dwadasi B. S.; Rai B. Molecular Dynamics Simulation of Skin Lipids: Effect of Ceramide Chain Lengths on Bilayer Properties. J. Phys. Chem. B 2016, 120, 12536–12546. 10.1021/acs.jpcb.6b08059. [DOI] [PubMed] [Google Scholar]
- Gupta R.; Sridhar D. B.; Rai B. Molecular Dynamics Simulation Study of Permeation of Molecules through Skin Lipid Bilayer. J. Phys. Chem. B 2016, 120, 8987–8996. 10.1021/acs.jpcb.6b05451. [DOI] [PubMed] [Google Scholar]
- Schmid N.; Eichenberger A. P.; Choutko A.; Riniker S.; Winger M.; Mark A. E.; van Gunsteren W. F. Definition and testing of the GROMOS force-field versions 54A7 and 54B7. Eur. Biophys. J. 2011, 40, 843–856. 10.1007/s00249-011-0700-9. [DOI] [PubMed] [Google Scholar]
- Wang E.; Klauda J. B. Structure and Permeability of Ceramide Bilayers and Multilayers. J. Phys. Chem. B 2019, 123, 2525–2535. 10.1021/acs.jpcb.9b00037. [DOI] [PubMed] [Google Scholar]
- Klauda J. B.; Venable R. M.; Freites J. A.; O’Connor J. W.; Tobias D. J.; Mondragon-Ramirez C.; Vorobyov I.; MacKerell A. D. Jr.; Pastor R. W. Update of the CHARMM all-atom additive force field for lipids: validation on six lipid types. J. Phys. Chem. B 2010, 114, 7830–7843. 10.1021/jp101759q. [DOI] [PMC free article] [PubMed] [Google Scholar]
- Venable R. M.; Sodt A. J.; Rogaski B.; Rui H.; Hatcher E.; MacKerell A. D. Jr.; Pastor R. W.; Klauda J. B. CHARMM all-atom additive force field for sphingomyelin: elucidation of hydrogen bonding and of positive curvature. Biophys. J. 2014, 107, 134–145. 10.1016/j.bpj.2014.05.034. [DOI] [PMC free article] [PubMed] [Google Scholar]
- Torrie G. M.; Valleau J. P. Monte Carlo study of a phase-separating liquid mixture by umbrella sampling. J. Chem. Phys. 1977, 66, 1402–1408. 10.1063/1.434125. [DOI] [Google Scholar]
- Kästner J. Umbrella sampling. Wiley Interdiscip. Rev.: Comput. Mol. Sci. 2011, 1, 932–942. 10.1002/wcms.66. [DOI] [Google Scholar]
- Gaalswyk K.; Awoonor-Williams E.; Rowley C. N. Generalized Langevin Methods for Calculating Transmembrane Diffusivity. J. Chem. Theory Comput. 2016, 12, 5609–5619. 10.1021/acs.jctc.6b00747. [DOI] [PubMed] [Google Scholar]
- Woolf T. B.; Roux B. Conformational Flexibility of o-Phosphorylcholine and o-Phosphorylethanolamine: A Molecular Dynamics Study of Solvation Effects. J. Am. Chem. Soc. 1994, 116, 5916–5926. 10.1021/ja00092a048. [DOI] [Google Scholar]
- Wang E.; Klauda J. B. Molecular structure of the long periodicity phase in the stratum corneum. J. Am. Chem. Soc. 2019, 141, 16930–16943. 10.1021/jacs.9b08995. [DOI] [PubMed] [Google Scholar]
- Lundborg M.; Wennberg C. L.; Narangifard A.; Lindahl E.; Norlén L. Predicting drug permeability through skin using molecular dynamics simulation. J. Controlled Release 2018, 283, 269–279. 10.1016/j.jconrel.2018.05.026. [DOI] [PubMed] [Google Scholar]
- Kosztin I.; Barz B.; Janosi L. Calculating potentials of mean force and diffusion coefficients from nonequilibrium processes without Jarzynski’s equality. J. Chem. Phys. 2006, 124, 64106. 10.1063/1.2166379. [DOI] [PubMed] [Google Scholar]
- Chen L. Y. Nonequilibrium fluctuation-dissipation theorem of Brownian dynamics. J. Chem. Phys. 2008, 129, 144113. 10.1063/1.2992153. [DOI] [PMC free article] [PubMed] [Google Scholar]
- Crooks G. E. Entropy production fluctuation theorem and the nonequilibrium work relation for free energy differences. Phys. Rev. E: Stat. Phys., Plasmas, Fluids, Relat. Interdiscip. Top. 1999, 60, 2721–2726. 10.1103/physreve.60.2721. [DOI] [PubMed] [Google Scholar]
- Crooks G. E. Path-ensemble averages in systems driven far from equilibrium. Phys. Rev. E 2000, 61, 2361–2366. 10.1103/physreve.61.2361. [DOI] [Google Scholar]
- Lindahl V.; Lidmar J.; Hess B. Accelerated weight histogram method for exploring free energy landscapes. J. Chem. Phys. 2014, 141, 044110. 10.1063/1.4890371. [DOI] [PubMed] [Google Scholar]
- Krämer A.; Ghysels A.; Wang E.; Venable R. M.; Klauda J. B.; Brooks B. R.; Pastor R. W. Membrane permeability of small molecules from unbiased molecular dynamics simulations. J. Chem. Phys. 2020, 153, 124107. 10.1063/5.0013429. [DOI] [PMC free article] [PubMed] [Google Scholar]
- Ghorbani M.; Wang E.; Krämer A.; Klauda J. B. Molecular dynamics simulations of ethanol permeation through single and double-lipid bilayers. J. Chem. Phys. 2020, 153, 125101. 10.1063/5.0013430. [DOI] [PMC free article] [PubMed] [Google Scholar]
- Bennett C. H. Efficient estimation of free energy differences from Monte Carlo data. J. Comput. Phys. 1976, 22, 245–268. 10.1016/0021-9991(76)90078-4. [DOI] [Google Scholar]
- Wang E.; Klauda J. B. Simulations of Pure Ceramide and Ternary Lipid Mixtures as Simple Interior Stratum Corneum Models. J. Phys. Chem. B 2018, 122, 2757–2768. 10.1021/acs.jpcb.8b00348. [DOI] [PubMed] [Google Scholar]
- Das C.; Noro M. G.; Olmsted P. D. Simulation studies of stratum corneum lipid mixtures. Biophys. J. 2009, 97, 1941–1951. 10.1016/j.bpj.2009.06.054. [DOI] [PMC free article] [PubMed] [Google Scholar]
- Van Der Spoel D.; Lindahl E.; Hess B.; Groenhof G.; Mark A. E.; Berendsen H. J. C. GROMACS: fast, flexible, and free. J. Comput. Chem. 2005, 26, 1701–1718. 10.1002/jcc.20291. [DOI] [PubMed] [Google Scholar]
- MacKerell A. D. Jr.; Bashford D.; Bellott M.; Dunbrack R. L. Jr.; Evanseck J. D.; Field M. J.; Fischer S.; Gao J.; Guo H.; Ha S.; Joseph-McCarthy D.; Kuchnir L.; Kuczera K.; Lau F. T. K.; Mattos C.; Michnick S.; Ngo T.; Nguyen D. T.; Prodhom B.; Reiher W. E.; Roux B.; Schlenkrich M.; Smith J. C.; Stote R.; Straub J.; Watanabe M.; Wiórkiewicz-Kuczera J.; Yin D.; Karplus M. All-atom empirical potential for molecular modeling and dynamics studies of proteins. J. Phys. Chem. B 1998, 102, 3586–3616. 10.1021/jp973084f. [DOI] [PubMed] [Google Scholar]
- Wu E. L.; Cheng X.; Jo S.; Rui H.; Song K. C.; Dávila-Contreras E. M.; Qi Y.; Lee J.; Monje-Galvan V.; Venable R. M.; Klauda J. B.; Im W. CHARMM-GUI Membrane Builder toward realistic biological membrane simulations. J. Comput. Chem. 2014, 35, 1997–2004. 10.1002/jcc.23702. [DOI] [PMC free article] [PubMed] [Google Scholar]
- Darden T.; York D.; Pedersen L. Particle mesh Ewald: An N· log (N) method for Ewald sums in large systems. J. Chem. Phys. 1993, 98, 10089–10092. 10.1063/1.464397. [DOI] [Google Scholar]
- Hess B.; Bekker H.; Berendsen H. J. C.; Fraaije J. G. E. M. LINCS: a linear constraint solver for molecular simulations. J. Comput. Chem. 1997, 18, 1463–1472. . [DOI] [Google Scholar]
- Berendsen H. J. C.; Postma J. P. M.; van Gunsteren W. F.; DiNola A.; Haak J. R. Molecular dynamics with coupling to an external bath. J. Chem. Phys. 1984, 81, 3684–3690. 10.1063/1.448118. [DOI] [Google Scholar]
- Evans D. J.; Holian B. L. The nose–hoover thermostat. J. Chem. Phys. 1985, 83, 4069–4074. 10.1063/1.449071. [DOI] [Google Scholar]
- Parrinello M.; Rahman A. Polymorphic transitions in single crystals: A new molecular dynamics method. J. Appl. Phys. 1981, 52, 7182–7190. 10.1063/1.328693. [DOI] [Google Scholar]
- Lee C. T.; Comer J.; Herndon C.; Leung N.; Pavlova A.; Swift R. V.; Tung C.; Rowley C. N.; Amaro R. E.; Chipot C.; Wang Y.; Gumbart J. C. Simulation-based approaches for determining membrane permeability of small compounds. J. Chem. Inf. Model. 2016, 56, 721–733. 10.1021/acs.jcim.6b00022. [DOI] [PMC free article] [PubMed] [Google Scholar]
- Marrink S. J.; Berendsen H. J. C. Permeation process of small molecules across lipid membranes studied by molecular dynamics simulations. J. Phys. Chem. 1996, 100, 16729–16738. 10.1021/jp952956f. [DOI] [Google Scholar]
- Kumar S.; Rosenberg J. M.; Bouzida D.; Swendsen R. H.; Kollman P. A. The weighted histogram analysis method for free-energy calculations on biomolecules. I. The method. J. Comput. Chem. 1992, 13, 1011–1021. 10.1002/jcc.540130812. [DOI] [Google Scholar]
- Souaille M.; Roux B. Extension to the weighted histogram analysis method: combining umbrella sampling with free energy calculations. Comput. Phys. Commun. 2001, 135, 40–57. 10.1016/s0010-4655(00)00215-0. [DOI] [Google Scholar]
- Hub J. S.; De Groot B. L.; Van Der Spoel D. g_wham-A Free Weighted Histogram Analysis Implementation Including Robust Error and Autocorrelation Estimates. J. Chem. Theory Comput. 2010, 6, 3713–3720. 10.1021/ct100494z. [DOI] [Google Scholar]
- Lemkul J. From proteins to perturbed Hamiltonians: A suite of tutorials for the GROMACS-2018 molecular simulation package [article v1. 0]. Living J. Comput. Mol. Sci. 2019, 1, 5068. 10.33011/livecoms.1.1.5068. [DOI] [Google Scholar]
- Jakobtorweihen S.; Ingram T.; Smirnova I. Combination of COSMOmic and molecular dynamics simulations for the calculation of membrane–water partition coefficients. J. Comput. Chem. 2013, 34, 1332–1340. 10.1002/jcc.23262. [DOI] [PubMed] [Google Scholar]
- Mitragotri S. A theoretical analysis of permeation of small hydrophobic solutes across the stratum corneum based on Scaled Particle Theory. J. Pharm. Sci. 2002, 91, 744–752. 10.1002/jps.10048. [DOI] [PubMed] [Google Scholar]
- Humphrey W.; Dalke A.; Schulten K. VMD: visual molecular dynamics. J. Mol. Graph. 1996, 14, 33–38. 10.1016/0263-7855(96)00018-5. [DOI] [PubMed] [Google Scholar]
- Li H.; Ghodsi A.; Zaharia M.; Shenker S.; Stoica I. In Tachyon: Reliable, memory speed storage for cluster computing frameworks. Proceedings of the ACM Symposium on Cloud Computing, 2014; pp 1–15.
- Guixà-González R.; Rodriguez-Espigares I.; Ramírez-Anguita J. M.; Carrió-Gaspar P.; Martinez-Seara H.; Giorgino T.; Selent J. MEMBPLUGIN: studying membrane complexity in VMD. Bioinformatics 2014, 30, 1478–1480. 10.1093/bioinformatics/btu037. [DOI] [PubMed] [Google Scholar]
- Williams T.; Kelley C.; Bersch C.; Bröker H.-B.; Campbell J.; Cunningham R.; Denholm D.; Elber G.; Fearick R.; Grammes C.. gnuplot 5.2, 2017.
- Hunter J. D. Matplotlib: A 2D graphics environment. IEEE Ann. Hist. Comput. 2007, 9, 90–95. 10.1109/mcse.2007.55. [DOI] [Google Scholar]
- Mills R. Self-diffusion in normal and heavy water in the range 1-45. deg. J. Phys. Chem. 1973, 77, 685–688. 10.1021/j100624a025. [DOI] [Google Scholar]
- Ong E. E. S.; Liow J.-L. The temperature-dependent structure, hydrogen bonding and other related dynamic properties of the standard TIP3P and CHARMM-modified TIP3P water models. Fluid Phase Equilib. 2019, 481, 55–65. 10.1016/j.fluid.2018.10.016. [DOI] [Google Scholar]
- Volke F.; Eisenblätter S.; Galle J.; Klose G. Dynamic properties of water at phosphatidylcholine lipid-bilayer surfaces as seen by deuterium and pulsed field gradient proton NMR. Chem. Phys. Lipids 1994, 70, 121–131. 10.1016/0009-3084(94)90080-9. [DOI] [PubMed] [Google Scholar]
- Johnson M. E.; Berk D. A.; Blankschtein D.; Golan D. E.; Jain R. K.; Langer R. S. Lateral diffusion of small compounds in human stratum corneum and model lipid bilayer systems. Biophys. J. 1996, 71, 2656–2668. 10.1016/s0006-3495(96)79457-2. [DOI] [PMC free article] [PubMed] [Google Scholar]
- Wang T.-F.; Kasting G. B.; Nitsche J. M. A multiphase microscopic diffusion model for stratum corneum permeability. I. Formulation, solution, and illustrative results for representative compounds. J. Pharm. Sci. 2006, 95, 620–648. 10.1002/jps.20509. [DOI] [PubMed] [Google Scholar]
- Mitragotri S. Modeling skin permeability to hydrophilic and hydrophobic solutes based on four permeation pathways. J. Controlled Release 2003, 86, 69–92. 10.1016/s0168-3659(02)00321-8. [DOI] [PubMed] [Google Scholar]
- Hansch C.; Leo A.; Hoekman D.; Livingstone D.. Exploring QSAR: Hydrophobic, Electronic, and Steric Constants; American Chemical Society: Washington, DC, 1995; Vol. 48. [Google Scholar]
- Chen L.; Lian G.; Han L. Modeling transdermal permeation. Part I. Predicting skin permeability of both hydrophobic and hydrophilic solutes. AIChE J. 2009, 56, 1136. 10.1002/aic.12048. [DOI] [Google Scholar]
- Abraham M. H.; Martins F. Human skin permeation and partition: general linear free-energy relationship analyses. J. Pharm. Sci. 2004, 93, 1508–1523. 10.1002/jps.20070. [DOI] [PubMed] [Google Scholar]
- Wertz P.Biochemistry of human stratum corneum lipids. Skin Barrier; CRC Press, 2006; pp 33–42. [Google Scholar]
- De Jager M. W.; Gooris G. S.; Dolbnya I. P.; Bras W.; Ponec M.; Bouwstra J. A. The phase behaviour of skin lipid mixtures based on synthetic ceramides. Chem. Phys. Lipids 2003, 124, 123–134. 10.1016/s0009-3084(03)00050-1. [DOI] [PubMed] [Google Scholar]
- Beddoes C. M.; Gooris G. S.; Foglia F.; Ahmadi D.; Barlow D. J.; Lawrence M. J.; Demé B.; Bouwstra J. A. Arrangement of Ceramides in the Skin: Sphingosine Chains Localize at a Single Position in Stratum Corneum Lipid Matrix Models. Langmuir 2020, 36, 10270–10278. 10.1021/acs.langmuir.0c01992. [DOI] [PMC free article] [PubMed] [Google Scholar]
- Noh S. Y.; Notman R. Comparison of umbrella sampling and steered molecular dynamics methods for computing free energy profiles of aromatic substrates through phospholipid bilayers. J. Chem. Phys. 2020, 153, 034115. 10.1063/5.0016114. [DOI] [PubMed] [Google Scholar]
Associated Data
This section collects any data citations, data availability statements, or supplementary materials included in this article.