

Abstract
Introduction:
Fibroblasts maintain tissue and organ homeostasis through output of extracellular matrix that affects nearby cell signaling within the stroma. Altered fibroblast signaling contributes to many disease states and the extracellular matrix secreted by fibroblasts has been used to stratify patient by outcome, recurrence and therapeutic resistance. Recent advances in imaging mass spectrometry allow access to single cell fibroblasts and their ECM niche within clinically relevant tissue samples.
Areas covered:
We review biological and technical challenges as well as new solutions to proteomic access of fibroblast expression within the complex tissue microenvironment. Review topics cover conventional proteomic methods for single fibroblast analysis and current approaches to accessing single fibroblast proteomes by imaging mass spectrometry approaches. Strategies to target and evaluate the single cell stroma proteome on the basis of cell signaling are presented.
Expert opinion:
The promise of defining proteomic signatures from fibroblasts and their extracellular matrix niches is the discovery of new disease markers and the ability to refine therapeutic treatments. Several imaging mass spectrometry approaches exist to define the fibroblast in the setting of pathological changes from clinically acquired samples. Continued technology advances are needed to access and understand the stromal proteome and apply testing to the clinic.
Keywords: fibroblast, stroma, extracellular matrix, imaging mass spectrometry, proteomics, tissue, mass spectrometry, imaging proteomics
1.0. Introduction
1.1. The Fibroblast in Health & Tissue Homeostasis
Fibroblasts are specialized cells that work to maintain homeostasis of the connective tissue that surrounds all cells and forms the unique structure of each organ1–5. A primary function of the fibroblast is to synthesize, excrete and regulate the localized extracellular matrix (ECM), a network of glycoproteins, proteoglycans, and proteases that serves as a scaffold for all other cell types within the tissue6,7. In healthy tissue, fibroblasts exist in a quiescent or in an activated, contractile state throughout the tissue structure. Periodic activation increases outputs of localized ECM to regulate health and disease through inflammation & the immune response, wound healing, and differentiation8–10. Activated fibroblasts work to recruit inflammatory and immune cells to site specific locations through selective ECM degradation and output influencing cell migration, cell adhesion, cell-ECM and cell-cell recognition. Significantly, fibroblast post-translational modification of the ECM forms the basis for tissue organization and homeostasis11–14. Collagens are the primary proteins of the ECMs and have a multitude of site specific PTMs that regulate and activate cell signaling11,15,16. Major collagen PTMs include hydroxylation of proline and lysine, and glycosylation; these PTMs control basic collagen organization, stabilizes the scaffold structure and work on control of cells moving through the ECM16–20. Primary cell-ECM recognition occurs through site specific recognition of PTMs by tyrosine kinase discoidin domain receptors (DDRs) and integrins21–26. Induction of cell signaling through DDR and integrin PTM modulated sites alters pathways such as Src, ERK1/2, Notch, MAPK, contributing to differentiation potential21,26–30. Fibroblast expression programs are linked to their anatomic location to regulate organ growth and differentiation throughout a lifetime1,2,31. Fetal fibroblast gene programs differ greatly from adult fibroblast programs and are characterized by different localized needs of an organ at a particular time during growth & development3,6,7,32. Healthy fibroblast programming thus maintains tissue homeostasis through development, growth and healing by time-and location-dependent signaling through self-regulated ECM.
1.2. The Fibroblast in Disease
Abnormally prolonged activation or incorrect activation of fibroblasts results in disease; the heterogeneity of fibroblast subtypes forms a major complication in treatment of disease2–6. Disease-activated fibroblasts secrete dysfunctional and/or excess ECM producing scarring or fibrosis that impairs organ function and diverts normal cell signaling33–35. The heterogeneity in ECM organization produced by fibroblasts within the tissue microenvironment is demonstrated by Figure 1. Disease activation led by cell signaling patterns including TGFB1, αSMA, PDGFRB, and FAP that appear to be induced dependent on localization within the tissue microenvironment and the identity of nearby cells (reviewed in4 and36). Localization of fibroblasts within the tissue microstructure and surrounding cellular neighbors has a strong influence on acquiring aberrant phenotypic programming and inducing subtype populations of fibroblasts4,37–39. The emergence of disease activation of fibroblasts is still poorly defined and is considered a maladaptation of the wound healing process that is reversible or irreversible likely due to epigenetic regulation40,4. In cancer, the cancer-associated fibroblasts (CAFs) work within the stroma to promote tumor growth and progression under the control of the tumor program. CAF activation has a continual role throughout processes of desmoplasia, hyperplasia, inflammation and tumor growth and influences therapeutic resistance41–47. CAFs are contributors to production of reactive stroma, a dysfunctional program of repair including growth factors, immune cells, cytokines led by excess ECM that co-evolves from high risk status to cancer progression14,35,48,49. The ECM composition, particularly collagen types, secreted by CAFs can induce aberrant epithelial mesenchymal transition and stimulate metastasis4,50–52. CAFs play a complex role in forming localized metastatic niches by inducing nearby cells to secrete growth factors that promote migration and invasion of cancer cells53. It is the emergent fibroblast subtypes, derived from localized signaling patterns, that critically contribute to disease progression. It is hypothesized that within the heterogenous population of fibroblast subtypes there exists some subtypes with the ability to halt disease2,4,5.
Figure 1.
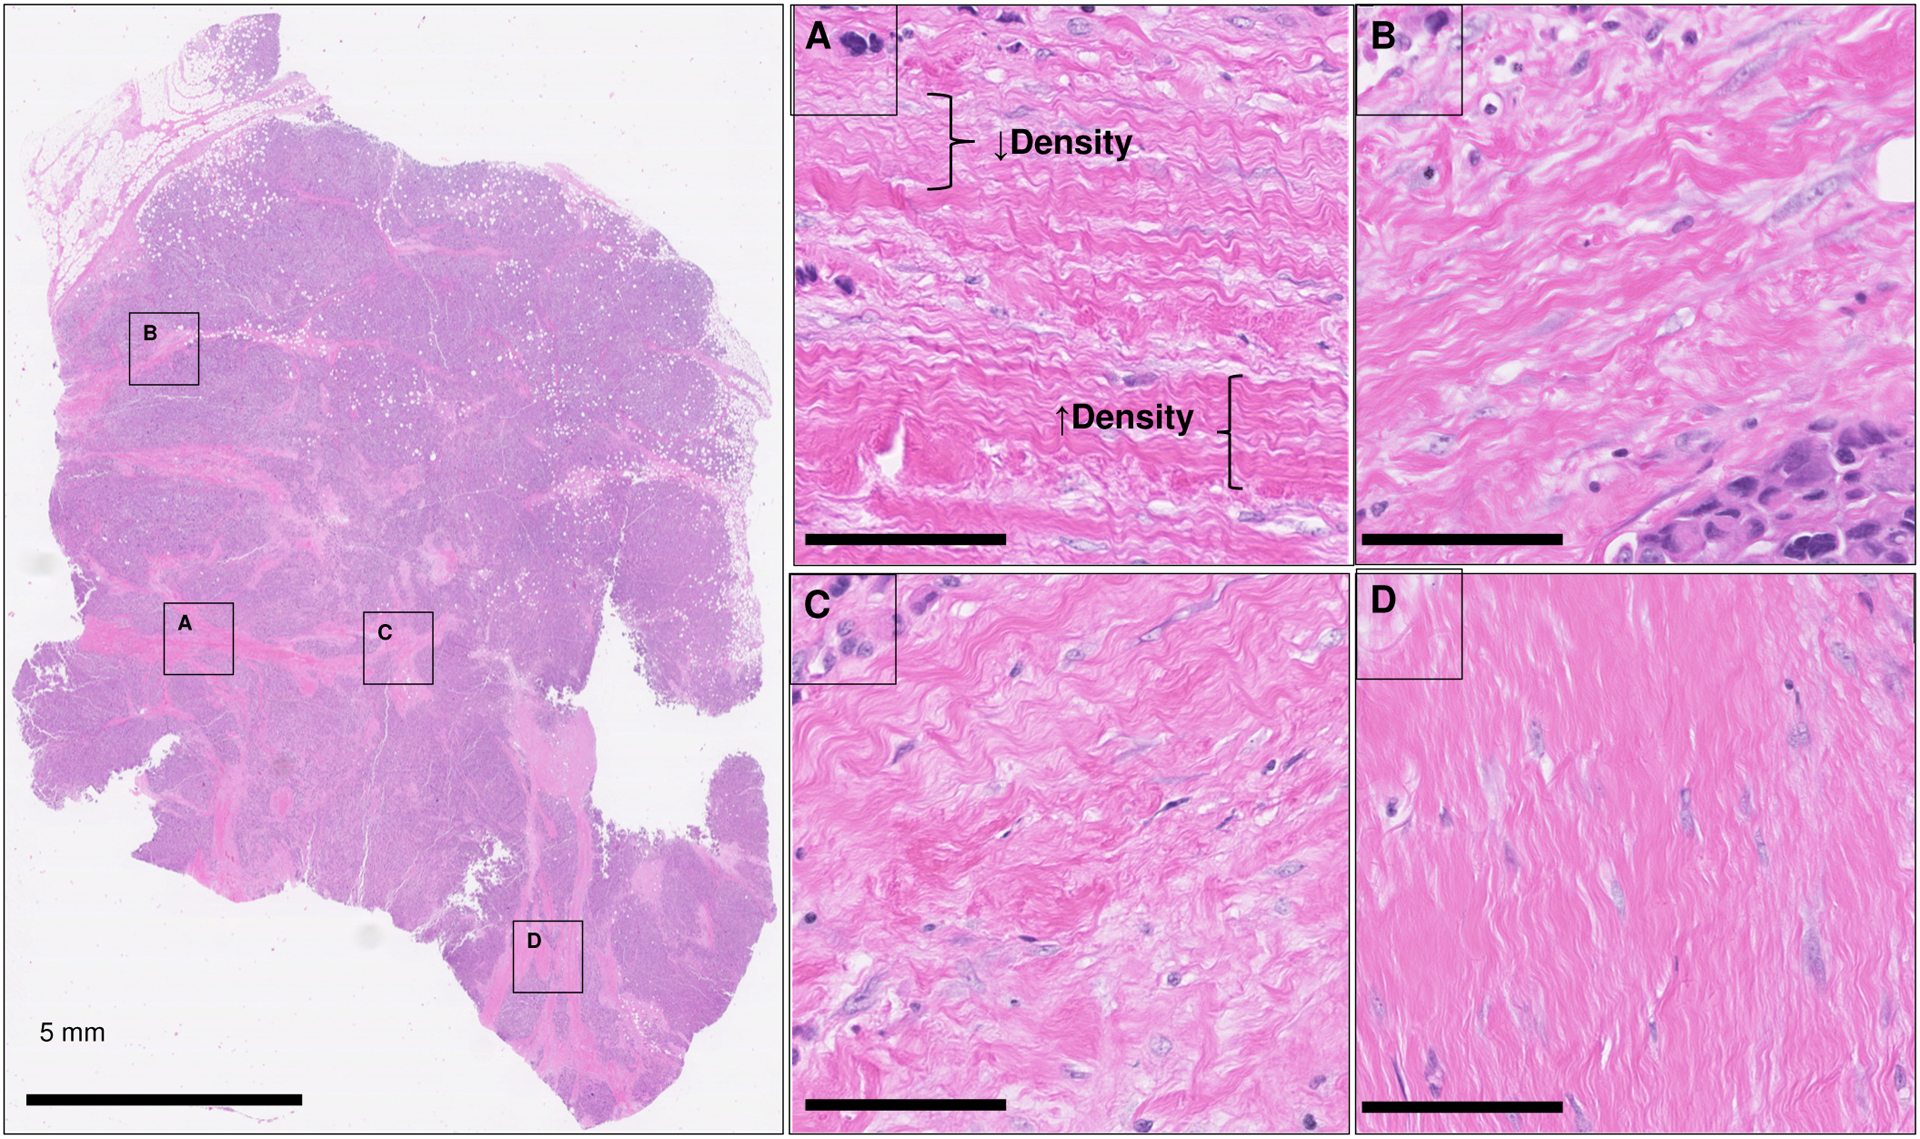
Heterogeneity in stromal patterning linked to fibroblast cells within a single tissue section. Tissue is a section of triple negative breast cancer stained by hematoxylin and eosin (H&E). The pink eosin stain highlights collagen stroma. Purple stain is for cell nuclei. A-D highlight specific areas where stromal organization changes by directionality, packing density (high density, darker pink; low density light pink, demonstrated in (A). Comparison of A and D demonstrates changes from “wavy” collagen stroma (A) to linearly packed collagen stroma (D).
1.3. The Analytical Challenge in Analysis of the Fibroblast and the Fibroblast Niche
Specifically how fibroblast influence and are influenced by neighboring cell signaling, subtypes in various disease staging, and information on the secreted “good” or “bad” ECM composition remains largely undefined. A main complication is that fibroblasts exist within a complex tissue microenvironment. By cell culture, it is difficult to capture all aspects of signaling that influence fibroblast heterogeneity, such as the complex interplay of activation states, ECM composition changes within the fibroblast niche, paracrine signaling from nearby inflammatory and immune cells, and the biomechanics of the localized environment. Fibroblasts in different organs have been identified by a number of markers; no single marker exists that can identify all fibroblast types2,4,39. Of critical importance is the location of the fibroblast relative to the pathology. Fibroblasts appear to acquire a different phenotype based on distance from emerging neoplasia and this phenotype may contribute to and be further altered by advanced progression of the lesion38,54,55. Understanding how the ECM composition and organization reciprocally influences the fibroblast phenotype is particularly challenging. The ECM is an insoluble scaffold primarily composed of the biologic polymers, collagen and elastin, embedded with soluble ECM proteins that regulate ECM density, organization, and crosslinking56. Organization is largely affected by fibroblast specific post-translational modifications modulated at precise locations on collagen protein structures; therefore, it is critical to understand proteomic regulation of the ECM niche. Chemokine gradients facilitated by fibroblast ECM composition and organization recruit and direct immune cell types through the stroma. However, immune cells secrete their own program of ECM and metalloproteases to remodel the tissue microenvironment36,57,58. The fibroblast activation status and the immune program response thus exist as feedback systems to each other ultimately contributing to disease outcome. A main challenge in defining the proteomics of fibroblast biology is due to limitations of technology capable of reporting heterogeneity of subtypes within a complex tissue microenvironment and sensitive enough to address single cell niches. This review covers recent proteomics work on the fibroblast and the fibroblast niche down to a single cell level, with an emphasis on recent advances in LC-MS/MS and imaging mass spectrometry.
2.0. Defining the Fibroblast by LC-MS/MS Proteomics
A plethora of proteomic approaches have been used to report on the proteome of the fibroblast and extensive reviews exist covering conventional proteomics of the ECM59–64. To contextualize tissue imaging proteomics discussed later, we first highlight general approaches, toolsets, and advances using liquid chromatographic tandem mass spectrometry (LC- MS/MS) proteomics to investigate the fibroblasts in vitro. We further present an overview of laser capture microdissection (LCM) coupled to LC-MS/MS that has been used to investigate fibroblast types directly from tissue, highlighting studies reported within the last 5 years.
2.1. Proteomics of Fibroblasts in vitro
A primary way of defining the fibroblast proteome has been in cell culture due to the ability to grow large numbers of cells for experimental manipulation, with recognition of the limitations of fibroblast cell culture. Proteomic analysis of cultured cells isolated from tissue or as cell lines are paired with microscopy information and/or cell assays to understand how proteomic fluctuation results in a functional change in cell behavior or signaling. Measuring changes in both the fibroblast and the secreted ECM yields a comprehensive understanding of cell activation and feedback mechanisms due to the ECM. Combinations of buffers for decellularization and/or enzymatic approaches are used to analyze cells and ECM separately and improve biological depth towards understanding the cell-ECM response (refer to section 3.7). An example of this is removal of the cells from the ECM substrate through decellularization with tryptic digestion is on the cellular fraction, while combinations of trypsin, collagenase, dispase, and elastase are used on the ECM substrate65–67. Quantitative information on fibroblast signaling is gained using label-free approaches or by stable isotopic labeling in cell culture (SILAC); this allows both an understanding of stromal cell regulation and ECM turnover facilitated by the stromal cells. Combining labeling approaches with treatments in culture or co-culture yields time resolved signaling and turnover facilitated by fibroblasts68–71. Additional studies have advanced to leveraging multiplexed transcriptomics and quantitative proteomics to understand a systems view of fibroblast signaling in disease72–74. Recent work has used fluorescence-activated cell sorting to isolate specific single cells before doing proteomics with RNA analysis at a single cell level75. Once mainstreamed, multiplexed single cell technologies should be especially useful for defining fibroblast subtypes76,77.
2.2. LCM LC-MS/MS Analysis of The Fibroblast in Tissue
Laser capture microdissection (LCM) coupled with LC-MS/MS is a way to investigate fibroblast signaling within the complex tissue microenvironment. Here, fibroblasts are dissected from tissue defined by marker and location; the surrounding stroma may be measured separately. The tissues may be fresh frozen, paraformaldehyde-fixed or formalin fixed, paraffin embedded (FFPE). The use of FFPE tissue is essential to translational studies as most tissue used for clinical prognosis or diagnosis are stored as FFPE. Tissue is at minimum stained with the common pathology stain Hematoxylin & Eosin (H&E) to identify cell types by morphological features within a specific environment such as tumor or normal adjacent78,79. Combinations of immunohistochemistry stains have been used to identify specific fibroblast types for cell-type resolved proteomics80. Isolation of fibroblasts is typically done on tissue sections of 8–12 μm thickness by capturing regions ranging from 100,000 – 500,000 μm2 with cellular counts of 4,000–25,00078–80. ECM proteins may be captured from the tumor or non-tumor stromal niche and used to define compartmentalized fibroblast regions. For example, comparing tumor and stromal fibroblasts has been used to identify stromal expression of N-methyl transferase (NNMT) from 5,000–25,000 cells; inhibition of NNMT was subsequently found to reverse the cancer-activated fibroblast phenotype78. This highlights that the fibroblast type can be reversed in tissue and that proteomic mining of stromal compartments may be used to direct new strategies for disease treatment. A recognized direction for all LC-MS/MS based proteomics of the fibroblast is the need to move to true single cell proteomics as part of studies covering multiple levels of molecular expression81,82. It is especially technologically challenging to achieve these goals derived from a complex tissue microenvironment and one solution might be the use of imaging mass spectrometry.
3.0. Imaging Mass Spectrometry
Imaging mass spectrometry (IMS) is a mature technology83–85 developed for molecular profiling and co-registration of multiple analyte distributions in tissue, and has been extensively reviewed86–90. Imaging mass spectrometry (IMS) allows sampling of the proteome from tissue without removal of regions and homogenization, creating a molecular patterning in the context of the complex tissue microenvironment. For fibroblast analysis, this means that molecular patterns from fibroblasts can be visualized in situ comparative to the ECM niche and nearby cells. Recent IMS studies applied to the characterization and organization of the ECM proteome and the fibroblast niche have demonstrated the utility of the approach91–94. A main factor in targeting a single cell in tissue by IMS is the ability of the ion source to focus to single cell or single cell niche diameters (≤5 μm or ≤15 μm diameters respectively). There are several ion sources that can target down to the single cell level, including nano-desorption electrospray ionization (nano-DESI)95, matrix-assisted laser desorption ionization (MALDI)96–99, secondary ion mass spectrometry (SIMS)100, multiplexed ion beam imaging (MIBI)101 and laser ablation inductively coupled plasma mass spectrometry102. Here, we focus on advances in MALDI imaging mass spectrometry that allow targeting the proteome from the fibroblast niche.
3.1. An Overview of Tissue Imaging Mass Spectrometry
An overall goal in imaging mass spectrometry is to achieve single cell imaging with clinical benefit; this has been a driving force in technological development. A main challenge is the ability to define single cell heterogeneity within a tissue section through sample preparation, instrumentation, and data analytics. The overall approach to IMS of tissue is summarized in Figure 2. All IMS studies of tissues are paired with microscopy data, at minimum using a serial section to stain for hematoxylin and eosin (H&E). The use of a stained section allows for identification and visualization of cellular localization, stroma and morphology. Several novel IMS approaches are being developed to analyze molecular patterns from stained tissue sections, discussed later. Protein targeted strategies for tissue imaging are typically followed by scraping the tissue into solution for chromatographic sequencing87,91,92,94,103. This produces a patient-specific database of peptides or intact proteins that is then linked through high mass accuracy back to the imaging studies. Regionalized expression of a specific peptide can be further confirmed by on-tissue fragmentation92,104.
Figure 2.
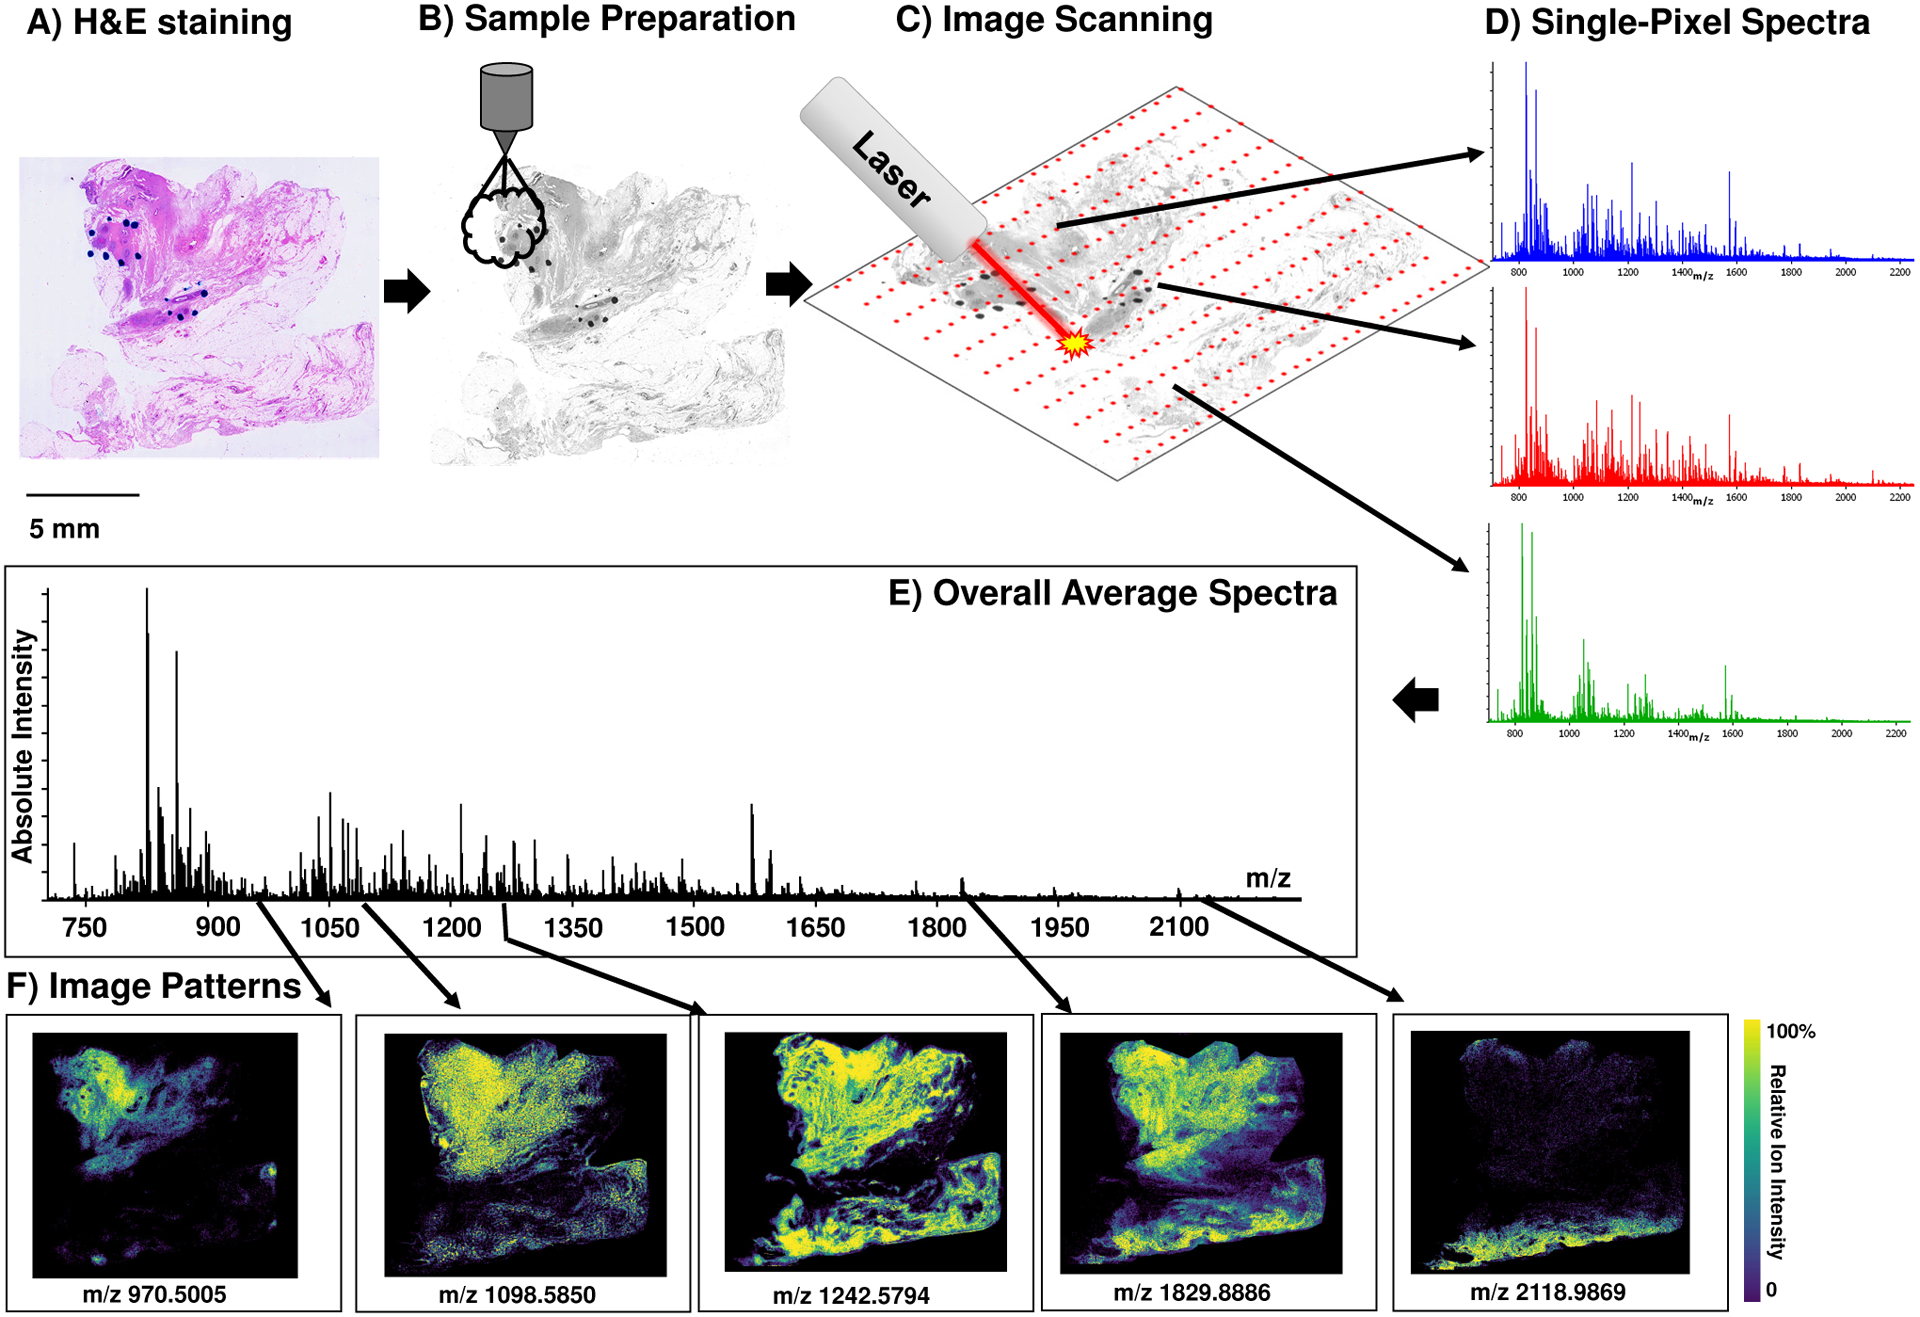
The matrix-assisted laser desorption/ionization (MALDI) imaging mass spectrometry workflow. A) Stained tissue sections (hematoxylin and eosin shown) are prepared by spraying enzymes and matrix (B) onto tissue sections. C) Imaging scanning uses a laser to collect data points at discrete x and y coordinates. D) Each data point is linked to a single pixel. E) A total average spectrum contains all signal across the tissue. F) Specific peaks can be explored to see changes in peak intensity across the tissue by image patterns.
Tissue microarrays contain small cores (200–500 μm diameter) of tissue that has been defined by a pathologists as representative of a patient’s tumor, normal adjacent tissue, and/or normal tissue. Cores are combined to form an array from up to 600+ patients for high clinical relevance of molecular signatures. Tissue arrays are uniquely accessible by MALDI IMS compared to LC-MS/MS and have been used by several groups to report diagnostic signatures (reviewed105). New work has shown that in addition to tissue microarrays, IMS can be used to scan arrays of cells and biofluids106–108; this increases the translational potential of IMS data as researchers may move from tissue studies to cell signaling to a clinical biofluid assay.
3.2. Mass Spectrometry Imaging Sample Preparation
For tissue type samples, sample preparation starts out similarly to immunohistochemistry studies: thin sections of fresh frozen (FF) or formalin-fixed, paraffin embedded (FFPE) tissue are mounted onto microscope slides and thoroughly washed with organic solvents to remove suppressing molecules; FFPE tissues are antigen retrieved to break formalin bonds caused by formalin fixative tissue preservation. FFPE tissues are especially useful for probing proteomic data as the processing to create the FFPE tissue block flushes out metabolites and lipids which can greatly increase ion suppression. Automatic sprayers109–111 are used to apply enzymes and matrix, minimizing analytical “hotspots” and significantly increasing technical reproducibility. For MALDI IMS, automated sprayers facilitate the homogenous formation of small ≤1 micron sized matrix crystals that enhances sensitivity of imaging detection down to a single cell99,112. The nearly universal use of modern automated sprayers has made the preparation of samples a uniform, robust process and has facilitated large multicenter studies by MALDI IMS113–115. Different enzymes may be used to target specific parts of the protein structure. For proteomics, enzymes such as trypsin116 (tryptic peptides; largely cellular targeting), PNGase F117 (N-glycans), collagenase118 (targets digestion of collagens and other ECM proteins) and elastase119 are sprayed as a fine, nearly dry mist onto the tissue section. Digestion proceeds by incubation in a closed humidity chamber. This microlevel digestion, created by spraying the nearly dry enzyme onto the tissue, produces a highly localized proteomic signature that is measured by systematically scanning the tissue section using an imaging mass spectrometer. Each x,y coordinate where the tissue is sampled is called a data pixel and each data pixel reports a mass spectrum. Each spectrum contains hundreds to thousands of peak intensities from analytes. Selecting an ion peak generates a heat map of that ion across the tissue, correlating to tissue features. The data can be analyzed collectively as “big data” (e.g., principal components analysis, heatmap clustering, pathways mapping, gene ontology) with additional information gained on localization of each molecule relative to the tissue pathology.
Modern sample preparation for imaging mass spectrometry applies chemicals, enzymes and matrix using automated sprayers. Automatic sprayers109–111 minimize analytical “hotspots” and significantly increase technical reproducibility. For MALDI IMS, automated sprayers facilitate the homogenous formation of small ≤1 micron sized matrix crystals that enhances sensitivity of imaging detection down to a single cell99,112. The nearly universal use of modern automated sprayers has made the preparation of samples a uniform, robust process and has facilitated large multicenter studies by MALDI IMS113–115.
3.4. State of the Art Mass Spectrometry Imaging Instrumentation
Dedicated research has resulted in multiple advances in ion sources towards achieving goals of cellular imaging across tissues98,120,121. Commercially available MALDI IMS instruments have advanced to allow flexible tuning of the laser spot to diameters of 5–15 μm achieve high spatial resolution sampling down to single cell dimensions. At the same time, instrumentation has increased in speed of acquisition. Several imaging mass spectrometers exist that can sample at around >20 pixels per second, rapidly capturing the complex tissue microenvironment at cellular spatial resolutions122–127.
Key advances in instrumentation such as post source ionization and ion mobility have increased the sensitivity and specificity of analytes detected by MALDI IMS. Post source ionization by a secondary laser, termed MALDI-2, greatly increases sensitivity of many analytes128–132. In MALDI-2, the originating MALDI plume is synchronously intercepted by second laser operating at wavelengths shorter than 310 nm and pulsed to increase ionization within the gas phase plume; increased ionization likely occurs through additional resonance transfer dependent on the type of matrix130. Ion mobility is used in many IMS studies to leverage collisional cross section measurements for increased specificity of ion detection within the complex tissue microenvironment133–138. A surge of new work done on ion mobility instrumentation has contributed to increasing the specificity of detection within the complex tissue microenvironment139. In one advance, cyclic ion mobility propels ions through cyclical pathing using sequential and short-lived or “traveling” waves of pulsed voltages. Increasing the number of cyclical passes increases ion mobility resolution to better differentiate between isobaric masses based on collisional cross section140,141. In trapped ion mobility spectrometry (TIMS), a gas flow is used to separate trapped ions within an electrical field; ions elute from the trap dependent on collisional cross section within the gas flow142–144. Combinations of high speed, focused laser diameter and TIMS have allowed specific and high spatial resolution in tissue and organs up to whole body sections from animal models of disease126,127. MALDI-2 has been combined with TIMS for high sensitivity, high specificity imaging studies129,131,145. Additional research has leveraged higher magnetic field Fourier transform resonance mass spectrometry to increase accuracy, sensitivity, and dynamic range for increased molecular detail146,147.
3.5. Current Mass Spectrometry Imaging Data Analysis
The complexity of data from imaging analysis of the tissue microenvironment has created a significant field of research dedicated to computational approaches for IMS data, discussed in148–150. It is nearly impossible within the short space of this review to give an accounting of the massive growth and progress that have been essential to evolving the field of imaging mass spectrometry towards single cell analysis. Topics in this burgeoning field of research include approaches to data annotation, peak picking, alignment and calibration151–155, image segmentation156, image sharpening157,158, numerous approaches for sophisticated classification of molecular signatures150,159,160, pipeline creation for imaging analyses with fusion & co-registration of microscopy data161–164, and data fusion of multiplexed imaging techniques165–168. Several open-sourced platforms exist to support analysis of imaging data169–171. Three-dimensional data approaches exist to understand dimensional distribution of molecular patterning within tissues or cell clusters172–175. IMS modalities176,177 and/or other imaging modalities including medical imaging163,175,178–181 have been computationally combined for a comprehensive understanding of how cellular processes and their surrounding molecular diffusion patterns drive disease. Such research has recently produced new toolsets that have been applied to investigate cell populations within tissue sections150,182,183. The current frontier of cell based IMS research utilizes artificial intelligence184,185 and deep learning186 for rapid interpretation and classification of heterogenous cell populations within tissue.
3.6. Mass Spectrometry Imaging Acquisition Strategies Applicable to The Single Cell Fibroblast in The Setting of a Complex Tissue Microenvironment
A schematic of approaches that can be used towards imaging the single cell fibroblast niche is shown in Figure 3. In a general imaging approach, the entire tissue is scanned by systematically stepping through x, y coordinates. This is currently the general approach to tissue imaging MS that is done and molecular signatures that can be compared within one tissue section based on histological features, e.g., tumor, tumor margins, and normal adjacent. Understanding the comparative pathology involves working with a pathologist and combining the imaging data with pathology stains such as hematoxylin and eosin (H&E). Here, a pathologist marks the pathology either on the same tissue section that will be used for imaging MS91,187 or on a serial section. This strategy allows relative quantitative analysis of patient-specific tissue features that may also be combined in large patient cohorts. The higher speed, higher spatial resolution MS instruments allow investigation of gradient patterns from different cellular regions. In contrast to laser capture microdissection where regionalized cells are removed, gradient patterns from different cellular regions can be added based on user selection of a cell types and compared at any point once the data is collected. In this strategy, one should consider that acquiring high spatial resolution data over an entire data sets requires significantly more computational resources to analyze, particularly when studies involve large clinical cohorts.
Figure 3.
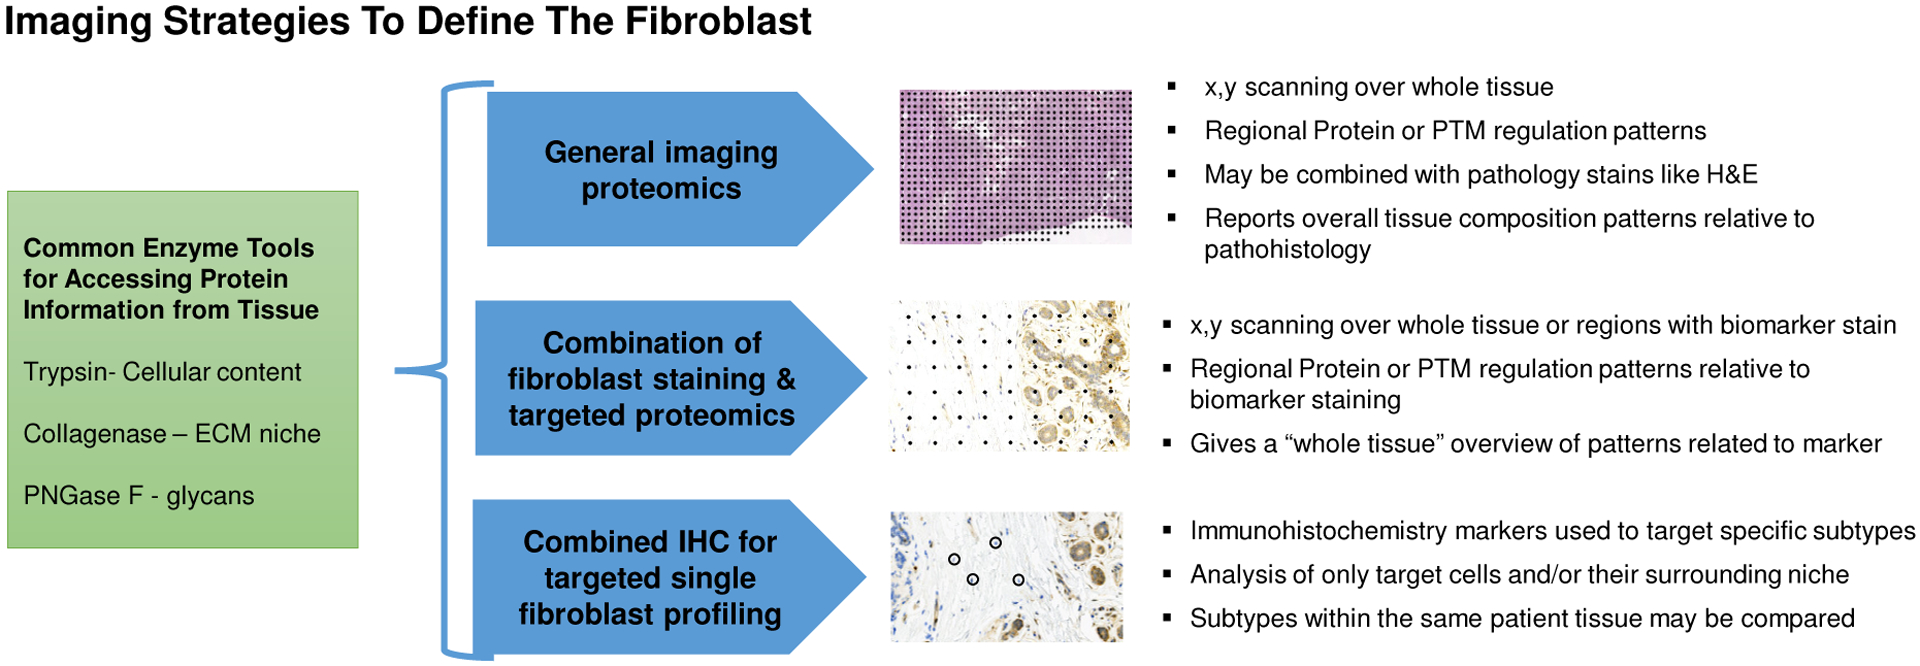
A schematic of approaches that can be used towards imaging or profiling the fibroblast proteomic niche from global tissue patterns to single cell profiles. The fibroblast proteome is accessed for imaging analysis using enzyme specificity, examples include trypsin (cellular content), collagenase (extracellular matrix proteins) and PNGase F (N-linked glycans).
Combined immunohistochemistry (IHC) and imaging MS strategies allow evaluation of image patterns relative to the cell marker used in IHC. Tissues are stained for markers by IHC and IMS is done directly on the same tissue section, with staining and digital capture completed before removal of the coverslip and preparation for IMS188. An advantage of this approach is that it directly ties the cell signaling to the tissue pathology. Figure 4 demonstrates this concept with a staining for for Prolyl 4-Hydroxylase Subunit Alpha 3 (P4HA3), a key enzyme in collagen synthesis that catalyzes formation of 4-hydroxyproline, essential in driving triple helical collagen formation. Combining the imaging patterns with P4HA3 staining demonstrates that very specific hydroxylated prolines are regulated localized to the tumor margins and stroma. Besides investigating whole tissue patterns relative to staining, the instrument may be focused to high spatial resolution (≤10 μm) in target regions of staining to acquire gradient patterns relative to the IHC marker. The advantage of acquiring small areas with high spatial resolution is that it increases the capability to have large data sets focused on a particular cell type without the need for significant computational resources. Additional studies have recently been done to combine lectin staining with N-glycan imaging189.
Figure 4. Integrated immunohistochemistry with MALDI IMS with staining and imaging done on the same tissue section.
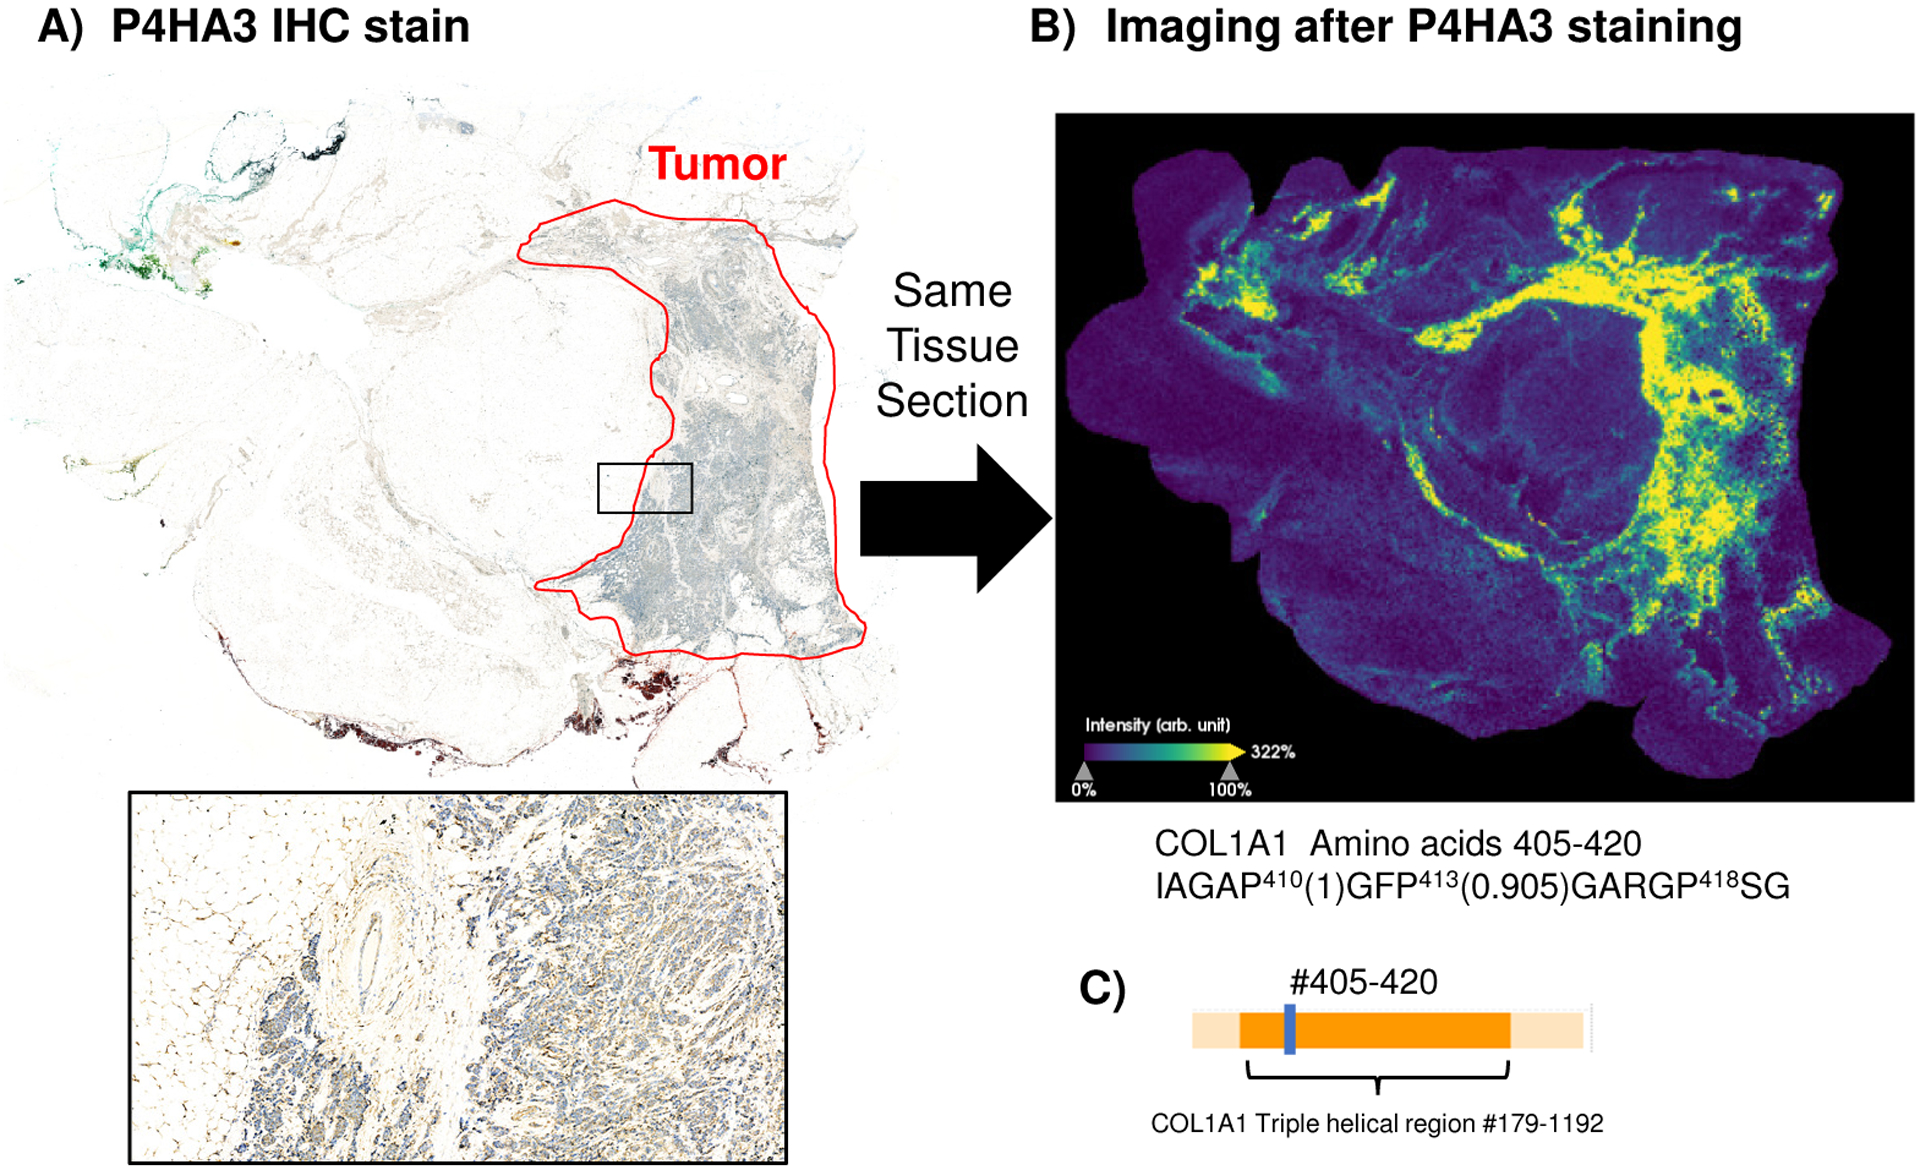
A) staining for prolyl-4-hydroxylase 3 (P4HA3) that catalyzes collagen hydroxylated proline (HYP). Collagen HYP ultimately controls how collagen organizes within the tissue microenvironment and presents cell-recognition sites. B) Collagen targeted imaging done on the same section after P4HA3 staining. The peptide mapped belongs to COL1A1, amino acids 405–420. Site specific probabilities of HYP are given in parentheses. Notably, proline 418 is not hydroxylated, whereas proline 410 and 413 are hydroxylated. The combined staining and imaging experiments represent the potential for disease and cell specific understanding of collagen regulation. C) Location of the peptide (amino acids 405–420) maps to COL1A1 triple helical structure.
In histology-directed profiling by IMS190, the laser is guided to a target cell for direct targeting of specific cell types within a tissue section. Contemporary literature describes this approach with staining done on serial sections and with accurate alignment of the stained and unstained section a significant task prior to cell targeting. Current approaches may use staining, either H&E for fibroblast morphology or immunohistochemistry to mark out specific fibroblasts in the tissue, with histology-directed cell targeting done on the identical tissue section. This workflow is demonstrated in Figure 5, where the tissue is stained for phosphatase and tensin homolog (PTEN), an oncogenic stroma regulator and powerful switch between oncogenesis (low PTEN) and oncosuppression (high PTEN)191. Fibroblast cell targeting is accomplished on the same tissue section to understand stromal proteome regulation associated with PTEN status. Current instrumentation allows defined modulation of the laser size so that the cell or a desired proportion of the niche surrounding the cell may be captured for profiling. Acquisition in this approach is very fast as a few hundred cell-specific MS spectrum are collected per tissue compared to the tens of thousands of data pixels making up large tissue images. The majority of the study time is spent marking cell types for targeting which can be easier when combined with an IHC stain on the identical tissue section. A significant advantage of histology-directed profiling compared to high spatial resolution across the entire tissue section is that fewer computational resources are required for analysis as compared to full tissue imaging. This highly refined approach to targeting the single cell fibroblast may be useful in determining new and specific markers for fibroblast subtypes. At a technological level, the imaging mass spectrometry platform presents a useful translational tool that can define fibroblast signaling gradients from single cell niches to nearby cells, either across a whole tissue section of by targeting specific fibroblast subtypes.
Figure 5. Histology directed workflow on immunostained tissue to understand the single cell fibroblast niche.
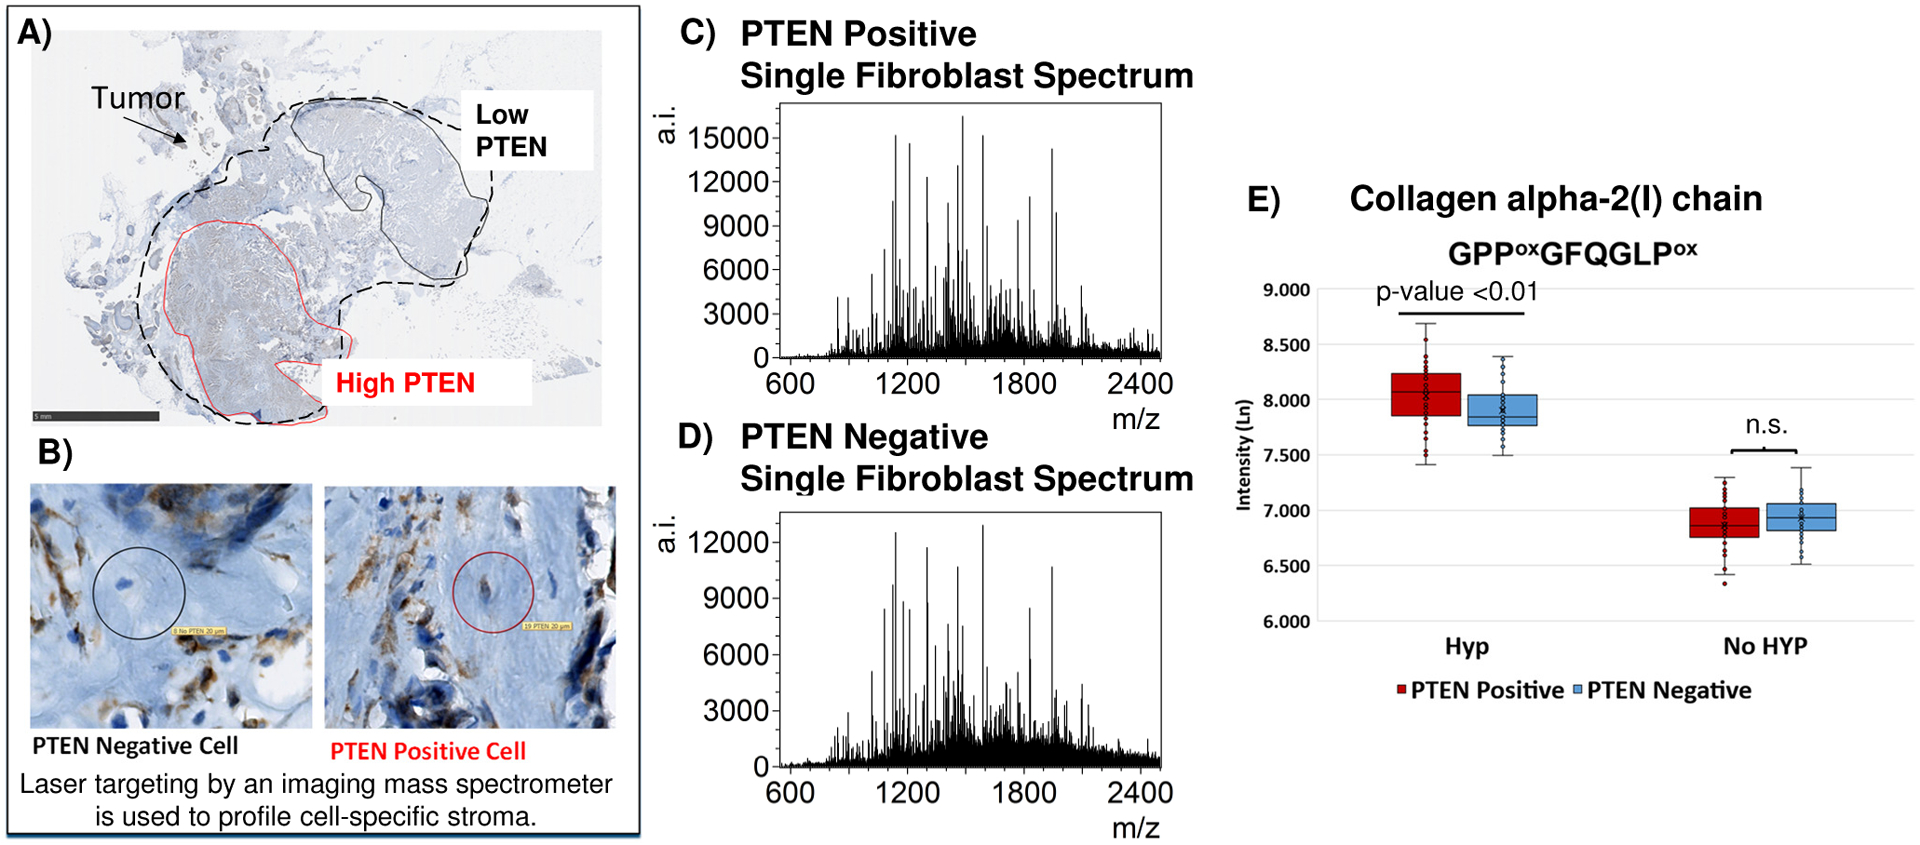
A) The tissue was stained for phosphatase and tensin homolog (PTEN) an oncogenic stroma regulator. The tumor displays heterogenous PTEN expression. B) Fibroblasts with low PTEN (high oncogenic signaling, n=50) and high PTEN (attenuated oncogenic signaling, n=50) were marked on the tissue. After preparing the same tissue prepared for ECM targeted proteomics, the MALDI laser is directed to specific fibroblast x,y coordinates for profiling, marked here by black or red circles. C) Example spectrum from targeting a single fibroblast with positive PTEN stain. D) Example spectrum from targeting a single fibroblast with no detectable PTEN stain. E) Example hydroxylated proline (HYP) modified COL1A2 peptide found with significantly higher expression in the PTEN positive fibroblasts compared to PTEN negative fibroblasts.
3.7. Mass Spectrometry Imaging Methods for Accessing Molecular Regulation of the Fibroblast Niche
We focus on enzymatic approaches that can specifically report protein signal from cells or from the surrounding extracellular matrix. Using automated sprayers that maintain spatial resolution down to cellular levels, any of the acquisition approaches outlined above may be combined with enzymatic access of the fibroblast proteome.
Trypsin is a primary enzyme used for IMS studies used for accessing cellular proteins and PTMs from FFPE or FF tissue reviewed in87,192. ECM has been more challenging, particularly from FFPE clinically archived tissue, as these proteins are relatively inaccessible to trypsin digestion due to PTM modification of lysine or arginine. Certain ECM proteins such as collagens and elastin have lower lysine or arginine content than cellular proteins; this also presents challenges for tryptic access. MALDI IMS methods that specifically target the extracellular matrix from FFPE tissue have been developed93. These approaches use collagenase blends and matrix metalloproteinases to specifically target and localize extracellular matrix regulation within the tissue microenviroment. The use of C3 on FFPE tissue reports from collagens and other ECM proteins (e.g., decorin, biglycan, vimentin, lumican, fibrinogen) that regulate the stromal response. This approach is unique because it also specifically targets triple helical regions of collagens that contain disease sensitive post-translational modifications. For tissues such as wedgectomies and lumpectomies, imaging is followed by using C3 in-solution and high-resolution accurate mass LC-MS/MS for global sequencing of patient-specific ECM proteomes. This strategy was reported that collagen regulation within the reactive stroma of radical proctectomies occurs as a gradient around the tumor91. High expression of specific hydroxylated proline sites from COL1A1 and COL3A1 were detected in tumor regions as compared to normal adjacent tissue. Patient-specific LC-MS/MS revealed that collagen signatures changed by regulation of type of collagen. ECM imaging of tissues has been done on tissue microarrays containing specific patient cohorts. In breast cancer, distinct ECM peptide signatures were linked to the ontology of progression including inflammatory cell infiltrate, by type of cancer and staging of cancer94. In lung cancer, ECM peptides were able to define normal lung apart from low grade lung adenocarcinoma (LUAD) with striking regulation of collagen hydroxyproline92 in LUAD. Other enzymes, including MMP12 (elastase) have been demonstrated in imaging studies with significant regional regulation in colon cancer and in heart biology93. Both ECM and cellular surfaces are highly glycosylated and glycosidases have been used to define localized glycans in disease189,193–195, a potential additional source for further differentiating fibroblasts. New studies have demonstrated that these enzyme targeted approaches can be performed serially to define different types of molecular regulation from cells and ECM187,196,197.
4.0. The Clinical Potential of Defining the in-situ Fibroblast
From a clinical perspective, the fibroblast and associated ECM components, particularly collagen signatures, have been continually identified as biomarkers stratifying patients by disease type, stage or outcome198–206. There is an ever-increasing need for therapies that target the fibroblast and fibrotic processes. A search at clinicaltrials.gov for “fibrosis” yielded 3,895 results, a nearly 50% increase since 2017207, demonstrating the increased need for higher molecular definition of the fibroblast. Therapeutic targeting of the disease-activated fibroblast requires finding more specific protein markers, which can now be obtained by defining the fibroblast subtypes present within the complex tissue environment. Many approved therapies target or use proteins that are post-translationally modified208,209. The lack of information on fibroblast specific PTMs and their role in tissue regulation is clearly a missing piece in the puzzle in understanding therapeutic treatment of disease-related fibroblast types and their ECM output. There is a large need for antifibrotic therapies and currently 144 antifibrotic agents are in testing or have completed (clinicaltrials.gov, accessed 06/04/2021). However, the majority of anti-fibrotic agents used for therapies are non-specific and decrease multiple stromal proteins including those that may inhibit tumor spread210–213. There is very little information on specific proteomic regulation of the collagen structure and this may be responsible for the confusing and conflicting results for antifibrotic therapies205. Defining more specific targeting, especially in the case of ECM PTM regulation, is required to restore a fibroblast back to functional healing versus disease mediation and scar formation. The clinical benefit of refining the proteomic signature of the fibroblast and the localized niche shows high potential for new and more specific fibroblast markers, markers for patient stratification, prognosis, diagnosis and therapeutic intervention.
5.0. Limitations and Needs of Current MS Technologies and Methodologies.
Limitations in measurements of the fibroblast and the ECM niche include complexity of sample preparation, challenges incorporating standardized controls to the imaging experiment, expertise required in operating the instrument, and obtaining rapidly interpretable readouts. Elegant work has been done to decrease sample preparation and achieve robust signal214, yet overall, by both LC-MS/MS methods and MSI, sample preparation is still quite complex and generally take several hours to achieve, particularly for the single cell level. Simplified workflows that are robust and portable between laboratory settings are needed. The imaging instrumentation and experiments particularly requires a high level of expertise to assess system suitability for analysis and lacks ways to standardize acquisition and analysis during tissue or cell-targeted analysis. “Smart” diagnostics on standards or specific m/z could be implemented to help the user assess instrument performance for quality control and system suitability. Assessing internal standards could be done “on the fly” with capabilities for adding decision criteria (e.g., pass/fail, halt analysis) during each run. Although certain instruments address quality control to some minimal amount, at this point there is no imaging instrument capable of automated evaluation of standard or experimental suitability. Finally, results from an imaging experiment are not easily portable, requiring specialized software to view and do statistical comparison and this limits collaboration among groups. At the current time, it is likely that all components would need to be developed together to breakthrough to a pre-clinical or clinical use. This would include the simplified method, an instrument capable of smart assessment of performance with automated software scoring output on an interpretable scale.
6.0. Conclusions
The promise defining the proteomics of fibroblasts and their associated ECM output are the known significant effects on halting or promoting disease progression by proteomic regulation of cellularly localized gradients. These gradients are tissue specific and location specific, working to both self-regulate the fibroblast and feed into nearby cells to affect signaling processes. Main challenges to understanding single cell fibroblast function lie in determining stage and disease specific fibroblast subtype markers, defining how fibroblast subtypes contribute tissue homeostasis and disease based on location within the tissue microenvironment, and determining the structure-function effects of organ specific fibroblasts. The localized fibroblast derived ECM output is a largely untapped source of markers for disease status, particularly at the post-translational level and in the context of the complex tissue microenvironment. State-of the art imaging mass spectrometry approaches offer several solutions to answering understanding fibroblast subtypes and regulation within tissue relative to neighboring cell types and by disease staging. Continued advances in strategies and technology are needed to access and understand the tissue-specific fibroblast proteome. Ultimately, the ability to define the fibroblast proteome within the complex tissue microenvironment will contribute to new clinical tools for use in patient stratification, prognosis and diagnosis.
ACKNOWLEDGEMENTS
This work is supported by NIH/NCI R21 CA240148, R01 CA253460, U54MD010706 and in part by pilot research funding from the Hollings Cancer Center Support Grant from NIH/NCI P30 CA138313 at the Medical University of South Carolina. DJ is grateful for support from NIH/NIGMS R25GM072643. Additional support to RRD provided by the South Carolina Centers of Economic Excellence SmartState program. The MUSC Imaging Mass Spectrometry Research Resource is supported in part by the NIH/NIDDK Digestive Disease Research Core Center P30DK123704 01 and the Mass Spectrometry Facility is supported by the University and P20GM103542 (NIH/NIGMS).
Footnotes
COI: The authors declare no potential conflicts of interest.
REFERENCES
- 1.Chang HY et al. Diversity, topographic differentiation, and positional memory in human fibroblasts. Proceedings of the National Academy of Sciences 99, 12877–12882 (2002). [DOI] [PMC free article] [PubMed] [Google Scholar]
- 2.Kalluri R & Zeisberg M Fibroblasts in cancer. Nature Reviews Cancer 6, 392–401 (2006). [DOI] [PubMed] [Google Scholar]
- 3.Fan D, Takawale A, Lee J & Kassiri Z Cardiac fibroblasts, fibrosis and extracellular matrix remodeling in heart disease. Fibrogenesis & Tissue Repair 5, 15. (2012). [DOI] [PMC free article] [PubMed] [Google Scholar]
- 4.Kalluri R The biology and function of fibroblasts in cancer. Nature Reviews Cancer 16, 582–598. (2016). [DOI] [PubMed] [Google Scholar]
- 5.Muhl L et al. Single-cell analysis uncovers fibroblast heterogeneity and criteria for fibroblast and mural cell identification and discrimination. Nature Communications 11, 1–18 (2020). [DOI] [PMC free article] [PubMed] [Google Scholar]
- 6.Bonnans C, Chou J & Werb Z Remodelling the extracellular matrix in development and disease. Nature Reviews Molecular Cell Biology 15, 786–801. (2014). [DOI] [PMC free article] [PubMed] [Google Scholar]
- 7.Lu P, Takai K, Weaver VM & Werb Z Extracellular matrix degradation and remodeling in development and disease. Cold Spring Harbor Perspectives in Biology 3, a005058. (2011). [DOI] [PMC free article] [PubMed] [Google Scholar]
- 8.DiPersio CM, Zheng R, Kenney J & Van De Water L Integrin-mediated regulation of epidermal wound functions. Cell and Tissue Research 365, 467–482 (2016). [DOI] [PMC free article] [PubMed] [Google Scholar]
- 9.Schreier T, Degen E & Baschong W Fibroblast migration and proliferation during in vitro wound healing. Research in Experimental Medicine 193, 195–205 (1993). [DOI] [PubMed] [Google Scholar]
- 10.Croft AP et al. Distinct fibroblast subsets drive inflammation and damage in arthritis. Nature 570, 246–251 (2019). [DOI] [PMC free article] [PubMed] [Google Scholar]
- 11.Mouw JK, Ou G & Weaver VM Extracellular matrix assembly: a multiscale deconstruction. Nature Reviews Molecular Cell Biology 15, 771–785 (2014). [DOI] [PMC free article] [PubMed] [Google Scholar]
- 12.Shoulders MD & Raines RT Collagen structure and stability. Annual Review of Biochemistry 78, 929–958. (2009). [DOI] [PMC free article] [PubMed] [Google Scholar]
- 13.Taufalele PV, VanderBurgh JA, Muñoz A, Zanotelli MR & Reinhart-King CA Fiber alignment drives changes in architectural and mechanical features in collagen matrices. PLOS ONE 14, e0216537, doi: 10.1371/journal.pone.0216537 (2019). [DOI] [PMC free article] [PubMed] [Google Scholar]
- 14.Nissen NI, Karsdal M & Willumsen N Collagens and Cancer associated fibroblasts in the reactive stroma and its relation to Cancer biology. Journal of Experimental & Clinical Cancer Research 38, 115 (2019). [DOI] [PMC free article] [PubMed] [Google Scholar]
- 15.Sweeney SM et al. Candidate cell and matrix interaction domains on the collagen fibril, the predominant protein of vertebrates. J Biol Chem 283, 21187–21197 (2008). [DOI] [PMC free article] [PubMed] [Google Scholar]
- 16.Rappu P, Salo AM, Myllyharju J & Heino J Role of prolyl hydroxylation in the molecular interactions of collagens. Essays in Biochemistry 63, 325–335. (2019). [DOI] [PMC free article] [PubMed] [Google Scholar]
- 17.Bann JG, Peyton DH & Bächinger HP Sweet is stable: glycosylation stabilizes collagen. FEBS letters 473, 237–240 (2000). [DOI] [PubMed] [Google Scholar]
- 18.Hennet T Collagen glycosylation. Current Opinion in Structural Biology 56, 131–138 (2019). [DOI] [PubMed] [Google Scholar]
- 19.Zurlo G, Guo J, Takada M, Wei W & Zhang Q New insights into protein hydroxylation and its important role in human diseases. Biochimica et Biophysica Acta (BBA)-Reviews on Cancer 1866, 208–220 (2016). [DOI] [PMC free article] [PubMed] [Google Scholar]
- 20.Yamauchi M & Shiiba M in Post-translational Modifications of Proteins 95–108. (Springer, 2008). [Google Scholar]
- 21.Fu H-L et al. Discoidin domain receptors: unique receptor tyrosine kinases in collagen-mediated signaling. J Biol Chem 288, 7430–7437 (2013). [DOI] [PMC free article] [PubMed] [Google Scholar]
- 22.Gu T-L et al. Survey of tyrosine kinase signaling reveals ROS kinase fusions in human cholangiocarcinoma. PloS One 6, e15640 (2011). [DOI] [PMC free article] [PubMed] [Google Scholar]
- 23.Ferri N, Carragher NO & Raines EW Role of discoidin domain receptors 1 and 2 in human smooth muscle cell-mediated collagen remodeling: potential implications in atherosclerosis and lymphangioleiomyomatosis. The American Journal of Pathology 164, 1575–1585 (2004). [DOI] [PMC free article] [PubMed] [Google Scholar]
- 24.Sipilä KH et al. Proline hydroxylation in collagen supports integrin binding by two distinct mechanisms. J Biol Chem 293, 7645–7658. (2018). [DOI] [PMC free article] [PubMed] [Google Scholar]
- 25.Hamaia S & Farndale RW Integrin recognition motifs in the human collagens. Advances in Experimental Medicine and Biology 819, 127–142 (2014). [DOI] [PubMed] [Google Scholar]
- 26.Kechagia JZ, Ivaska J & Roca-Cusachs P Integrins as biomechanical sensors of the microenvironment. Nature Reviews Molecular Cell Biology 20, 457–473 (2019). [DOI] [PubMed] [Google Scholar]
- 27.Valiathan RR, Marco M, Leitinger B, Kleer CG & Fridman R Discoidin domain receptor tyrosine kinases: new players in cancer progression. Cancer and Metastasis Reviews 31, 295–321 (2012). [DOI] [PMC free article] [PubMed] [Google Scholar]
- 28.Wasinski B et al. Discoidin Domain Receptors, DDR1b and DDR2, Promote Tumour Growth within Collagen but DDR1b Suppresses Experimental Lung Metastasis in HT1080 Xenografts. Scientific Reports 10, 1–21 (2020). [DOI] [PMC free article] [PubMed] [Google Scholar]
- 29.Zhang K et al. The collagen receptor discoidin domain receptor 2 stabilizes SNAIL1 to facilitate breast cancer metastasis. Nature Cell Biology 15, 677–687. (2013). [DOI] [PMC free article] [PubMed] [Google Scholar]
- 30.Ruiz PA & Jarai G Collagen I induces discoidin domain receptor (DDR) 1 expression through DDR2 and a JAK2-ERK1/2-mediated mechanism in primary human lung fibroblasts. J Biol Chem 286, 12912–12923 (2011). [DOI] [PMC free article] [PubMed] [Google Scholar]
- 31.Tang Q-M et al. Fetal and adult fibroblasts display intrinsic differences in tendon tissue engineering and regeneration. Scientific Reports 4, 1–12 (2014). [DOI] [PMC free article] [PubMed] [Google Scholar]
- 32.Lage K et al. Dissecting spatio-temporal protein networks driving human heart development and related disorders. Molecular Systems Biology 6, 381. (2010). [DOI] [PMC free article] [PubMed] [Google Scholar]
- 33.Manabe I, Shindo T & Nagai R Gene expression in fibroblasts and fibrosis: involvement in cardiac hypertrophy. Circulation Research 91, 1103–1113 (2002). [DOI] [PubMed] [Google Scholar]
- 34.Bedossa P & Paradis V Liver extracellular matrix in health and disease. The Journal of Pathology 200, 504–515. (2003). [DOI] [PubMed] [Google Scholar]
- 35.Tuxhorn JA et al. Reactive stroma in human prostate cancer: induction of myofibroblast phenotype and extracellular matrix remodeling. Clinical Cancer Research 8, 2912–2923 (2002). [PubMed] [Google Scholar]
- 36.Turley SJ, Cremasco V & Astarita JL Immunological hallmarks of stromal cells in the tumour microenvironment. Nature reviews immunology 15, 669 (2015). [DOI] [PubMed] [Google Scholar]
- 37.Gui Y et al. Metastatic breast carcinoma–associated fibroblasts have enhanced protumorigenic properties related to increased IGF2 expression. Clinical Cancer Research 25, 7229–7242 (2019). [DOI] [PubMed] [Google Scholar]
- 38.Pein M et al. Metastasis-initiating cells induce and exploit a fibroblast niche to fuel malignant colonization of the lungs. Nature Communications 11, 1–18 (2020). [DOI] [PMC free article] [PubMed] [Google Scholar]
- 39.Costa A et al. Fibroblast heterogeneity and immunosuppressive environment in human breast cancer. Cancer Cell 33, 463–479 (2018). [DOI] [PubMed] [Google Scholar]
- 40.Micallef L et al. The myofibroblast, multiple origins for major roles in normal and pathological tissue repair. Fibrogenesis & Tissue Repair 5, 1–5 (2012). [DOI] [PMC free article] [PubMed] [Google Scholar]
- 41.Vachon CM et al. Common breast cancer susceptibility variants in LSP1 and RAD51L1 are associated with mammographic density measures that predict breast cancer risk. Cancer Epidemiology and Prevention Biomarkers 21, 1156–1166 (2012). [DOI] [PMC free article] [PubMed] [Google Scholar]
- 42.DeFilippis RA et al. CD36 repression activates a multicellular stromal program shared by high mammographic density and tumor tissues. Cancer Discovery 2, 826–839 (2012). [DOI] [PMC free article] [PubMed] [Google Scholar]
- 43.Gonçalves BF et al. Key participants of the tumor microenvironment of the prostate: An approach of the structural dynamic of cellular elements and extracellular matrix components during epithelial–stromal transition. Acta Histochemica 117, 4–13 (2015). [DOI] [PubMed] [Google Scholar]
- 44.Tyekucheva S et al. Stromal and epithelial transcriptional map of initiation progression and metastatic potential of human prostate cancer. Nature Communications 8, 420 (2017). [DOI] [PMC free article] [PubMed] [Google Scholar]
- 45.Ling Y et al. Second harmonic generation (SHG) imaging of cancer heterogeneity in ultrasound guided biopsies of prostate in men suspected with prostate cancer. Journal of Biophotonics 10, 911–918 (2017). [DOI] [PubMed] [Google Scholar]
- 46.Penet M-F et al. Structure and Function of a Prostate Cancer Dissemination–Permissive Extracellular Matrix. Clinical Cancer Research 23, 2245–2254 (2017). [DOI] [PMC free article] [PubMed] [Google Scholar]
- 47.Andersen MK et al. Integrative metabolic and transcriptomic profiling of prostate cancer tissue containing reactive stroma. Scientific Reports 8, 14269 (2018). [DOI] [PMC free article] [PubMed] [Google Scholar]
- 48.Planche A et al. Identification of prognostic molecular features in the reactive stroma of human breast and prostate cancer. PloS one 6, e18640 (2011). [DOI] [PMC free article] [PubMed] [Google Scholar]
- 49.Barron DA & Rowley DR The reactive stroma microenvironment and prostate cancer progression. Endocrine-related Cancer 19, R187–R204 (2012). [DOI] [PMC free article] [PubMed] [Google Scholar]
- 50.Yilmaz M & Christofori G EMT, the cytoskeleton, and cancer cell invasion. Cancer and Metastasis Reviews 28, 15–33. (2009). [DOI] [PubMed] [Google Scholar]
- 51.Fang M, Yuan J, Peng C & Li Y Collagen as a double-edged sword in tumor progression. Tumor Biology 35, 2871–2882. (2014). [DOI] [PMC free article] [PubMed] [Google Scholar]
- 52.Vellinga TT et al. Collagen-rich stroma in aggressive colon tumors induces mesenchymal gene expression and tumor cell invasion. Oncogene 35, 5263–5271. (2016). [DOI] [PubMed] [Google Scholar]
- 53.Karnoub AE et al. Mesenchymal stem cells within tumour stroma promote breast cancer metastasis. Nature 449, 557–563 (2007). [DOI] [PubMed] [Google Scholar]
- 54.Jones CE et al. Stromal PTEN Regulates Extracellular Matrix Organization in the Mammary Gland. Neoplasia 21, 132–145. (2019). [DOI] [PMC free article] [PubMed] [Google Scholar]
- 55.Mao Y, Keller ET, Garfield DH, Shen K & Wang J Stromal cells in tumor microenvironment and breast cancer. Cancer and Metastasis Reviews 32, 303–315. (2013). [DOI] [PMC free article] [PubMed] [Google Scholar]
- 56.Poltavets V, Kochetkova M, Pitson SM & Samuel MS The role of the extracellular matrix and its molecular and cellular regulators in cancer cell plasticity. Frontiers in Oncology 8, 431 (2018). [DOI] [PMC free article] [PubMed] [Google Scholar]
- 57.Kotwal GJ & Chien S Macrophage differentiation in normal and accelerated wound healing. Macrophages, 353–364 (2017). [DOI] [PMC free article] [PubMed] [Google Scholar]
- 58.Tomlin H & Piccinini AM A complex interplay between the extracellular matrix and the innate immune response to microbial pathogens. Immunology 155, 186–201 (2018). [DOI] [PMC free article] [PubMed] [Google Scholar]
- 59.Yu G, Ibarra GH & Kaminski N Fibrosis: Lessons from OMICS analyses of the human lung. Matrix Biology 68, 422–434 (2018). [DOI] [PMC free article] [PubMed] [Google Scholar]
- 60.Dorr KM & Conlon FL Proteomic-based approaches to cardiac development and disease. Current Opinion in Chemical Biology 48, 150–157 (2019). [DOI] [PMC free article] [PubMed] [Google Scholar]
- 61.Naba A et al. The extracellular matrix: Tools and insights for the “omics” era. Matrix Biology 49, 10–24 (2016). [DOI] [PMC free article] [PubMed] [Google Scholar]
- 62.Lindsey ML, Hall ME, Harmancey R & Ma Y Adapting extracellular matrix proteomics for clinical studies on cardiac remodeling post-myocardial infarction. Clinical Proteomics 13, 1–8 (2016). [DOI] [PMC free article] [PubMed] [Google Scholar]
- 63.Taha IN & Naba A Exploring the extracellular matrix in health and disease using proteomics. Essays in Biochemistry 63, 417–432 (2019). [DOI] [PubMed] [Google Scholar]
- 64.Bingham GC, Lee F, Naba A & Barker TH Spatial-omics: Novel approaches to probe cell heterogeneity and extracellular matrix biology. Matrix Biology 91, 152–166 (2020). [DOI] [PMC free article] [PubMed] [Google Scholar]
- 65.Beach RL, Burton WV, Hendricks WJ & Festoff BW Extracellular matrix synthesis by skeletal muscle in culture. Proteins and effect of enzyme degradation. J Biol Chem 257, 11437–11442 (1982). [PubMed] [Google Scholar]
- 66.Xiao Z et al. Analysis of the extracellular matrix vesicle proteome in mineralizing osteoblasts. Journal of cellular physiology 210, 325–335 (2007). [DOI] [PubMed] [Google Scholar]
- 67.Tölle RC & Dengjel J in Skin Tissue Engineering 193–204 (Springer, 2019). [Google Scholar]
- 68.Welle KA et al. Time-resolved analysis of proteome dynamics by tandem mass tags and stable isotope labeling in cell culture (TMT-SILAC) hyperplexing. Molecular & Cellular Proteomics 15, 3551–3563 (2016). [DOI] [PMC free article] [PubMed] [Google Scholar]
- 69.Zhang F, Xiao Y & Wang Y SILAC-based quantitative proteomic analysis unveils arsenite-induced perturbation of multiple pathways in human skin fibroblast cells. Chemical Research in Toxicology 30, 1006–1014 (2017). [DOI] [PMC free article] [PubMed] [Google Scholar]
- 70.Valdés A, Zhao H, Pettersson U & Lind SB Time-resolved proteomics of adenovirus infected cells. PLoS One 13, e0204522 (2018). [DOI] [PMC free article] [PubMed] [Google Scholar]
- 71.Wu X et al. Quantitative phosphoproteomic analysis reveals reciprocal activation of receptor tyrosine kinases between cancer epithelial cells and stromal fibroblasts. Clinical Proteomics 15, 1–14 (2018). [DOI] [PMC free article] [PubMed] [Google Scholar]
- 72.Ho JJD et al. A network of RNA-binding proteins controls translation efficiency to activate anaerobic metabolism. Nature Communications 11, 1–16 (2020). [DOI] [PMC free article] [PubMed] [Google Scholar]
- 73.Nagaraj N et al. Deep proteome and transcriptome mapping of a human cancer cell line. Molecular Systems Biology 7, 548 (2011). [DOI] [PMC free article] [PubMed] [Google Scholar]
- 74.Doll S et al. Region and cell-type resolved quantitative proteomic map of the human heart. Nature Communications 8, 1–13 (2017). [DOI] [PMC free article] [PubMed] [Google Scholar]
- 75.Budnik B, Levy E, Harmange G & Slavov N SCoPE-MS: mass spectrometry of single mammalian cells quantifies proteome heterogeneity during cell differentiation. Genome Biology 19, 1–12 (2018). [DOI] [PMC free article] [PubMed] [Google Scholar]
- 76.Wagner DE & Klein AM Lineage tracing meets single-cell omics: opportunities and challenges. Nature Reviews Genetics 21, 410–427 (2020). [DOI] [PMC free article] [PubMed] [Google Scholar]
- 77.Labib M & Kelley SO Single-cell analysis targeting the proteome. Nature Reviews Chemistry 4, 143–158 (2020). [DOI] [PubMed] [Google Scholar]
- 78.Eckert MA et al. Proteomics reveals NNMT as a master metabolic regulator of cancer-associated fibroblasts. Nature 569, 723–728 (2019). [DOI] [PMC free article] [PubMed] [Google Scholar]
- 79.Braakman RBH et al. Proteomic characterization of microdissected breast tissue environment provides a protein‐level overview of malignant transformation. Proteomics 17, 1600213 (2017). [DOI] [PMC free article] [PubMed] [Google Scholar]
- 80.Huang P et al. Spatial proteome profiling by immunohistochemistry-based laser capture microdissection and data-independent acquisition proteomics. Analytica Chimica Acta 1127, 140–148 (2020). [DOI] [PubMed] [Google Scholar]
- 81.Kelly RT Single-Cell Proteomics: Progress and Prospects. Molecular & Cellular Proteomics 19, 1739–1748 (2020). [DOI] [PMC free article] [PubMed] [Google Scholar]
- 82.Cahill JF, Riba J & Kertesz V Rapid, untargeted chemical profiling of single cells in their native environment. Analytical chemistry 91, 6118–6126 (2019). [DOI] [PubMed] [Google Scholar]
- 83.Castaing R & Slodzian G Microanalyse par émission ionique secondaire. J Microscopie 1, 395–410 (1962). [Google Scholar]
- 84.Galle P, Hamburger J & Castaing R Sur une nouvelle méthode d’analyse cellulaire utilisant le phénomène d’émission ionique secondaire. Ann Phys Biol Med 42, 83–94 (1970). [Google Scholar]
- 85.Caprioli RM, Farmer TB & Gile J Molecular imaging of biological samples: localization of peptides and proteins using MALDI-TOF MS. Analytical Chemistry 69, 4751–4760 (1997). [DOI] [PubMed] [Google Scholar]
- 86.Angel PM & Caprioli RM Matrix-assisted laser desorption ionization imaging mass spectrometry: in situ molecular mapping. Biochemistry 52, 3818–3828. (2013). [DOI] [PMC free article] [PubMed] [Google Scholar]
- 87.Norris JL & Caprioli RM Analysis of tissue specimens by matrix-assisted laser desorption/ionization imaging mass spectrometry in biological and clinical research. Chemical Reviews 113, 2309–2342. (2013). [DOI] [PMC free article] [PubMed] [Google Scholar]
- 88.Vaysse P-M, Heeren RMA, Porta T & Balluff B Mass spectrometry imaging for clinical research–latest developments, applications, and current limitations. Analyst 142, 2690–2712 (2017). [DOI] [PubMed] [Google Scholar]
- 89.Siegel TP et al. Mass spectrometry imaging and integration with other imaging modalities for greater molecular understanding of biological tissues. Molecular Imaging and Biology 20, 888–901 (2018). [DOI] [PMC free article] [PubMed] [Google Scholar]
- 90.Caprioli RM Imaging mass spectrometry: a perspective. Journal of Biomolecular Techniques: JBT 30, 7 (2019). [DOI] [PMC free article] [PubMed] [Google Scholar]
- 91.Angel PM et al. Zonal Regulation of Collagen Types and Post-Translational Modifications In Prostatic Benign and Cancer Tissues By Imaging Mass Spectrometry. The Prostate In press. (2020). [DOI] [PMC free article] [PubMed] [Google Scholar]
- 92.Angel PM et al. Extracellular Matrix Alterations in Low Grade Lung Adenocarcinoma Compared to Normal Lung Tissue by Imaging Mass Spectrometry. Journal of Mass Spectrometry In press (2019). [DOI] [PMC free article] [PubMed] [Google Scholar]
- 93.Angel PM et al. Mapping Extracellular Matrix Proteins in Formalin-Fixed, Paraffin-Embedded Tissues by MALDI Imaging Mass Spectrometry. Journal of Proteome Research 17, 635–646, doi: 10.1021/acs.jproteome.7b00713 (2018). [DOI] [PMC free article] [PubMed] [Google Scholar]
- 94.Angel PM et al. Extracellular Matrix Imaging of Breast Tissue Pathologies by MALDI Imaging Mass Spectrometry. Proteomics Clinical Applications 13 (2019). [DOI] [PMC free article] [PubMed] [Google Scholar]
- 95.Yin R, Burnum-Johnson KE, Sun X, Dey SK & Laskin J High spatial resolution imaging of biological tissues using nanospray desorption electrospray ionization mass spectrometry. Nature Protocols 14, 3445–3470 (2019). [DOI] [PMC free article] [PubMed] [Google Scholar]
- 96.Jurchen JC, Rubakhin SS & Sweedler JV MALDI-MS imaging of features smaller than the size of the laser beam. Journal of the American Society for Mass Spectrometry 16, 1654–1659. (2005). [DOI] [PubMed] [Google Scholar]
- 97.Schober Y, Guenther S, Spengler B & Römpp A Single cell matrix-assisted laser desorption/ionization mass spectrometry imaging. Analytical Chemistry 84, 6293–6297 (2012). [DOI] [PubMed] [Google Scholar]
- 98.Zavalin A et al. Direct imaging of single cells and tissue at sub-cellular spatial resolution using transmission geometry MALDI MS. Journal of Mass Spectrometry 47, 1473–1481. (2012). [DOI] [PubMed] [Google Scholar]
- 99.Yang B, Tsui T, Caprioli RM & Norris JL in Single Cell Metabolism 125–134 (Springer, 2020). [Google Scholar]
- 100.Colliver TL et al. Atomic and molecular imaging at the single-cell level with TOF-SIMS. Analytical Chemistry 69, 2225–2231 (1997). [DOI] [PubMed] [Google Scholar]
- 101.Keren L et al. MIBI-TOF: A multiplexed imaging platform relates cellular phenotypes and tissue structure. Science Advances 5, eaax5851 (2019). [DOI] [PMC free article] [PubMed] [Google Scholar]
- 102.Van Malderen SJM et al. Quantitative determination and subcellular imaging of Cu in single cells via laser ablation-ICP-mass spectrometry using high-density microarray gelatin standards. Analytical chemistry 88, 5783–5789 (2016). [DOI] [PubMed] [Google Scholar]
- 103.Anderson DMG, Spraggins JM, Rose KL & Schey KL High Spatial Resolution Imaging Mass Spectrometry of Human Optic Nerve Lipids and Proteins. Journal of the American Society for Mass Spectrometry 26, 940–947 (2015). [DOI] [PMC free article] [PubMed] [Google Scholar]
- 104.Angel PM, Spraggins JM, Scott Baldwin H & Caprioli R Enhanced Sensitivity for High Spatial Resolution Lipid Analysis by Negative Ion Mode Matrix Assisted Laser Desorption Ionization Imaging Mass Spectrometry. Analytical Chemistry 84, 1557–1564. (2012). [DOI] [PMC free article] [PubMed] [Google Scholar]
- 105.Lim MS & Elenitoba-Johnson KSJ Proteomics in pathology research. Laboratory Investigation 84, 1227–1244 (2004). [DOI] [PubMed] [Google Scholar]
- 106.Black AP, Angel PM, Drake RR & Mehta AS Antibody Panel Based N‐Glycan Imaging for N‐Glycoprotein Biomarker Discovery. Current Protocols in Protein Science 98, e99 (2019). [DOI] [PMC free article] [PubMed] [Google Scholar]
- 107.Angel PM et al. A Rapid Array-Based Approach to N-Glycan Profiling of Cultured Cells. Journal of Proteome Research 18, 3630–3639. (2019). [DOI] [PMC free article] [PubMed] [Google Scholar]
- 108.Blaschke CRK, Black AP, Mehta AS, Angel PM & Drake RR Rapid N-Glycan Profiling of Serum and Plasma by a Novel Slide-Based Imaging Mass Spectrometry Workflow. Journal of the American Society for Mass Spectrometry 31, 2511–2520 (2020). [DOI] [PMC free article] [PubMed] [Google Scholar]
- 109.Iloro I, Bueno A, Calvo J, Urreta H & Elortza F Langartech: A custom-made MALDI matrix sprayer for MALDI imaging mass spectrometry. Journal of laboratory automation 21, 260–267 (2016). [DOI] [PubMed] [Google Scholar]
- 110.Anderton CR, Chu RK, Tolić N, Creissen A & Paša-Tolić L Utilizing a robotic sprayer for high lateral and mass resolution MALDI FT-ICR MSI of microbial cultures. Journal of the American Society for Mass Spectrometry 27, 556–559 (2016). [DOI] [PubMed] [Google Scholar]
- 111.Huizing LRS et al. Development and evaluation of matrix application techniques for high throughput mass spectrometry imaging of tissues in the clinic. Clinical Mass Spectrometry 12, 7–15 (2019). [DOI] [PMC free article] [PubMed] [Google Scholar]
- 112.Zavalin A, Yang J, Hayden K, Vestal M & Caprioli RM Tissue protein imaging at 1 μm laser spot diameter for high spatial resolution and high imaging speed using transmission geometry MALDI TOF MS. Analytical and Bioanalytical Chemistry 407, 2337–2342 (2015). [DOI] [PMC free article] [PubMed] [Google Scholar]
- 113.Dekker TJ et al. Multicenter matrix-assisted laser desorption/ionization mass spectrometry imaging (MALDI MSI) identifies proteomic differences in breast-cancer-associated stroma. Journal of Proteome Research 13, 4730–4738 (2014). [DOI] [PubMed] [Google Scholar]
- 114.L’Imperio V et al. MALDI imaging in Fabry nephropathy: a multicenter study. Journal of nephrology 33, 299–306 (2019). [DOI] [PubMed] [Google Scholar]
- 115.Ly A et al. Site‐to‐Site Reproducibility and Spatial Resolution in MALDI–MSI of Peptides from Formalin‐Fixed Paraffin‐Embedded Samples. PROTEOMICS–Clinical Applications 13, 1800029 (2019). [DOI] [PMC free article] [PubMed] [Google Scholar]
- 116.Groseclose MR, Andersson M, Hardesty WM & Caprioli RM Identification of proteins directly from tissue: in situ tryptic digestions coupled with imaging mass spectrometry. Journal of Mass Spectrometry 42, 254–262 (2007). [DOI] [PubMed] [Google Scholar]
- 117.Powers TW et al. Matrix assisted laser desorption ionization imaging mass spectrometry workflow for spatial profiling analysis of N-linked glycan expression in tissues. Analytical Chemistry 85, 9799–9806. (2013). [DOI] [PMC free article] [PubMed] [Google Scholar]
- 118.Angel PM et al. Mapping Extracellular Matrix Proteins in Formalin-Fixed, Paraffin-Embedded Tissues by MALDI Imaging Mass Spectrometry. Journal of Proteome Research, doi: 10.1021/acs.jproteome.7b00713 (2018). [DOI] [PMC free article] [PubMed] [Google Scholar]
- 119.Angel PM et al. Mapping Extracellular Matrix Proteins in Formalin-Fixed, Paraffin-embedded Tissues by MALDI Imaging Mass Spectrometry. Journal of Proteome Research 17, 635–646. (2018). [DOI] [PMC free article] [PubMed] [Google Scholar]
- 120.Lanni EJ, Rubakhin SS & Sweedler JV Mass spectrometry imaging and profiling of single cells. Journal of Proteomics 75, 5036–5051 (2012). [DOI] [PMC free article] [PubMed] [Google Scholar]
- 121.Kompauer M, Heiles S & Spengler B Atmospheric pressure MALDI mass spectrometry imaging of tissues and cells at 1.4-μm lateral resolution. Nature Methods 14, 90–96 (2017). [DOI] [PubMed] [Google Scholar]
- 122.Bednařík A et al. MALDI MS imaging at acquisition rates exceeding 100 pixels per second. Journal of The American Society for Mass Spectrometry 30, 289–298 (2018). [DOI] [PubMed] [Google Scholar]
- 123.Prentice BM, Chumbley CW & Caprioli RM High‐speed MALDI MS/MS imaging mass spectrometry using continuous raster sampling. Journal of Mass Spectrometry 50, 703–710 (2015). [DOI] [PMC free article] [PubMed] [Google Scholar]
- 124.Jungmann JH et al. Fast, high resolution mass spectrometry imaging using a medipix pixelated detector. Journal of the American Society for Mass Spectrometry 21, 2023–2030 (2011). [DOI] [PubMed] [Google Scholar]
- 125.Spraggins JM et al. Next‐generation technologies for spatial proteomics: integrating ultra‐high speed MALDI‐TOF and high mass resolution MALDI FTICR imaging mass spectrometry for protein analysis. Proteomics 16, 1678–1689 (2016). [DOI] [PMC free article] [PubMed] [Google Scholar]
- 126.Spraggins JM et al. High-performance molecular imaging with MALDI trapped ion-mobility time-of-flight (timsTOF) mass spectrometry. Analytical chemistry 91, 14552–14560 (2019). [DOI] [PMC free article] [PubMed] [Google Scholar]
- 127.Fu T et al. In situ isobaric lipid mapping by MALDI–ion mobility separation–mass spectrometry imaging. Journal of Mass Spectrometry 55, e4531 (2020). [DOI] [PubMed] [Google Scholar]
- 128.Soltwisch J et al. Mass spectrometry imaging with laser-induced postionization. Science 348, 211–215 (2015). [DOI] [PubMed] [Google Scholar]
- 129.Soltwisch J et al. MALDI-2 on a trapped ion mobility quadrupole time-of-flight instrument for rapid mass spectrometry imaging and ion mobility separation of complex lipid profiles. Analytical Chemistry 92, 8697–8703 (2020). [DOI] [PubMed] [Google Scholar]
- 130.Potthoff A, Dreisewerd K & Soltwisch J Detailed Characterization of the Postionization Efficiencies in MALDI-2 as a Function of Relevant Input Parameters. Journal of the American Society for Mass Spectrometry 31, 1844–1853 (2020). [DOI] [PubMed] [Google Scholar]
- 131.Heijs B, Potthoff A, Soltwisch J & Dreisewerd K MALDI-2 for the enhanced analysis of N-linked glycans by mass spectrometry imaging. Analytical chemistry 92, 13904–13911 (2020). [DOI] [PMC free article] [PubMed] [Google Scholar]
- 132.McMillen JC, Fincher JA, Klein DR, Spraggins JM & Caprioli RM Effect of MALDI matrices on lipid analyses of biological tissues using MALDI‐2 postionization mass spectrometry. Journal of Mass Spectrometry 55, e4663 (2020). [DOI] [PMC free article] [PubMed] [Google Scholar]
- 133.Purves RW & Guevremont R Electrospray ionization high-field asymmetric waveform ion mobility spectrometry− mass spectrometry. Analytical chemistry 71, 2346–2357 (1999). [DOI] [PubMed] [Google Scholar]
- 134.Feider CL, Elizondo N & Eberlin LS Ambient ionization and FAIMS mass spectrometry for enhanced imaging of multiply charged molecular ions in biological tissues. Analytical Chemistry 88, 11533–11541 (2016). [DOI] [PMC free article] [PubMed] [Google Scholar]
- 135.Shvartsburg AA & Smith RD Fundamentals of traveling wave ion mobility spectrometry. Analytical chemistry 80, 9689–9699 (2008). [DOI] [PMC free article] [PubMed] [Google Scholar]
- 136.Stauber J et al. On-tissue protein identification and imaging by MALDI-ion mobility mass spectrometry. Journal of the American Society for Mass Spectrometry 21, 338–347 (2010). [DOI] [PubMed] [Google Scholar]
- 137.Fenn LS & McLean JA Biomolecular structural separations by ion mobility–mass spectrometry. Analytical and Bioanalytical Chemistry 391, 905–909 (2008). [DOI] [PubMed] [Google Scholar]
- 138.Mesa Sanchez D et al. Ion Mobility-Mass Spectrometry Imaging Workflow. Journal of the American Society for Mass Spectrometry 31, 2437–2442 (2020). [DOI] [PubMed] [Google Scholar]
- 139.Rivera ES, Djambazova KV, Neumann EK, Caprioli RM & Spraggins JM Integrating ion mobility and imaging mass spectrometry for comprehensive analysis of biological tissues: A brief review and perspective. Journal of Mass Spectrometry 55, e4614 (2020). [DOI] [PMC free article] [PubMed] [Google Scholar]
- 140.Ujma J et al. Cyclic ion mobility mass spectrometry distinguishes anomers and open-ring forms of pentasaccharides. Journal of the American Society for Mass Spectrometry 30, 1028–1037 (2019). [DOI] [PMC free article] [PubMed] [Google Scholar]
- 141.Giles K et al. A cyclic ion mobility-mass spectrometry system. Analytical chemistry 91, 8564–8573 (2019). [DOI] [PubMed] [Google Scholar]
- 142.Michelmann K, Silveira JA, Ridgeway ME & Park MA Fundamentals of trapped ion mobility spectrometry. Journal of the American Society for Mass Spectrometry 26, 14–24 (2014). [DOI] [PubMed] [Google Scholar]
- 143.Silveira JA, Michelmann K, Ridgeway ME & Park MA Fundamentals of trapped ion mobility spectrometry part II: fluid dynamics. Journal of the American Society for Mass Spectrometry 27, 585–595 (2016). [DOI] [PubMed] [Google Scholar]
- 144.Ridgeway ME, Lubeck M, Jordens J, Mann M & Park MA Trapped ion mobility spectrometry: A short review. International Journal of Mass Spectrometry 425, 22–35 (2018). [Google Scholar]
- 145.Bien T, Hambleton EA, Dreisewerd K & Soltwisch J Molecular insights into symbiosis—mapping sterols in a marine flatworm-algae-system using high spatial resolution MALDI-2-MS imaging with ion mobility separation. Analytical and Bioanalytical Chemistry, 1–11 (2020). [DOI] [PMC free article] [PubMed] [Google Scholar]
- 146.Bowman AP et al. Ultra-high mass resolving power, mass accuracy, and dynamic range MALDI mass spectrometry imaging by 21-T FT-ICR MS. Analytical Chemistry 92, 3133–3142 (2020). [DOI] [PMC free article] [PubMed] [Google Scholar]
- 147.Xie YR, Castro DC, Lam F & Sweedler JV Accelerating Fourier Transform-Ion Cyclotron Resonance Mass Spectrometry Imaging Using a Subspace Approach. Journal of the American Society for Mass Spectrometry 31, 2338–2347 (2020). [DOI] [PMC free article] [PubMed] [Google Scholar]
- 148.Alexandrov T MALDI imaging mass spectrometry: statistical data analysis and current computational challenges. BMC bioinformatics 13, 1–13 (2012). [DOI] [PMC free article] [PubMed] [Google Scholar]
- 149.Trede D et al. On the importance of mathematical methods for analysis of MALDI-imaging mass spectrometry data. Journal of Integrative Bioinformatics 9, 1–11 (2012). [DOI] [PubMed] [Google Scholar]
- 150.Verbeeck N, Caprioli RM & Van de Plas R Unsupervised machine learning for exploratory data analysis in imaging mass spectrometry. Mass Spectrometry Reviews 39, 245–291 (2018). [DOI] [PMC free article] [PubMed] [Google Scholar]
- 151.Alexandrov T et al. Spatial segmentation of imaging mass spectrometry data with edge-preserving image denoising and clustering. Journal of proteome research 9, 6535–6546 (2010). [DOI] [PubMed] [Google Scholar]
- 152.Boskamp T et al. Using the chemical noise background in MALDI mass spectrometry imaging for mass alignment and calibration. Analytical Chemistry 92, 1301–1308 (2019). [DOI] [PubMed] [Google Scholar]
- 153.Lieb F, Boskamp T & Stark H-G Peak detection for MALDI mass spectrometry imaging data using sparse frame multipliers. Journal of Proteomics 225, 103852 (2020). [DOI] [PubMed] [Google Scholar]
- 154.La Rocca R et al. Using Biological Signals for Mass Recalibration of Mass Spectrometry Imaging Data. (2020).
- 155.Eriksson JO et al. MSIWarp: A General Approach to Mass Alignment in Mass Spectrometry Imaging. Analytical Chemistry (2020). [DOI] [PMC free article] [PubMed] [Google Scholar]
- 156.Alexandrov T & Kobarg JH Efficient spatial segmentation of large imaging mass spectrometry datasets with spatially aware clustering. Bioinformatics 27, i230–i238 (2011). [DOI] [PMC free article] [PubMed] [Google Scholar]
- 157.Van de Plas R, Yang J, Spraggins J & Caprioli RM Image fusion of mass spectrometry and microscopy: a multimodality paradigm for molecular tissue mapping. Nature Methods 12, 366–372 (2015). [DOI] [PMC free article] [PubMed] [Google Scholar]
- 158.Ščupáková K, Terzopoulos V, Jain S, Smeets D & Heeren RMA A patch-based super resolution algorithm for improving image resolution in clinical mass spectrometry. Scientific Reports 9, 1–11 (2019). [DOI] [PMC free article] [PubMed] [Google Scholar]
- 159.Schwamborn K Imaging mass spectrometry in biomarker discovery and validation. Journal of Proteomics 75, 4990–4998 (2012). [DOI] [PubMed] [Google Scholar]
- 160.Abdelmoula WM et al. msiPL: Non-linear Manifold and Peak Learning of Mass Spectrometry Imaging Data Using Artificial Neural Networks. bioRxiv (2020). [DOI] [PMC free article] [PubMed] [Google Scholar]
- 161.Prade VM et al. De novo discovery of metabolic heterogeneity with immunophenotype-guided imaging mass spectrometry. Molecular Metabolism 36, 100953 (2020). [DOI] [PMC free article] [PubMed] [Google Scholar]
- 162.Blutke A et al. Light sheet fluorescence microscopy guided MALDI-imaging mass spectrometry of cleared tissue samples. Scientific Reports 10, 1–13 (2020). [DOI] [PMC free article] [PubMed] [Google Scholar]
- 163.Nikitina A et al. A Co-registration Pipeline for Multimodal MALDI and Confocal Imaging Analysis of Stem Cell Colonies. Journal of the American Society for Mass Spectrometry 31, 986–989 (2020). [DOI] [PMC free article] [PubMed] [Google Scholar]
- 164.Patterson NH, Tuck M, Van de Plas R & Caprioli RM Advanced registration and analysis of MALDI imaging mass spectrometry measurements through autofluorescence microscopy. Analytical chemistry 90, 12395–12403 (2018). [DOI] [PubMed] [Google Scholar]
- 165.Thiele H et al. 2D and 3D MALDI-imaging: conceptual strategies for visualization and data mining. Biochimica et Biophysica Acta (BBA)-Proteins and Proteomics 1844, 117–137 (2014). [DOI] [PubMed] [Google Scholar]
- 166.Race AM et al. Correlative Hyperspectral Imaging Using a Dimensionality-Reduction-Based Image Fusion Method. Analytical Chemistry 92, 10979–10988 (2020). [DOI] [PubMed] [Google Scholar]
- 167.Jones MA et al. Discovering new lipidomic features using cell type specific fluorophore expression to provide spatial and biological specificity in a multimodal workflow with MALDI Imaging Mass Spectrometry. Analytical chemistry 92, 7079–7086 (2020). [DOI] [PMC free article] [PubMed] [Google Scholar]
- 168.Race AM et al. Deep Learning-Based Annotation Transfer between Molecular Imaging Modalities: An Automated Workflow for Multimodal Data Integration. Analytical Chemistry (2021). [DOI] [PubMed] [Google Scholar]
- 169.Bemis KD et al. Cardinal: an R package for statistical analysis of mass spectrometry-based imaging experiments. Bioinformatics 31, 2418–2420 (2015). [DOI] [PMC free article] [PubMed] [Google Scholar]
- 170.Race AM et al. SpectralAnalysis: software for the masses. Analytical chemistry 88, 9451–9458 (2016). [DOI] [PubMed] [Google Scholar]
- 171.Bokhart MT, Nazari M, Garrard KP & Muddiman DC MSiReader v1. 0: evolving open-source mass spectrometry imaging software for targeted and untargeted analyses. Journal of The American Society for Mass Spectrometry 29, 8–16 (2017). [DOI] [PMC free article] [PubMed] [Google Scholar]
- 172.Seeley EH & Caprioli RM 3D imaging by mass spectrometry: a new frontier. Analytical Chemistry 84, 2105–2110 (2012). [DOI] [PMC free article] [PubMed] [Google Scholar]
- 173.Palmer AD & Alexandrov T Serial 3D imaging mass spectrometry at its tipping point. Analytical chemistry 87, 4055–4062 (2015). [DOI] [PubMed] [Google Scholar]
- 174.Dueñas ME, Essner JJ & Lee YJ 3D MALDI mass spectrometry imaging of a single cell: spatial mapping of lipids in the embryonic development of zebrafish. Scientific Reports 7, 14946 (2017). [DOI] [PMC free article] [PubMed] [Google Scholar]
- 175.Vos DRN, Ellis SR, Balluff B & Heeren RM A. Experimental and Data Analysis Considerations for Three-Dimensional Mass Spectrometry Imaging in Biomedical Research. Molecular Imaging and Biology, 1–11 (2020). [DOI] [PMC free article] [PubMed] [Google Scholar]
- 176.Katz L et al. Dual laser and desorption electrospray ionization mass spectrometry imaging using the same interface. Analytical chemistry 92, 6349–6357 (2020). [DOI] [PubMed] [Google Scholar]
- 177.Yan X et al. Cell-Type-Specific Metabolic Profiling Achieved by Combining Desorption Electrospray Ionization Mass Spectrometry Imaging and Immunofluorescence Staining. Analytical Chemistry 92, 13281–13289 (2020). [DOI] [PMC free article] [PubMed] [Google Scholar]
- 178.Verbeeck N et al. Connecting imaging mass spectrometry and magnetic resonance imaging-based anatomical atlases for automated anatomical interpretation and differential analysis. Biochimica et Biophysica Acta (BBA)-Proteins and Proteomics 1865, 967–977 (2017). [DOI] [PubMed] [Google Scholar]
- 179.Drake RR, Angel PM, Wu J, Pachynski RK & Ippolito JE How else can we approach prostate cancer biomarker discovery? Expert Rev Mol Diagnosis Sept 10, doi: 10.1080/14737159.14732019.11665507. [Epub ahead of print] (2019). [DOI] [PMC free article] [PubMed] [Google Scholar]
- 180.Abdelmoula WM et al. Automatic 3D nonlinear registration of mass spectrometry imaging and magnetic resonance imaging data. Analytical Chemistry 91, 6206–6216 (2019). [DOI] [PMC free article] [PubMed] [Google Scholar]
- 181.Tuck M et al. Multimodal Imaging Based on Vibrational Spectroscopies and Mass Spectrometry Imaging Applied to Biological Tissue: A Multiscale and Multiomics Review. Analytical Chemistry 93, 445–477 (2020). [DOI] [PubMed] [Google Scholar]
- 182.Xie YR, Castro DC, Bell SE, Rubakhin SS & Sweedler JV Single-Cell Classification Using Mass Spectrometry through Interpretable Machine Learning. Analytical Chemistry 92, 9338–9347 (2020). [DOI] [PMC free article] [PubMed] [Google Scholar]
- 183.Ščupáková K, Dewez F, Walch AK, Heeren RMA & Balluff B Morphometric Cell Classification for Single‐Cell MALDI‐Mass Spectrometry Imaging. Angewandte Chemie 132, 17600–17603 (2020). [DOI] [PMC free article] [PubMed] [Google Scholar]
- 184.Ovchinnikova K, Kovalev V, Stuart L & Alexandrov T OffsampleAI: artificial intelligence approach to recognize off-sample mass spectrometry images. BMC Bioinformatics 21, 1–11 (2020). [DOI] [PMC free article] [PubMed] [Google Scholar]
- 185.Alexandrov T Spatial metabolomics and imaging mass spectrometry in the age of artificial intelligence. Annual Review of Biomedical Data Science 3, 61–87 (2020). [DOI] [PMC free article] [PubMed] [Google Scholar]
- 186.Behrmann J et al. Deep learning for tumor classification in imaging mass spectrometry. Bioinformatics 34, 1215–1223 (2018). [DOI] [PubMed] [Google Scholar]
- 187.Clift CL, Mehta AS, Drake RR & Angel PM Multiplexed Imaging Mass Spectrometry of Histological Staining, N-glycan and Extracellular Matrix from One Tissue Section: A Tool for Fibrosis Research. Methods in Molecular Biology In press (2021). [DOI] [PubMed] [Google Scholar]
- 188.Rujchanarong D & AngelP. PTEN regulation by Integration of Immunohistochemistry and imaging mass spectrometry Cancer (2021). [DOI] [PMC free article] [PubMed] [Google Scholar]
- 189.McDowell CT et al. Imaging Mass Spectrometry and Lectin Analysis of N-linked Glycans in Carbohydrate Antigen Defined Pancreatic Cancer Tissues. Molecular & Cellular Proteomics, 100012 (2020). [DOI] [PMC free article] [PubMed] [Google Scholar]
- 190.Cornett DS et al. A novel histology-directed strategy for MALDI-MS tissue profiling that improves throughput and cellular specificity in human breast cancer. Molecular & Cellular Proteomics 5, 1975–1983. (2006). [DOI] [PubMed] [Google Scholar]
- 191.Xie Y, Naizabekov S, Chen Z & Tokay T Power of PTEN/AKT: Molecular switch between tumor suppressors and oncogenes. Oncology Letters 12, 375–378 (2016). [DOI] [PMC free article] [PubMed] [Google Scholar]
- 192.Cillero-Pastor B & Heeren RMA Matrix-assisted laser desorption ionization mass spectrometry imaging for peptide and protein analyses: a critical review of on-tissue digestion. Journal of Proteome Research 13, 325–335 (2014). [DOI] [PubMed] [Google Scholar]
- 193.Angel PM et al. Spatial N-glycomics of the human aortic valve in development and pediatric endstage congenital aortic valve stenosis. Journal of Molecular and Cellular Cardiology 154, 6–20 (2021). [DOI] [PMC free article] [PubMed] [Google Scholar]
- 194.West CA, Drake RR & Mehta AS Enzymatic Approach to Distinguish Fucosylation Isomers of N-linked Glycans in Tissues Using MALDI Imaging Mass Spectrometry. Journal of Proteome Research 19, 2989–2996 (2020). [DOI] [PMC free article] [PubMed] [Google Scholar]
- 195.West CA et al. N-linked glycan branching and fucosylation are increased directly in hepatocellular carcinoma tissue as determined through in situ glycan imaging. Journal of Proteome Research 17, 3454–3462. (2018). [DOI] [PMC free article] [PubMed] [Google Scholar]
- 196.Clift CL, Drake RR, Mehta A & Angel PM Multiplexed imaging mass spectrometry of the extracellular matrix using serial enzyme digests from formalin-fixed paraffin-embedded tissue sections. Analytical and Bioanalytical Chemistry, 1–11 (2020). [DOI] [PMC free article] [PubMed] [Google Scholar]
- 197.Angel PM, Mehta A, Norris-Caneda K & Drake RR in Tissue Proteomics: Methods and Protocols (eds Sarwal Minnie M & Sigdel Tara K) 225–241 (Springer New York, New York, NY, 2018). [Google Scholar]
- 198.Banyard J et al. Collagen XXIII expression is associated with prostate cancer recurrence and distant metastases. Clinical Cancer Research 13, 2634–2642 (2007). [DOI] [PubMed] [Google Scholar]
- 199.Gressner OA, Weiskirchen R & Gressner AM Biomarkers of liver fibrosis: clinical translation of molecular pathogenesis or based on liver-dependent malfunction tests. Clinica Chimica Acta 381, 107–113 (2007). [DOI] [PubMed] [Google Scholar]
- 200.Conklin MW et al. Aligned collagen is a prognostic signature for survival in human breast carcinoma. The American Journal of Pathology 178, 1221–1232. (2011). [DOI] [PMC free article] [PubMed] [Google Scholar]
- 201.Naba A et al. Extracellular matrix signatures of human primary metastatic colon cancers and their metastases to liver. BMC Cancer 14, 1–12 (2014). [DOI] [PMC free article] [PubMed] [Google Scholar]
- 202.Farrar CT et al. CM-101: type I collagen–targeted MR imaging probe for detection of liver fibrosis. Radiology 287, 581–589 (2017). [DOI] [PMC free article] [PubMed] [Google Scholar]
- 203.Wei B et al. Human colorectal cancer progression correlates with LOX-induced ECM stiffening. International journal of biological sciences 13, 1450 (2017). [DOI] [PMC free article] [PubMed] [Google Scholar]
- 204.Lin L et al. Prognostic value of tumor stromal collagen features in patients with hepatocellular carcinoma revealed by second-harmonic generation microscopy. Experimental and Molecular Pathology 116, 104513 (2020). [DOI] [PubMed] [Google Scholar]
- 205.Xu S et al. The role of collagen in cancer: from bench to bedside. Journal of translational medicine 17, 309. (2019). [DOI] [PMC free article] [PubMed] [Google Scholar]
- 206.Yuan L et al. Overexpression of COL3A1 confers a poor prognosis in human bladder cancer identified by co-expression analysis. Oncotarget 8, 70508. (2017). [DOI] [PMC free article] [PubMed] [Google Scholar]
- 207.Walraven M & Hinz B Therapeutic approaches to control tissue repair and fibrosis: Extracellular matrix as a game changer. Matrix Biology 71, 205–224 (2018). [DOI] [PubMed] [Google Scholar]
- 208.Walsh G & Jefferis R Post-translational modifications in the context of therapeutic proteins. Nature Biotechnology 24, 1241–1252 (2006). [DOI] [PubMed] [Google Scholar]
- 209.Walsh G Post-translational modifications in the context of therapeutic proteins: an introductory overview. Post-translational Modification of Protein Biopharmaceuticals. Walsh G (Ed.). Wiley-Blackwell, Weinheim, Germany, 1–14 (2009). [Google Scholar]
- 210.Takai K, Le A, Weaver VM & Werb Z Targeting the cancer-associated fibroblasts as a treatment in triple-negative breast cancer. Oncotarget 7, 82889. (2016). [DOI] [PMC free article] [PubMed] [Google Scholar]
- 211.Rhim AD et al. Stromal elements act to restrain, rather than support, pancreatic ductal adenocarcinoma. Cancer Cell 25, 735–747. (2014). [DOI] [PMC free article] [PubMed] [Google Scholar]
- 212.Neesse A, Algül H, Tuveson DA & Gress TM Stromal biology and therapy in pancreatic cancer: a changing paradigm. Gut 64, 1476–1484. (2015). [DOI] [PubMed] [Google Scholar]
- 213.Loeffler M, Krüger JA, Niethammer AG & Reisfeld RA Targeting tumor-associated fibroblasts improves cancer chemotherapy by increasing intratumoral drug uptake. The Journal of Clinical Investigation 116, 1955–1962. (2006). [DOI] [PMC free article] [PubMed] [Google Scholar]
- 214.Basu SS et al. Rapid MALDI mass spectrometry imaging for surgical pathology. NPJ Precision Oncology 3, 1–5 (2019). [DOI] [PMC free article] [PubMed] [Google Scholar]