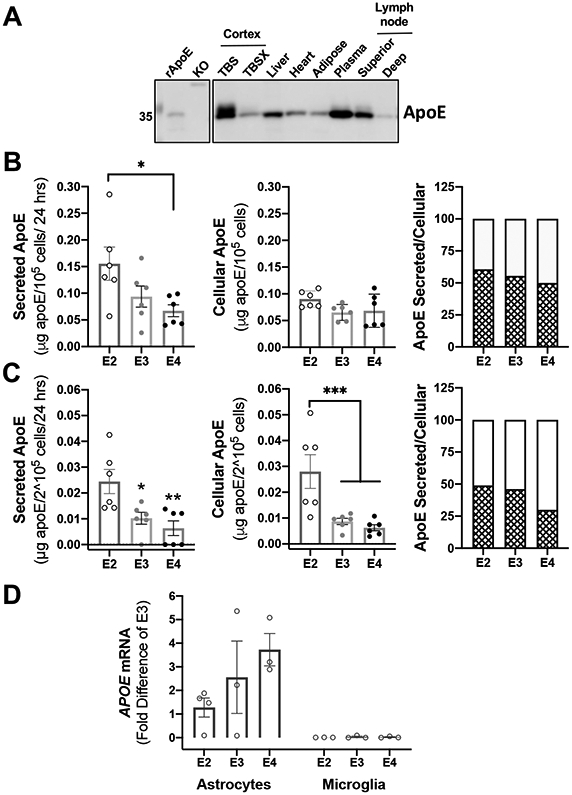
Figure 1. Secreted and cellular apoE ratio and abundance are different between glia cell-types.

(A) Tissue from human APOE2 targeted-replacement mice was isolated and processed according to material and methods. 2.5-10 μg of protein lysates was analyzed by western blotting with antibodies against apoE. TBS:=soluble fraction; TBSX:=insoluble fraction; KO:=total homogenate of cortex from apoE knockout (KO) mice. TBS and TBSX fractions were isolated as described in DiBattista et al. (2016). Representative image of one of two experiments. (B-C) Astrocytes (B) and microglia (C) derived from human APOE2, APOE3 and APOE4 targeted-replacement mice were isolated and seeded in serum-free media. Conditioned media and cells were harvested after 24 hrs. of incubation. 50 μL of conditioned media and 25 μL of cell lysates were analyzed by ELISA (n=6 independent cell cultures). *p<0.05, **p<0.005, ***p<0.0005. A one-way ANOVA was used to assess outcome measures from genotype in fractions from secreted and cellular apoE in cell cultures (astrocytes and microglia). ApoE ratio was calculated as the mean percentage of secreted apoE (pattern bars) and cellular apoE (blank bars) to total apoE (see Material and Methods). (D) Basal levels of APOE mRNA expression are expressed as fold difference from APOE3 astrocytes (n=3-4 independent cell cultures).
