Abstract
Background
Advances in computer processing and improvements in data availability have led to the development of machine learning (ML) techniques for mammographic imaging.
Purpose
To evaluate the reported performance of stand-alone ML applications for screening mammography workflow.
Materials and Methods
Ovid Embase, Ovid Medline, Cochrane Central Register of Controlled Trials, Scopus, and Web of Science literature databases were searched for relevant studies published from January 2012 to September 2020. The study was registered with the PROSPERO International Prospective Register of Systematic Reviews (protocol no. CRD42019156016). Stand-alone technology was defined as a ML algorithm that can be used independently of a human reader. Studies were quality assessed using the Quality Assessment of Diagnostic Accuracy Studies 2 and the Prediction Model Risk of Bias Assessment Tool, and reporting was evaluated using the Checklist for Artificial Intelligence in Medical Imaging. A primary meta-analysis included the top-performing algorithm and corresponding reader performance from which pooled summary estimates for the area under the receiver operating characteristic curve (AUC) were calculated using a bivariate model.
Results
Fourteen articles were included, which detailed 15 studies for stand-alone detection (n = 8) and triage (n = 7). Triage studies reported that 17%–91% of normal mammograms identified could be read by adapted screening, while “missing” an estimated 0%–7% of cancers. In total, an estimated 185 252 cases from three countries with more than 39 readers were included in the primary meta-analysis. The pooled sensitivity, specificity, and AUC was 75.4% (95% CI: 65.6, 83.2; P = .11), 90.6% (95% CI: 82.9, 95.0; P = .40), and 0.89 (95% CI: 0.84, 0.98), respectively, for algorithms, and 73.0% (95% CI: 60.7, 82.6), 88.6% (95% CI: 72.4, 95.8), and 0.85 (95% CI: 0.78, 0.97), respectively, for readers.
Conclusion
Machine learning (ML) algorithms that demonstrate a stand-alone application in mammographic screening workflows achieve or even exceed human reader detection performance and improve efficiency. However, this evidence is from a small number of retrospective studies. Therefore, further rigorous independent external prospective testing of ML algorithms to assess performance at preassigned thresholds is required to support these claims.
©RSNA, 2021
Online supplemental material is available for this article.
See also the editorial by Whitman and Moseley in this issue.
Summary
Retrospective studies demonstrate the performance of stand-alone machine learning applications in screening mammography can reach reader performance and can provide a mechanism for case triage, which merits investigation with prospective studies.
Key Results
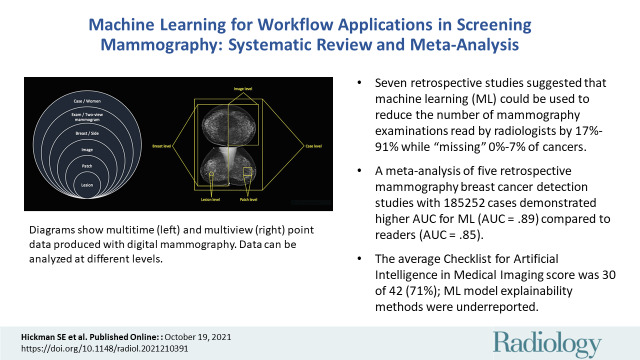
■ Seven retrospective studies suggested that machine learning (ML) could be used to reduce the number of mammography examinations read by radiologists by 17%–91% while “missing” 0%–7% of cancers.
■ A meta-analysis of five retrospective mammography breast cancer detection studies with 185 252 cases demonstrated a higher area under the receiver operating characteristic curve (AUC) for ML (AUC = .89) compared to readers (AUC = .85).
■ The mean Checklist for Artificial Intelligence in Medical Imaging score was 30 of 42 (71%); ML model explainability methods were underreported.
Introduction
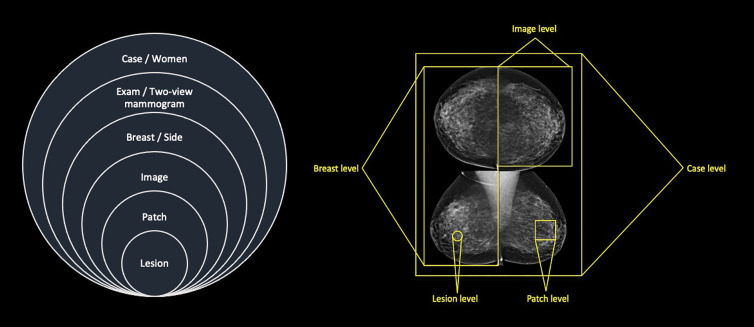
There are now more than five U.S. Food and Drug Administration–approved algorithms for mammographic interpretation, primarily to be used as clinical decision support systems (1). Research has demonstrated that these machine learning (ML) computer-aided detection (CAD) algorithms can reach and even exceed clinician performance, providing an independent definitive output (ie, case-level decision) on two-dimensional standard-view mammogram (ie, mediolateral oblique and craniocaudal) data (Fig 1) (2,3). This could allow for ML stand-alone CAD and computer-aided diagnosis (CADx), or, when ML algorithms are set at a high sensitivity, for the automated case-based computer-aided triage (CADt) of mammograms within the screen reading workflow (4).
Figure 1:
Diagrams show multitime (left) and multiview (right) point data produced with two-dimensional standard view mammography. Data can be analyzed at different levels.
Many countries have implemented breast screening to detect cancer at an earlier stage, albeit with differing screening processes, such as single reading in the United States and double reading in many European countries, with screening starting at varied ages (40–50 years) and differing intervals between screening (annual, biennial, and triennial) (5–8). Mammography remains the most common imaging modality used, although its cost-effectiveness is debated because of false-positive findings, overdiagnosis, and false-negative findings (ie, interval cancers) (9,10). Human readers—for example, radiologists and reporting radiographers in the United Kingdom—are under increasing pressure because of increasing workloads, demands from busy clinics, strict screening program targets, and staff shortages (11). Alternatives to double reading of mammograms are being sought to further alleviate pressure, including single reading using CAD prompts, stand-alone ML algorithms with a second reader, or CADt with various reader combinations (2).
Studies investigating the use of traditional CAD mammography systems demonstrated no significant improvement in reader performance, and although sensitivity was similar to that of double reading, given the increase in recall rates, these systems were deemed not cost-effective (12,13). Additional limitations of traditional CAD systems include high rates of false-positive prompts, limited reproducibility of prompts, increased reading time, and a CAD preference for calcification detection over soft-tissue masses and architectural distortion (14,15). Traditional CAD systems were trained using handcrafted features extracted from human delineations. The latest ML methods can use pretrained deep learning networks and automatically delineated cancer regions by means of iterative interactive software to rely upon learned features, and they have the potential to overcome the limitations of traditional CAD systems. However, how these new ML systems should be used in real-time workflows is still unclear. One route could be to improve efficiency of the workflow by operating as stand-alone systems. Although the performance expected by such stand-alone ML applications in a screening workflow is yet to be agreed upon, a system should meet a “clinically relevant threshold” (16). In general, recall rates should not be increased because of the huge impact on workload, thus algorithms with a lower specificity would require human intervention to reduce recalls (16,17). Therefore, making a definitive decision on whether current systems reach the standard required for routine workflow use is challenging.
We conducted a systematic review and meta-analysis to investigate whether or not ML algorithms (ie, CAD and CADx) are as sensitive and specific as radiologists in detecting breast cancer in patients undergoing screening mammography. In addition, we evaluated the application of stand-alone ML algorithms (ie, CADt) used in breast cancer screening for mammography interpretation and the impact of ML algorithms if adopted into clinical practice. Furthermore, we aimed to identify areas of bias and gaps in the reported evidence. Appendix E1 (online) contains a glossary of terms.
Materials and Methods
This systematic review and meta-analysis was reported in accordance with the Preferred Reporting Items for a Systematic Review and Meta-Analysis of Diagnostic Test Accuracy Studies guidance (18). The review protocol was registered with the PROSPERO International Prospective Register of Systematic Reviews (protocol no. CRD42019156016) (Appendix E2 [online]). Data generated or analyzed during the study are available from the corresponding author by request.
Literature Search
Digital literature databases, including Ovid Embase, Ovid Medline, Scopus, Web of Science, and the Cochrane Central Register of Controlled Trials, were searched from January 2012 to September 2020, with the final search conducted on September 3, 2020, to include the advancements in ML algorithms for medical image interpretation and increased mammographic data availability (2,19). Hand searches of included article references, a gray literature search of computer science databases (ie, DBLP computer science bibliography, Association for Computing Machinery Digital Library, and Institute of Electrical and Electronics Engineers Xplore Digital Library), and a search of arXiv, a preprint literature database, were also conducted for the same time period. The search strategy is detailed in Appendix E3 (online).
Study Selection
To limit bias, all publication types and all study designs were included, with no language restriction or data set age limit applied. Eligibility criteria included women imaged with mammography for screening or diagnosis of breast cancer and a ML algorithm applied as stand-alone workflow application (ie, CAD and CADx or CADt) with sufficient information reported for the performance of stand-alone ML algorithms and reader performance, or the simulated impact on reader performance and workflow to allow for comparison. Any ground truth (eg, histopathologic findings) was accepted. Because data are available at multiple levels (Fig 1), we included algorithms only if they provided an interpretation at the case or examination level to enable comparison with clinician performance as reported in screening programs.
Two independent reviewers undertook the initial title and abstract screening (S.E.H., a physician with 2 years of experience, and then E.P.V.L., C.M.L., or Y.R.I., all medical students) with discordance arbitration by a third reviewer (E.P.V.L., C.M.L., or Y.R.I.), with independent full text review (S.E.H. and R.W., a radiologist with 11 years’ experience) and discordance arbitration by a third reviewer (F.J.G., a senior radiologist with more than 30 years of experience).
Data Extraction
A predesigned data extraction spreadsheet was used by the reviewers (S.E.H. and R.W.) and checked by a third reviewer (A.I.A.R., a computer scientist with 4 years of experience). Results were only extracted for studies where algorithm performance was compared with readers or the impact on reader workflow and performance was reported. If studies reported multiple stand-alone algorithms, results for all algorithms were extracted (Appendix E4 [online]).
Meta-Analysis Protocol
For the meta-analysis, CAD and CADx algorithm performance was evaluated by adapting the method described in Liu et al (19). The primary meta-analysis compared the best-performing algorithm of each study, at the test stage using screening mammography data, with the performance of readers. Details of the primary meta-analysis study selection are available in Appendix E5 (online). The secondary meta-analysis extended the primary meta-analysis and compared the performance of all reported algorithms and readers in all stand-alone CAD and CADx studies, which used external data sets for addressing the generalization capabilities of the techniques, with no limitations of ground truth.
Quality Assessment
Risk of bias and quality assessment of all included studies took place using Quality Assessment of Diagnostic Accuracy Studies 2 (20,21) and Prediction Model Risk of Bias Assessment Tool (22) by two reviewers (S.E.H. and R.W.), with discussion between reviewers to resolve discordance. Signaling questions for Quality Assessment of Diagnostic Accuracy Studies 2 were adapted for ML studies. Prediction Model Risk of Bias Assessment Tool questions were adapted using the technique in Nagendran et al (23). However, as our review focused on mammography ML, applicability was assessed in all fields except the predictor field.
The Checklist for Artificial Intelligence in Medical Imaging (24) was used by two reviewers (S.E.H. and A.I.A.R.), with discussion between reviewers to resolve discordance. An overall reporting score for all parameters was generated as well as for eight key fields identified, and common areas underreported were documented.
Statistical Analysis
All statistical analyses were implemented in R software (version 4.0.3, R Project for Statistical Computing) (25) using the “mada” (26) and “boot” (27) packages. Normal and benign examinations were combined, and 2 × 2 contingency tables were created by calculating true-positive, true-negative, false-positive, and false-negative findings from the reported data set characteristics and sensitivity and specificity provided, ensuring there was an integer, or whole, number of cases. The heterogeneity of the included studies in the quantitative analysis was measured using the I2 and Cochrane Q tests, where high heterogeneity was defined by I2 greater than 50% and P < .05 for Cochrane Q test. The estimated pooled sensitivity, specificity, and the area under the receiver operating characteristic curve (AUC) were calculated for both readers and ML algorithms using a bivariate random effects model by Reitsma et al (28) with 95% CIs. Bootstrapping with 100 iterations was used to generate 95% CIs for the AUC, and a t test was used to compare the ML algorithm and reader sensitivity and specificity, with P < .05 indicating a statistically significant difference. Summary receiver operating characteristic plots were constructed for both primary and secondary analyses for pooled reader and ML algorithm performance.
Results
Study Selection and Data Extraction
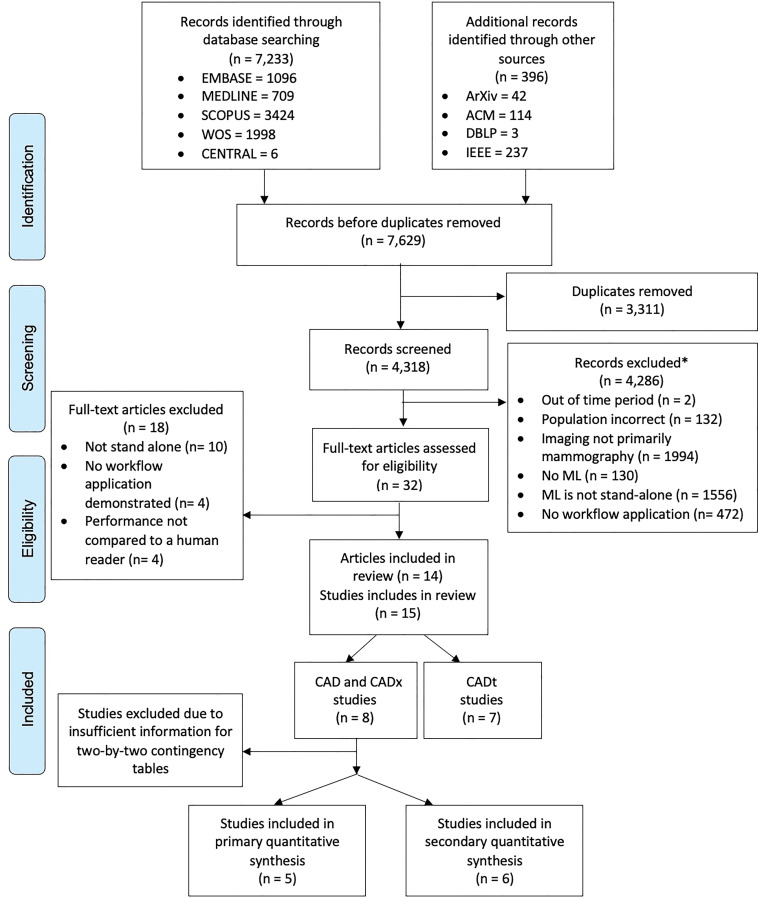
A Preferred Reporting Items for a Systematic Review and Meta-Analysis diagram (Fig 2) demonstrates the study inclusion process. The search of electronic literature databases and computer science databases returned 7629 records. Removal of duplicates resulted in 4318 records. After the screening of titles and abstracts, 4286 records were excluded, the remaining 32 full texts were reviewed, and 14 articles were included in the qualitative review. References of included studies can be found in Appendix E6 (online).
Figure 2:
Flowchart of Preferred Reporting Items for Systematic Review and Meta-Analysis for Diagnostic Test Accuracy for studies included in identification, de-duplication, screening, and data-extraction stages of review. ACM = Association for Computing Machinery, CAD = computer-aided detection, CADt = computer-aided triage, CADx = computer-aided diagnosis, IEEE = Institute of Electrical and Electronics Engineers, ML = machine learning, WOS = Web of Science. * = Studies could have been excluded for multiple reasons.
From the included 14 articles, eight studies reported a stand-alone CAD and CADx algorithm performance, and seven studies reported the use of a CADt system. One article reported on both stand-alone CAD and CADx and CADt. Five studies for stand-alone CAD and CADx provided enough information to be included in the primary meta-analysis and six studies for the secondary meta-analysis (algorithm [n = 17] and reader [n = 15]).
The included articles were published between 2017 and 2020, with three of 14 articles (21%) published on a preprint platform (ie, arXiv). A total of 16 algorithms, including 12 unique algorithms, were included in this review, with two algorithms reported multiple times using different versions.
All included studies were conducted retrospectively. Generalizability was demonstrated in four studies where algorithms were tested on data sets from a different country to the training data set. All data sets used for reader comparison testing were private. Eight of 14 articles (57%) evaluated algorithms on external data sets only, with a further two of 14 articles (14%) using both internal and external datasets. Cancer prevalence within testing data sets varied from 0.6% to 50.0%, and the total testing data set size ranged from 240 examinations to 113 663 cases (ie, cohort size was simulated using bootstrapping). The comparator of readers ranged in number (four to 101 readers), experience (1–44 years), and specialization (general or breast) for all studies. The algorithms code was available in nine of 14 articles (64%). Commonly used architectures included ResNet, RetinaNet, and MobileNet, which are all a type of convolutional neural network. This included algorithms that were commercially available in six of 14 articles (43%) or where code was available in a public repository in three of 14 articles (21%).
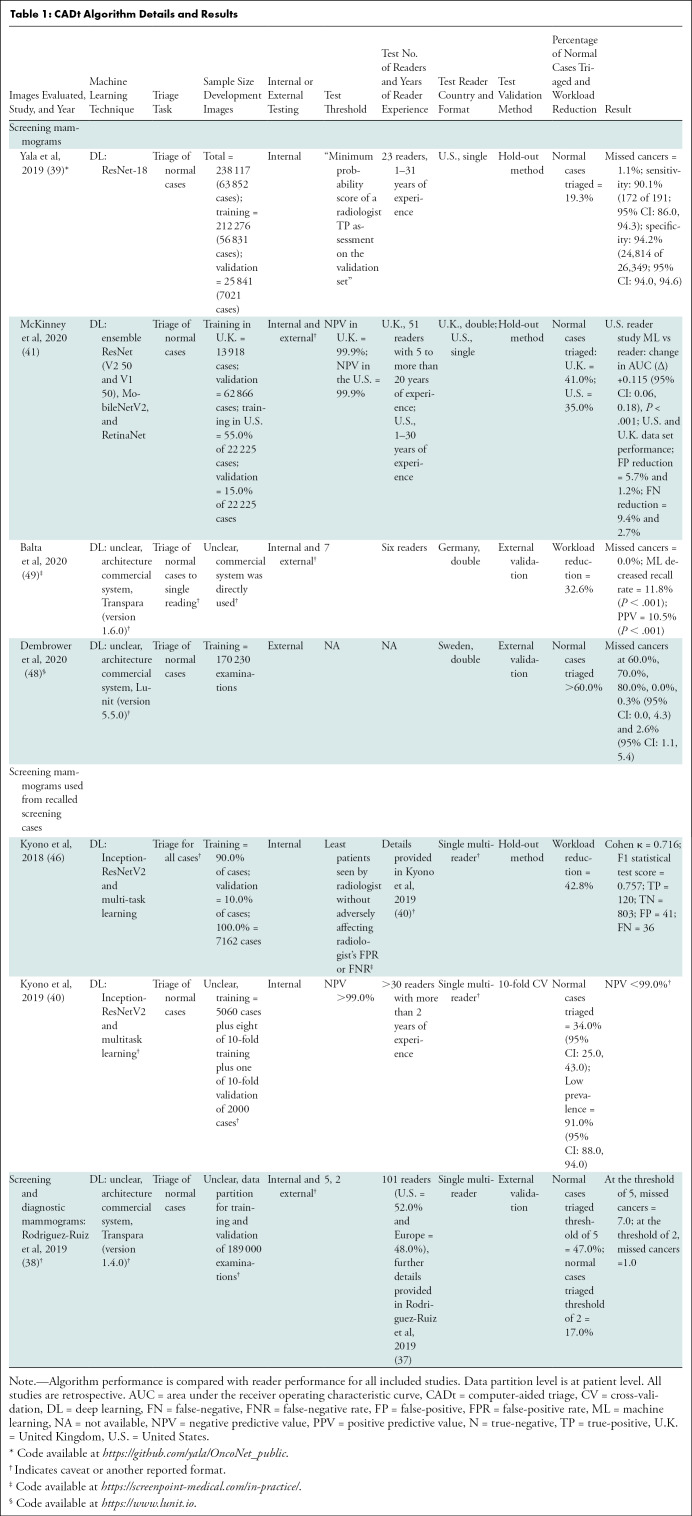
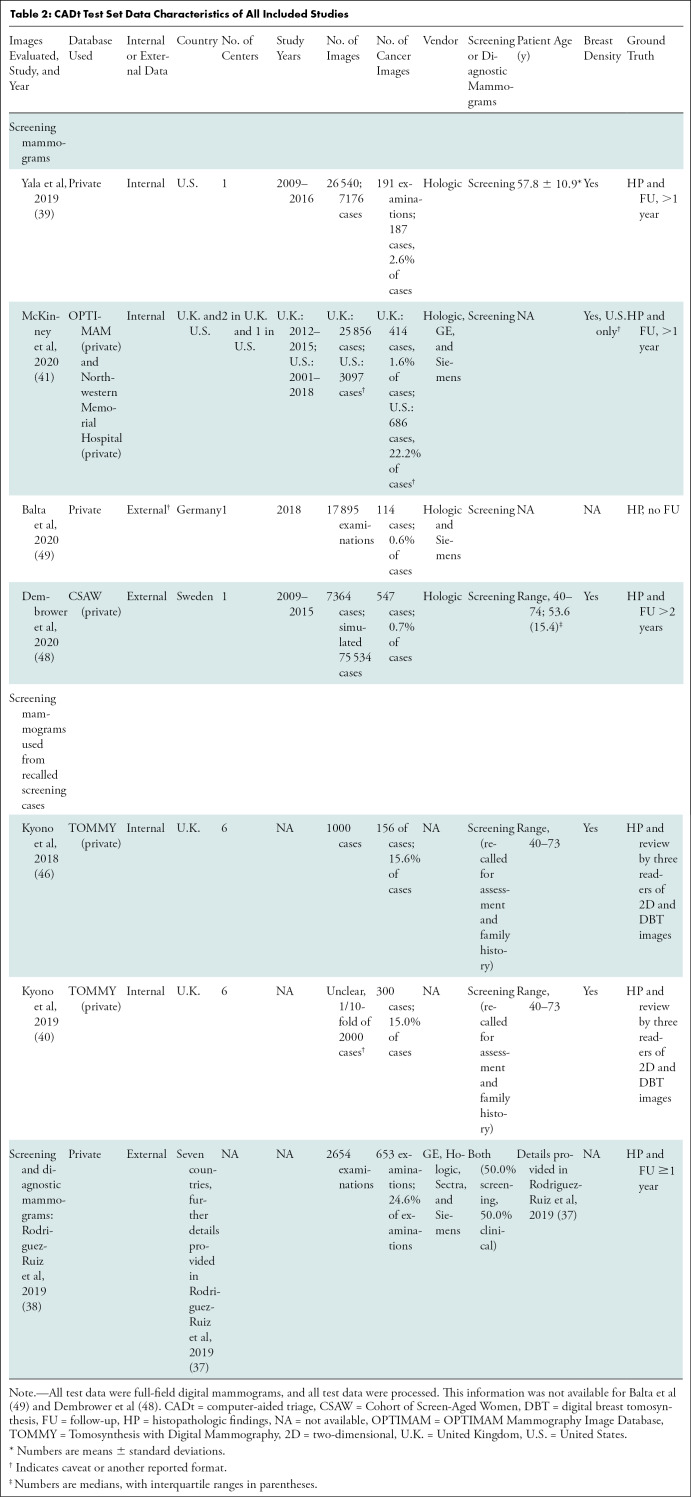
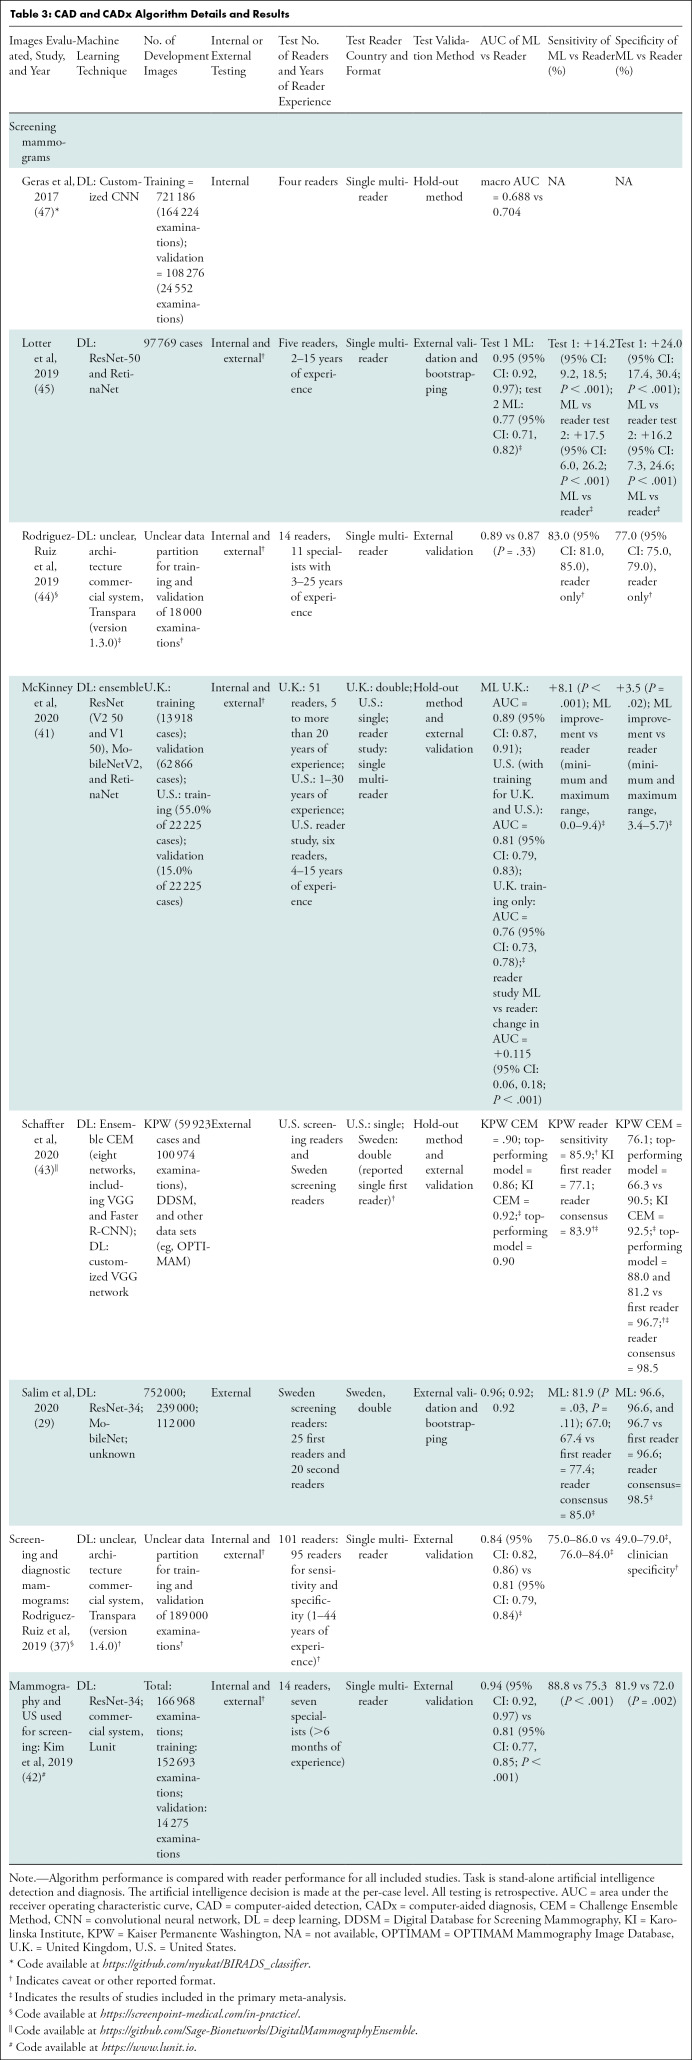
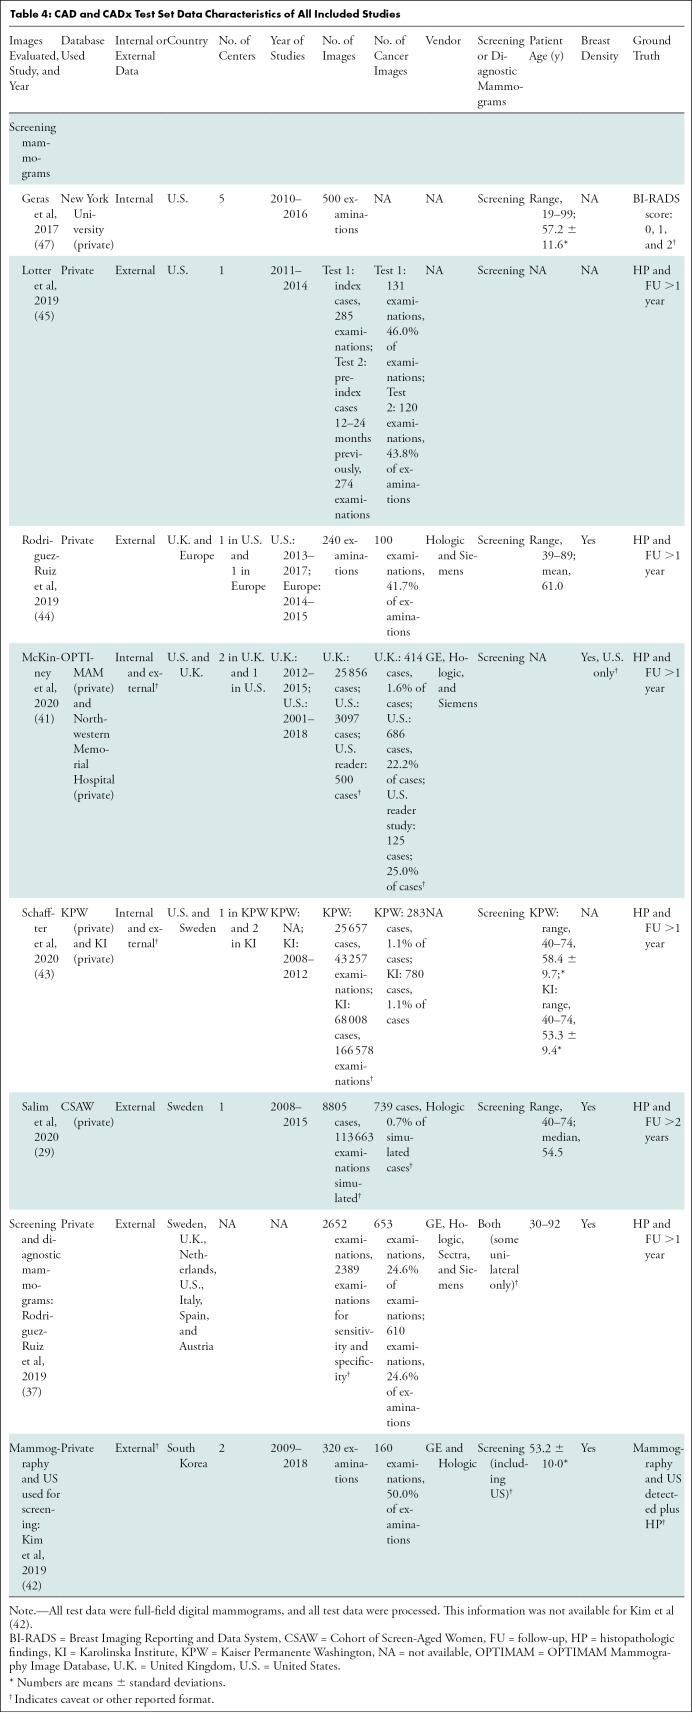
Independent CADt studies reported that between 17% and 91% of normal mammograms could be identified, while missing 0%–7% of cancers (Tables 1, 2). For CAD and CADx tasks, eight studies reported the algorithms’ AUCs between 0.69 and 0.96 (Tables 3, 4).
Table 1:
CADt Algorithm Details and Results
Table 2:
CADt Test Set Data Characteristics of All Included Studies
Table 3:
CAD and CADx Algorithm Details and Results
Table 4:
CAD and CADx Test Set Data Characteristics of All Included Studies
Quality Assessment
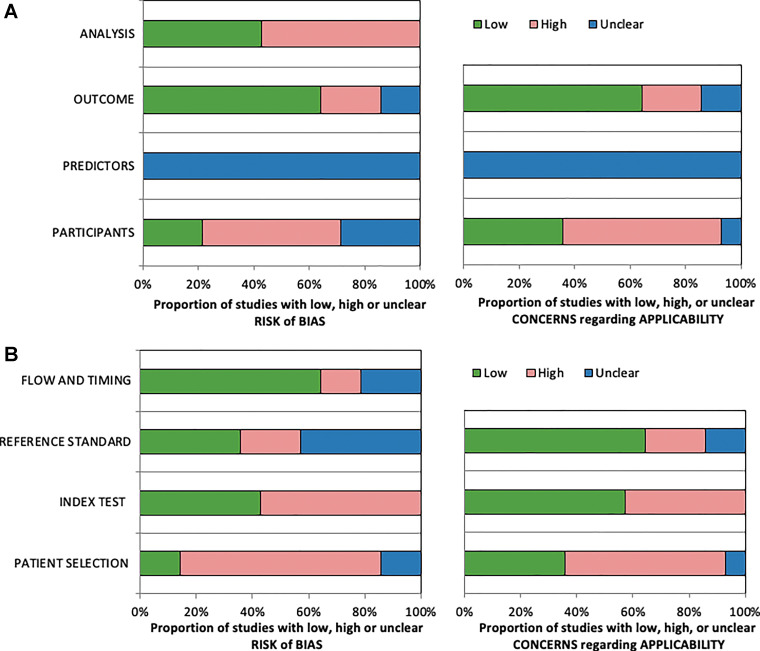
The Prediction Model Risk of Bias Assessment Tool and Quality Assessment of Diagnostic Accuracy Studies 2 tools were applied to all included articles in this review, and summary results of assessments are shown in Figure 3 and in Appendix E7 (online). Applying both tools identified a high risk of bias for analysis, as well as high bias and applicability concerns for the index test, participants, and patient selection (Fig 3). Reasons for high bias and applicability include eight of 14 articles (57%) with cancer-enriched cohorts, five of 14 articles (36%) that tested the algorithm on an internal data set, and three of 14 articles (21%) that did not preset the algorithm threshold in CADt studies. According to the Prediction Model Risk of Bias Assessment Tool assessment, articles were reported to have an overall low (7%), unclear (7%), and high (86%) risk of bias.
Figure 3:
Stacked bar charts show summary results of included articles assessed with (A) Prediction Model Risk of Bias Assessment Tool and (B) Quality Assessment of Diagnostic Accuracy Studies 2 assessment. For 14 included articles, each category is represented as percentage of number of articles that have high, low, or unclear levels of bias and applicability.
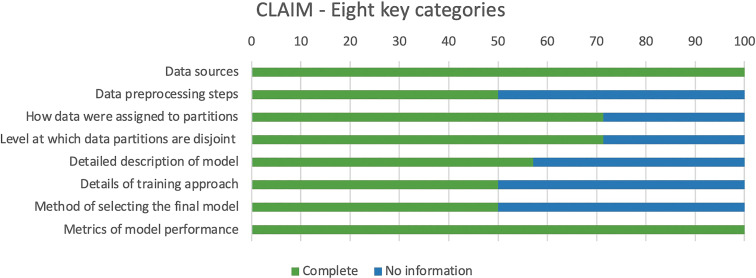
Critical appraisal of the reporting quality in the 14 included articles using the 42 parameters of the Checklist for Artificial Intelligence in Medical Imaging, found scores ranging from 22 to 34, with a mean total score of 30 of 42 (71%). The points most commonly underreported included robustness or sensitivity analysis, methods for explainability or interpretability, and protocol registration. Methods for explainability (eg, saliency maps) to provide transparency of the algorithm's deduction were reported in three articles. Only 50% of articles reported all eight key fields (Fig 4).
Figure 4:
Stacked bar chart of Checklist for Artificial Intelligence in Medical Imaging (CLAIM) assessment. Results for 14 articles included in this review across eight key categories identified from checklist are shown. Score of 1 was given if complete information was provided, and score of 0 was given where no information was provided. X-axis indicates percentage of articles in review that included information about eight key categories detailed in y-axis.
Statistical Analysis
Low heterogeneity was found for both algorithms and readers in the primary and secondary analyses (I2 = 0.0%–0.6%; Cochrane Q test P = .45–.78).
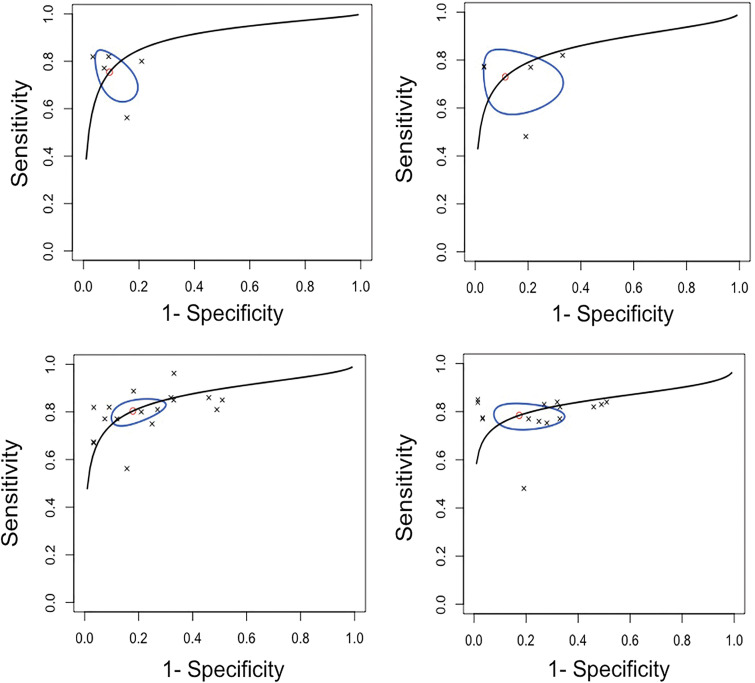
An estimated 185 252 cases from three countries with more than 39 readers were included in the primary meta-analysis. The pooled summary estimates for sensitivity, specificity, and AUC were 75.4% (95% CI: 65.6, 83.2), 90.6% (95% CI: 82.9, 95.0), and 0.89 (95% CI: 0.84, 0.98), respectively, for ML algorithms. For readers, the pooled sensitivity, specificity, and AUC were 73.0% (95% CI: 60.7, 82.6), 88.6% (95% CI: 72.4, 95.8), and 0.85 (95% CI: 0.78, 0.97), respectively (Fig 5). The differences in sensitivity and specificity were not statistically significant (P = .11 and .40, respectively). Algorithm performance thresholds were set at the reported reader sensitivity and specificity in four studies.
Figure 5:
(A, B) Summary receiver operating characteristic (sROC) curves in (A) five studies for included algorithm and (B) reader results reported for top-performing machine learning algorithm tested on external data set, compared with reader performance for computer-aided detection and computer-aided diagnosis applications, with a ground truth of more than 1 year follow-up and histopathologic findings (primary meta-analysis). (C, D) Summary receiver operating characteristic (sROC) curves for (C) 17 algorithm-reported results and (D) 15 reader-reported results from included studies for computer-aided detection and computer-aided diagnosis applications tested externally (secondary meta-analysis). Line represents summary receiver operating characteristic curve, oval represents 95% CIs, circle represents summary estimate, and crosses represent individual results.
When including all available results from CAD and CADx studies conducted using external data sets that provided a direct comparison between ML algorithms and readers for a secondary meta-analysis, the pooled sensitivity, specificity, and AUC were 80.4% (95% CI: 75.5, 84.6), 82.1% (95% CI: 72.7, 88.8), and 0.86 (95% CI: 0.84, 0.90), respectively, for algorithms. For readers, the pooled sensitivity, specificity, and AUC were 78.5% (95% CI: 73.8, 82.5), 82.6% (95% CI: 69.2, 90.9), and 0.84 (95% CI: 0.81, 0.88), respectively (Fig 5). The differences in sensitivity and specificity were not statistically significant (P = .70 and .73, respectively). Summary Tables E1–E5 (online) and additional information are available in Appendixes E8–E11 (online) with associated Figures E1–E4 (online).
Discussion
We found the performance of mammography screening algorithms is reaching equivalence to readers in stand-alone computer-aided detection and computer-aided diagnosis tasks. Comparing our results to two recently published reader performance studies demonstrated that although the pooled sensitivity of algorithms (75.4%) was higher than that of pooled readers (73.0%) and single reading in Sweden (73.0%) (8), it was inferior to both single reading in the United States (86.9%) (6) and double reading with consensus in Sweden (85.0%) (8). The pooled specificity of algorithms (90.6%) was superior to pooled readers (88.6%) and single reading in the United States (88.9%) (6) but was inferior to both single (96.0%) and double reading with consensus in Sweden (98.0%) (8). Therefore, further improvements are needed to make sure machine learning systems meet the “clinically relevant thresholds” of current reader performance and screening program targets. Our findings were similar to a systematic review and meta-analysis comparing deep learning applications across all medical imaging to health care professionals, who came to a similar conclusion and highlighted the importance of continued external testing (19).
Algorithms are also performing tasks not feasible by readers such as high-volume normal case triage, with no detrimental change when reader performance was extrapolated in an adapted screening workflow (ie, using machine-only reading of cases assigned to be normal as an alternative to single or double reading) (2). However, the acceptable “miss” rate for a system, similar to the interval cancer targets, should be agreed upon and specified for machine-only reading of normal mammograms before clinical adoption. The biggest barrier may be public understanding of the concept of acceptable “misses.”
No prospective studies have yet been reported, many studies are still conducted with retrospective internal testing, and few studies are conducted by an independent party where multiple algorithms are cross-compared using external data sets (29). In addition, most of the studies used enriched cancer cohorts for testing, which do not include the class imbalance of cancers to healthy controls in screening. Thus, these data sets may not provide a realistic representation from which to infer model performance in clinical implementation limiting generalizability, clinical applicability, and feasibility of workflow translation. Our findings highlight the need for well-designed prospective randomized and nonrandomized controlled trials to be conducted across different breast screening programs. These prospective studies should include representative case proportions to replicate the class imbalance in screening, with readers of varying experience interacting with ML algorithm outputs within the clinical workflow. This will allow for performance to be assessed as well as technologic feasibility, reading time, reader acceptability, and effect on reader performance (17). Prospective studies investigating ML applications for mammographic screening are currently underway in the United Kingdom, Norway, Sweden, China, and Russia, with results pending (30–32).
Most articles were from 2019 onward, reflecting the exponential growth in publications since major milestones such as the ImageNet (33) and the Digital Mammography Dialogue for Reverse Engineering Assessment and Methods (3,34) challenges. Although the computer codes were available in 64% of articles, only 21% of code was available on an open-source platform. However, the provision of code alone does not result in a deployable model, including training weights and the threshold at which the algorithm performance was determined, thus limiting reproducibility and transparency (35,36). Large data sets were used for testing, but the majority of these are private, which limits the ability to replicate results.
Two commonly used tools for bias assessment found a high risk of bias due to cancer-enriched cohorts and use of internal data sets as well as the algorithm threshold in triage studies not being preset. Therefore, these results may not be applicable and generalizable to all breast screening populations (21). We applied a specific artificial intelligence medical imaging reporting guideline, the Checklist for Artificial Intelligence in Medical Imaging, to critically appraise artificial intelligence medical imaging literature. It should be noted that the Checklist for Artificial Intelligence in Medical Imaging was published after more than half of the articles in this review were published. Therefore, we have not presented the results of each individual study but have used this as a foundation to find underreported areas within the current literature, as well as to confirm the applicability of the Checklist for Artificial Intelligence in Medical Imaging for ML mammography studies (24).
The meta-analysis was limited by both the small number of eligible studies and because the contingency tables were constructed using reported sensitivity, specificity, total cases, and malignant cases to provide estimated integers, or whole numbers, for calculating true-positive, true-negative, false-positive, and false-negative findings. The primary meta-analysis included studies where reader performance did not reach the level reported in national screening standards; therefore, it is possible that the relative improved performance of ML algorithms is overestimated, and the performance of readers is underestimated as part of this analysis. The primary analysis also used only the highest-performing (ie, based on test performance) algorithm if multiple algorithms were tested and therefore may be slightly biased toward the selected algorithms. The secondary meta-analysis incorporated multiple algorithms and readers from the same study, in the same population, which could potentially lead to overrepresentation. Therefore, the results from the meta-analysis should be interpreted with caution. Last, for the secondary meta-analysis, both screening and diagnostic mammograms were included in studies, including one study in which women were screened with mammography and US, both of which would have an impact on the expected performance metrics.
There is a growing evidence base that stand-alone machine learning (ML) performance is comparable to reader performance and that ML can undertake triage tasks at a volume and speed not feasible for human readers. Although only retrospective trials have been conducted, the potential for algorithms to perform at the level of or even exceed the performance of a reader within the real-time breast screening workflow is realistic. However, further robust prospective data are critical to understanding where algorithm thresholds are set and are required to examine the interaction between human readers and algorithms, as well as the effect on reader performance and patient outcomes over time.
Acknowledgments
Acknowledgment
We would like to thank the library team at the University of Cambridge Clinical School for their guidance in developing the search strategy.
Supported by the National Institute for Health Research Cambridge Biomedical Research Centre and Cancer Research UK grant (grant no. C543/A26884). Cancer Research UK funds the PhD studentship for S.E.H. through an Early Detection program grant (grant no. C543/A26884). G.C.B. is funded by a studentship from GE Healthcare. R.W. is funded by the Mark Foundation for Cancer Research and Cancer Research UK Cambridge Centre (grant no. C9685/A25177).
Disclosures of conflicts of interest: S.E.H. research collaborations with Merantix, ScreenPoint, Volpara, and Lunit. R.W. employee of University of Cambridge. E.P.V.L. no relevant relationships. Y.R.I. no relevant relationships. C.M.L. no relevant relationships. A.I.A.R. no relevant relationships. G.C.B. no relevant relationships. J.W.M. employee of Astra Zeneca. F.J.G. funding from Lunit; consultant for Alphabet and Kheiron; payment or honoraria for lectures, presentations, speakers bureaus, manuscript writing, or educational events from GE Healthcare; president of European Society of Breast Imaging; equipment, materials, drugs, medical writing, gifts, or other services from GE Healthcare, Bayer, Lunit, and ScreenPoint.
Abbreviations:
- AUC
- area under the receiver operating characteristic curve
- CAD
- computer-aided detection
- CADt
- computer-aided triage
- CADx
- computer-aided diagnosis
- ML
- machine learning
References
- 1. American College of Radiology Data Science Institute. AI Central. https://web.archive.org/web/20211018160712/https:/aicentral.acrdsi.org/. Accessed September 10, 2020.
- 2. Sechopoulos I, Mann RM. Stand-alone artificial intelligence - The future of breast cancer screening? Breast 2020;49:254–260. [DOI] [PMC free article] [PubMed] [Google Scholar]
- 3. Le EPV, Wang Y, Huang Y, Hickman S, Gilbert FJ. Artificial intelligence in breast imaging. Clin Radiol 2019;74(5):357–366. [DOI] [PubMed] [Google Scholar]
- 4. Watanabe L. The power of triage (CADt) in breast imaging. Applied Radiology. https://web.archive.org/web/20211018160942/https:/www.appliedradiology.com/communities/Breast-Imaging/the-power-of-triage-cadt-in-breast-imaging. Accessed November 24, 2020.
- 5. Schünemann HJ, Lerda D, Quinn C, et al. Breast cancer screening and diagnosis: A synopsis of the European breast guidelines. Ann Intern Med 2020;172(1):46–56. [DOI] [PubMed] [Google Scholar]
- 6. Lehman CD, Arao RF, Sprague BL, et al. National performance benchmarks for modern screening digital mammography: Update from the Breast Cancer Surveillance Consortium. Radiology 2017;283(1):49–58. [DOI] [PMC free article] [PubMed] [Google Scholar]
- 7. DeAngelis CD, Fontanarosa PB. US Preventive Services Task Force and breast cancer screening. JAMA 2010;303(2):172–173. [DOI] [PubMed] [Google Scholar]
- 8. Salim M, Dembrower K, Eklund M, Lindholm P, Strand F. Range of radiologist performance in a population-based screening cohort of 1 million digital mammography examinations. Radiology 2020;297(1):33–39. [DOI] [PubMed] [Google Scholar]
- 9. Marmot MG, Altman DG, Cameron DA, Dewar JA, Thompson SG, Wilcox M. The benefits and harms of breast cancer screening: an independent review. Br J Cancer 2013;108(11):2205–2240. [DOI] [PMC free article] [PubMed] [Google Scholar]
- 10. Pharoah PDP, Sewell B, Fitzsimmons D, Bennett HS, Pashayan N. Cost effectiveness of the NHS breast screening programme: life table model. BMJ 2013;346:f261 [Published correction appears in BMJ 2013;346:f3822.]. [DOI] [PMC free article] [PubMed] [Google Scholar]
- 11. The Royal College of Radiologists. Clinical Radiology UK Workforce Census 2019 Report. https://web.archive.org/web/20211018161155/https:/www.rcr.ac.uk/publication/clinical-radiology-uk-workforce-census-2019-report. Published 2020. Accessed June 1, 2021.
- 12. Gilbert FJ, Astley SM, Gillan MGC, et al. Single reading with computer-aided detection for screening mammography. N Engl J Med 2008;359(16):1675–1684. [DOI] [PubMed] [Google Scholar]
- 13. Lehman CD, Wellman RD, Buist DSM, et al. Diagnostic accuracy of digital screening mammography with and without computer-aided detection. JAMA Intern Med 2015;175(11):1828–1837. [DOI] [PMC free article] [PubMed] [Google Scholar]
- 14. Kohli A, Jha S. Why CAD failed in mammography. J Am Coll Radiol 2018;15(3 Pt B):535–537. [DOI] [PubMed] [Google Scholar]
- 15. Philpotts LE. Can computer-aided detection be detrimental to mammographic interpretation? Radiology 2009;253(1):17–22. [DOI] [PubMed] [Google Scholar]
- 16. UK National Screening Committee. Interim guidance on incorporating artificial intelligence into the NHS Breast Screening Programme. https://web.archive.org/web/20211018161746/https:/www.gov.uk/government/publications/artificial-intelligence-in-the-nhs-breast-screening-programme/interim-guidance-on-incorporating-artificial-intelligence-into-the-nhs-breast-screening-programme. Published 2019. Accessed June 1, 2020.
- 17. Hickman SE, Baxter GC, Gilbert FJ. Adoption of artificial intelligence in breast imaging: evaluation, ethical constraints and limitations. Br J Cancer 2021;125(1):15–22. [DOI] [PMC free article] [PubMed] [Google Scholar]
- 18. McInnes MDF, Moher D, Thombs BD, et al. Preferred Reporting Items for a Systematic Review and Meta-analysis of Diagnostic Test Accuracy Studies: The PRISMA-DTA Statement. JAMA 2018;319(4):388–396. [DOI] [PubMed] [Google Scholar]
- 19. Liu X, Faes L, Kale AU, et al. A comparison of deep learning performance against health-care professionals in detecting diseases from medical imaging: a systematic review and meta-analysis. Lancet Digit Health 2019;1(6):e271–e297. [DOI] [PubMed] [Google Scholar]
- 20. Whiting PF, Rutjes AW, Westwood ME, et al. QUADAS-2: a revised tool for the quality assessment of diagnostic accuracy studies. Ann Intern Med 2011;155(8):529–536. [DOI] [PubMed] [Google Scholar]
- 21. UK National Screening Committee. Use of artificial intelligence for image analysis in breast cancer screening. Rapid review and evidence map. https://web.archive.org/web/20210922212910/https:/assets.publishing.service.gov.uk/government/uploads/system/uploads/attachment_data/file/987021/AI_in_BSP_Rapid_review_consultation_2021.pdf. Published 2021. Accessed May 19, 2021.
- 22. Wolff RF, Moons KGM, Riley RD, et al. PROBAST: A tool to assess the risk of bias and applicability of prediction model studies. Ann Intern Med 2019;170(1):51–58. [DOI] [PubMed] [Google Scholar]
- 23. Nagendran M, Chen Y, Lovejoy CA, et al. Artificial intelligence versus clinicians: systematic review of design, reporting standards, and claims of deep learning studies. BMJ 2020;368:m689. [DOI] [PMC free article] [PubMed] [Google Scholar]
- 24. Mongan J, Moy L, Kahn CE Jr. Checklist for artificial intelligence in medical imaging (CLAIM): a guide for authors and reviewers. Radiol Artif Intell 2020;2(2):e200029. [DOI] [PMC free article] [PubMed] [Google Scholar]
- 25. R Core Team. R: a language and environment for statistical computing. R Foundation for Statistical Computing, Vienna, Austria. https://web.archive.org/web/20211018074349/https:/www.r-project.org/. Published 2020. Accessed June 1, 2021. [Google Scholar]
- 26. Doebler P. mada: meta-analysis of diagnostic accuracy. R package version 0.5.10. https://web.archive.org/web/20211018162134/https:/cran.r-project.org/web/packages/mada/index.html. Published 2020. Accessed June 1, 2021. [DOI] [PubMed]
- 27. Angelo Canty and Brian Ripley. boot: Bootstrap R (S-Plus) Functions. R package version 1.3-25. https://web.archive.org/web/20211018162439/https:/cran.r-project.org/web/packages/boot/. Published 2020. Accessed June 1, 2021.
- 28. Reitsma JB, Glas AS, Rutjes AWS, Scholten RJPM, Bossuyt PM, Zwinderman AH. Bivariate analysis of sensitivity and specificity produces informative summary measures in diagnostic reviews. J Clin Epidemiol 2005;58(10):982–990. [DOI] [PubMed] [Google Scholar]
- 29. Salim M, Wåhlin E, Dembrower K, et al. External evaluation of 3 commercial artificial intelligence algorithms for independent assessment of screening mammograms. JAMA Oncol 2020;6(10):1581–1588. [DOI] [PMC free article] [PubMed] [Google Scholar]
- 30. NHSX. Mia mammography intelligent assessment. https://web.archive.org/web/20211009085024/https://www.nhsx.nhs.uk/ai-lab/explore-all-resources/understand-ai/mia-mammography-intelligent-assessment/. Accessed October 28, 2020.
- 31. ClinicalTrials.gov . Development of Artificial Intelligence System for Detection and Diagnosis of Breast Lesion Using Mammography . https://web.archive.org/web/20211018162549/https://clinicaltrials.gov/ct2/show/NCT03708978. Accessed October 28, 2020 .
- 32. ClinicalTrials.gov . Experiment on the Use of Innovative Computer Vision Technologies for Analysis of Medical Images in the Moscow Healthcare System . https://web.archive.org/web/20211018162934/https:/clinicaltrials.gov/ct2/show/NCT04489992. Accessed October 28, 2020 .
- 33.Krizhevsky A, Sutskever I, Hinton GE. ImageNet Classification with Deep Convolutional Neural Networks. NeurIPS Proc. https://web.archive.org/web/20211009080513/https:/papers.nips.cc/paper/2012/file/c399862d3b9d6b76c8436e924a68c45b-Paper.pdf. Published 2012. Accessed June 18, 2020. [Google Scholar]
- 34. IBM Research Staff. DREAM Challenge results: Can machine learning help improve accuracy in breast cancer screening? https://web.archive.org/web/20210922202919/https:/www.ibm.com/blogs/research/2017/06/dream-challenge-results/. Accessed May 22, 2020.
- 35. Heaven WD. AI is wrestling with a replication crisis. MIT Technol Rev. https://web.archive.org/web/20211018163631/https:/www.technologyreview.com/2020/11/12/1011944/artificial-intelligence-replication-crisis-science-big-tech-google-deepmind-facebook-openai/. Accessed November 24, 2020.
- 36. Haibe-Kains B, Adam GA, Hosny A, et al. Transparency and reproducibility in artificial intelligence. Nature 2020;586(7829):E14–E16. [DOI] [PMC free article] [PubMed] [Google Scholar]
- 37. Rodriguez-Ruiz A, Lång K, Gubern-Merida A, et al. Stand-alone artificial intelligence for breast cancer detection in mammography: comparison with 101 radiologists. J Natl Cancer Inst 2019;111(9):916–922. [DOI] [PMC free article] [PubMed] [Google Scholar]
- 38. Rodriguez-Ruiz A, Lång K, Gubern-Merida A, et al. Can we reduce the workload of mammographic screening by automatic identification of normal exams with artificial intelligence? A feasibility study. Eur Radiol 2019;29(9):4825–4832. [DOI] [PMC free article] [PubMed] [Google Scholar]
- 39. Yala A, Schuster T, Miles R, Barzilay R, Lehman C. A Deep learning model to triage screening mammograms: a simulation study. Radiology 2019;293(1):38–46. [DOI] [PubMed] [Google Scholar]
- 40. Kyono T, Gilbert FJ, van der Schaar M. Improving workflow efficiency for mammography using machine learning. J Am Coll Radiol 2020;17(1 Pt A):56–63. [DOI] [PubMed] [Google Scholar]
- 41. McKinney SM, Sieniek M, Godbole V, et al. International evaluation of an AI system for breast cancer screening. Nature 2020;577(7788):89–94. [DOI] [PubMed] [Google Scholar]
- 42. Kim HE, Kim HH, Han BK, et al. Changes in cancer detection and false-positive recall in mammography using artificial intelligence: a retrospective, multireader study. Lancet Digit Health 2020;2(3):e138–e148. [DOI] [PubMed] [Google Scholar]
- 43. Schaffter T, Buist DSM, Lee CI, et al. Evaluation of combined artificial intelligence and radiologist assessment to interpret screening mammograms. JAMA Netw Open 2020;3(3):e200265. [DOI] [PMC free article] [PubMed] [Google Scholar]
- 44. Rodríguez-Ruiz A, Krupinski E, Mordang JJ, et al. Detection of breast cancer with mammography: effect of an artificial intelligence support system. Radiology 2019;290(2):305–314. [DOI] [PubMed] [Google Scholar]
- 45. Lotter W, Diab AR, Haslam B, et al. Robust breast cancer detection in mammography and digital breast tomosynthesis using annotation-efficient deep learning approach. Arxiv [Preprint]. 2019;1–16. http://arxiv.org/abs/1912.11027. [DOI] [PMC free article] [PubMed] [Google Scholar]
- 46. Kyono T, Gilbert FJ, van der Schaar M. MAMMO: a deep learning solution for facilitating radiologist-machine collaboration in breast cancer diagnosis. Arxiv [Preprint]. 2018;1–18. http://arxiv.org/abs/1811.02661. [Google Scholar]
- 47. Geras KJ, Wolfson S, Shen Y, et al. High-resolution breast cancer screening with multi-view deep convolutional neural networks. Arxiv [Preprint]. 2017;1–9. http://arxiv.org/abs/1703.07047. [Google Scholar]
- 48. Dembrower K, Wåhlin E, Liu Y, et al. Effect of artificial intelligence-based triaging of breast cancer screening mammograms on cancer detection and radiologist workload: a retrospective simulation study. Lancet Digit Health 2020;2(9):e468–e474. [DOI] [PubMed] [Google Scholar]
- 49. Balta C, Rodriguez-Ruiz A, Mieskes C, Karssemeijer N, Heywang-Köbrunner SH. Going from double to single reading for screening exams labeled as likely normal by AI: what is the impact? In: Proc SPIE 11513, 15th International Workshop on Breast Imaging (IWBI2020), Conference Location, May 22, 2020. Piscataway, NJ: IEEE, 2020; 115130D. [Google Scholar]


