Abstract
Background:
Metabolic imaging using proton magnetic resonance spectroscopic imaging (MRSI) has increased the sensitivity and spectral resolution at field strengths of ≥7T. Compared to the conventional Cartesian-based spectroscopic imaging, spiral trajectories enable faster data collection, promising the clinical translation of whole-brain MRSI. Technical considerations at 7T, however, lead to a suboptimal sampling efficiency for the spiral-out (SO) acquisitions, as a significant portion of the trajectory consists of rewinders.
Purpose:
To develop and implement a spiral-out-in (SOI) trajectory for sampling of whole-brain MRSI at 7T. We hypothesized that SOI will improve the signal-to-noise ratio (SNR) of metabolite maps due to a more efficient acquisition.
Study Type:
Prospective.
Subjects/Phantom:
Five healthy volunteers (28–38 years, three females) and a phantom.
Field Strength/Sequence:
Navigated adiabatic spin-echo spiral 3D MRSI at 7T.
Assessment:
A 3D stack of SOI trajectories was incorporated into an adiabatic spin-echo MRSI sequence with real-time motion and shim correction. Metabolite spectral fitting, SNR, and Cramér–Rao lower bound (CRLB) were obtained. We compared the signal intensity and CRLB of three metabolites of tNAA, tCr, and tCho. Peak SNR (PSNR), structure similarity index (SSIM), and signal-to-artifact ratio were evaluated on water maps.
Statistical Tests:
The nonparametric Mann–Whitney U-test was used for statistical testing.
Results:
Compared to SO, the SOI trajectory: 1) increased the k-space sampling efficiency by 23%; 2) is less demanding for the gradient hardware, requiring 36% lower Gmax and 26% lower Smax; 3) increased PSNR of water maps by 4.94 dB (P = 0.0006); 4) resulted in a 29% higher SNR (P = 0.003) and lower CRLB by 26–35% (P = 0.02, tNAA), 35–55% (P = 0.03, tCr), and 22–23% (P = 0.04, tCho), which increased the number of well-fitted voxels (eg, for tCr by 11%, P = 0.03). SOI did not significantly change the signal-to-artifact ratio and SSIM (P = 0.65) compared to SO.
Data Conclusion:
SOI provided more efficient MRSI at 7T compared to SO, which improved the data quality and metabolite quantification.
Level of Evidence:
1
Technical Efficacy Stage:
2
PROTON (1H) MAGNETIC RESONANCE SPECTROSCOPIC IMAGING (MRSI) can noninvasively probe the in vivo spatial distribution of the brain’s neurochemistry.1,2 Clinically available 7T magnetic resonance imaging (MRI) systems have increased flexibility for trade-offs between the signal-to-noise ratio (SNR), spatial resolution, and acquisition time3,4 compared to lower field MRI systems. A major goal of 7T MRSI acquisitions is to develop higher spatial/spectral resolution and faster acquisition to facilitate the clinical translation of in vivo neurochemical imaging.5,6 Higher resolution and faster acquisition can be achieved with non-Cartesian readouts; however, implementing these trajectories for MRSI sequences at 7T is associated with several technical challenges, including gradient hardware constraints, larger spectral bandwidth, and imperfections of the B0 field.3 The pulse sequence should be designed for a patient-acceptable acquisition time while preserving sufficient SNR for detectable metabolites as defined based on clinical questions.
The scan time for 3D phase-encoded MRSI is not suitable for clinical applications even for modest resolution without further acceleration. Recent developments of fast MRSI acquisitions offer alternative k-space sampling strategies, aiming to maximize the sampling efficiency per excitation and, thus, reduce the number of repetition times (TRs). Acceleration at 7T can be obtained by k-space undersampling,7,8 spatial-spectral encoding techniques,9,10 and their combinations.11 In particular, spatial-spectral encoding techniques can offer substantial acceleration factors for MRSI using Cartesian trajectories such as echo-planar spectroscopic imaging (EPSI)10 and non-Cartesian trajectories such as spiral,12 rosettes,13 and concentric circles.9,14 Non-Cartesian trajectories encode simultaneously (kx,ky,t) with smooth gradient waveforms, while Cartesian trajectories encode (kx,t) with discontinuous gradient waveforms that have more abrupt changes, putting more stress on the gradient hardware. Since the spectral dwell time is shorter at 7T to cover the range of metabolites, slew rate limitations and maximum gradient amplitude become even more important compared to lower fields, and smooth waveforms can easily accommodate short dwell times to fulfill increased spectral bandwidth requirements.
Spiral trajectories are the fastest trajectories and have been investigated for anatomical MRI on clinical 7T MR scanners15 and at lower field strengths, including MRSI.12,16 Spiral-out (SO) trajectories for MRSI need rewinders to return to the center of the k-space; as a result, they are less efficient because data are typically not sampled during radial rewinding. A solution for this is to return to the center of k-space using a spiral-in trajectory after the spiral-out trajectory, leading to a self-refocused spiral-out-in (SOI) trajectory, which can be sampled continuously. This has been shown for MRSI on clinical 3T17 and preclinical animal 7T MRI systems.18
In this work we designed SOI trajectories for metabolic imaging of the human brain at 7T on a whole-body human MR scanner. We hypothesized that increased sampling efficiency would lead to improved SNR and metabolite quantification.
Materials and Methods
MR experiments were carried out on a whole-body 7T Magnetom MR scanner (Siemens Healthcare, Erlangen, Germany) running the IDEA VB17A software and equipped with a 7T-SC72CD gradient system capable of 70 mT m−1 maximum gradient strength and 200 mT m−1 s−1 maximum slew rate. We used a custom-built 31-channel receive array coil integrated with a detunable quadrature birdcage transmit coil.19 Two dielectric pads were used on the right and left side of the subject’s head to improve the transmit B1+ homogeneity and obtain more uniform MRSI data quality across the whole brain.20
Human Subjects
The study had ethical approval from the hospital’s Ethics Committee and adhered to the Helsinki Declaration and followed the national guidelines. Informed consent was obtained from each subject using a study protocol approved by the Institutional Review Board (IRB). We acquired in vivo data from five healthy subjects (three females, ages 28–38 years).
Spiral-Out-In Trajectory and Gradient Waveform Design
The spiral k-space trajectory can be described using polar coordinates:
| (1) |
where a is a constant, τ(t) is a function of the gradient for constant or variable spiral pitch, ω is the number of windings of the spiral, the phase φn = 2π (n − 1)/N corresponds to the n-th angular inter-leaf with N being the total number of angular interleaves required to sample k-space at the Nyquist rate. For SO trajectories, the return to the origin of the k-space on a radial path was obtained with rewinder gradients. The combination of the spiral and rewinding gradients was repeated during the entire readout duration to sample the free induction decay (FID) time dimension, which translates into the spectral dimension via Fourier transform. The Nyquist criterion for the spectral dimension limits the duration of the spiral gradients and requires the use of angular and temporal interleaves for alias-free data of the spatial and the spectral dimension, respectively.
The SOI trajectory can be obtained by inversion and time reversal of the spiral-out Gx and Gy gradients during the spiral-in arm.18,21 The following formulae describe the evolution of an SOI trajectory:
| (2) |
where T is the duration of the SOI waveform.
Adiabatic Spin-Echo Slab Selection and Signal Excitation
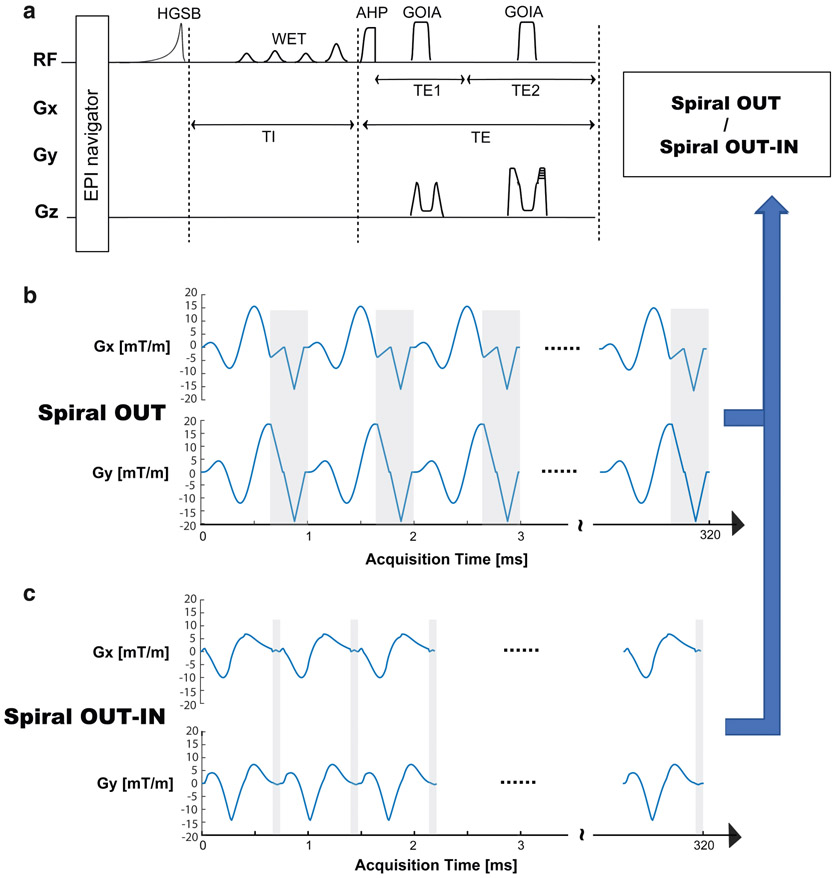
Signal excitation and slab selection were performed in the same way for both SO and SOI readouts and included the following components (Fig. 1): 1) fat suppression with inversion recovery using an asymmetric adiabatic hypergeometric (HGSB) pulse22 and 270 msec delay for lipid nulling; 2) adiabatic spin-echo sequence (ASE)22 with an excitation hyperbolic secant adiabatic half passage pulse (HS8 modulation; duration = 4 msec; bandwidth = 5 kHz; B1+,max = 6 μT) and a pair of gradient offset-independent adiabatic refocusing pulses (GOIA-W16,4)23 modulation (duration = 5 msec; bandwidth = 20 kHz; B1,max = 16 μT); and 3) water suppression with a four-pulse water suppression enhanced through T1 effects (WET) module of 160 msec total duration which was optimized for 7T.
FIGURE 1:
3D MRSI pulse sequences. (a) The five building blocks: (i) echo-planar imaging (EPI) navigator for real-time motion correction and shim update; (ii) hypergeometric single band (HGSB) inversion recovery fat suppression; (iii) water suppression enhanced through T1 effects (WET); (iv) adiabatic spin-echo; (v) either spiral-out or spiral-out-in trajectories (blue arrows). The spiral gradient waveforms for spatial-spectral encoding with a readout time of 320 msec are shown for (b) spiral-out and (c) spiral-out-in. The gray areas indicate rewinder regions. AHP: adiabatic half passage; GOIA: gradient offset independent adiabatic.
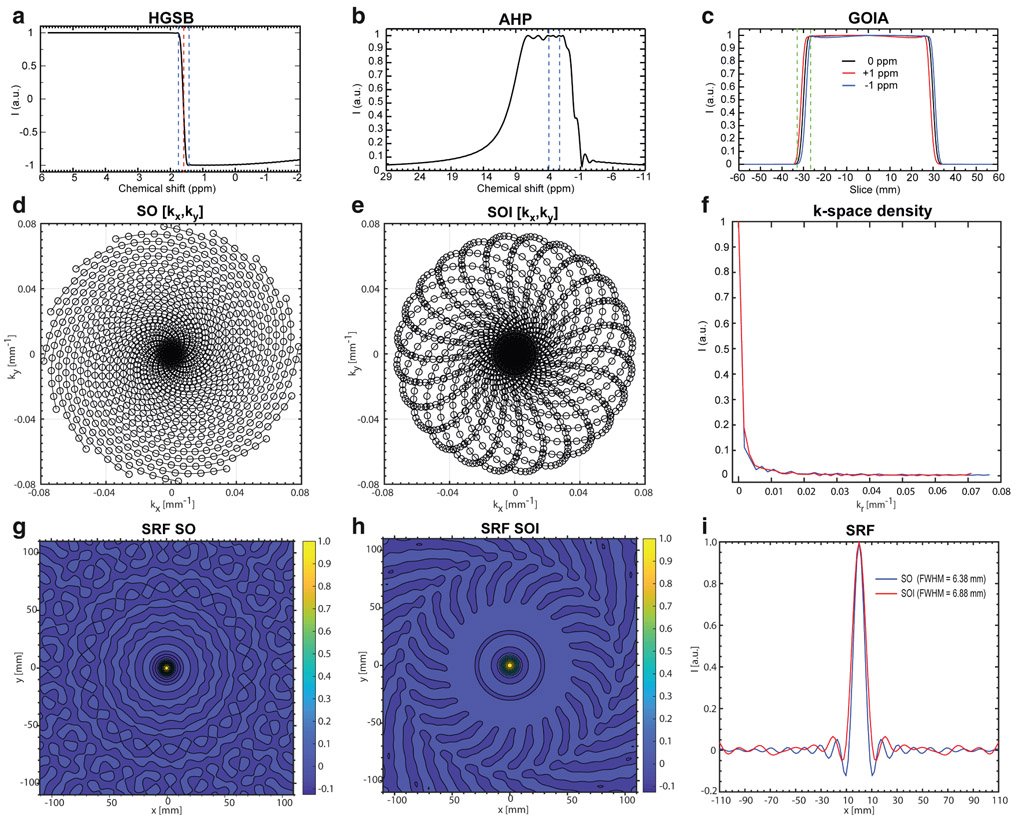
The HGSB pulse22 was designed for 7T and had a 30-msec duration (A = 3.2842; B = 0.1751; C = −1.7; D = 1.4231; Ω = 9.1809), 12 μT B1+,max amplitude, 2 kHz inversion band, and a transition band of 90 Hz that was centered at 1.6 ppm, providing full inversion below 1.4 ppm and no inversion above 1.8 ppm, suppressing the main lipid peaks at 1.2 and 0.9 ppm while preserving the metabolite SNR above 2 ppm. The WET module used Gauss pulses of 150 Hz bandwidth, flip angles of 83.6°, 99.7°, 74.7°, and 160°, and 40-msec interpulse delays. Frequency and slice selection profiles of the HGSB, AHP-HS8, and GOIA-W16,4 pulses are shown in Fig. 2(a-c).
FIGURE 2:
(a) The simulated frequency profile of the HGSB adiabatic selective fat inversion pulse of 30 msec duration, 12 μT B1+ amplitude; the dashed lines indicate the 0.3 ppm transition band. (b) Excitation profile of the hyperbolic secant (HS8) adiabatic half passage pulse for 4 msec duration, 5 kHz bandwidth, 6 μT B1+ amplitude; dashed lines indicate the spectral range of interest. (c) Slice selection profile achieved by the gradient offset independent adiabatic refocusing GOIA-W16,4 pulses of 5 msec duration, 20 kHz bandwidth, 16 μT B1+ amplitude; dashed lines indicate the transition band and the chemical shift displacement error for ±1 ppm. (d) Spiral-out (SO) (kx, ky) trajectories. (e) Spiral out-in (SOI) (kx, ky) trajectories. (f) Comparison of k-space density for SO and SOI trajectories. Simulated spatial response function (SRF) for SO (g) and SOI (h) trajectories for a matrix size of 44 × 44 and FOV of 220 × 220 mm2. (i) 1D SRF projections for SO (blue) and SOI (red) trajectories.
MRSI and MRI Acquisition Protocols
Both the SO and SOI trajectories (Fig. 2d,e) were designed using constant density spirals (τ(t) = 10 μs in Eqs. 1 and 2) for a field of view (FOV) of 220 × 220 mm2 and a matrix of 44 × 44, resulting in a nominal in-plane spatial resolution of 5 × 5 mm2. The SOI trajectory was calculated using a spectral window of ~2700 Hz, 24 angular interleaves, and two temporal interleaves, which required a maximum gradient amplitude Gmax = 14.19 mT m−1 and maximum slew rate Smax = 158.89 mT m−1 s−1 (Fig. 1). The SOI gradients had a duration of 680 μs, which was followed by a very short rewinder gradient of 60 μs to return to the center of k-space. The SO trajectory was calculated using a spectral window of ~2850 Hz, 16 angular interleaves, and three temporal interleaves, which required a maximum gradient amplitude Gmax = 18.57 mT m−1 and maximum slew rate Smax = 199.62 mT m−1 s−1 (Fig. 1). The SO gradients had a duration of 650 μs, which was followed by a rewinder gradient of 400 μs to return to the center of k-space. The total readout of the time domain signal was the same (320 msec) for both SOI and SO.
Additional phase encoding in the slice direction (stack-of-SO/SOI) was performed for 3D MRSI with a matrix of 44 × 44 × 8 and FOV = 220 × 220 × 80 mm3, yielding a nominal voxel volume of 5 × 5 × 10 mm3. The other acquisition parameters were: repetition time (TR) / inversion time (TI) / echo time (TE) = 1800/270/78 msec and one average giving a total acquisition time of 11 minutes, 32 seconds. The slab thickness excited by ASE was 50 mm. For all MRSI acquisitions, the SAR was between 50–85% of the maximum SAR limit, as monitored by the MRI system. A volumetric double-echo echo-planar imaging (EPI) navigator24,25 was interleaved each TR with the 3D MRSI for real-time motion correction, field mapping, and frequency drift correction using the following parameters: water selective excitation with a 2° flip angle, TR = 8.8 msec, TE1/TE2 = 3.5/4.5 msec, FOV of 256 × 256 × 176 mm3, matrix 32 × 32 × 22, EPI factor 16, slice partial 6/8 Fourier sampling, bandwidth 4596 Hz/Pixel, isotropic voxel 8 × 8 × 8 mm3, and acquisition time of 0.6 seconds.
In addition to metabolite imaging, the spiral trajectories were used to collect water unsuppressed MRSI for coil combination. Water MRSI was also used to assess the image quality of SO and SOI trajectories. The water reference was acquired with the same acquisition parameter as the metabolite MRSI with a resolution matrix 44 × 44 × 8 and FOV = 220 × 220 × 80 mm3 in 11 minutes and 32 seconds and compared to anatomical imaging, which was used as the ground truth for structural details.
Anatomical imaging was acquired with 1 mm isotropic resolution 3D T1-weighted multiecho-MPRAGE (MEMPRAGE) using TR = 2550 msec, TE1/TE2/TE3/TE4 = 1.57/3.35/5.13/6.91 msec, TI = 1100 msec, and a flip angle of 7°. A double echo gradient echo (GRE) sequence was used for B0 field mapping (TR = 323 msec; TE1 = 2 msec; TE2 = 3 msec) and to allow postprocessing via over-discrete B0 correction.26
RF Pulses
We performed simulations of frequency and slice profiles for the fat inversion HGSB pulse, the excitation AHP pulse, and the slice refocusing GOIA pulse. The frequency profile of the HGSB pulse (Fig. 2a) shows a very narrow transition band of 90 Hz (0.3 ppm) and a wide inversion band of 1 kHz. The frequency profile of the AHP pulse (Fig. 2b) shows a flat excitation profile in the chemical shift range of 2–4 ppm. The slab selection profile of the GOIA pulses (Fig. 2c) shows: 1) a very small chemical shift displacement error of 1.5% per 1 ppm; 2) flat top and sharp transition band that is 10% of the slab thickness with no ripple outside the slab; and 3) minimal slice smearing due to gradient modulation with less than 2% signal change of the flat top over ±1 ppm chemical shift offset.
Trajectory Efficiency and Spatial Response Function
We compared the sampling efficiency based on the number of k-space points sampled during spiral gradients and rewinders defined as the following:
| (3) |
The theoretical spatial response function (SRF) for spiral MRSI without density compensation can be calculated using the definition (discrete form):
| (4) |
where is the Jacobian of the transformation matrix from Cartesian to polar coordinates for the spiral trajectories, with N the number of angular interleaves and M the number of sampling points along the trajectory. We simulated the SRF of SO (Fig. 2g), and SOI trajectory (Fig. 2h) based on the gradient waveforms generated by the pulse sequence played on the MRI scanner.
Phantom Experiments
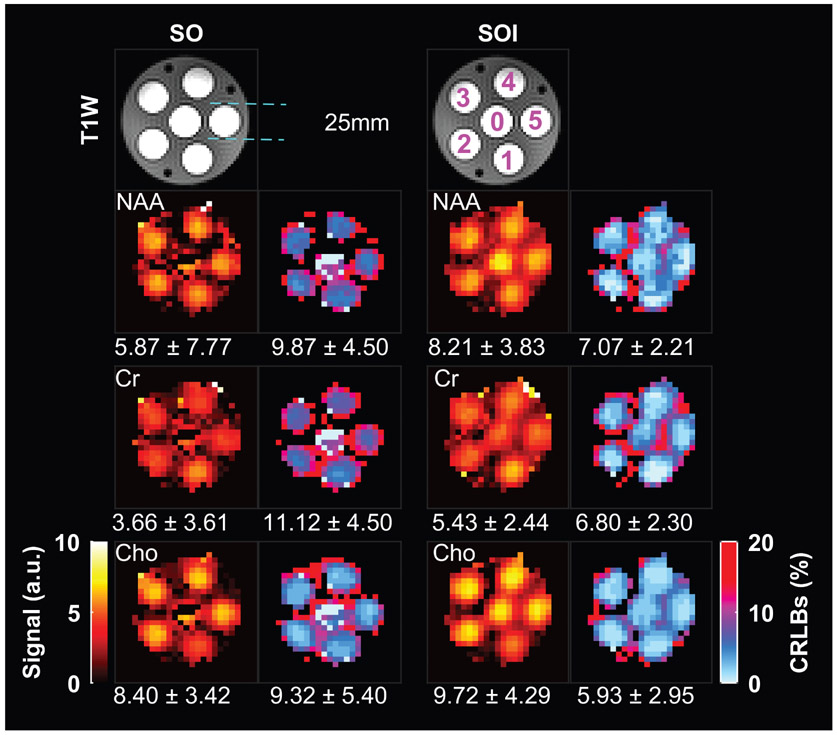
A structural-metabolic phantom was measured containing six tubes of 25-mm diameter each, positioned symmetrically inside a larger cylindrical container of 110-mm diameter (Fig. 3). All six tubes were filled with buffered solutions (pH = 7) and a mixture of brain metabolites: 6 mM of NAA, 8 mM of glutamate, 1 mM of GABA, 4 mM of creatine, 5 mM of choline, 8 mM of Myo-inositol, and 4 mM of lactate. The tube solutions were doped with Magnevist 1 ml/L to shorten T1. The large cylindrical container was filled with an aqueous solution that contained no metabolites and was not doped with Magnevist.
FIGURE 3:
T1-weighted shows the six tubes (0–5) containing brain metabolites. N-acetyl aspartate (NAA), creatine (Cr), choline (Cho), and their corresponding Cramer–Rao lower bound error (CRLB) maps of the phantom acquired by spiral-out (SO) and spiral-out-in (SOI) MRSI. The mean ± standard deviation of metabolite concentrations and CRLB are shown under each map.
MRSI Reconstruction
The raw MRSI data were reconstructed and analyzed with an in-house processing package using MatLab R2018b (MathWorks, Natick, MA), Bash V4.2.25 (Free Software Foundation, Boston, MA), MINC tools V2.0 (McConnell Brain Imaging Center, Montreal, QC, Canada), FSL/Freesurfer27 for neuroimaging, and LCModel V6.3 (LCMODEL, Oakville, Ontario, Canada)28 for spectral fitting. The metabolite MRSI signals of individual channels were combined using Signal/Noise2 weighting derived from water MRSI data.29 The reconstruction of the coil combined non-Cartesian data was performed via the nonuniform discrete Fourier transform (NUDFT),30 followed by the removal of residual lipid signal with the L1 penalty,31 overdiscrete B0 correction,26 and spatial Hamming filtering. To account for the nonuniform density of spiral sampling, we used the density compensation function (DCF) described by Hoge et al.32
Image Quality Metrics for MRSI-Based Water Maps
In addition to metabolite maps, we analyzed the water maps obtained from water unsuppressed MRSI to assess the performance of SO and SOI trajectories for spatial mapping. The in vivo water maps measured by MRSI were compared against ground-truth water maps derived from brain segmentation of T1-weighted MEMPRAGE images downsampled to the MRSI resolution. To characterize the image quality, we calculated the peak signal-to-noise ratio (PSNR), structural similarity index (SSIM), and signal to artifact (SigArt) ratio. To measure the PSNR and SSIM, we generated a ground-truth to compare against the in vivo and phantom water maps measured by MRSI. The ground-truth water maps were derived from brain segmentation of T1-weighted MEMPRAGE images downsampled to the MRSI resolution. For the phantom’s ground-truth water image, the T1-weighted MEMPRAGE images were downsampled to the spatial resolution of the MRSI data. PSNR is defined as:
| (5) |
where Imax is the maximum voxel value within the image volume and MSE is the cumulative squared error between two images:
| (6) |
where I is the ground-truth anatomical water map, K the MRSI water map, and x, y, and z are image dimensions. SSIM is defined as
| (7) |
where X and Y are the ground-truth anatomical water and MRSI water maps, respectively, μx, and μy are the mean value of X and Y, respectively; σx and σy are the standard deviations of images X and Y, respectively; σxy is the covariance of the images X and Y; (k1d)2 and (k2d)2 are variables to stabilize the division with weak denominator with default values of k1 = −.01, k2 = −.03, and d is the dynamic range of the voxel values (typically 2#bits per voxel − 1).
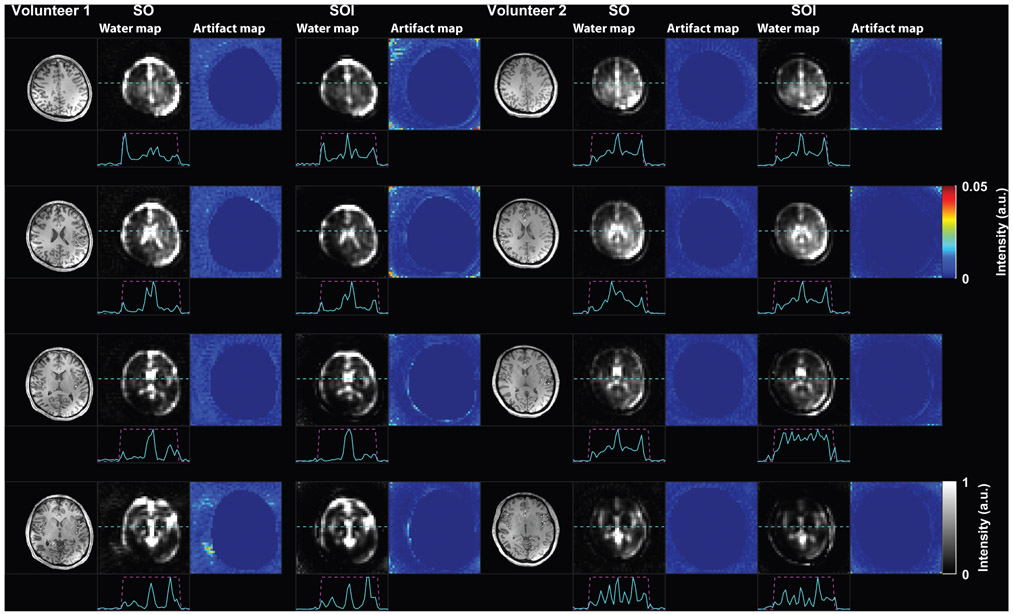
The level of streaking spiral artifacts was estimated by calculating the SigArt ratio. The signal was estimated within the brain region obtained by the brain extraction tool of FSL and the noise in the region outside the brain. The SigArt defined as the difference between mean (μ) water signal inside the brain and the mean of noise+artifact outside the head relative to the standard deviation (σ) of noise+streaking artifact outside the head:
| (8) |
Metabolite Quantification and Quality Metrics for MRSI Metabolic Maps
After reconstruction, MR spectra of brain voxels were phase/frequency corrected and fitted by LCModel between 1.8 and 4.2 ppm with a basis-set simulated in GAMMA33 using the same RF pulses and gradient modulation as used by the scanner. The basis set included the following metabolites: aspartate (Asp), creatine (Cr), gamma-aminobutyric acid (GABA), glutamate (Glu), glutamine (Gln), glutathione (GSH), glycine (Gly), glycerophosphocholine (GPC), glycerophosphoethanolamine (GPE), Myo-inositol (Ins), lactate (Lac), N-acetyl-aspartate (NAA), N-acetyl-aspartyl glutamate (NAAG), phosphocholine (PCh), phosphocreatine (PCr), phosphorylethanolamine (PE), scyllo-Inositol (Scy), serine (Ser), and taurine (Tau). The results include only the following metabolites: total NAA (tNAA) is reported as the sum contribution of NAA and NAAG, total choline (tCho) as the sum of GPC and PCh, and total creatine (tCr) as the sum of Cr and PCr.
Linewidths <0.1 ppm, Cramer–Rao lower bound (CRLB) <20%, and SNR >5, as determined by LCModel fitting, were used as thresholds for the goodness of fit of the metabolite signals and spectral quality. These thresholds were used as inclusion criteria for MRSI voxels with adequate goodness of fitting for each metabolite (“well-fitted” voxels). The percentage of voxels in metabolic maps with acceptable quality were compared between the SO and the SOI. Also, we compared the performance of the two trajectories on the mean difference in the signal of metabolic maps and the corresponding CRLB for three metabolites of tNNA, tCr, and tCho. The overall SNR estimated by LCModel fitting was also compared between the two methods in human subjects. Spectral quality from selected voxels was also assessed based on the amplitude of the metabolite peaks compared to the baseline and the level of artifacts due to fat signal in the region that is upfield from the main NAA peak (<2 ppm), which elevate the baseline (baseline fat artifacts).
Statistical Analysis
Statistical analysis was performed using GraphPad Prism (GraphPad Software, V4.03, San Diego, CA). Mean differences between computed metrics were compared using the nonparametric Mann–Whitney test with the threshold for statistical significance defined as P < 0.05. Data are presented as mean ± standard deviation.
Results
Trajectory Efficiency and Spatial Response Function
The SO trajectory (Fig. 2d) has 78% sampling efficiency, while the SOI trajectory (Fig. 2e) provides 96% sampling efficiency. Notably, the SOI trajectory achieves higher efficiency, while it needs a 31% lower maximum gradient amplitude and a 26% lower maximum slew-rate compared to the SO trajectory. The SOI trajectory has a slightly higher sampling density compared to the SO trajectory in the center of k-space (Fig. 2f).
The full-width at half-maximum (FWHM) of the SRF (Fig. 2i) is 6.38 mm for SO and 6.88 mm for SOI, resulting in 16% larger effective voxel volume for SOI vs. SO. Visually, the ringing sidelobes (Fig. 2i) of the 1D SRF main lobe have lower amplitude for SOI trajectory compared to SO, which shows as less floor noise in the 2D SRF (Fig. 2g,h).
Phantom Imaging
Figure 3 shows the comparison between phantom data acquired by SO and SOI trajectories. SOI increased the signal in the NAA, Cr, and Cho concentration maps by 40% (P = 0.009), 48% (P = 0.0001), and 17% (P = 0.01), respectively, compared to the SO trajectory. The CRLB values of the NAA, Cr, and Cho maps were significantly decreased by 38% (P = 0.01), 11% (P = 0.02), and 63% (P = 0.0001), respectively, with the SOI trajectory compared to the SO (Table 1). The number of well-fitted voxels was significantly increased for both NAA (+35%, P = 0.009), Cr (+27%, P = 0.0006, Table 2), and Cho (+36%, P = 0.0001) in the SOI-derived metabolite maps compared to the SO. The NAA/Cr metabolic ratio measured by SO is 1.6, while it is 1.51 by SOI, which is closer to the ground-truth ratio of 1.5. Examples of MR spectra from each tube are shown for the SO and SOI trajectories for similar noise levels in Fig. S1A in the Supplemental Material.
TABLE 1.
Comparison of Metabolite’s Signal and CRLB Between Spiral-Out (SO) and Spiral-Out-In (SOI) in Phantom and Human Subjects
| tNAA | tCr | tCho | CRLBNAA | CRLBCr | CRLBCho | |||
|---|---|---|---|---|---|---|---|---|
| Phantom | SO | 5.87 ± 7.77 | 3.66 ± 3.61 | 8.40 ± 3.42 | 9.87 ± 4.50 | 11.12 ± 4.50 | 9.32 ± 5.40 | |
| SOI | 8.21 ± 3.83 | 5.43 ± 2.44 | 9.72 ± 4.29 | 7.07 ± 2.21 | 6.80 ± 2.30 | 5.93 ± 2.95 | ||
| P = 0.009 | P = 0.0001 | P = 0.01 | P = 0.01 | P = 0.02 | P = 0.0001 | |||
| Volunteers (n = 5) | SO | 5.52 ± 6.60 | 3.15 ± 4.45 | 1.03 ± 3.37 | 8.14 ± 12.28 | 11.09 ± 13.81 | 10.51 ± 14.12 | |
| SOI | 6.52 ± 6.54 | 3.50 ± 4.44 | 1.05 ± 2.78 | 5.97 ± 10.09 | 7.40 ± 10.84 | 8.13 ± 12.02 | ||
| P = 0.0001 | P = 0.003 | P = 0.76 | P = 0.02 | P = 0.03 | P = 0.04 |
Mean ± standard deviation of metabolite signals (a.u.) estimated by LCModel and the goodness of fit measure by Cramer–Rao lower bounds (CRLB) (%) of tNAA, tCr, and tCho.
TABLE 2.
Comparison Between Spiral-Out (SO) and Spiral-Out-In (SOI) in Phantom and Human Subjects
| SNR | SigArt | PSNR (dB) | SSIM | VoxelsCre (%) | ||
|---|---|---|---|---|---|---|
| Phantom | SO | 6.36 ± 3.96 | 32.44 ± 4.12 | 28.75 ± 2.42 | 0.91 ± 0.01 | 69.07 |
| SOI | 10.02 ± 3.83 | 31.84 ± 3.73 | 29.64 ± 2.13 | 0.92 ± 0.01 | 87.67 | |
| P = 0.01 | P = 0.14 | P = 0.22 | P = 0.73 | P = 0.0006 | ||
| Volunteers (n = 5) | SO | 5.89 ± 3.10 | 14.62 ± 2.59 | 33.14 ± 4.45 | 0.76 ± 0.16 | 74.92 ± 3.64 |
| SOI | 7.65 ± 5.09 | 15.89 ± 2.68 | 38.08 ± 4.36 | 0.78 ± 0.20 | 82.80 ± 5.74 | |
| P = 0.003 | P = 0.33 | P = 0.001 | P = 0.65 | P = 0.03 |
Mean ± standard deviation of metabolite signal-to-noise ratio (SNR) estimated by LCModel, signal to artifact ratio (SigArt) of water maps, peak signal-to-noise ratio (PSNR) of water maps, the structural similarity index (SSIM) of water maps, and the percentage of well-fitted voxels in creatine metabolic maps.
The image quality obtained from SOI and SO trajectories was also compared on water maps by calculating PSNR and SSIM relative to the ground-truth water image acquired by MEMPRAGE (Fig. S1B in the Supplemental Material). PSNR and SSIM showed a small increase by 0.89 dB (P = 0.22) and 0.01 (P = 0.73), respectively, between SO and SOI acquisitions (Table 2).
Human Imaging
The water MRSI maps obtained by SO and SOI in two representative volunteers are shown in Fig. 4, and the ground-truth water maps derived from MEMPRAGE downsampled at the MRSI spatial resolution with T1 and T2 corrections for SO and SOI measured water maps are shown in Fig. 5 for the same two volunteers. The SigArt ratio is comparable in the SO and SOI acquisition, with mean values of 15.89 vs. 14.62 (P = 0.33), respectively (Table 2). The SOI has a 15% (4.94 dB, P = 0.001) higher mean PSNR compared to SO, while the SSIM did not differ significantly between SOI and SO water maps (0.78 vs. 0.76, P = 0.65, respectively).
FIGURE 4:
Water maps in human subjects. Examples of the spiral-out (SO) and spiral-out-in (SOI) water maps are shown for two healthy subjects and four MRSI slices. 1D profiles are shown below each water map. The cyan dashed lines indicate the location of the profile, and the magenta dashed lines indicate the boundary of the head where MR signals are expected from. The streaking artifacts generated by both SO and SOI trajectories are visible outside the head. The level of streaking artifacts is made visible by masking the head and showing the background noise outside the head.
FIGURE 5:
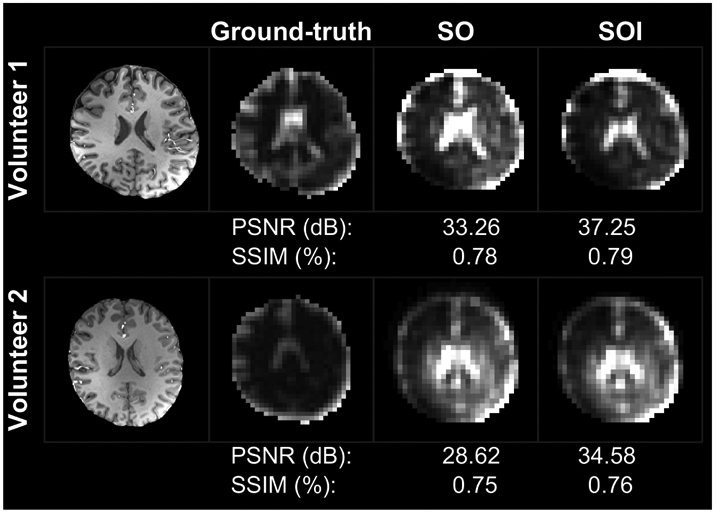
Comparison of the spiral-out-in (SOI) and spiral-out (SO) water maps against the ground-truth water map derived from anatomical imaging. Peak signal-to-noise ratio (PSNR) and the structural similarity index (SSIM) scores are reported under each acquisition and volunteer.
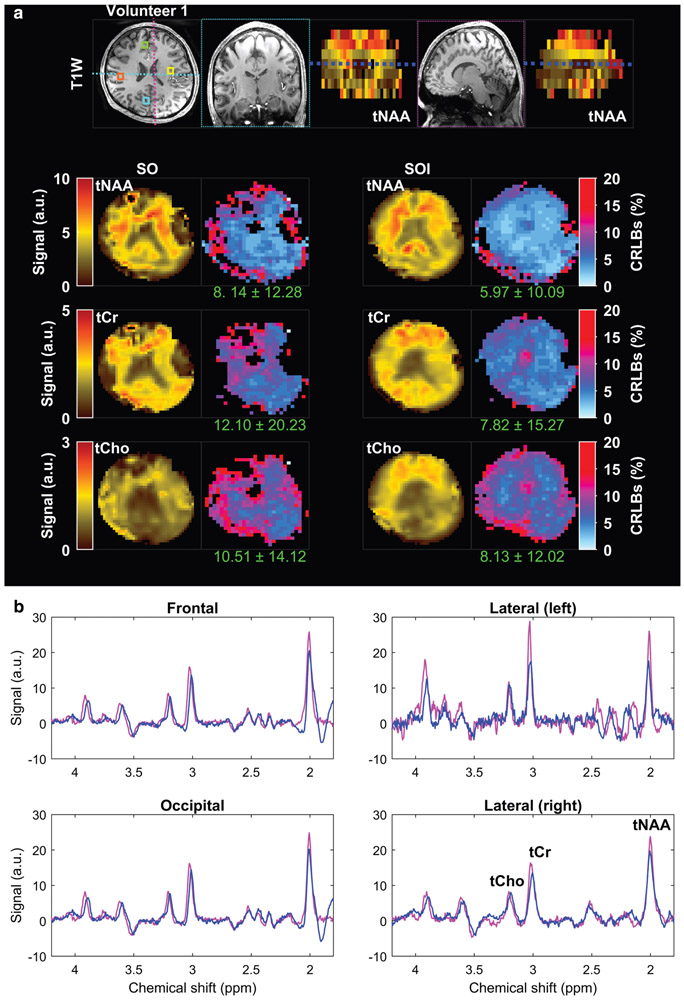
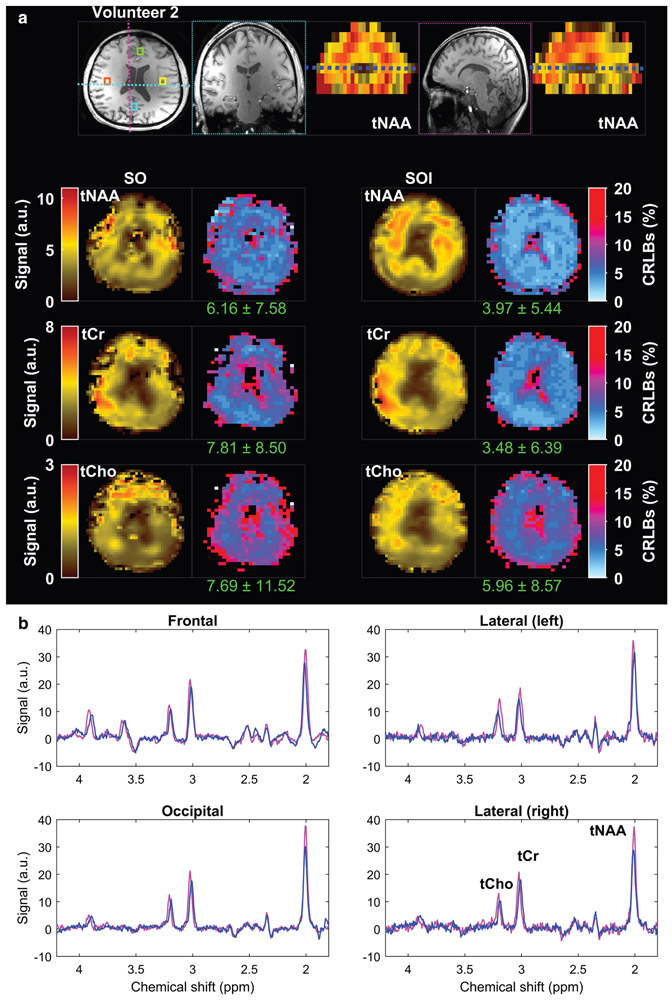
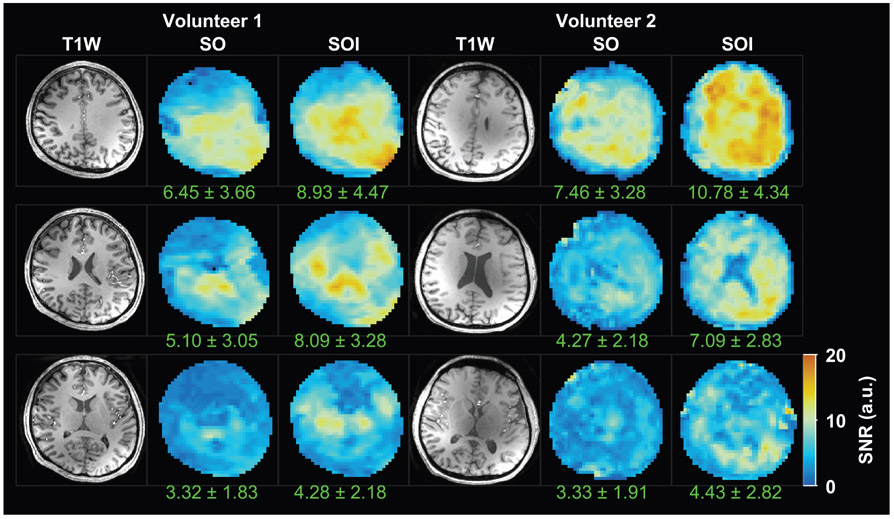
The metabolite concentration maps obtained with SOI and SO trajectories from the same two volunteers are shown in Figs. 6 and 7. Improvement in metabolite fitting for SOI acquired data is demonstrated by lower CRLB values by 26–35% (P = 0.02) for tNAA, by 35–55% (P = 0.03) for tCr, and by 22–23% (P = 0.04) for tCho when compared to the CRLB of SO (Table 1). Comparison of metabolite SNR estimated by LCModel fitting is shown in Fig. 8 for the same two volunteers as used in Figs. 6 and 7. The SOI acquisition increased the mean SNR by 29% (Table 1, P = 0.003) compared to the SO acquisition. SOI provided a significant increase in the number of well-fitted voxels (CRLB <20%) of tNAA (+12%, P = 0.02), tCr (+11%, P = 0.03, Table 2), and tCho (+10%, P = 0.04) compared to the SO trajectory. Examples of MR spectra from four different brain areas demonstrate a higher metabolite peak amplitude for the SOI trajectory and fewer baseline artifacts coming from fat signals.
FIGURE 6:
Metabolic maps obtained with spiral-out (SO) and spiral-out-in (SOI) trajectories in the first volunteer. (a) The axial slice is selected from the dashed-dark blue line illustrated on the coronal and sagittal tNAA maps on the top. The coronal and sagittal views of the T1-weighted image were extracted from the regions determined on the axial view, illustrated by the cyan and the magenta dashed lines, respectively. (b) Total NAA (tNAA), total choline (tCho), total creatine (tCr), and corresponding Cramer–Rao lower bound error (CRLB) maps are shown for both acquisition methods. The values provided under each CRLB map indicate the mean and standard deviation calculated over the whole-brain slab. Examples of spectra from frontal (green box), lateral-left (yellow box), lateral-right (orange box), and occipital (cyan box) regions are shown overlaid on the T1-weighted image at the top for SO (blue) and SOI (magenta). Positions of metabolic maps and voxels are indicated on the anatomical MEMPRAGE in (a).
FIGURE 7:
Metabolic maps obtained with spiral-out (SO) and spiral-out-in (SOI) trajectories in the second volunteer. (a) The axial slice is selected from the dashed-dark blue line illustrated on the coronal and sagittal tNAA maps on the top. The coronal and sagittal views of the T1-weighted image were extracted from the regions determined on the axial view, illustrated by the cyan and the magenta dashed lines, respectively. (b) Total NAA (tNAA), total choline (tCho), total creatine (tCr), and corresponding Cramer–Rao lower bound error (CRLB) maps are shown for both acquisition methods. The values provided under each CRLB map indicate the mean and standard deviation calculated over the whole-brain slab. Examples of spectra from frontal (green box), lateral-left (yellow box), lateral-right (orange box), and occipital (cyan box) regions are shown overlaid on the T1-weighted image at the top for SO (blue) and SOI (magenta). Positions of metabolic maps and voxels are indicated on the anatomical MEMPRAGE shown in (a).
FIGURE 8:
Comparison of metabolite signal-to-noise ratios (SNR) derived by LCModel fitting in two subjects. Three representative axial slices from the center of the MRSI volume are depicted. The mean and standard deviation of the SNR values is indicated under the SNR map of each slice.
Discussion
Our results demonstrate that slab-selective 3D SOI 1H-MRSI of the human brain is feasible with a 7T whole-body human MR system. The SOI trajectory increased the acquisition efficiency compared to the SO efficiency by reducing the rewinders and collecting more k-space trajectory points per excitation. Compared to the SO trajectory, SOI provided increased SNR and increased the number of voxels with adequate spectral fitting in the human brain.
Our method has unrestricted axial FOV and can image cortical gray matter in healthy individuals. This is also useful for white matter lesions that often extend to the gray–white matter border and can be missed or only partially imaged by inner volume excitation10,14 methods. The metabolite maps correspond closer to the T1-weighted maps in the case of SOI acquired data compared to SO. The improvement in metabolite maps is notably in the frontal and lateral regions of the brain, where SO maps exhibit missing voxels due to B0 inhomogeneity-related signal loss and lipid artifacts (Figs. 6 and 7). To improve our imaging method’s robustness, we incorporated a navigator in the MRSI sequence for real-time frequency update and motion correction, as has been shown at 7T and 3T.24,25
The effective voxel volume of SOI acquisition is larger than the voxel size of the SO, accounting for approximately half of the SNR increase, and the remaining increase of SNR was due to trajectory efficiency, higher sampling density in the center of k-space, and fewer temporal interleaves for SOI compared to SO. The evaluation of water map images indicated that SOI performed spatial mapping better or equally as well as the SO trajectory. The SOI water maps acquired in human subjects showed a higher mean PSNR value and similar performance on SSIM and SigArt compared to the SO trajectory. The SOI trajectory is less demanding for the gradient hardware, with lower Smax and Gmax compared to the SO trajectory. Hence, SOI produces fewer eddy currents and acoustic noise. Because of fewer temporal interleaves, the SOI has fewer temporal-interleaf-induced sidebands,18 and hence fewer artifacts and less signal loss. With many temporal interleaves, it becomes difficult to avoid the overlap of sideband artifacts with metabolite signals and there is a sensitivity penalty due to the signal being spread across sidebands.16 Additionally, the self-refocusing nature of the SOI trajectory may be helpful in the presence of B0 inhomogeneity or subject motion.17 Notably, the in vivo SOI metabolic maps had better quality in frontal regions and close to the edge of the brain, which experiences more considerable B0 inhomogeneity.
In recent studies, the spatial resolution of brain MRSI has been pushed at ultrahigh field using free induction decay (FID) sequences with low flip angle, short TRs, short acquisition delay, undersampling, and/or spatial-spectral encoding.5,6 Spin echo MRSI sequences have been demonstrated at ultrahigh field with lower spatial resolution mainly due to longer TRs associated with the higher SAR of refocusing pulses.10,14,24 Although FID-MRSI has the advantage of short TRs due to lower SAR of low flip angle and high SNR due to the absence of echo times or J-evolution,6 the spectral overlap is still a problem at ultrahigh field for some important brain metabolites. Spin-echo sequences can be useful at ultrahigh field for editing important metabolites such as 2-hydroxyglutarate (2HG)10 or gamma-amino-butyric-acid (GABA).24 Metabolite linewidth in spin-echo sequences might be narrower because longer echo times might select for metabolite pools from tissue compartments with longer T2 relaxation times34 compared to ultrashort echo time sequences. Besides higher SAR, an important problem for spin-echo sequences at ultrahigh field is the performance of the slice refocusing pulses, which need a high flip angle (180°) for an efficient spin-echo. B1+ inhomogeneity can cause deviation from the desired flip angle, resulting in signal drop and a change in spectral pattern for coupled spins. To mitigate this problem, we used adiabatic pulses that are insensitive to B1+ inhomogeneities. In addition, we used gradient modulation to reduce the adiabatic threshold23 and pads with dielectric materials of high electric permeability to improve the B1+ field and lower transmit voltage.20 Hence, the B1+ amplitude can be increased above the adiabatic threshold within SAR limits for improved immunity to B1+ inhomoge-neities and to minimize gradient-modulated slice distortion for chemical shift offsets. Due to the large bandwidth of gradient modulated adiabatic pulses (20 kHz) and the large time-bandwidth product (100), the slice displacement error and the slice smearing are minimized.
Limitations
Our nominal resolution (5 × 5 × 10 mm3) is lower than what has been shown to date with FID-MRSI at ultrahigh field strengths. Increasing the resolution for spiral trajectories at 7T is difficult due to slew rate limitations and long measurement times. To further increase the resolution of spiral trajectories, undersampling techniques such as parallel imaging,35 compressed sensing,36 or SPICE37 are necessary. The coverage in the slice direction was limited to a brain slab of 5 cm due to challenges with B0 shimming using the standard scanner shimming hardware that has only first- and second-order spherical harmonic shim coils. Larger brain slabs could be imaged with better shimming by specialized shim hardware38-40 or by using thinner slices, which improves intravoxel B0 inhomogeneities.4 Our study included only five healthy subjects, and further validation is necessary with larger cohorts.
Conclusion
In summary, we implemented an SOI trajectory at 7T for metabolite mapping that provided increased SNR, improved spectral fitting, and increased the number of quantifiable voxels across the brain. This performance may help clinical applications of 3D MRSI at 7T to investigate brain metabolism under healthy and pathological conditions.
Supplementary Material
Acknowledgments
Funding from the US National Institutes of Health through the National Cancer Institute (1R01CA211080 to O.C.A.). Morteza Esmaeili was supported by funding from Helse SørØst RHF – Southern and Eastern Norway Regional Health Authority grant 2018047. Bernhard Strasser was supported by a fellowship (J 4124-N36) and Wolfgang Bogner by a research grant (P 30701) of the Austrian Science Fund.
Footnotes
Additional supporting information may be found in the online version of this article
References
- 1.Oz G, Alger JR, Barker PB, et al. Clinical proton MR spectroscopy in central nervous system disorders. Radiology 2014;270(3):658–679. [DOI] [PMC free article] [PubMed] [Google Scholar]
- 2.Chronaiou I, Stensjoen AL, Sjobakk TE, Esmaeili M, Bathen TF. Impacts of MR spectroscopic imaging on glioma patient management. Acta Oncol 2014;53(5):580–589. [DOI] [PubMed] [Google Scholar]
- 3.Karamat MI, Darvish-Molla S, Santos-Diaz A. Opportunities and challenges of 7 Tesla magnetic resonance imaging: A review. Crit Rev Biomed Eng 2016;44(1–2):73–89. [DOI] [PubMed] [Google Scholar]
- 4.Motyka S, Moser P, Hingerl L, et al. The influence of spatial resolution on the spectral quality and quantification accuracy of whole-brain MRSI at 1.5T, 3T, 7T, and 9.4T. Magn Reson Med 2019;82(2):551–565. [DOI] [PMC free article] [PubMed] [Google Scholar]
- 5.Bogner W, Otazo R, Henning A. Accelerated MR spectroscopic imaging-a review of current and emerging techniques. NMR Biomed 2020;33:e4314. [DOI] [PMC free article] [PubMed] [Google Scholar]
- 6.Henning A Proton and multinuclear magnetic resonance spectroscopy in the human brain at ultra-high field strength: A review. Neuroimage 2018;168:181–198. [DOI] [PubMed] [Google Scholar]
- 7.Strasser B, Povazan M, Hangel G, et al. (2 + 1)D-CAIPIRINHA accelerated MR spectroscopic imaging of the brain at 7T. Magn Reson Med 2017;78(2):429–440. [DOI] [PMC free article] [PubMed] [Google Scholar]
- 8.Nassirpour S, Chang P, Avdievitch N, Henning A. Compressed sensing for high-resolution nonlipid suppressed (1) H FID MRSI of the human brain at 9.4T. Magn Reson Med 2018;80(6):2311–2325. [DOI] [PubMed] [Google Scholar]
- 9.Hingerl L, Bogner W, Moser P, et al. Density-weighted concentric circle trajectories for high resolution brain magnetic resonance spectroscopic imaging at 7T. Magn Reson Med 2018;79(6):2874–2885. [DOI] [PMC free article] [PubMed] [Google Scholar]
- 10.An Z, Tiwari V, Ganji SK, et al. Echo-planar spectroscopic imaging with dual-readout alternated gradients (DRAG-EPSI) at 7 T: Application for 2-hydroxyglutarate imaging in glioma patients. Magn Reson Med 2018;79(4):1851–1861. [DOI] [PMC free article] [PubMed] [Google Scholar]
- 11.Moser P, Bogner W, Hingerl L, et al. coil combination using interleaved calibration data — Application to concentric-ring MRSI of the human brain at 7T. Magn Reson Med 2019;82(5):1587–1603. [DOI] [PMC free article] [PubMed] [Google Scholar]
- 12.Adalsteinsson E, Irarrazabal P, Topp S, Meyer C, Macovski A, Spielman DM. Volumetric spectroscopic imaging with spiral-based k-space trajectories. Magn Reson Med 1998;39(6):889–898. [DOI] [PubMed] [Google Scholar]
- 13.Schirda CV, Zhao T, Andronesi OC, et al. In vivo brain rosette spectroscopic imaging (RSI) with LASER excitation, constant gradient strength readout, and automated LCModel quantification for all voxels. Magn Reson Med 2016;76(2):380–390. [DOI] [PMC free article] [PubMed] [Google Scholar]
- 14.Chiew M, Jiang W, Burns B, et al. Density-weighted concentric rings k-space trajectory for (1) H magnetic resonance spectroscopic imaging at 7 T. NMR Biomed 2018;31(1):e3838. [DOI] [PMC free article] [PubMed] [Google Scholar]
- 15.Engel M, Kasper L, Barmet C, et al. Single-shot spiral imaging at 7 T. Magn Reson Med 2018;80(5):1836–1846. [DOI] [PubMed] [Google Scholar]
- 16.Andronesi OC, Gagoski BA, Sorensen AG. Neurologic 3D MR spectroscopic imaging using low power adiabatic pulses and fast spiral acquisition. Radiology 2012;262(2):647–661. [DOI] [PMC free article] [PubMed] [Google Scholar]
- 17.Kim DH, Gu M, Spielman DM. Gradient moment compensated magnetic resonance spectroscopic imaging. Magn Reson Med 2009;61(2): 457–461. [DOI] [PMC free article] [PubMed] [Google Scholar]
- 18.Hiba B, Faure B, Lamalle L, Decorps M, Ziegler A. Out-and-in spiral spectroscopic imaging in rat brain at 7 T. Magn Reson Med 2003;50(6): 1127–1133. [DOI] [PubMed] [Google Scholar]
- 19.Wiggins GC, Wiggins CJ, Potthast A, et al. A 32 channel receive-only head coil and detunable transmit birdcage coil for 7 Tesla brain imaging. Seattle, WA: Proceedings of 14th ISMRM Annual Scientific Meeting; 2006. p 415. [Google Scholar]
- 20.Snaar JE, Teeuwisse WM, Versluis MJ, et al. Improvements in high-field localized MRS of the medial temporal lobe in humans using new deformable high-dielectric materials. NMR Biomed 2011;24(7):873–879. [DOI] [PubMed] [Google Scholar]
- 21.Delattre BM, Heidemann RM, Crowe LA, Vallee JP, Hyacinthe JN. Spiral demystified. Magn Reson Imaging 2010;28(6):862–881. [DOI] [PubMed] [Google Scholar]
- 22.Esmaeili M, Bathen TF, Rosen BR, Andronesi OC. Three-dimensional MR spectroscopic imaging using adiabatic spin echo and hypergeometric dual-band suppression for metabolic mapping over the entire brain. Magn Reson Med 2017;77(2):490–497. [DOI] [PMC free article] [PubMed] [Google Scholar]
- 23.Andronesi OC, Ramadan S, Ratai EM, Jennings D, Mountford CE, Sorensen AG. Spectroscopic imaging with improved gradient modulated constant adiabaticity pulses on high-field clinical scanners. J Magn Reson 2010;203(2):283–293. [DOI] [PMC free article] [PubMed] [Google Scholar]
- 24.Moser P, Hingerl L, Strasser B, et al. Whole-slice mapping of GABA and GABA(+) at 7T via adiabatic MEGA-editing, real-time instability correction, and concentric circle readout. Neuroimage 2019;184:475–489. [DOI] [PMC free article] [PubMed] [Google Scholar]
- 25.Bogner W, Hess AT, Gagoski B, et al. Real-time motion- and B-correction for LASER-localized spiral-accelerated 3D-MRSI of the brain at 3T. Neuroimage 2013;88C:22–31. [DOI] [PMC free article] [PubMed] [Google Scholar]
- 26.Kirchner T, Fillmer A, Henning A. Mechanisms of SNR and line shape improvement by B0 correction in overdiscrete MRSI reconstruction. Magn Reson Med 2017;77(1):44–56. [DOI] [PubMed] [Google Scholar]
- 27.Smith SM, Jenkinson M, Woolrich MW, et al. Advances in functional and structural MR image analysis and implementation as FSL. Neuroimage 2004;23(Suppl 1):S208–S219. [DOI] [PubMed] [Google Scholar]
- 28.Provencher SW. Estimation of metabolite concentrations from localized in vivo proton NMR spectra. Magn Reson Med 1993;30(6):672–679. [DOI] [PubMed] [Google Scholar]
- 29.Hall EL, Stephenson MC, Price D, Morris PG. Methodology for improved detection of low concentration metabolites in MRS: Optimised combination of signals from multi-element coil arrays. Neuroimage 2014;86:35–42. [DOI] [PubMed] [Google Scholar]
- 30.Bagchi S, Mitra SK. The nonuniform discrete Fourier transform and its applications in filter design. I. 1-D. IEEE Trans Circuits Syst II Analog Digital Signal Process 1996;43(6):422–433. [Google Scholar]
- 31.Bilgic B, Gagoski B, Kok T, Adalsteinsson E. Lipid suppression in CSI with spatial priors and highly undersampled peripheral k-space. Magn Reson Med 2013;69(6):1501–1511. [DOI] [PMC free article] [PubMed] [Google Scholar]
- 32.Hoge RD, Kwan RK, Pike GB. Density compensation functions for spiral MRI. Magn Reson Med 1997;38(1):117–128. [DOI] [PubMed] [Google Scholar]
- 33.Smith SA, Levante TO, Meier BH, Ernst RR. Computer-simulations in magnetic-resonance — An object-oriented programming approach. J Magn Reson A 1994;106(1):75–105. [Google Scholar]
- 34.Najac C, Branzoli F, Ronen I, Valette J. Brain intracellular metabolites are freely diffusing along cell fibers in grey and white matter, as measured by diffusion-weighted MR spectroscopy in the human brain at 7 T. Brain Struct Funct 2016;221(3):1245–1254. [DOI] [PMC free article] [PubMed] [Google Scholar]
- 35.Mayer D, Kim DH, Spielman DM, Bammer R. Fast parallel spiral chemical shift imaging at 3T using iterative SENSE reconstruction. Magn Reson Med 2008;59(4):891–897. [DOI] [PMC free article] [PubMed] [Google Scholar]
- 36.Chatnuntawech I, Gagoski B, Bilgic B, Cauley SF, Setsompop K, Adalsteinsson E. Accelerated (1) H MRSI using randomly undersampled spiral-based k-space trajectories. Magn Reson Med 2015;74(1):13–24. [DOI] [PubMed] [Google Scholar]
- 37.Clifford B, Gu Y, Liu Y, et al. High-resolution dynamic (31)P-MR spectroscopic imaging for mapping mitochondrial function. IEEE Trans Biomed Eng 2020;67:2745–2753. [DOI] [PMC free article] [PubMed] [Google Scholar]
- 38.Juchem C, Nixon TW, McIntyre S, Boer VO, Rothman DL, de Graaf RA. Dynamic multi-coil shimming of the human brain at 7 T. J Magn Reson 2011;212(2):280–288. [DOI] [PMC free article] [PubMed] [Google Scholar]
- 39.Pan JW, Lo KM, Hetherington HP. Role of very high order and degree B0 shimming for spectroscopic imaging of the human brain at 7 Tesla. Magn Reson Med 2012;68(4):1007–1017. [DOI] [PMC free article] [PubMed] [Google Scholar]
- 40.Stockmann JP, Wald LL. In vivo B0 field shimming methods for MRI at 7T. Neuroimage 2018;168:71–87. [DOI] [PMC free article] [PubMed] [Google Scholar]
Associated Data
This section collects any data citations, data availability statements, or supplementary materials included in this article.


