Abstract
Background/Aim: Trastuzumab and tamoxifen are two of the most widely prescribed anti-cancer drugs for breast cancer (BC). To date, few studies have explored the impact of anticancer drugs on metabolic pathways in BC. Metabolomics is an emerging technology that can identify new biomarkers for tracking therapy response and novel therapeutic targets. Materials and Methods: We employed ultra-high-performance liquid chromatography-quadrupole time of flight mass spectrometry (UHPLC-QTOF-MS) to investigate changes in MCF-7 and SkBr3 cell lines treated with either tamoxifen, trastuzumab or a combination of both. The Bruker Human Metabolome Database (HMDB) metabolite library was used to match spectra and the MetaboScape software to assign each feature with a putative metabolite name or molecular formula for metabolite annotation. Results: A total of 98 metabolites were found to significantly differ in abundance in MCF-7 and SkBr3 treated cells. Moreover, the metabolic profile of the combination medication is similar to that of tamoxifen alone, according to functional enrichment analysis. Conclusion: Tamoxifen/trastuzumab treatment had a significant effect on pathways essential for the control of energy-production, which have previously been linked to cancer progression, and aggressiveness.
Keywords: Untargeted metabolomics, MCF-7, SkBr3, breast cancer cells, UHPLC-trapped ion TIMS-QTOF, tamoxifen, trastuzumab
Cancer is considered the second leading cause of death after heart disease with the number of cases estimated to grow to over 13.1 million by 2030 (1). Worldwide, breast cancer (BC) is the second leading cause of cancer-related death, after lung cancer, among women (2-5). This cancer type is recognized as a heterogeneous and multifaceted disease with a varied range of pathological, clinical, and molecular characteristics. BC is hormone-responsive and classified into three subtypes based on specific estrogen (E), progesterone (P), and human epidermal growth factor molecular biomarkers. The main hormones involved in the regulation of tumor growth or regression and cellular function are estrogen and progesterone. After malignant transformation, because the mammary glands contain unique receptor sites, the cells may maintain all or some of the normal complement of receptor sites (6-9). With respect to the retained receptor sites, breast tumors are classified as one of the estrogen- or progesterone-positive or -negative receptor (ER-/PR-positive/-negative) subtypes. Experimental breast tumor models demonstrate evidence of PR estrogen regulation, indicating that PR is present in approximately 59% of ER-positive metastatic tumors (10,11). Clinical studies have shown that women with hormone receptor-positive tumors have successfully survived therapy with adjuvant hormone and/or chemotherapy regimens (12,13). Human epidermal growth factor receptor (HER2) is a third molecular target that belongs to the transmembrane receptor tyrosine kinase family. It plays an essential role in the mediation of growth and progression of breast cancer cells (14). Worldwide, approximately 20% of BC overexpress the HER2 receptor and this is associated with proliferation of certain aggressive BC cells. This means that targeted treatment, including anti-HER2 antibodies (such as trastuzumab), either alone or in conjunction with chemotherapy (15-17), helps patients with HER2-amplified breast cancer. Various treatment techniques are used to treat BC, including surgical resection, postoperative radiation, chemotherapy, endocrine therapy and directed antibody therapy. Hormonal therapy is the first and safest option with which to start in the case of hormone receptor-positive-based BC (18). Despite remarkable achievements, 30% of patients will experience relapse with distant metastatic sites in the brain, bone, and lung. This highlights an urgent need to find more effective drug therapies for BC (19,20).
Trastuzumab and tamoxifen are two of the most widely prescribed anti-cancer drugs for BC. These treatments have an impact due to of the variation in their mechanisms of action. Trastuzumab is a humanized version of the 4D5 murine monoclonal antibody whose key mode of action is linked to its ability to directly target and bind to the extracellular HER2 domain and inhibit the HER2 pathway continuously (21,22). In HER2-positive tumors, there is a concomitant up-regulation of the PI3K-Akt survival pathway and of nuclear factor ĸB (NF-ĸB), a potent pro-inflammatory mediator that protects against apoptotic stimuli (23). In addition, HER2 is also controlled by Survivin, a member of the apoptosis inhibitor family for whom up-regulation in human malignancies is associated with chemotherapy resistance. The blockage of HER2 contributes to inhibition of survival pathways, which in turn induces tumor apoptosis (24,25). Other biological activities of HER2 include antibody-dependent cellular cytotoxicity activation, extracellular domain cleavage inhibition, intracellular signaling abrogation, angiogenesis reduction, and reduced deoxyribonucleic acid (DNA) repair, which all together contribute to the stasis and death of tumor cells (26). Tamoxifen, on the other hand, has been reported to exert antiproliferative activity through competitive inhibition of the binding of 17β-estradiol (E2) to ER (27); this anti-estrogen property is believed to be the underlying main mechanism through increased matrix metalloproteinase-9 (MMP-9) activity and endostatin production in breast cancer. Furthermore, a novel mechanism has been demonstrated in which tamoxifen may have an anti-tumor effect on breast cancer by lowering extracellular transforming growth factor-β1 (TGF-β1) released by breast cancer cells, through a post-translational regulation involving matrix metalloproteinase activity. This is an additional method by which tamoxifen operates as an anti-tumor and anti-angiogenic agent in breast cancer (28). Notably, by influencing both tumor cell survival and tumor angiogenesis, TGF-ß1 acts as a tumor promoter (29). To a certain degree, the mechanism of action of these two medications is understood, however in order to fine tune any therapeutic drug treatment and/or suggest an alternative protocol, it is important that we obtain comprehensive molecular signatures of the action and effect of these anti-cancer drugs during the cell’s physiological response.
Metabolomics is an emerging field in biomedical research which enables us to investigate the contents of a biological matrix at the molecular level. Within this context, metabolites are downstream biochemical products in the “omics” cascades, and altered metabolism is often referenced as a hallmark of cancer (30). Indeed, reprogrammed metabolism is a vital component of tumor growth and development. For example, it is well-established that cancer-associated metabolic changes include the Warburg effect and glutamine addiction (31-33). Liquid Chromatography with tandem mass spectrometry (LC-MS/MS) based untargeted metabolomics is an emerging mass spectrometry approach that can measure thousands of metabolites/molecular features in an unbiased manner and reveal precise information regarding metabolic signatures. Such discoveries could play a significant role in elucidating the molecular bases of cancer growth, progression, and treatment outcomes.
Nevertheless, only a few studies have explored in detail the impact of anticancer drugs on breast cancer cell metabolism. In our previous study, we investigated the effect of the anticancer medications tamoxifen and/or paclitaxel on the metabolic profile of two BC cell lines with different hormone levels (MCF-7 and MDA-MB-231), using gas chromatography-mass spectrometry (GC-MS) which showed that the major metabolites effected were related to energy production pathways (34,35). The metabolic profiling of MCF-7 cells treated with tamoxifen, cisplatin, and doxorubicin was investigated previously using proton nuclear magnetic resonance (1H NMR). The NMR results of this investigation showed that the concentration of phosphocholine (breast cancer biomarker) was higher in control cells compared to treated cells, whereas MCF-7 control and treated cells showed equal concentrations of betaine (the main osmolyte in cells), but betaine was absent in non-tumor MCF-10A cells (36).
Herein, our approach is the first to investigate the influence of the anticancer drugs, tamoxifen and/or trastuzumab on the metabolic signature of human breast cancer cell lines (MCF-7 ER-, PR-positive, HER2 negative and SkBr3 ER-, PR-negative, HER2 positive) with different hormonal status (ER, PR and HER2) using TIMS-QTOF MS analysis.
Materials and Methods
Reagents. High purity (>99%) tamoxifen and trastuzumab were purchased from Merck (Darmstadt, Germany). Cell lines (MCF-7 and SkBr3) utilized in this study were provided by the Radiobiology and Experimental Radio Oncology Lab, University Cancer Center Hamburg, Hamburg, Germany. Formic acid (FA) was obtained from Fisher Chemical (Geel, Belgium, UK). Methanol (≥99.9%), acetonitrile and deionized Water, LC-MS CHROMASOLV were purchased from Honeywell (Wunstorfer Strasse, Seelze, Germany).
Cell lines and culture conditions. The two BC cell lines (MCF-7 and SkBr3) utilized in this study were cultured as monolayers in DMEM medium supplemented with 10% fetal bovine serum and 1% penicillin/streptomycin (Sigma Aldrich, St. Louis, MO, USA). All cultures were incubated at 37˚C in a humidified atmosphere of 5% CO2.
Treatment of cells with anticancer drugs. Two million cells (per type) were seeded in 75 cm2 tissue culture flasks and incubated for 24 h. The cells were then treated with tamoxifen (5 μM) and/or trastuzumab (2.5 μM) for 24 h. Control cells were treated with vehicle dimethyl sulfoxide (DMSO at 0.5%) for 24 h. Following incubation, cells as pellets were collected by trypsinization and washed twice with phosphate-buffered saline solution (PBS) before re-suspending in 1 ml PBS for further analysis. Finally, cells were collected as pellets again by centrifugation at 1,200 rpm for 10 min at room temperature. Triplicate flasks were prepared for each treated cell line for each analysis. To negate the effect of circadian rhythms on the response of cells to treatment, cells were kept under the same conditions throughout the incubation period and the cell collection was performed concurrently for all samples.
Sample metabolite extraction. Two million cells per flask were used for each sample to avoid the effect of variable cell numbers. A volume of 1 ml of the extraction solvent (methanol + 0.1% formic acid) was added to each microcentrifuge tube tube containing the cells which quenched cellular metabolic activity. The cells were vortexed for 2 min to ensure the quantitative extraction of metabolites and then stored in ice for 1 h.
After this, the insoluble cell matrices were subjected to intermittent ultrasonication using the COPLEY sonicator or QSONICA SONICATOR (Qsonica, Newtown, CT, USA) under 30% amplifier and for 30 sec with an ice bath employed throughout the process. Following that, cells debris were centrifuged (15,000 rpm, 10 min, 24˚C) to precipitate and separate cell wall and other cellular components except the metabolites and the supernatants containing cellular metabolites were collected and transferred to LC glass vials for drying the solvent in the EZ-2 Plus (GeneVac, Ipswich, UK) at 37±1˚C. Dried samples with the needed metabolites were resuspended with 200 μl (water + 0.1% formic acid), and vortexed for 2 min to be mixed totally. Finally, the samples were filtered for HPLC use using a hydrophilic nylon syringe filter of 0.45 μm pore size and returned to the insert within LC glass vials to be analyzed by Q-TOF MS.
Tandem mass liquid chromatography (Q-TOF MS). The TimsTOF Mass Spectrometer and Elute UHPLC and autosampler (Bruker, Billerica, MA, USA) were employed for separation and detection of the cell metabolites. The system was equipped with trapped quadrupole time-of-flight mass spectrometer, solvent delivery systems pump (Elute UHPLC Pump HPG 1300), autosampler (Elute UHPLC) and thermostat column compartment (Elute UHPLC). Computer operating system was Windows 10 Enterprise 2016 LTSB and the Data Management Software was Bruker Compass HyStar 5.0 SR1 Patch1 (5.0.37.1), Compass 3.1 for otofSeries, otofControl Version 6.0.
Metabolites were analysed in auto MS/MS positive scan mode within the range of 20-1,300 m/z utilizing electrospray ionization (ESI). The ESI source with dry nitrogen gas was 10 l/min and the drying temperature equal to 220˚C. The capillary voltage of the ESI was 4,500 V with 2.2 bar nebulizer pressure. For MS2 acquisition the collision energy was set at 20 eV and end Plate Offset as 500 V. A Hamilton® Intensity Solo 2 C18 column (100 mm × 2.1 mm × 1.8 μm) was utilized for the separation of metabolites and sodium formate was used as calibrant for external calibration step. For metabolite analysis, solvent A (Water + 0.1% FA) and solvent B (Acetonitrile + 0.1% FA) were used in gradient elution mode. The gradient program used a flow rate of 0.250 ml/min with 99A:1.0B from 0.00-2.00 min, 99A:1.0B to 1.0A:99B from 2.00-17.00 min, 1.0A:99B from 17.00-20.00 min, 1.0A:99B to 99A:1.0B from 20.00-20.10 min, flow rate of 0.350 ml/min with 99A:1.0B from 20.10-28.50 min, flow rate of 0.250 ml/min, with 99A:1.0B from 28.50-30 min giving a total run time of 30 min with a maximum pressure of 14993 pounds per square inch (PSI). The autosampler temperature was set at 8˚C and the column oven temperature at 35˚C. A total volume of 10 μl was injected into the QTOF MS.
Data analysis and statistical approach. Data processing. Processing and statistical analysis were performed using MetaboScape® 4.0 software (Bruker Daltonics). Bucketing in T-ReX 2D/3D workflow, the parameters set for molecular feature detection were as follows: minimum intensity threshold equal to 1,000 counts along with minimum peak length of 7 spectra for peak detection, using peak area for feature quantitation. The mass recalibration was done within a retention time range between 0-0.3 min. Only those features present in at least 3 of 12 samples (per cell type) were considered. On the other hand, the MS/MS import method was set to be done by average. The parameters for data bucketing were assigned as follows: Retention time range started at 0.3 min and ended at 25 min, while mass range started at 50 m/z and ended at 1,000 m/z.
The MetaboScape software’s powerful capability is known by creating bucket statistics and box plot with statistics for each metabolite displayed by compound ID of the selected bucket across the analysis included in the current experiment. The bucket statistics allows rapid review of the distribution of metabolite intensities among groups, while the box plot differentiates between groups, showing median and mean values and 25% and 75% quartiles within a separate box for each metabolite. Two-tailed independent students t-test was used to identify significantly altered metabolites for each drug compared to DMSO. Consequently, a volcano plot was constructed showing the statistical significance and fold change for dysregulation of cellular metabolites for each condition. Additionally, a one-way analysis of variance (ANOVA) was used for multiple group comparison and to compare the drugs with investigating their interaction. The threshold for significance was p<0.05. Venn diagrams were generated using (http://bioinformatics.psb.ugent.be/webtools/Venn/). Functional Enrichments were constructed using metaboanalyst (https://www.metaboanalyst.ca).
All data, including the raw QGD files, have been deposited in the Metabolomics Workbench repository (https://www.metabolomicsworkbench.org/) with data ID 2782.
Results
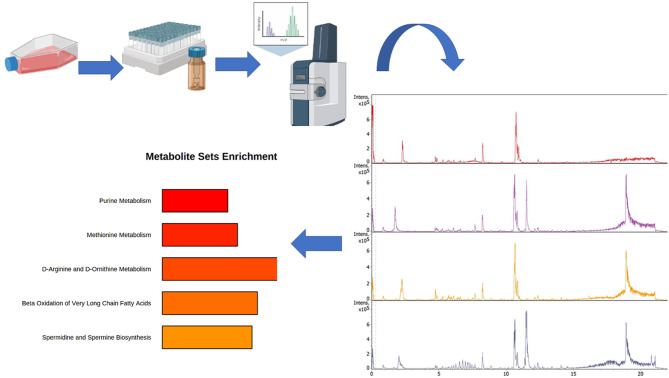
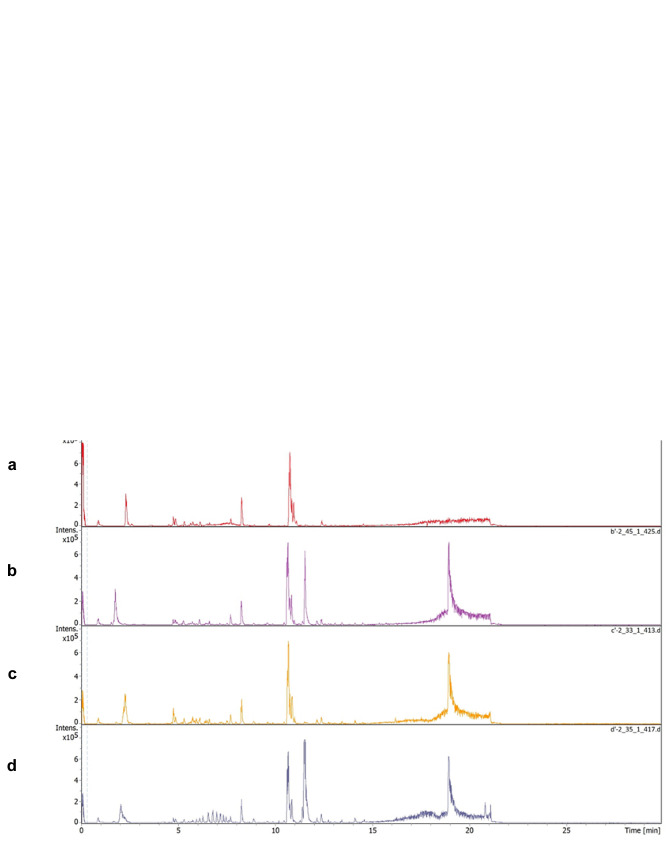
This study investigated the influence of the anticancer drugs, tamoxifen and/or trastuzumab on the metabolic profile of human breast cancer cell lines (MCF-7and SkBr3) with different hormone response statuses (ER, PR and HER2), and this is summarized in Figure 1. The TIMS-QTOF MS base peak chromatogram (BPC) of the detected compounds in the MCF-7 and SkBr3 BC cells are shown in Figure 2A and B, respectively. All the experiments were performed in three biological replicates and each metabolite extract was analysed in duplicate by LC-QTOF MS which generated a dataset of 15,482 features across 24 samples (48 LC-TIMS-QTOF analyses). The parameters set for valid identification were as followed: First, we characterized the unknown compounds obtained from Q-TOF MS by two main characteristics which are MS/MS spectra and retention time (RT), but the MS/MS spectra was the minimum criteria of selection for the next step. Then, for the set of compounds that fulfilled the characteristics and showing either MS/MS alone or MS/MS with RT, we performed annotation using the Human Metabolome Database (HMDB-4.0) spectral library. So that all selected compounds were matched to this library.
Figure 1. The full study process of exploring the influence of the anticancer drugs, tamoxifen and/or trastuzumab on the metabolic signature of human breast cancer cell lines (MCF-7 and SkBr3) with different hormonal status (ER, PR and HER2) using TIMS-QTOF MS analysis.
Figure 2. The TIMS-QTOF MS base peak of the detected compounds in the MCF-7 treated cell and SkBr-3 treated cell with (a) Control. (b) Tamoxifen 5 μM. (c) Trastuzumab 2.5 μM and (d) Tamoxifen 5 μM + trastuzumab 2.5 μm. (A) The TIMS-QTOF MS of MCF-7 cells. (B) The TIMSQTOF MS of SkBr-3 cells.
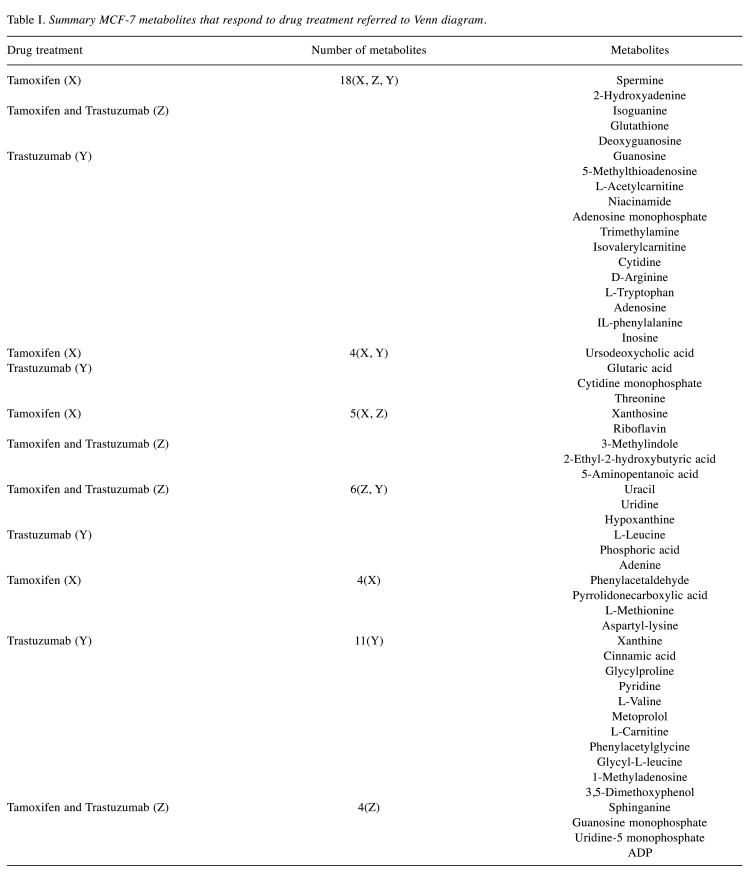
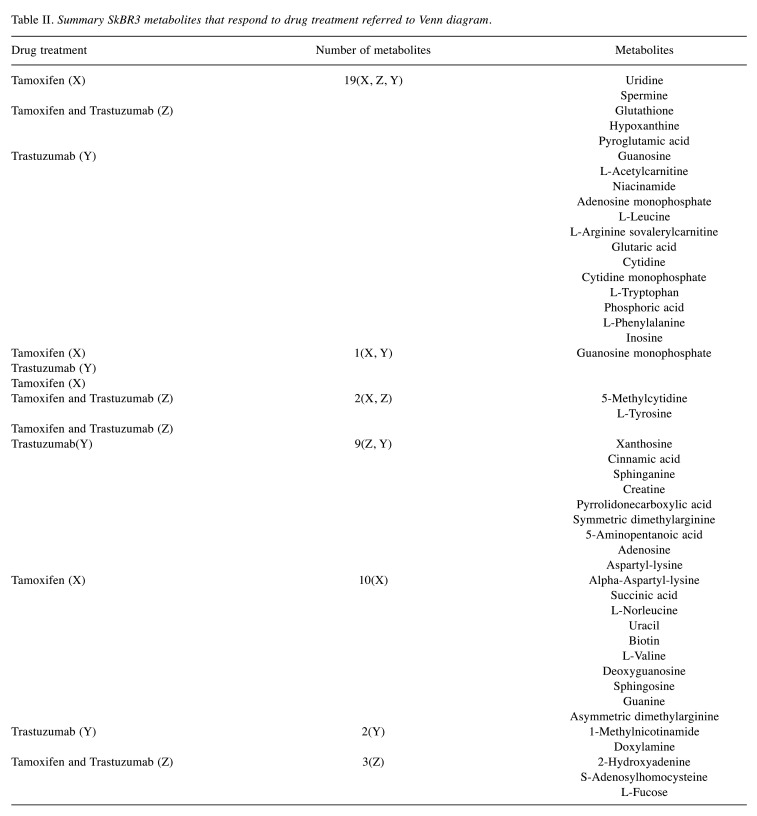
Where multiple features matched to a given database entry, these metabolites were after that filtered by using that entry of each metabolite with the highest annotation quality score (AQ score) among other entries of the same metabolite, i.e., which best fit with the greatest number of factors such as: retention time, MS/MS, m/z values, analyte list and spectral library. Meaning that we chose only one entry of the repeated metabolite having the same ID and name with different p-values by utilizing the above-mentioned factors. This was easily achieved by using the bucket table in MetaboScape software. After filtration, there remained a total of 236 distinct, identified metabolites. Finally, only the compounds registered in the HMDB 4.0 and the significant values with p<0.05 were included in the metabolite datasets, and that generated 52 metabolites in MCF-7 and 46, in SkBr3 cell lines after data mining (Table I and Table II).
Table I. Summary MCF-7 metabolites that respond to drug treatment referred to Venn diagram.
Table II. Summary SkBR3 metabolites that respond to drug treatment referred to Venn diagram.
Using one-way ANOVA, we observed a significant difference between the metabolic profiles of treated MCF-7 and SkBr3 BC cells compared to untreated cells. Additionally, we explored the impact of the drug treatment on individual metabolites using both Student’s t-test and one-way ANOVA in MCF-7 and SkBr3 BC cells.
Our results indicate that different drug treatments had a different impact on the metabolic profile of both MCF-7 and SkBr3. The differences arise from the fact that each cell line exhibits distinct pathological and clinical features as they possess different hormonal statuses and receptor types for drug targets (37,38). MCF-7 cells are known to express high levels of estrogen receptors and are reliant on estrogens for their growth. In contrast, SkBr3 cells are estrogen-independent and estrogen receptors are not expressed (39). Moreover, MCF-7 cell lines represent luminal-like BC and SkBr3 cell lines represent basal-like BC.
Discussion
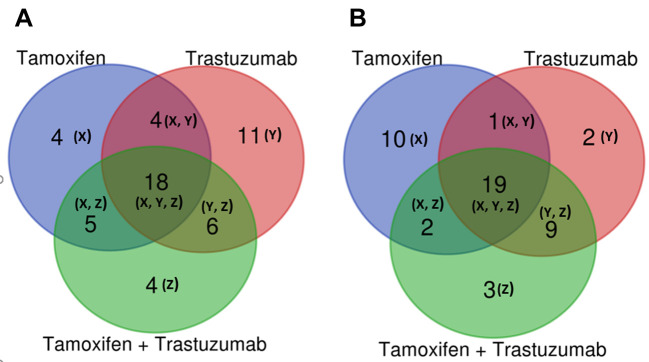
Drug treatment effects on MCF-7 cell lines. Our statistical analysis indicated that in MCF-7 a total of 52 metabolites were significantly different from control cells (Table I). Herein we highlight the overlapping of 18 metabolites that were differentially abundant upon treatment with tamoxifen and/or trastuzumab (Figure 3A). Interestingly, treatment of MCF-7 cells with tamoxifen and/or trastuzumab was found to significantly affect metabolites, such as 2-hydroxyadenine, 5-methylthioadenosine, glutathione, deoxyguanosine, guanosine, niacinamide, adenosine monophosphate, trimethylamine, L-tryptophan (Table I).
Figure 3. Venn diagrams comparing the drug responsive metabolites identified in MCF7 and SKBr3 cells treated with tamoxifen 5 μM, trastuzumab 2.5 μM and tamoxifen 5 μM + trastuzumab 2.5 μM. (A) Venn diagrams in MCF7 cells. (B) Venn diagrams in SKBr3 cells.
Indoleamine (2,3)-dioxygenase (IDO) is an extrahepatic enzyme that is over-expressed in many cancers as a strategy for immune escape, a critical aspect of cancer development and progression. This leads to alteration in tryptophan metabolism due to IDO activity, which is linked to cancer proliferation (40). IDO catalyzes the initial, rate-limiting step of tryptophan catabolism through degradation of tryptophan into kynurenine (KYN), leaving less tryptophan available for other metabolic processes (41,42). The significant up-regulation of L-tryptophan caused by the treatment of MCF-7 cells specifically may highlight a potential change in tryptophan catabolism and the tryptophan-kynurenine pathway. It is also notable that there was a subgroup of four metabolites that were exclusively dysregulated upon combined-drug treatment (i.e., sphinganine, guanosine monophosphate, uridine-5 monophosphate, adenosine diphosphate) (Figure 3A and Table I).
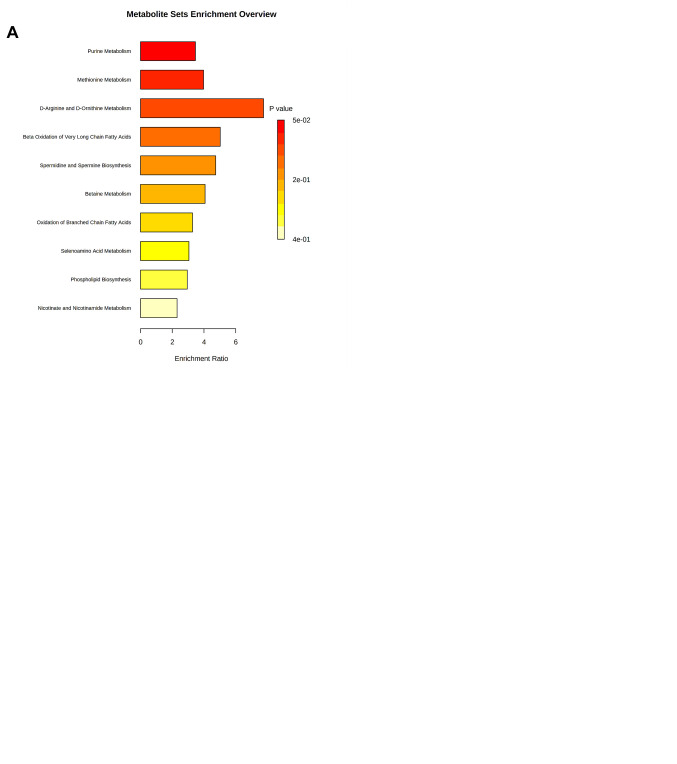
According to functional enrichment analysis of drug treatment responsive metabolites in the MCF-7 cell line, tamoxifen had a substantial effect on several amino acids like methionine, D-arginine and D-ornithine as well as purines and the metabolism of multiple types of fatty acids (Figure 4A). In addition, our study indicated that trastuzumab therapy had a major impact on β-oxidation of short, long and very long chain fatty acids, pantothenate, cardiolipin and coenzyme A (Co-A) biosynthesis, and metabolism of purine, thiamine and phenylacetate (Figure 4B). On the other hand, exploring the proposed therapeutic effect of trastuzumab and tamoxifen as a combination treatment revealed that metabolism of pyrimidine, tyrosine, purine, fatty acids, selenoamino acid, nicotine and nicotinamide, sphingolipid, and thiamine were all significantly influenced, similarly to that seen in the effects of separate tamoxifen and trastuzumab treatment (Figure 4C). In addition to the effect on certain pathways including pyrimidine, purines and β-oxidation of very long chain fatty acids, drug combination treatment had a significant impact on trehalose degradation, lactose synthesis and degradation and nucleotide, sugar, and sphingolipid metabolism (Figure 4C).
Figure 4. Metabolomic set enrichment analysis showing the most altered functional metabolism MCF7 cells after treatment with (A) Tamoxifen 5 μM. (B) Trastuzumab 2.5 μM. (C) Tamoxifen 5 μM and trastuzumab 2.5 μM.
Drug treatment effects on SkBr3 cell line. Our statistical analysis also established that the SkBr3 metabolome was altered by treatment with tamoxifen and/or trastuzumab with 46 metabolites found to be significantly different from the control cells (Table II). We noticed that several metabolites were inversely changed with different drug treatments. For example, isovalerylcarnitine decreased with tamoxifen and tamoxifen + trastuzumab combination treatment, however, it was increased upon trastuzumab treatment (Table II). Contradictorily, a few metabolites’ direction of change was consistent when treated with different drugs, such as cytidine which increased with all drug treatments, and guanosine was consistently decreased. Furthermore, when SkBr3 cells were treated with tamoxifen and/or trastuzumab, the levels of 15 metabolites were significantly altered (Figure 3B) including spermine, uridine, glutathione, hypoxanthine, pyroglutamic acid, guanosine, adenosine monophosphate, niacinamide, L-arginine, cytidine, cytidine monophosphate, adenosine and inosine (Table II).
It is noteworthy that the levels of 1-methylnicotinamide and doxylamine changed only when cells were treated with trastuzumab (Table II). Moreover, ten metabolites showed changed abundance uniquely when treated with tamoxifen alone and these included biotin, methylmalonic acid, isoguanine, sphingosine, L-valine, threonine, guanosine monophosphate and uracil (Table II and Figure 3B). There was a group of 4 metabolites that was exclusively altered as a result of the proposed combination therapy and included 2-hydroxyadenine, S-adenosylhomocysteine, L-fucose and L-tyrosine (Figure 3B and Table II). Specifically, the regulation of spermine, a natural amino acid involved in a variety of roles in cell growth and differentiation (including DNA synthesis and stability, and transcription regulation) was altered when SkBr-3 cells were treated with tamoxifen and/or trastuzumab (43).
Polyamines are produced at higher levels in cancer cells compared to normal cells due to enhanced biosynthesis. For example, in a number of tumors including breast cancer, ornithine decarboxylase (ODC), a central rate-limiting enzyme in the polyamine synthetic pathway, is usually over-expressed (44,45). This leads to alteration in spermine levels due to ODC activity. The significantly lower levels of spermine in SkBr3 cells after the combined treatment may highlight a potential change in spermine production and uptake via the polyamine transporter and ODC inhibition (46,47).
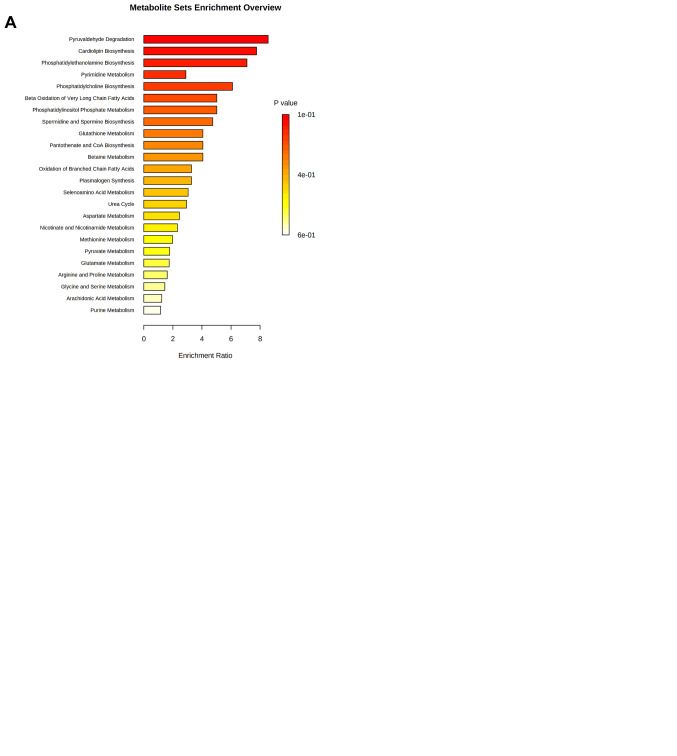
According to the functional enrichment analysis of the significantly dysregulated metabolites in SkBr3 cell line, tamoxifen showed a very strong impact on pyruvaldehyde degradation, cardiolipin biosynthesis, phosphatidyletha-nolamine biosynthesis, pyrimidine metabolism, phosphatidylcholine biosynthesis, β-oxidation of long chain fatty acid, phosphatidylinositol phosphate metabolism and glutathione biosynthesis (Figure 5A). On the other hand, trastuzumab had a significant effect on other metabolic pathways including the metabolism of purine and amino acids such as arginine, proline, glycine, serine and phospholipid biosynthesis (Figure 5B). Like tamoxifen, trastuzumab was found to have an impact on spermidine and spermine biosynthesis, betaine, selenoamino acid, aspartate and methionine metabolism and the urea cycle (Figure 5A and B).
Figure 5. Metabolomic set enrichment analysis showing the most altered functional metabolism SkBr3 cells after treatment with (A) Tamoxifen 5 μM. (B) Trastuzumab 2.5 μM. (C) Tamoxifen 5 μM and Trastuzumab 2.5 μM.
Moreover, the functional analysis of combined drug treatment revealed a substantial effect on purine, phenylalanine, tyrosine, arginine, proline, glycine, serine, nicotine, nicoti-namide, methionine, and glutathione metabolism, and phosphatidylcholine biosynthesis. The combined drug treatment also uniquely effected catecholamine, methylhistidine, and ubiquinone biosynthesis (Figure 5C).
The functional enrichment analysis of metabolites of SkBr3 cells showed treatment with tamoxifen and, to a lesser extent, the combined therapy, effected several metabolites associated with “pyruvaldehyde degradation” and “cardiolipin biosynthesis” pathways. It is worth mentioning that pyruvaldehyde is a powerful glycating agent produced as a side product during glycolysis. It is highly reactive and induces the formation of advanced glycation end-products that are implicated in several pathologies, including cancer and cellular damage. In cancer, cells rely on glycolysis as a primary source of energy under aerobic conditions (31,48). Dysregulation of cardiolipin metabolism, including biosynthesis, impairs proper mitochondrial function as it is one of the essential mitochondrial phospholipids (49). Cardiolipin is involved in many mitochondrial functions, including bioenergetics, dynamics, mitophagy, and apoptosis, all of which are involved in key stages of aggressive cancer progression (e.g., migration/invasion and treatment resistance) (50).
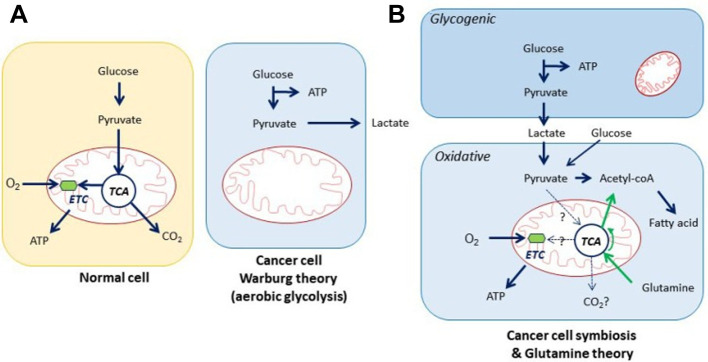
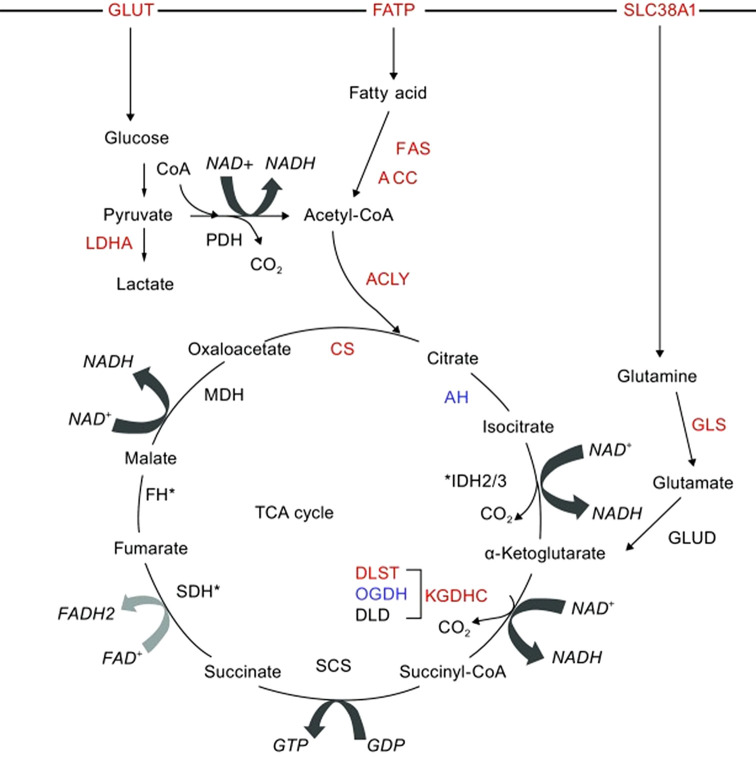
Given that tumor cells have a much higher demand for adenosine triphosphate (ATP) than healthy cells, the results of our functional enrichment study for metabolites are consistent with the observation that pathways such as fatty acid metabolism, glycerol metabolism, cancer cell symbiosis and glutamine theory (Figure 6), amino acid metabolism, the urea cycle, ammonia recycling, glycolysis, and gluconeogenesis, are known to be deregulated in tumor cells and this was seen in both cell lines. In fact, cancer cells uncouple glycolysis from the tricarboxylic acid cycle (TCA cycle), allowing the use of additional fuel sources such as glutamine and fatty acids to meet their increased metabolic demands (Figure 7) (51,52). Through various biochemical reactions, this cycle produces intermediates which are used as building blocks for the synthesis of macromolecules, as well as energy and electron acceptors which are consumed in cellular processes such as the electron transport chain, which was deregulated in our study (Figure 4C).
Figure 6. Cancer cell symbiosis and glutamine theory; two theories of cancer metabolism. First theory deposit that cancer cells elaborate survival through glycogenic step which happen by producing lactate via consuming glucose (Warburg effect), and the neighbor cancer cell consumes the secreted lactate to produce ATP through the TCA cycle and oxidative phosphorylation which is known by oxidative step. Glutamine theory includes the conversion of glutamine into glutamate by glutamine synthetase 1, which is further metabolized to α-ketoglutarate by glutamate dehydrogenase and consumed for ATP synthesis through TCA cycle under oxidative condition (54).
Figure 7. Emerging role of TCA cycle in breast cancer metabolism and fuels driving the TCA cycle (53).
Tumors acquire additional glucose, the most common fuel source in mammalian cells, by regulating high affinity glucose transporters. Under hypoxic conditions, glycolysis converts one molecule of glucose into two pyruvate molecules, which in turn are converted to lactate (53,54) (see pyruvate metabolism in Figure 5). In addition to glucose, cancer cells are dependent on glutamine and fatty acids for the replenishment of TCA cycle intermediates. It is important to note that glutamine is now considered an important source of nutrients especially for MYC-induced cancers such as breast cancer – and may promote the TCA cycle after being converted to acetyl-CoA or α-keto acid intermediates.
Due to the excessive conversion of glucose to lactate, tumor cells utilize anaplerotic responses to replenish TCA cycle intermediates, and this is largely achieved through increased glutaminolysis (55). Glutaminolysis converts glutamine to glutamate, a known co-substrate for those transaminases that form alanine and aspartate, respectively (56). Functional enrichment identified glutamate metabolism as an enriched term among deregulated metabolites, as shown in Figure 5A and C.
The third type of fuel source in cancer cells is fatty acids, which enter the TCA cycle after undergoing ß-oxidation to generate acetyl-CoA. Acetyl-CoA is the major substrate for both the fatty acid synthesis pathway and the TCA cycle (53). Mitochondrial ß-oxidation of long and short chain fatty acids to generate acetyl-CoA, in addition to ß-oxidation of very short and very long fatty acids after acetyl-CoA formation, were found to be among those metabolic pathways deregulated in our study (Figure 4A, B, C and Figure 5A and C).
Based on the functional enrichment analysis, our findings showed that tamoxifen and/or trastuzumab treatments had a significant effect on those energy production pathways mentioned above which are essential for the control of energy production and have been linked to cancer development, progression, and aggressiveness. Furthermore, the metabolism of amino acids in cancer cells is known to be impaired, as cancer cells depend on amino acids to sustain their proliferation by protein anabolism. In addition to their potential roles in energy generation, amino acids are needed for cellular redox homoeostasis and nucleoside synthesis, both of which are known to be disrupted in cancer (47,57).
Conclusion
Our findings showed that anti-cancer drug treatment had an important effect on the main metabolic pathways in the investigated cell lines (MCF-7 and SkBr3). These results are critical in determining the molecular basis of cancer development and progression, and impact translational cancer research by discovering new candidate biomarkers for tracking treatment response and following therapy progression among BC patients clinically, then developing more effective, tailored anticancer therapy accordingly. Moreover, the newly identified markers might also be new therapeutic targets and allow the development of new therapies for triple positive and triple negative BC patients.
The top enriched classes of metabolites, using mass spectroscopy were linked to energy production metabolic pathways such as glycolysis, gluconeogenesis, pyruvaldehyde degradation and cardiolipin, cholesterol and fatty acid metabolism. This may show how these energy processing pathways were disrupted to accelerate cancer progression and metastasis. However, protein-level research is recommended to better understand the signaling pathways and molecular mechanisms involved in drug action. This approach will eventually lead to predictive molecular markers that may serve as a prognostic tool to indicate how successful treatments are in different types of breast cancers (58).
Conflicts of Interest
The Authors declare no conflicts of interest in relation to this study.
Authors’ Contributions
Supervision of the study: MHS and NCS. Conception and design of the study: MHS, NCS, AA and BMS. Preparation of cancer cells: REA and his group. Collection, analysis and interpretation of data: MM, HMA, BMS, MHS and NCS. Drafting the article and revising it critically: BMS, ADG, HA, AA, HMA, NCS and MHS. All Authors reviewed and approved the manuscript.
Acknowledgements
Special thanks to the University of Sharjah for the financial support, competitive grant numbers 1901110133 and 2001110138; UoS-Skoltech Artificial Intelligence for Life grant:” Computational models applied to multi-omics data for assessing treatment response in breast cancer patients”. Also, we thank professor J. L. Capelo, NOVA University of Lisbon, for his valuable comments on this manuscript. This research is part of the -Human Disease Biomarkers Discovery Research Group- study.
References
- 1.Schmidt K, Podmore I. Current challenges in volatile organic compounds analysis as potential biomarkers of cancer. J Biomark. 2015;2015:981458. doi: 10.1155/2015/981458. [DOI] [PMC free article] [PubMed] [Google Scholar]
- 2.DeSantis C, Ma J, Bryan L, Jemal A. Breast cancer statistics, 2013. CA Cancer J Clin. 2014;64(1):52–62. doi: 10.3322/caac.21203. [DOI] [PubMed] [Google Scholar]
- 3.Derks MGM, Bastiaannet E, van de Water W, de Glas NA, Seynaeve C, Putter H, Nortier JWR, Rea D, Hasenburg A, Markopoulos C, Dirix LY, Portielje JEA, van de Velde CJH, Liefers GJ. Impact of age on breast cancer mortality and competing causes of death at 10 years follow-up in the adjuvant TEAM trial. Eur J Cancer. 2018;99:1–8. doi: 10.1016/j.ejca.2018.04.009. [DOI] [PubMed] [Google Scholar]
- 4.Bray F, Ferlay J, Soerjomataram I, Siegel RL, Torre LA, Jemal A. Global cancer statistics 2018: GLOBOCAN estimates of incidence and mortality worldwide for 36 cancers in 185 countries. CA Cancer J Clin. 2018;68(6):394–424. doi: 10.3322/caac.21492. [DOI] [PubMed] [Google Scholar]
- 5.Carioli G, Malvezzi M, Rodriguez T, Bertuccio P, Negri E, La Vecchia C. Trends and predictions to 2020 in breast cancer mortality: Americas and Australasia. Breast. 2018;37:163–169. doi: 10.1016/j.breast.2017.12.004. [DOI] [PubMed] [Google Scholar]
- 6.Parise CA, Bauer KR, Brown MM, Caggiano V. Breast cancer subtypes as defined by the estrogen receptor (ER), progesterone receptor (PR), and the human epidermal growth factor receptor 2 (HER2) among women with invasive breast cancer in California, 1999-2004. Breast J. 2009;15(6):593–602. doi: 10.1111/j.1524-4741.2009.00822.x. [DOI] [PubMed] [Google Scholar]
- 7.Onitilo AA, Engel JM, Greenlee RT, Mukesh BN. Breast cancer subtypes based on ER/PR and Her2 expression: comparison of clinicopathologic features and survival. Clin Med Res. 2009;7(1-2):4–13. doi: 10.3121/cmr.2009.825. [DOI] [PMC free article] [PubMed] [Google Scholar]
- 8.Carey LA, Perou CM, Livasy CA, Dressler LG, Cowan D, Conway K, Karaca G, Troester MA, Tse CK, Edmiston S, Deming SL, Geradts J, Cheang MC, Nielsen TO, Moorman PG, Earp HS, Millikan RC. Race, breast cancer subtypes, and survival in the Carolina Breast Cancer Study. JAMA. 2006;295(21):2492–2502. doi: 10.1001/jama.295.21.2492. [DOI] [PubMed] [Google Scholar]
- 9.Obeidat F, Ahram M, Al Khader A, Battah K, Alchalabi M, Melhem JM, Suleiman A. Clinical and histopathological features of breast cancer in Jordan: Experience from a tertiary care hospital. J Pak Med Assoc. 2017;67(8):1206–1212. [PubMed] [Google Scholar]
- 10.O’Brien KM, Cole SR, Tse CK, Perou CM, Carey LA, Foulkes WD, Dressler LG, Geradts J, Millikan RC. Intrinsic breast tumor subtypes, race, and long-term survival in the Carolina Breast Cancer Study. Clin Cancer Res. 2010;16(24):6100–6110. doi: 10.1158/1078-0432.CCR-10-1533. [DOI] [PMC free article] [PubMed] [Google Scholar]
- 11.Dunnwald LK, Rossing MA, Li CI. Hormone receptor status, tumor characteristics, and prognosis: a prospective cohort of breast cancer patients. Breast Cancer Res. 2007;9(1):R6. doi: 10.1186/bcr1639. [DOI] [PMC free article] [PubMed] [Google Scholar]
- 12.Fisher B, Jeong JH, Bryant J, Anderson S, Dignam J, Fisher ER, Wolmark N, National Surgical Adjuvant Breast and Bowel Project randomised clinical trials Treatment of lymph-node-negative, oestrogen-receptor-positive breast cancer: long-term findings from National Surgical Adjuvant Breast and Bowel Project randomised clinical trials. Lancet. 2004;364(9437):858–868. doi: 10.1016/S0140-6736(04)16981-X. [DOI] [PubMed] [Google Scholar]
- 13.Bardou VJ, Arpino G, Elledge RM, Osborne CK, Clark GM. Progesterone receptor status significantly improves outcome prediction over estrogen receptor status alone for adjuvant endocrine therapy in two large breast cancer databases. J Clin Oncol. 2003;21(10):1973–1979. doi: 10.1200/JCO.2003.09.099. [DOI] [PubMed] [Google Scholar]
- 14.Gschwind A, Fischer OM, Ullrich A. The discovery of receptor tyrosine kinases: targets for cancer therapy. Nat Rev Cancer. 2004;4(5):361–370. doi: 10.1038/nrc1360. [DOI] [PubMed] [Google Scholar]
- 15.Wang J, Xu B. Targeted therapeutic options and future perspectives for HER2-positive breast cancer. Signal Transduct Target Ther. 2019;4:34. doi: 10.1038/s41392-019-0069-2. [DOI] [PMC free article] [PubMed] [Google Scholar]
- 16.Arteaga CL, Sliwkowski MX, Osborne CK, Perez EA, Puglisi F, Gianni L. Treatment of HER2-positive breast cancer: current status and future perspectives. Nat Rev Clin Oncol. 2011;9(1):16–32. doi: 10.1038/nrclinonc.2011.177. [DOI] [PubMed] [Google Scholar]
- 17.Hayes DF. HER2 and breast cancer – a phenomenal success story. N Engl J Med. 2019;381(13):1284–1286. doi: 10.1056/NEJMcibr1909386. [DOI] [PubMed] [Google Scholar]
- 18.Chavez-MacGregor M, Mittendorf EA, Clarke CA, Lichtensztajn DY, Hunt KK, Giordano SH. Incorporating tumor characteristics to the American Joint Committee on Cancer breast cancer staging system. Oncologist. 2017;22(11):1292–1300. doi: 10.1634/theoncologist.2017-0116. [DOI] [PMC free article] [PubMed] [Google Scholar]
- 19.Kang Y, Siegel PM, Shu W, Drobnjak M, Kakonen SM, Cordón-Cardo C, Guise TA, Massagué J. A multigenic program mediating breast cancer metastasis to bone. Cancer Cell. 2003;3(6):537–549. doi: 10.1016/s1535-6108(03)00132-6. [DOI] [PubMed] [Google Scholar]
- 20.Minn AJ, Gupta GP, Padua D, Bos P, Nguyen DX, Nuyten D, Kreike B, Zhang Y, Wang Y, Ishwaran H, Foekens JA, van de Vijver M, Massagué J. Lung metastasis genes couple breast tumor size and metastatic spread. Proc Natl Acad Sci USA. 2007;104(16):6740–6745. doi: 10.1073/pnas.0701138104. [DOI] [PMC free article] [PubMed] [Google Scholar]
- 21.Ropero S, Menéndez JA, Vázquez-Martín A, Montero S, Cortés-Funes H, Colomer R. Trastuzumab plus tamoxifen: anti-proliferative and molecular interactions in breast carcinoma. Breast Cancer Res Treat. 2004;86(2):125–137. doi: 10.1023/b:brea.0000032981.20384.c6. [DOI] [PubMed] [Google Scholar]
- 22.Baselga J, Norton L, Albanell J, Kim YM, Mendelsohn J. Recombinant humanized anti-HER2 antibody (Herceptin) enhances the antitumor activity of paclitaxel and doxorubicin against HER2/neu overexpressing human breast cancer xenografts. Cancer Res. 1998;58(13):2825–2831. [PubMed] [Google Scholar]
- 23.Bacus SS, Altomare DA, Lyass L, Chin DM, Farrell MP, Gurova K, Gudkov A, Testa JR. AKT2 is frequently upregulated in HER-2/neu-positive breast cancers and may contribute to tumor aggressiveness by enhancing cell survival. Oncogene. 2002;21(22):3532–3540. doi: 10.1038/sj.onc.1205438. [DOI] [PubMed] [Google Scholar]
- 24.Yakes FM, Chinratanalab W, Ritter CA, King W, Seelig S, Arteaga CL. Herceptin-induced inhibition of phosphatidylinositol-3 kinase and Akt Is required for antibody-mediated effects on p27, cyclin D1, and antitumor action. Cancer Res. 2002;62(14):4132–4141. [PubMed] [Google Scholar]
- 25.Xia W, Bisi J, Strum J, Liu L, Carrick K, Graham KM, Treece AL, Hardwicke MA, Dush M, Liao Q, Westlund RE, Zhao S, Bacus S, Spector NL. Regulation of survivin by ErbB2 signaling: therapeutic implications for ErbB2-overexpressing breast cancers. Cancer Res. 2006;66(3):1640–1647. doi: 10.1158/0008-5472.CAN-05-2000. [DOI] [PubMed] [Google Scholar]
- 26.Spector NL, Blackwell KL. Understanding the mechanisms behind trastuzumab therapy for human epidermal growth factor receptor 2-positive breast cancer. J Clin Oncol. 2009;27(34):5838–5847. doi: 10.1200/JCO.2009.22.1507. [DOI] [PubMed] [Google Scholar]
- 27.Yu FL, Bender W. A proposed mechanism of tamoxifen in breast cancer prevention. Cancer Detect Prev. 2002;26(5):370–375. doi: 10.1016/s0361-090x(02)00124-1. [DOI] [PubMed] [Google Scholar]
- 28.Nilsson UW, Jönsson JA, Dabrosin C. Tamoxifen decreases extracellular TGF-beta1 secreted from breast cancer cells—a post-translational regulation involving matrix metalloproteinase activity. Exp Cell Res. 2009;315(1):1–9. doi: 10.1016/j.yexcr.2008.10.015. [DOI] [PubMed] [Google Scholar]
- 29.Yu Q, Stamenkovic I. Transforming growth factor-beta facilitates breast carcinoma metastasis by promoting tumor cell survival. Clin Exp Metastasis. 2004;21(3):235–242. doi: 10.1023/b:clin.0000037705.25256.d3. [DOI] [PubMed] [Google Scholar]
- 30.Hanahan D, Weinberg RA. Hallmarks of cancer: the next generation. Cell. 2011;144(5):646–674. doi: 10.1016/j.cell.2011.02.013. [DOI] [PubMed] [Google Scholar]
- 31.Vander Heiden MG, Cantley LC, Thompson CB. Understanding the Warburg effect: the metabolic requirements of cell proliferation. Science. 2009;324(5930):1029–1033. doi: 10.1126/science.1160809. [DOI] [PMC free article] [PubMed] [Google Scholar]
- 32.Wise DR, Thompson CB. Glutamine addiction: a new therapeutic target in cancer. Trends Biochem Sci. 2010;35(8):427–433. doi: 10.1016/j.tibs.2010.05.003. [DOI] [PMC free article] [PubMed] [Google Scholar]
- 33.Wang YP, Lei QY. Perspectives of reprogramming breast cancer metabolism. Adv Exp Med Biol. 2017;1026:217–232. doi: 10.1007/978-981-10-6020-5_10. [DOI] [PubMed] [Google Scholar]
- 34.Semreen MH, Alniss H, Cacciatore S, El-Awady R, Mousa M, Almehdi AM, El-Huneidi W, Zerbini L, Soares NC. GC-MS based comparative metabolomic analysis of MCF-7 and MDA-MB-231 cancer cells treated with Tamoxifen and/or Paclitaxel. J Proteomics. 2020;225:103875. doi: 10.1016/j.jprot.2020.103875. [DOI] [PubMed] [Google Scholar]
- 35.Semreen MH, Alniss HY, Grgic SR, El-Awady RA, Almehdi AH, Mousa MK, Hamoudi RA. Comparative metabolomics of MCF-7 breast cancer cells using different extraction solvents assessed by mass spectroscopy. Sci Rep. 2019;9(1):13126. doi: 10.1038/s41598-019-49509-y. [DOI] [PMC free article] [PubMed] [Google Scholar]
- 36.Lefort N, Brown A, Lloyd V, Ouellette R, Touaibia M, Culf AS, Cuperlovic-Culf M. 1H NMR metabolomics analysis of the effect of dichloroacetate and allopurinol on breast cancers. J Pharm Biomed Anal. 2014;93:77–85. doi: 10.1016/j.jpba.2013.08.017. [DOI] [PubMed] [Google Scholar]
- 37.Ibrahim E, Al-Gahmi AM, Zeenelin AA, Zekri JM, Elkhodary TR, Gaballa HE, Fawzy EE, El sayed ME, Alzahrani MS. Basal vs. luminal A breast cancer subtypes: a matched case-control study using estrogen receptor, progesterone receptor, and HER-2 as surrogate markers. Med Oncol. 2009;26(3):372–378. doi: 10.1007/s12032-008-9131-6. [DOI] [PubMed] [Google Scholar]
- 38.Rouzier R, Perou CM, Symmans WF, Ibrahim N, Cristofanilli M, Anderson K, Hess KR, Stec J, Ayers M, Wagner P, Morandi P, Fan C, Rabiul I, Ross JS, Hortobagyi GN, Pusztai L. Breast cancer molecular subtypes respond differently to preoperative chemotherapy. Clin Cancer Res. 2005;11(16):5678–5685. doi: 10.1158/1078-0432.CCR-04-2421. [DOI] [PubMed] [Google Scholar]
- 39.Thompson EW, Reich R, Shima TB, Albini A, Graf J, Martin GR, Dickson RB, Lippman ME. Differential regulation of growth and invasiveness of MCF-7 breast cancer cells by antiestrogens. Cancer Res. 1988;48(23):6764–6768. [PubMed] [Google Scholar]
- 40.Muller AJ, DuHadaway JB, Donover PS, Sutanto-Ward E, Prendergast GC. Inhibition of indoleamine 2,3-dioxygenase, an immunoregulatory target of the cancer suppression gene Bin1, potentiates cancer chemotherapy. Nat Med. 2005;11(3):312–319. doi: 10.1038/nm1196. [DOI] [PubMed] [Google Scholar]
- 41.Uyttenhove C, Pilotte L, Théate I, Stroobant V, Colau D, Parmentier N, Boon T, Van den Eynde BJ. Evidence for a tumoral immune resistance mechanism based on tryptophan degradation by indoleamine 2,3-dioxygenase. Nat Med. 2003;9(10):1269–1274. doi: 10.1038/nm934. [DOI] [PubMed] [Google Scholar]
- 42.Lyon DE, Walter JM, Starkweather AR, Schubert CM, McCain NL. Tryptophan degradation in women with breast cancer: a pilot study. BMC Res Notes. 2011;4:156. doi: 10.1186/1756-0500-4-156. [DOI] [PMC free article] [PubMed] [Google Scholar]
- 43.Childs AC, Mehta DJ, Gerner EW. Polyamine-dependent gene expression. Cell Mol Life Sci. 2003;60(7):1394–1406. doi: 10.1007/s00018-003-2332-4. [DOI] [PMC free article] [PubMed] [Google Scholar]
- 44.Kahana C. Regulation of cellular polyamine levels and cellular proliferation by antizyme and antizyme inhibitor. Essays Biochem. 2009;46:47–61. doi: 10.1042/bse0460004. [DOI] [PubMed] [Google Scholar]
- 45.Elmets CA, Athar M. Targeting ornithine decarboxylase for the prevention of nonmelanoma skin cancer in humans. Cancer Prev Res (Phila) 2010;3(1):8–11. doi: 10.1158/1940-6207.CAPR-09-0248. [DOI] [PMC free article] [PubMed] [Google Scholar]
- 46.Soda K. The mechanisms by which polyamines accelerate tumor spread. J Exp Clin Cancer Res. 2011;30:95. doi: 10.1186/1756-9966-30-95. [DOI] [PMC free article] [PubMed] [Google Scholar]
- 47.Vettore L, Westbrook RL, Tennant DA. New aspects of amino acid metabolism in cancer. Br J Cancer. 2020;122(2):150–156. doi: 10.1038/s41416-019-0620-5. [DOI] [PMC free article] [PubMed] [Google Scholar]
- 48.Anwar S, Mohammad T, Shamsi A, Queen A, Parveen S, Luqman S, Hasan GM, Alamry KA, Azum N, Asiri AM, Hassan MI. Discovery of hordenine as a potential inhibitor of pyruvate dehydrogenase kinase 3: Implication in lung cancer therapy. Biomedicines. 2020;8(5):119. doi: 10.3390/biomedicines8050119. [DOI] [PMC free article] [PubMed] [Google Scholar]
- 49.Ahmadpour ST, Mahéo K, Servais S, Brisson L, Dumas JF. Cardiolipin, the mitochondrial signature lipid: implication in cancer. Int J Mol Sci. 2020;21(21):8031. doi: 10.3390/ijms21218031. [DOI] [PMC free article] [PubMed] [Google Scholar]
- 50.Horvath SE, Daum G. Lipids of mitochondria. Prog Lipid Res. 2013;52(4):590–614. doi: 10.1016/j.plipres.2013.07.002. [DOI] [PubMed] [Google Scholar]
- 51.Chen JQ, Russo J. Dysregulation of glucose transport, glycolysis, TCA cycle and glutaminolysis by oncogenes and tumor suppressors in cancer cells. Biochim Biophys Acta. 2012;1826(2):370–384. doi: 10.1016/j.bbcan.2012.06.004. [DOI] [PubMed] [Google Scholar]
- 52.Pavlova NN, Thompson CB. The emerging hallmarks of cancer metabolism. Cell Metab. 2016;23(1):27–47. doi: 10.1016/j.cmet.2015.12.006. [DOI] [PMC free article] [PubMed] [Google Scholar]
- 53.Anderson NM, Mucka P, Kern JG, Feng H. The emerging role and targetability of the TCA cycle in cancer metabolism. Protein Cell. 2018;9(2):216–237. doi: 10.1007/s13238-017-0451-1. [DOI] [PMC free article] [PubMed] [Google Scholar]
- 54.Kim SY. Cancer energy metabolism: shutting power off cancer factory. Biomol Ther (Seoul) 2018;26(1):39–44. doi: 10.4062/biomolther.2017.184. [DOI] [PMC free article] [PubMed] [Google Scholar]
- 55.DeBerardinis RJ, Mancuso A, Daikhin E, Nissim I, Yudkoff M, Wehrli S, Thompson CB. Beyond aerobic glycolysis: transformed cells can engage in glutamine metabolism that exceeds the requirement for protein and nucleotide synthesis. Proc Natl Acad Sci USA. 2007;104(49):19345–19350. doi: 10.1073/pnas.0709747104. [DOI] [PMC free article] [PubMed] [Google Scholar]
- 56.DeBerardinis RJ, Lum JJ, Hatzivassiliou G, Thompson CB. The biology of cancer: metabolic reprogramming fuels cell growth and proliferation. Cell Metab. 2008;7(1):11–20. doi: 10.1016/j.cmet.2007.10.002. [DOI] [PubMed] [Google Scholar]
- 57.Lieu EL, Nguyen T, Rhyne S, Kim J. Amino acids in cancer. Exp Mol Med. 2020;52(1):15–30. doi: 10.1038/s12276-020-0375-3. [DOI] [PMC free article] [PubMed] [Google Scholar]
- 58.Thornalley PJ. Protein and nucleotide damage by glyoxal and methylglyoxal in physiological systems – role in ageing and disease. Drug Metabol Drug Interact. 2008;23(1-2):125–150. doi: 10.1515/dmdi.2008.23.1-2.125. [DOI] [PMC free article] [PubMed] [Google Scholar]


