Abstract
Background
This study aimed to adjust and cross‐validate skeletal muscle mass measurements between bioimpedance analysis (BIA) and dual‐energy X‐ray absorptiometry (DXA) for the screening of sarcopenia in the community and to estimate the prevalence of sarcopenia in Hong Kong.
Methods
Screening of sarcopenia was provided to community‐dwelling older adults. Appendicular skeletal muscle mass (ASM) was evaluated by BIA (InBody 120 or 720) and/or DXA. Handgrip strength and/or gait speed were assessed. Diagnosis of sarcopenia was based on the 2019 revised Asian Working Group for Sarcopenia cut‐offs. Agreement analysis was performed to cross‐validate ASM measurements by BIA and DXA. Multiple regression was used to explore contribution of measured parameters in predicting DXA ASM from BIA.
Results
A total of 1587 participants (age = 72 ± 12 years) were recruited; 1065 participants were screened by BIA (InBody 120) with 18 followed up by DXA, while the remaining 522 participants were assessed by the BIA (InBody 720) and DXA. The appendicular skeletal muscle mass index (ASMI) evaluated by BIA showed a mean difference of 2.89 ± 0.38 kg/m2 (InBody 120) and 2.97 ± 0.45 kg/m2 (InBody 720) against DXA gold standard. A significant overestimation of muscle mass was measured by BIA compared with DXA (P < 0.005). BIA data were adjusted using prediction equation and mean difference reduced to −0.02 ± 0.31 kg/m2 in cross‐validation. Prevalence of sarcopenia in older adults ≥65 ranged from 39.4% (based on ASMI by DXA) to 40.8% (based on predicted DXA ASMI from BIA). Low ASMI by DXA was found in 68.5% of the older adults screened. The percentage of older adults exhibited low handgrip strength ranged from 31.3% to 56%, while 49% showed low gait speed.
Conclusions
Bioimpedance analysis was found to overestimate skeletal muscle mass compared with DXA. With adjustment equations, BIA can be used as a quick and reliable tool for screening sarcopenia in community and clinical settings with limited access to better options.
Keywords: Sarcopenia, Diagnosis, Skeletal muscle mass, Dual‐energy X‐ray absorptiometry (DXA), Bioimpedance analysis (BIA)
Introduction
Sarcopenia is an age‐related generalized loss of skeletal muscle mass and strength 1 that is recently recognized as an independent condition by the International Classification of Diseases, Tenth Revision, Clinical Modification. 2 With guidelines suggested by the European Working Group on Sarcopenia in Older People in 2010 and 2018, 3 , 4 also the Asian Working Group for Sarcopenia (AWGS) in 2014 and 2019, 5 , 6 Hong Kong‐reported prevalence is up to 22.1% (male) and 18.25% (female) in people over the age of 65 by the International Working Group on Sarcopenia (IWGS) definition and 9.35% (male) and 5.3% (female) by AWGS definition, and rises to as high as 50% in people over 80. 7 Sarcopenia is associated with four times increased rate of fragility fracture 8 with the presentation of poorer balancing abilities and substantial increase in fall risks, thus making sarcopenia a highly predictive factor of fragility fracture in elderly. 9 A recent study in Europe also revealed that prevalence of sarcopenia in hip fracture patients is as high as 74% of men and 54% of women, 10 making sarco‐osteoporotic fracture a newly emerging geriatric condition. 11
The generally accepted algorithm for sarcopenia screening or diagnosis in various community or clinical settings includes the SARC‐F questionnaire 12 , 13 for the identification of probable cases; handgrip strength (HG) and muscle mass measurements to confirm sarcopenia diagnosis; followed by functional assessment of chair‐rising test, gait speed, or Short Physical Performance Battery tests for further classification of severe cases. 6 , 14 Dual‐energy X‐ray absorptiometry (DXA) is the preferred go‐to method for the measurement of lean or fat skeletal muscle mass because of its accuracy, repeatability, and a discrete cut‐off value, 1 followed by magnetic resonance imaging and computed tomography that are limited to the accessibility in different clinical settings. The use of bioimpedance analysis (BIA) is therefore making a lot of sense in many clinics or community settings where the earlier cutting‐edge imaging techniques are not readily available, yet discrete cut‐off values have been recommended. 4 , 6 However, the drawback of the BIA is that the estimated skeletal muscle mass is population and device specific, 15 and conversion may be required for the diagnosis of skeletal muscle content. 16 The objective of this study is to cross‐validate the skeletal muscle measurements between BIA and DXA for the screening of sarcopenia in the community and to establish a reliable cut‐off value for the local population based on the AWGS 2019 sarcopenia definition, and to estimate the prevalence of sarcopenia in community‐dwelling older adults in Hong Kong.
Materials and methods
Study design
Screening of sarcopenia was provided to community‐dwelling older adults (age 40 and above), participating in educational seminars on musculoskeletal health or recruited from the outpatient clinic at the Prince of Wales Hospital. Definition for the diagnosis of sarcopenia followed the AWGS 2019 revised consensus and cut‐offs, 6 where low appendicular skeletal muscle mass (ASM) with either low handgrip muscle strength (HG) or slow gait speed (GS) are considered to have sarcopenia. ASM was measured for each participant by BIA and/or DXA as detailed in the succeeding text.
Bioimpedance analysis measurement
A total of 1587 subjects received a BIA measurement during the screening process (InBody 120 or InBody 720, Seoul, Korea) to evaluate ASM index (ASMI). Among the subjects evaluated, 1065 were screened by InBody 120 (Dataset120) and 522 were screened by InBody 720 (Dataset720). Participants were instructed to hold the electrodes while standing barefoot on the other electrodes on the device platform as per the manufacturer's instructions. The skeletal muscle mass (kg) shown on the assessment report was claimed to be a measurement of the ASM and was recorded as the ASM.
Dual‐energy X‐ray absorptiometry measurement
Whole‐body scans were performed on 540 subjects (n = 18 from Dataset120 and n = 522 from Dataset720) by an independent certified technician at the Prince of Wales Hospital by DXA (Horizon, Hologic, Marlborough, MA, USA) after their BIA assessment. Total ASM by DXA was evaluated by segmented measurement of muscle mass at four limbs by operator‐defined cutlines at specific anatomical landmarks. The ASM was then adjusted to the square of height to calculate the ASMI (expressed in kg/m2). Low ASMI by DXA is less than at 7 kg/m2 for men and 5.4 kg/m2 for women based on the AWGS 2019 definition.
Handgrip test
Handgrip strengths were measured by a dynamometer (5030JI, JAMAR, Bolingbrook, IL, USA) on the dominant hand of the participant. Participants were instructed to hold the device with the arm at right angle and elbow to the side of the body. The maximum effort will be taken from three attempts. 17 Cut‐off values were adopted from the most recent AWGS 2019 consensus in which low handgrip muscle strength is defined as <28 kg for men and 18 kg for women. 6
Prevalence of sarcopenia based on dual‐energy X‐ray absorptiometry and bioimpedance analysis measurements
For the purpose of this study, sarcopenia definition is based on the AWGS 2019 consensus [BIA ASMI: male (M) <7.0 and female (F) <5.7; DXA ASMI: M < 7.0 and F < 5.4; HG: M < 28 and F < 18; and GS: <1.0 m/s]. A subject is considered to be sarcopenic if they have low ASMI with either low HG or low GS, or severe sarcopenia if they have low ASMI with low HG and low GS (Figure 1).
Figure 1.
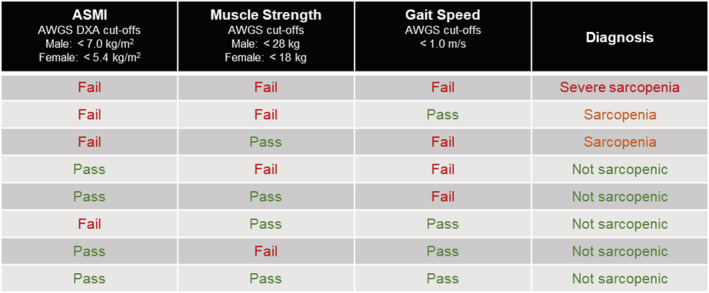
Definition of sarcopenia used in this study based on the Asian Working Group for Sarcopenia (AWGS) 2019 guidelines, where ‘sarcopenia’ is defined as ‘low appendicular skeletal muscle mass index (ASMI) with either low muscle strength or low physical performance’, while ‘severe sarcopenia’ is defined as ‘low ASMI with low muscle strength and low physical performance’. DXA, dual‐energy X‐ray absorptiometry.
Statistical analyses
All statistical analyses were performed by using SPSS Version 26 for Windows (IBM Corp., Armonk, NY, USA). Pearson correlations were performed to examine the relationship between ASM values measured by the BIA (either InBody 120 or InBody 720) and the DXA. Bland–Altman analyses were performed to evaluate the extent of agreement between both measuring methods, and multiple regression was used to explore potential contribution of anthropometric parameters such as height and weight. Differences were considered significant at P < 0.05.
Regression analysis for bioimpedance analysis to dual‐energy X‐ray absorptiometry adjustment model
Stepwise linear regression was applied to all available and relevant parameters to generate the final equations with significant covariates. Overfitting and multicollinearity between independent variables were avoided, and variance inflation factor for the prediction models chosen was <10.
Dataset720 had a larger sample size with paired BIA and DXA values for 522 subjects, which we divided equally by age into two standalone portions. Two‐thirds (n = 348) were used to derive the multivariate regression models, while one‐third (n = 174) were used to cross‐validate the prediction by the models. However, for Dataset120, only 18 subjects who had taken DXA had paired BIA/DXA values, thus splitting this dataset for validation was not feasible.
Results
A total of 1587 participants [mean age = 72, standard deviation (SD) = 12] were recruited in this study with 1065 participants (Dataset120, mean age = 77, SD = 8, range = 53–99) from community centres who received muscle mass evaluations by portable BIA device (InBody 120), and the remaining 522 participants (Dataset720, mean age = 62, SD = 12, age range = 40–87) were recruited from the outpatient clinic of the Prince of Wales Hospital who received muscle mass evaluation by a stationary BIA device (InBody 720) and DXA. Of the 1065 participants, 18 were invited to take additional DXA measurements for cross‐validation after receiving BIA measurements. We found significant gender differences in all parameters in Supporting Information, Table S1, except age in Dataset120 (P = 0.33). BIA and DXA measurements for ASM and ASMI were found to be significantly different for both datasets (Table S1).
Appendicular skeletal muscle mass index
The general trend of the ASMI by BIA and DXA can be described by scatter plots in Figure 2A–2D. There exists a strong correlation between the BIA and DXA measurements at r 2 = 0.867 (n = 18, P < 0.05) for InBody 120 and r 2 = 0.893 (n = 522, P < 0.05) for InBody 720 (Figure 2E and 2F).
Figure 2.
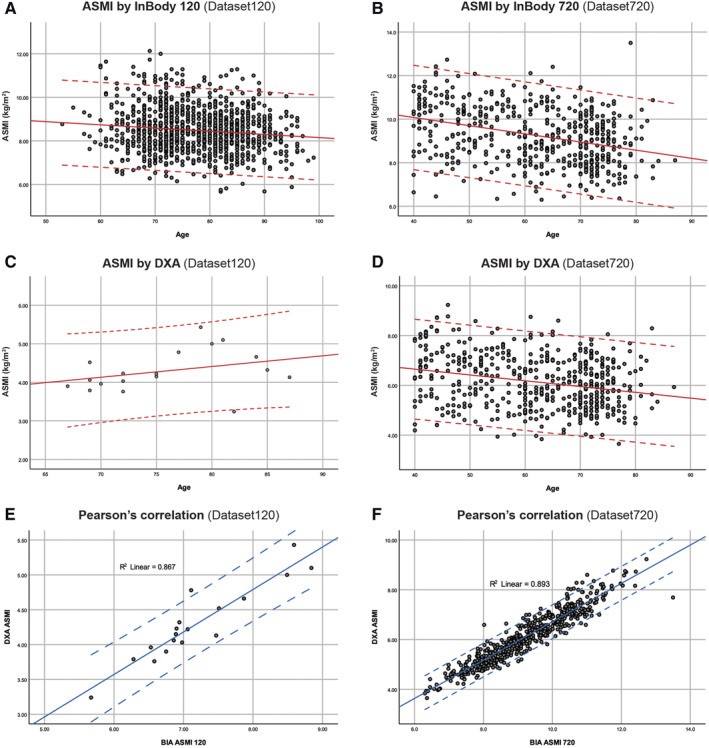
Appendicular skeletal muscle mass index (ASMI, kg/m2) evaluated by (BIA) and dual‐energy X‐ray absorptiometry (DXA). Top and bottom lines indicate ±1.96 SD. (A) BIA (InBody 120) ASMI vs. age in Dataset120 (n = 1065). (B) BIA (InBody 720) ASMI vs. age in Dataset720 (n = 522). (C) DXA ASMI vs. age in Dataset120 (n = 18). (D) DXA ASMI vs. age in Dataset720 (n = 522). (E) Correlation between DXA and BIA ASMI in Dataset120 (r 2 = 0.867, n = 18, P < 0.05). (F) Correlation between DXA and BIA ASMI in Dataset720 (r 2 = 0.893, n = 522, P < 0.05).
From the Dataset720 (Figure 3A), the ASMI by DXA of the 522 subjects was found to decrease for both genders with age, with the average ASMI of elderly men (Figure 3B) declined at a higher rate than women with age, as shown by the slope of the curve. Percentage of subjects with low ASMI (by DXA based on AWGS) was found to be 59.8% for all ages, and 68.5% for older people at 65 and over, with male (73.1%) more prevalent than female (63.2%) (Table S2).
Figure 3.
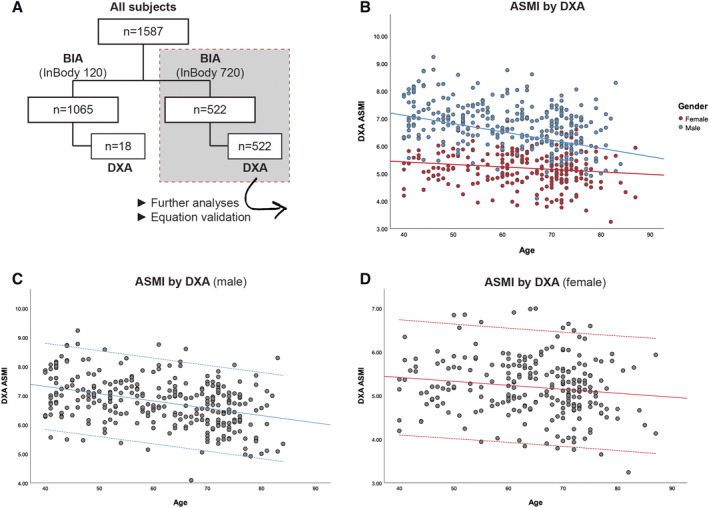
Appendicular skeletal muscle mass (ASMI, kg/m2) as evaluated by dual‐energy X‐ray absorptiometry (DXA). Top and bottom lines on (C) and (D) indicate ±1.96 SD. (A) Flow chart showing the breakdown of different tests and number of subjects in each dataset. (B) ASMI vs. age coloured by gender (n = 540). (C) Male DXA ASMI vs. age (n = 299). (D) Female DXA ASMI vs. age (n = 241). BIA, bioimpedance analysis.
Handgrip strength
All 1587 subjects completed the HG test. HG decreased with age at an increasing rate for both genders. The average HG declined at a higher rate in elderly men compared with women (Figure 4A and 4B) with age. Low HG defined by AWGS was found in 54.7% female and 64.8% male in Dataset120, and 36.8% female and 26.1% male in Dataset720 (Table S2) for older adults at age 65 and over.
Figure 4.
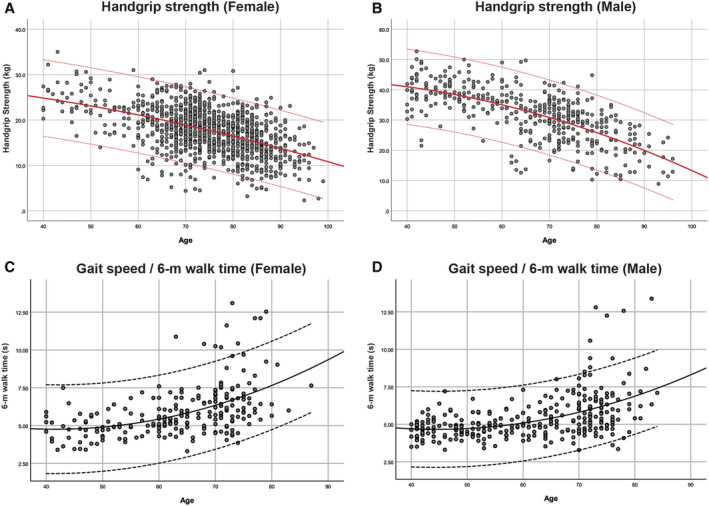
Handgrip strength measured by dynamometer in kilograms (kg) and gait speed by 6 m walk test measured in seconds (s) plotted against age separated by gender. Top and bottom lines indicate ±1.96 SD. (A) Female handgrip strength by age (n = 1160). (B) Male handgrip strength by age (n = 427). (C) Six metre walk time for female gait speed by age (n = 226). (D) Six metre walk time for male gait speed by age (n = 296).
Gait speed
The 6 m walk test showed an increase in time taken (s) at an increasing rate with age for both genders. The time increased at a higher rate in elderly women compared with men (Figure 4C and 4D) with age. Low GS defined by AWGS was found in 49.4% elderly 65 and over in Dataset720.
Prevalence of sarcopenia based on dual‐energy X‐ray absorptiometry and bioimpedance analysis measurements
When utilizing DXA‐measured ASMI and HG, sarcopenia prevalence in Dataset720 based on muscle mass and strength was 23.1% for ages ≥65 and 13.4% for all ages ranging from 40 to 87. While assessing DXA‐measured ASMI and GS, sarcopenia prevalence in Dataset720 based on muscle mass and physical performance was found to be higher at 32.3% for ages ≥65 and 17.8% for all ages. When combining the three criteria in Dataset720, severe sarcopenia was found in 15.9% older adults ≥65. The overall sarcopenia prevalence, with sarcopenia and severe sarcopenia combined, was 39.4% in Dataset720 for subjects aged ≥65 (Table S2).
Furthermore, with obesity defined by local health authorities (Centre for Health Protection, Department of Health, Hong Kong Special Administrative Region, https://www.chp.gov.hk/en/healthtopics/content/25/8802.html) at body mass index ≥25 kg/m2, the occurrence of sarcopenic obesity in older adults ≥65 was found to be 7.5–7.7% in Dataset720, which made up 20.0% and 18.4% of all sarcopenic subjects with their average age at 73 and 72 for male and female, respectively (Table S2). In the Dataset120, the occurrence of sarcopenic obesity was 18.0% and 9.5%, which made up 31.1% and 24.6% of all sarcopenic subjects at average age of 79 and 81 for male and female, respectively. Because of access to equipment, time, and venue limitations in community screening settings, the majority of subjects in Dataset120 did not take DXA or the GS test. Using BIA‐measured ASMI and HG as criteria, sarcopenia prevalence was only 0.4% (n = 1065) in Dataset120 and 0.1% (n = 251) in Dataset720 for subjects ≥65, which was deceptively low because of an overestimation found in ASMI measured by BIA compared with DXA on the same subjects. The agreement between BIA and DXA is further evaluated in the succeeding text.
Bland–Altman agreement analyses between appendicular skeletal muscle mass evaluated by dual‐energy X‐ray absorptiometry and bioimpedance analysis
The Bland–Altman plots showed large mean differences in ASM and ASMI values evaluated by BIA and DXA across the entire range. The mean difference in ASM for Dataset120 was 6.77 ± 1.24 kg (n = 18) (Figure 5A), while Dataset720 was 8.25 ± 1.80 kg (n = 522) (Figure 5B); and the mean difference in ASMI for Dataset120 was 2.89 ± 0.38 kg/m2 (n = 18) (Figure 5C), while Dataset720 was 3.11 ± 0.45 (n = 522) (Figure 5D). A significant overestimation of ASM, hence ASMI, was observed in measurements by the BIA compared with DXA (P < 0.005) (Table S1).
Figure 5.
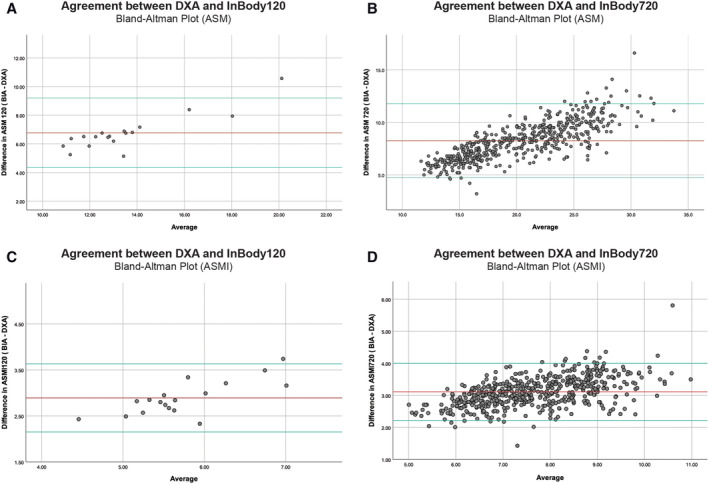
Bland–Altman plot comparing appendicular skeletal muscle mass (ASM) and appendicular skeletal muscle mass index (ASMI) measured between bioimpedance analysis (BIA) and dual‐energy X‐ray absorptiometry (DXA) in Dataset120 (n = 18) and Dataset720 (n = 522). Top and bottom reference lines indicate 95% confidence interval. (A) ASM mean difference = 6.77 ± 1.24 kg, limits of agreement = 4.35, 9.20. (B) ASM mean difference = 8.25 ± 1.80 kg, limits of agreement = 4.73, 11.77. (C) ASMI mean difference = 2.89 ± 0.38 kg/m2, limits of agreement = 2.15, 3.63. (D) ASMI mean difference = 3.11 ± 0.45 kg/m2, limits of agreement = 2.22, 4.00.
This significant difference in ASMI measurements in both datasets was also found to be affected by gender and weight. Male had a larger difference in ASMI at 3.46 ± 0.29 and 3.26 ± 0.44 than female at 2.78 ± 0.28 (P < 0.05) and 2.92 ± 0.39 (P < 0.05) in Dataset120 and Dataset720, respectively. The overall mean difference in ASMI for all subjects 65 and above was 2.89 ± 0.38 kg/m2 for Dataset120 and 2.97 ± 0.45 kg/m2 for Dataset720 (Table S4). Furthermore, a significant difference was also found in both datasets when comparing the difference in ASMI measured by BIA and DXA for obese (body mass index ≥25) and non‐obese subjects (Table S5).
Bioimpedance analysis to dual‐energy X‐ray absorptiometry adjustment model from regression analysis
The final equations to predict DXA ASM using BIA‐measured ASM are as follows:
(Model A) Prediction with InBody 120 (derived from Dataset120, n = 18):
(Model B) Prediction with InBody 720 (derived from two‐thirds of subjects in Dataset720 with validation, n = 348):
We cross‐validated our proposed final prediction Model B on the independent one‐third (n = 174) of the data in Dataset720 to test the prediction power. The mean difference in the predicted DXA ASM was −0.04 ± 0.82 kg compared with the actual DXA ASM (Figure 6A). The predicted DXA ASM can be divided by height2 to obtain the predicted DXA ASMI. The mean difference between predicted DXA ASMI and the actual DXA ASMI was −0.02 ± 0.31, and no skewness or kurtosis was found (Figure 6B).
Figure 6.
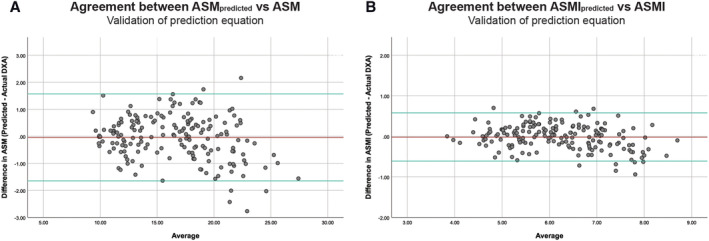
Bland–Altman plot comparing predicted appendicular skeletal muscle mass (ASM) and appendicular skeletal muscle mass index (ASMI) vs. actual dual‐energy X‐ray absorptiometry (DXA) measurements in one‐third (n = 174) of Dataset720 after deriving regression model with the remaining two‐thirds. Top and bottom reference lines indicate 95% confidence interval. (A) ASM mean difference = −0.04 ± 0.82, limits of agreement = 1.57, −1.65. (B) ASMI mean difference = −0.02 ± 0.31, limits of agreement = 0.58, −0.61.
Sarcopenia prevalence based on the adjusted ASMpredicted
After sufficiently validated Model B for its predictive power, following a similar approach, we derived Model A from the paired BIA/DXA data (n = 18) to be empirically tested on the remaining subjects in Dataset120 with no DXA values. Sarcopenia prevalence was estimated using the ASMI calculated from the predicted DXA ASM (Table S3). Because there were only 18 paired data, Model A was not cross‐validated like Model B. As an estimation, out of 1047 community subjects aged 65 and above, 68.0% female and 88.3% male were estimated to have low ASM based on the DXA ASMIpredicted, using the AWGS 2019 sarcopenia definition. We found an adjusted sarcopenia prevalence of 40.8% by prediction compared with 0.4% before the adjustment. The adjusted sarcopenia prevalence for female and male was 38.4% and 57.8%, respectively.
Discussion
A total of 1587 participants were involved to estimate the prevalence of sarcopenia in community‐dwelling older adults in Hong Kong and to cross‐validate the skeletal muscle mass measurements between the BIA and the DXA for the screening of sarcopenia in the community. Prevalence of sarcopenia in Hong Kong has previously been reported to vary vastly according to different sarcopenia definitions by different working groups. 7 In our study, prevalence of sarcopenia in older adults age 65 and over estimated from 1587 participants in 2 datasets ranged from 40.8% (based on predicted ASM from BIA) to 39.4% (based on DXA‐measured ASM). Around 70% of older adults showed low ASMI reported by both of our datasets (by either muscle mass evaluation methods). The percentage of older adults exhibiting low HG ranged from 31% to 56%, while low GS was 49%. Sarcopenia is a rapidly emerging geriatric issue in Hong Kong, and the prevalence is projected to rise as our population ages. Therefore, being able to accurately diagnose and identify patients is critical and essential to better manage the condition and for future clinical studies in search of an effective way to combat sarcopenia.
Bioimpedance analysis has been a well‐researched modality to assess an individual's body composition and is highly affordable, quick, and easy to operate and non‐invasive. 18 , 19 A high correlation between DXA‐measured and BIA‐measured skeletal muscle mass has been well reported in literatures. 20 From our paired BIA and DXA ASMI data, we also found a high correlation between the two modalities (r 2 = 0.89). However, because BIA algorithms are derived and built‐in by the manufacturer based on a specific population, 21 caution is needed when applying to populations different from the validation sample as many studies have reported. 22 Studies such as Lee et al. reported a similar but lower overestimation of BIA ASM measurements of 2.0 ± 1.1 kg compared with DXA found in their study with Korean population. 23 Other considerations should also be taken into account when screening with the BIA on specific patient groups like chronic heart disease, kidney diseases, or cancer who are taking chemotherapy or other treatments that would cause severe dehydration before, during, or after treatments. 18
From this study, we report a mean difference of 2.89 ± 0.38 kg/m2 measured by the InBody 120 and 2.97 ± 0.45 kg/m2 by the InBody 720 against the gold standard of DXA. The ASMI cut‐off values for BIA and DXA suggested by the AWGS 6 are male at 7.0 kg/m2 (both DXA and BIA) and female at 5.4 kg/m2 (DXA) and 5.7 kg/m2 (BIA); using the ASM directly from the BIA device against these cut‐off values without any adjustment would lead to a large overestimation of ASM (Figure 5A and 5B), which has also been previously reported by Gonzalez and Heymsfield summarizing various studies from different regions and ethnic groups. 16
On the other hand, muscle mass evaluation by DXA is less likely to be affected by ethnicity. 24 However, the availability of a DXA scanner at many clinical setting for the screening of sarcopenia could be limited because of practical reasons (e.g. clinic space, expertise, and budget). We therefore recommend the use of BIA, which is convenient and portable and has high correlations with DXA measurements; however, this requires the use of adjustment equations (Figure 7) similar to previously reported for different ethnic groups. 25 , 26
Figure 7.
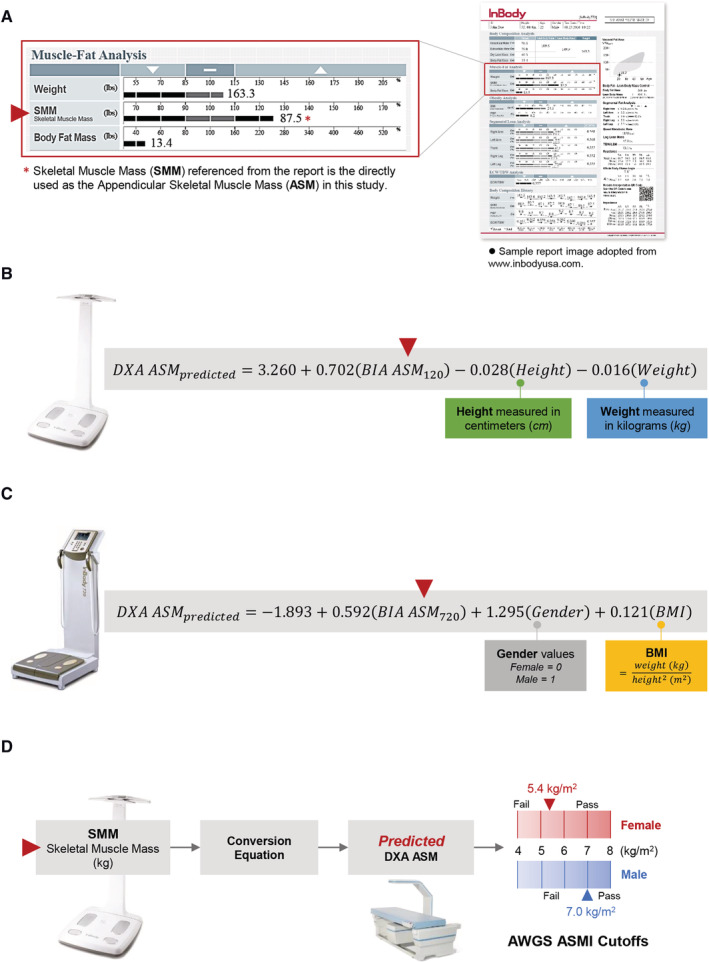
Recommended application workflow of bioimpedance analysis (BIA) for sarcopenia screening. (A) Skeletal muscle mass (SMM) can be taken directly from the report of a commercially available BIA device (InBody 120 or 720) and used as the appendicular skeletal muscle mass (ASM) as defined by European Working Group on Sarcopenia in Older People or Asian Working Group for Sarcopenia. (B, C) The SMM or ASM measured by BIA can be substituted into the relevant equations along with other parameters of weight, height, gender, or body mass index for the estimation of predicted ASM (which is the expected ASM from a DXA measurement). (B) Prediction equation from InBody 120 measurement. (C) Prediction equation from InBody 720 measurement. (D) This predicted ASM (ASMpredicted) can be directly compared with the DXA cut‐off values defined by the European Working Group on Sarcopenia in Older People or Asian Working Group for Sarcopenia for male or female for the diagnosis of low muscle mass content. Suggested BIA application for muscle mass evaluation in community settings.
With the use of the respective equations for InBody 120 or InBody 720 to predict a subject's DXA ASMI, we can simply use the recommended sarcopenia cut‐offs defined and recommended by the AWGS to diagnose sarcopenia easily in both clinical and community setting using the BIA only. After adjustments, the mean difference between our predicted DXA ASMI compared with the actual DXA ASMI improved vastly from ~3.0 kg/m2 (when comparing BIA ASMI with DXA ASMI) to 0.02 kg/m2.
Several limitations to this current study include GS for participants in Dataset120 was not tested, and detailed medical histories were not taken in the community screening activities because of space and time limitations, affecting the successful screening of sarcopenic patients presenting with compromised physical performance. Moreover, subjects who were willing to travel to participate in DXA scanning were scarce; hence, more paired BIA/DXA data would be required to generate a validated prediction equation for InBody 120, as Model A was only derived from a limited number of subjects (n = 18) in Dataset120.
Sarcopenia prevalence in Hong Kong older adults at 65 or above was estimated to be 39.4% to 40.8% in our study based on the latest AWGS definition, as compared with previously reported 9% in 2014 based on the European Working Group on Sarcopenia in Older People criteria, 27 or another similar study in Japan reporting 9.8–10.1%. 28 Our finding is more closely matched with another recent findings reported in Chang's study in Korea with 40.3% and 41.3% prevalence in male and female, respectively, using InBody 720 BIA as the muscle mass evaluation. 29 This large variability in prevalence findings among different studies could have been attributed to the sampling of subjects, the geographical area or residential settings, changes in demographics, and the difference in muscle mass measurements by different methods (BIA vs. DXA). Greater screening efforts may be required to better understand changes and characteristics in our local population.
In conclusion, around 70% of older adults showed low ASMI. BIA shows high correlation with DXA in the evaluation of ASM but requires some mathematical adjustments before practical application in sarcopenia screening. With the adjustment equations, BIA can be used as a quick, accurate, and reliable screening tool at clinical or community settings with limited access to better options. Future studies with a larger database with paired BIA/DXA readings can further validate prediction equations for different ethnicities and BIA equipment used.
Conflict of interest
None declared.
Funding
This project is supported by the Health and Medical Research Fund, Health Care and Promotion Scheme (HCPS 02180118), and Direct Grant for Research, the Chinese University of Hong Kong (4054479).
Supporting information
Table S1. General statistics by gender for Dataset120 and Dataset720. Statistics by independent‐sample t‐tests where statistical significance considered at p < 0.05.
Table S2. Sarcopenia prevalence based on ASMI values measured by DXA and diagnostic tests according to the AWGS guidelines. Only subjects from the Dataset720 (n = 522) were included. Abbreviations: Appendicular skeletal muscle index (ASMI), handgrip strength (HG), gait speed (GS). Sarcopenia1 = low ASMI with low HG only; Sarcopenia2 = low ASMI and low GS only; Severe sarcopenia = low ASMI with low HG and low GS; Sarcopenia prevalence = severe sarcopenia + sarcopenia cases.
Table S3. Adjusted sarcopenia prevalence prediction and relevant parameters for Dataset120 (n = 1047) sorted by gender showing evaluation of ASMI from BIA before prediction equation adjustment and evaluation of adjusted ASMI by prediction Model A . GS test was not performed due to limitations in the community screening venues.
Table S4. Agreement analysis of ASMI between BIA and DXA measurements for Dataset120 and Dataset720, where * indicates only subjects age 65 and above were included for analysis.
Table S5. General statistics by obesity status for Dataset120 and Dataset720. Statistics by independent‐sample t‐tests where statistical significance considered at p < 0.05.
Acknowledgements
The authors of this paper certify that they comply with the ethical guidelines for authorship and publishing of the Journal of Cachexia, Sarcopenia and Muscle. 30
Cheng K. Y.‐K., Chow S. K.‐H., Hung V. W.‐Y., Wong C. H.‐W., Wong R. M.‐Y., Tsang C. S.‐L., Kwok T., and Cheung W.‐H. (2021) Diagnosis of sarcopenia by evaluating skeletal muscle mass by adjusted bioimpedance analysis validated with dual‐energy X‐ray absorptiometry, Journal of Cachexia, Sarcopenia and Muscle, 12, 2163–2173, 10.1002/jcsm.12825
References
- 1. Cruz‐Jentoft AJ, Sayer AA. Sarcopenia. Lancet 2019;393:2636–2646. [DOI] [PubMed] [Google Scholar]
- 2. Cao L, Morley JE. Sarcopenia is recognized as an independent condition by an International Classification of Disease, Tenth Revision, Clinical Modification (ICD‐10‐CM) code. J Am Med Dir Assoc 2016;17:675–677. [DOI] [PubMed] [Google Scholar]
- 3. Cruz‐Jentoft AJ, Baeyens JP, Bauer JM, Boirie Y, Cederholm T, Landi F, et al. Sarcopenia: European consensus on definition and diagnosis: report of the European Working Group on Sarcopenia in Older People. Age Ageing 2010;39:412–423. [DOI] [PMC free article] [PubMed] [Google Scholar]
- 4. Cruz‐Jentoft AJ, Bahat G, Bauer J, Boirie Y, Bruyere O, Cederholm T, et al. Sarcopenia: revised European consensus on definition and diagnosis. Age Ageing 2019;48:16–31. [DOI] [PMC free article] [PubMed] [Google Scholar]
- 5. Chen LK, Liu LK, Woo J, Assantachai P, Auyeung TW, Bahyah KS, et al. Sarcopenia in Asia: consensus report of the Asian Working Group for Sarcopenia. J Am Med Dir Assoc 2014;15:95–101. [DOI] [PubMed] [Google Scholar]
- 6. Chen LK, Woo J, Assantachai P, Auyeung TW, Chou MY, Iijima K, et al. Asian Working Group for Sarcopenia: 2019 consensus update on sarcopenia diagnosis and treatment. J Am Med Dir Assoc 2020;21:300–307.e2. [DOI] [PubMed] [Google Scholar]
- 7. Woo J, Leung J, Morley JE. Defining sarcopenia in terms of incident adverse outcomes. J Am Med Dir Assoc 2015;16:247–252. [DOI] [PubMed] [Google Scholar]
- 8. Wong RMY, Wong H, Zhang N, Chow SKH, Chau WW, Wang J, et al. The relationship between sarcopenia and fragility fracture—a systematic review. Osteoporos Int 2019;30:541–553. [DOI] [PubMed] [Google Scholar]
- 9. Yu R, Leung J, Woo J. Incremental predictive value of sarcopenia for incident fracture in an elderly Chinese cohort: results from the Osteoporotic Fractures in Men (MrOs) Study. J Am Med Dir Assoc 2014;15:551–558. [DOI] [PubMed] [Google Scholar]
- 10. Sánchez‐Castellano C, Martín‐Aragón S, Bermejo‐Bescós P, Vaquero‐Pinto N, Miret‐Corchado C, Merello de Miguel A, et al. Biomarkers of sarcopenia in very old patients with hip fracture. J Cachexia Sarcopenia Muscle 2020;11:478–486. [DOI] [PMC free article] [PubMed] [Google Scholar]
- 11. Buehring B, Krueger D, Binkley N. Effect of including historical height and radius BMD measurement on sarco‐osteoporosis prevalence. J Cachexia Sarcopenia Muscle 2013;4:47–54. [DOI] [PMC free article] [PubMed] [Google Scholar]
- 12. Malmstrom TK, Morley JE. SARC‐F: a simple questionnaire to rapidly diagnose sarcopenia. J Am Med Dir Assoc 2013;14:531–532. [DOI] [PubMed] [Google Scholar]
- 13. Woo J, Leung J, Morley JE. Validating the SARC‐F: a suitable community screening tool for sarcopenia? J Am Med Dir Assoc 2014;15:630–634. [DOI] [PubMed] [Google Scholar]
- 14. Cruz‐Jentoft AJ, Bahat G, Bauer J, Boirie Y, Bruyere O, Cederholm T, et al. Sarcopenia: revised European consensus on definition and diagnosis. Age Ageing 2019;48:601. [DOI] [PMC free article] [PubMed] [Google Scholar]
- 15. Bosy‐Westphal A, Schautz B, Later W, Kehayias JJ, Gallagher D, Muller MJ. What makes a BIA equation unique? Validity of eight‐electrode multifrequency BIA to estimate body composition in a healthy adult population. Eur J Clin Nutr 2013;67:S14–S21. [DOI] [PubMed] [Google Scholar]
- 16. Gonzalez MC, Heymsfield SB. Bioelectrical impedance analysis for diagnosing sarcopenia and cachexia: what are we really estimating? J Cachexia Sarcopenia Muscle 2017;8:187–189. [DOI] [PMC free article] [PubMed] [Google Scholar]
- 17. Chow SK, Chim YN, Cheng KY, Ho CY, Ho WT, Cheng KC, et al. Elastic‐band resistance exercise or vibration treatment in combination with hydroxymethylbutyrate (HMB) supplement for management of sarcopenia in older people: a study protocol for a single‐blinded randomised controlled trial in Hong Kong. BMJ Open 2020;10:e034921. [DOI] [PMC free article] [PubMed] [Google Scholar]
- 18. Aleixo GFP, Shachar SS, Nyrop KA, Muss HB, Battaglini CL, Williams GR. Bioelectrical impedance analysis for the assessment of sarcopenia in patients with cancer: a systematic review. Oncologist 2020;25:170–182. [DOI] [PMC free article] [PubMed] [Google Scholar]
- 19. Wang H, Hai S, Cao L, Zhou J, Liu P, Dong B‐R. Estimation of prevalence of sarcopenia by using a new bioelectrical impedance analysis in Chinese community‐dwelling elderly people. BMC Geriatr 2016;16:216. [DOI] [PMC free article] [PubMed] [Google Scholar]
- 20. Ling CH, de Craen AJ, Slagboom PE, Gunn DA, Stokkel MP, Westendorp RG, et al. Accuracy of direct segmental multi‐frequency bioimpedance analysis in the assessment of total body and segmental body composition in middle‐aged adult population. Clin Nutr 2011;30:610–615. [DOI] [PubMed] [Google Scholar]
- 21. Kim H, Hirano H, Edahiro A, Ohara Y, Watanabe Y, Kojima N, et al. Sarcopenia: prevalence and associated factors based on different suggested definitions in community‐dwelling older adults. Geriatr Gerontol Int 2016;16:110–122. [DOI] [PubMed] [Google Scholar]
- 22. Achamrah N, Colange G, Delay J, Rimbert A, Folope V, Petit A, et al. Comparison of body composition assessment by DXA and BIA according to the body mass index: a retrospective study on 3655 measures. PLoS ONE 2018;13:e0200465‐e. [DOI] [PMC free article] [PubMed] [Google Scholar]
- 23. Lee SY, Ahn S, Kim YJ, Ji MJ, Kim KM, Choi SH, et al. Comparison between dual‐energy X‐ray absorptiometry and bioelectrical impedance analyses for accuracy in measuring whole body muscle mass and appendicular skeletal muscle mass. Nutrients 2018;10. [DOI] [PMC free article] [PubMed] [Google Scholar]
- 24. Scott D, Park MS, Kim TN, Ryu JY, Hong HC, Yoo HJ, et al. Associations of low muscle mass and the metabolic syndrome in Caucasian and Asian middle‐aged and older adults. J Nutr Health Aging 2016;20:248–255. [DOI] [PubMed] [Google Scholar]
- 25. Reiss J, Iglseder B, Kreutzer M, Weilbuchner I, Treschnitzer W, Kassmann H, et al. Case finding for sarcopenia in geriatric inpatients: performance of bioimpedance analysis in comparison to dual X‐ray absorptiometry. BMC Geriatr 2016;16:52. [DOI] [PMC free article] [PubMed] [Google Scholar]
- 26. Anderson LJ, Erceg DN, Schroeder ET. Utility of multifrequency bioelectrical impedance compared with dual‐energy x‐ray absorptiometry for assessment of total and regional body composition varies between men and women. Nutr Res 2012;32:479–485. [DOI] [PubMed] [Google Scholar]
- 27. Yu R, Wong M, Leung J, Lee J, Auyeung TW, Woo J. Incidence, reversibility, risk factors and the protective effect of high body mass index against sarcopenia in community‐dwelling older Chinese adults. Geriatr Gerontol Int 2014;14:15–28. [DOI] [PubMed] [Google Scholar]
- 28. Makizako H, Nakai Y, Tomioka K, Taniguchi Y. Prevalence of sarcopenia defined using the Asia Working Group for Sarcopenia criteria in Japanese community‐dwelling older adults: a systematic review and meta‐analysis. Phys Ther Res 2019;22:53–57. [DOI] [PMC free article] [PubMed] [Google Scholar]
- 29. Chang HK, Lee JY, Gil CR, Kim MK. Prevalence of sarcopenia in community‐dwelling older adults according to simplified algorithms for sarcopenia consensus based on Asian Working Group for Sarcopenia. Clin Interv Aging 2020;15:2291–2299. [DOI] [PMC free article] [PubMed] [Google Scholar]
- 30. von Haehling S, Morley JE, Coats AJS, Anker SD. Ethical guidelines for publishing in the Journal of Cachexia, Sarcopenia and Muscle: update 2019. J Cachexia Sarcopenia Muscle 2019;10:1143–1145. [DOI] [PMC free article] [PubMed] [Google Scholar]
Associated Data
This section collects any data citations, data availability statements, or supplementary materials included in this article.
Supplementary Materials
Table S1. General statistics by gender for Dataset120 and Dataset720. Statistics by independent‐sample t‐tests where statistical significance considered at p < 0.05.
Table S2. Sarcopenia prevalence based on ASMI values measured by DXA and diagnostic tests according to the AWGS guidelines. Only subjects from the Dataset720 (n = 522) were included. Abbreviations: Appendicular skeletal muscle index (ASMI), handgrip strength (HG), gait speed (GS). Sarcopenia1 = low ASMI with low HG only; Sarcopenia2 = low ASMI and low GS only; Severe sarcopenia = low ASMI with low HG and low GS; Sarcopenia prevalence = severe sarcopenia + sarcopenia cases.
Table S3. Adjusted sarcopenia prevalence prediction and relevant parameters for Dataset120 (n = 1047) sorted by gender showing evaluation of ASMI from BIA before prediction equation adjustment and evaluation of adjusted ASMI by prediction Model A . GS test was not performed due to limitations in the community screening venues.
Table S4. Agreement analysis of ASMI between BIA and DXA measurements for Dataset120 and Dataset720, where * indicates only subjects age 65 and above were included for analysis.
Table S5. General statistics by obesity status for Dataset120 and Dataset720. Statistics by independent‐sample t‐tests where statistical significance considered at p < 0.05.


