

Abstract
Background
Deteriorated skeletal muscle condition, including sarcopenia, is a risk factor for disability in older adults. Promoting physical activity is a useful treatment for sarcopenia. However, optimal intensity of physical activity according to sarcopenia characteristics is unclear.
Methods
This longitudinal cohort study enrolled 2149 community‐dwelling older adults (women 55.7%, mean age: 75.5 ± 4.0 years). Five‐year disability incidence defined by Japanese long‐term care insurance certification and accelerometer‐measured physical activities (light‐intensity physical activity [LPA] and moderate‐to‐vigorous intensity physical activity [MVPA]), which were adjusted for potential confounders, was analysed using cox‐proportional hazard model stratified by sarcopenia characteristics based on the diagnostic algorithm by the Asian working group for sarcopenia (robust, low physical function, low muscle mass, and sarcopenia). The sarcopenia group was defined as low muscle mass and low physical function (weakness and/or slowness). The low muscle mass and low physical function groups were each defined by these characteristics alone. Muscle mass was analysed via bioelectrical impedance analysis. Each intensity of physical activity times was divided by median values.
Results
The disability incidence rate was 15.4%, excluding those who could not be followed up. Mean LPA times were 43.8 ± 18.0, 45.6 ± 17.5, 45.4 ± 16.6, 40.8 ± 18.6, and 41.4 ± 18.5 min/day and MVPA times were 24.6 ± 17.6, 26.3 ± 18.3, 27.2 ± 17.3, 21.6 ± 16.3, and 21.5 ± 16.4 min/day in all participants, the robust, low muscle mass, low physical function, and sarcopenia groups, respectively. For all participants, higher MVPA was associated with disability incidence [hazard ratios (HR), 0.63; 95% confidence interval (95% CI), 0.49–0.81; P < 0.001], whereas higher LPA showed no association (HR, 0.86; 95% CI, 0.68–1.10; P = 0.22). Higher LPA was associated in the sarcopenia group (HR, 0.35; 95% CI, 0.15–0.85; P = 0.019), and MVPA was associated in the robust (HR, 0.58; 95% CI, 0.39–0.87; P = 0.008) and low physical function (HR, 0.66; 95% CI, 0.45–0.98; P = 0.040) groups. Both LPA and MVPA showed no association in the low muscle mass group. The P values for interactions between sarcopenia characteristics and physical activity were 0.017 for LPA and 0.014 for MVPA.
Conclusions
The LPA was associated with a lower risk of disability in older adults with sarcopenia, whereas MVPA was associated in subjects with robust and low physical function. Our findings indicate a need for individualized approaches to prevent disability based on muscle condition.
Keywords: Physical activity, Sarcopenia, Disability, Older adults
Introduction
Due to the rapidly ageing population, older people with disability are expected to continuously increase in Japan. The number of older people with disability who require long‐term care insurance reached 6.2 million in 2017. 1 Because disability leads to a poor quality of life, higher risk of mortality, and requirement of nursing care, it can be a considerable social burden. Several risk factors, including physical function, cognitive function, morbidity, mental condition, and lifestyle have been reported to be associated with the incidence of disability. 2 Identifying effective interventions to prevent disability for individuals with these risk factors is an urgent issue.
Skeletal muscle condition, including muscle function and mass, is a critical risk factor for disability in older adults. Particularly, a deteriorated muscle condition in which both low function (such as slowness and weakness) and mass are present is defined as sarcopenia. Sarcopenia leads to dependence for activities of daily living (ADL), falls, poor quality of life, and higher risk of mortality. 3 The prevalence of sarcopenia, using the Asian working group of sarcopenia (AWGS) criteria, was reported as 9.8% for men and 10.1% for women among Japanese older adults, with increasing prevalence with agieng. 4 , 5 Both low muscle function and mass were risk factors for disability. Age‐related loss of muscle strength and performance is associated with disability in older adults. 6 , 7 Further, loss of muscle mass is an independent risk factor for disability 8 and is considered the preliminary stage of sarcopenia. Individuals with loss of muscle function or mass are a considerable target for preventing disability in older adults.
Loss of muscle function and mass leads to disability in older adults via progression of physical dysfunction, malnutrition, and physical inactivity, known as the frail cycle. 9 Non‐drug treatments, especially physical exercise and nutritional care, are a key component of treatment. 10 , 11 Among physical exercises, although resistance training is effective for promoting muscle synthesis, and was adopted in previous intervention trials for sarcopenia, promoting daily physical activity is also considered a significant treatment. Physical activity is a well‐known intervention for preventing disability in older adults and for maintaining muscle function and mass. 12 , 13 In the recent trial, walking‐based physical activity programme increased serum insulin‐like growth factor‐1 and muscle mass in community‐dwelling older adults. 14 Mijnarends et al. reported that a higher physical activity was associated with a lower incidence of sarcopenia. 15 Promoting daily physical activity improves muscle condition and protects against disability development in older adults. However, the effect of daily physical activity on disability prevention in older adults with poor muscle condition, including sarcopenia, has not been well examined. There were also unclear relationships between each poor muscle condition including low physical function, low muscle mass, and sarcopenia and physical activity on disability incident among community‐dwelling older adults.
Several studies have reported that daily physical activity, especially of moderate‐to‐vigorous intensity, is effective for disability prevention, 16 but a patient with sarcopenia has low cardiorespiratory function due to low oxygen uptake, blood volume and stroke volume; performing higher intensity activity may be difficult. 17 , 18 , 19 In addition, the American College of Sports Medicine recommended moderate and/or vigorous intensity physical activities for older adults, but light‐to‐moderate intensity is beneficial for unconditioned persons. 20 These suggest that not only moderate‐to‐vigorous intensity but also light‐intensity daily physical activity may relate to disability in older adults with deteriorated muscle condition. However, the effect and optimal intensity of daily physical activity according to the muscle condition remain unclear.
The aim of the present study was to identify the association between physical activity and the incidence of disability according to sarcopenia characteristics. In addition, the optimal intensities of physical activities for each sarcopenia characteristic were examined to clarify an individualized intervention method.
Methods
Participants
The present study included community‐dwelling older adults who lived in Nagoya City, Japan, and were enrolled in a sub‐cohort of the National Center for Geriatrics and Gerontology–Study of Geriatric Syndromes (NCGG‐SGS). We included 5205 individuals ≥70 years of age who did not require care from the long‐term care insurance (LTCI) system in Japan at a baseline survey which was conducted from September to December 2013. After the baseline survey, participants were asked to wear an accelerometer to measure their physical activity for at least 2 weeks. We excluded individuals who did not have valid accelerometer data for analysing physical activity, body composition, and physical function data (n = 2808). In addition, individuals with dementia (n = 8), stroke (n = 146), Parkinson's disease (n = 5), depression (n = 87), and those who required assistance to accomplish basic ADL (n = 2), were excluded as they were considered to have a higher risk of disability at baseline. The remaining sample for analysis included 2149 participants (mean age: 75.5 ± 4.0 years, women: 55.7%). Figure 1 shows the flow diagram of the inclusion and exclusion of the participants.
Figure 1.
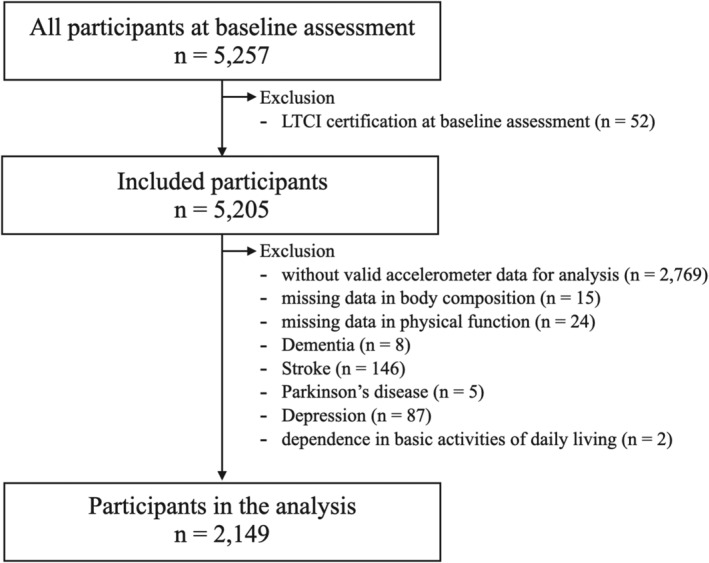
Flow diagram demonstrating the inclusion and exclusion of the participants. LTCI, long‐term care insurance.
This study was approved by the appropriate institutional review board (Approval Number: 1440‐2). Based on the opt‐out approach, we disclosed information about this study and excluded data when the participants declined to participate directly or via proxy.
Physical activity measurement
We measured the time the participants engaged in physical activity using a triaxial accelerometer (GT40‐020: Kao Corporation: Tokyo, Japan) set at a 4 s epoch length. We defined light‐intensity physical activity (LPA) as activities ranging from >1.5 to <3 metabolic equivalents and moderate‐to‐vigorous intensity physical activity (MVPA) as activities of ≥3 metabolic equivalents according to current guidelines of physical activity. 21 The intensity level of an activity was measured according to the same algorithm of the Kenz Lifecorder (Suzuken Corporation, Limited: Aichi, Japan). 22 We calculated the daily time taken to perform LPAs and MVPAs by adding up all epochs in a day according to each intensity. After the end of the baseline survey, we asked participants to wear a waist accelerometer throughout the day, apart from bathing and sleeping, for 14 consecutive days. We configured the display of the accelerometer as blind so as to not affect participants' behaviours by the feedback of their own activity level. We identified the valid accelerometer data as participants wore it for ≥10 h a day for at least 7 out of 14 days according to a current systematic review. 23 Subsequently, we calculated the mean daily time spent in LPAs and MVPAs. Each level of physical activity was divided into two groups according to the median values of the mean daily times for all participants of the present study. Higher amount of physical activities were defined as the median or more for each physical activity time.
Sarcopenia characteristics definition
We defined sarcopenia and deteriorated muscle condition based on the diagnostic algorithm by the Asian working group for sarcopenia (AWGS) that assesses muscle mass and physical function (gait speed and grip strength). 24 Participants with both low muscle mass and low physical function (weakness and/or slowness) were assigned to a sarcopenia group. Participants with low muscle mass and normal physical function (preserved muscle strength and normal gait speed) were assigned to a low muscle mass group. Participants with normal muscle mass and low physical function were assigned to a low physical function group. Finally, participants with normal muscle mass and normal physical function were assigned to a robust group.
Amount of muscle mass was examined using a multifrequency (1, 5, 50, 250, 500, and 1000 kHz) whole and segmental body bioelectrical impedance analyser (BIA) (MC‐980A; Tanita, Tokyo, Japan). We determined the appendicular skeletal muscle mass according to the formulas of a previous study. 25 The skeletal muscle index (SMI) was calculated as appendicular muscle mass divided by height squared. Low muscle mass was defined as SMI < 7.0 kg/m2 for men and <5.7 kg/m2 for women.
Grip strength was measured using a Smedley‐type handheld dynamometer (Grip‐D, Takei Ltd, Niigata). Low muscle strength was defined as grip strength <26 kg for men and <18 kg for women. Gait speed was measured in seconds over a 2.4 m distance with a comfortable walking speed. Participants walked for an additional 2 m distance before and after measurement to ensure a consistent speed during measurement. Digital stopwatch automatically timed when participants walk past the infrared sensors sat on start and end of the measurement area. Although the gait speed cut‐off value of the AWGS is 0.8 m/s, we modified it to 1.0 m per second because the participants in the present study could independently participate in community centre activities and seemed to have better physical function compared with subjects in clinic or hospital settings. In addition, slow gait speed identified by a cut‐off value of 1.0 m per second satisfactorily predicted the incidence of disability in community‐dwelling older people in a previous study. 26 The optimal cut‐off value of gait speed was defined as 1.0 m/s in the present study. Physical function and body composition were assessed by trained staff to correctly administer the assessment measures.
Incidence of disability
Incidence of disability was identified as the time point when participants were identified to require care according to the LTCI certification within 5 years after the baseline assessment. Every Japanese adult aged 65 years or older is eligible for institutional and community‐based services from the LTCI according to the ADL disability. Older adults who required nursing care services from the LTCI were examined to determine their current physical and mental status in response to self‐reported information and information from their families. Assessment of care needs by the LTCI system allocates applicants to seven classes according to the individual's level of nursing care need. The assessment was conducted in two steps. First, the individual's physical function, basic ADL, cognitive function, behavioural and psychological symptoms, and social adaptation ability are assessed by trained local government officials and the results were entered into a computer to determine the temporary care needs level based on the estimated time taken for care. Subsequently, the confirmed care needs level was decided by the Nursing Care Needs Certification Board, including physicians, nurses, and other experts, according to the initial assessment and the attending physician's opinion. LTCI certification data of subjects in the present study were obtained from the local government.
Covariates
Age, sex, self‐reported educational history, Geriatric Depression Scale (GDS) scores, and smoking and alcohol drinking status were collected. History of comorbidities (heart disease, hypertension, hyperlipidaemia, diabetes, osteoporosis, and pulmonary disease) and the number of prescribed medications were collected by trained nurses. Mini‐mental state examination (MMSE) scores and body mass index (BMI) were also entered into covariates.
Statistical analysis
Differences in baseline sociodemographic and clinical characteristics between individuals stratified by sarcopenia characteristics (sarcopenia, low muscle mass, low physical function, and robust) were evaluated with Kruskal–Wallis tests for continuous variables and χ 2 tests for categorical variables. The incidence of disability during the 5 year follow‐up period, according to the baseline of sarcopenia characteristics and each level of physical activity (median or more, or less than the mean daily time spent in MVPA and LPA) for all participants and each group of sarcopenia characteristics, was calculated using cox proportional hazard (CPH) regression models. The constructed multivariate regression model was adjusted by age, sex, educational history, MMSE scores, GDS scores, smoking (current smoker or not) and alcohol drinking status (current drinker or not), comorbidities, number of medications, BMI, and accelerometer wearing time. The P values for interaction between sarcopenia characteristics and each level of physical activity were calculated with multivariate CPH model. Statistical significance was set at P < 0.05. Statistical analyses were performed using R version 3.6.2 (R core team, Vienna, Australia).
Role of the funding source
This work was supported by Strategic Basic Research Programs Redesigning Communities for Aged Society (RISTEX) of the Japan Science and Technology Agency (JST), Health and Labor Sciences Research Grants, and joint research with Kao Corporation.
Results
Participant characteristics
Table 1 presents the characteristics of all the study participants (n = 2149) and each group of sarcopenia characteristics. Robust, low muscle mass, low physical function, and sarcopenia were diagnosed in 1175 (mean age: 74.7 ± 3.4 years, women: 53.9%), 176 (mean age: 75.1 ± 3.8 years, women: 50.6%), 674 (mean age: 76.7 ± 4.5 years, women: 62.5%), and 124 (mean age: 77.7 ± 6.6 years, women: 44.4%) individuals, respectively. Age, sex, education years, GDS scores, MMSE scores, prevalence of comorbidities (hypertension, diabetes, osteoporosis, and respiratory disease), number of medications, BMI, SMI, grip strength, walking speed, and amount of LPAs and MVPAs were significantly different between groups. Mean LPA times were 43.8 ± 18.0, 45.6 ± 17.5, 45.4 ± 16.6, 40.8 ± 18.6, and 41.4 ± 18.5 min/day and MVPA times were 24.6 ± 17.6, 26.3 ± 18.3, 27.2 ± 17.3, 21.6 ± 16.3, and 21.5 ± 16.4 min/day in all participants, the robust, low muscle mass, low physical function, and sarcopenia groups, respectively. Median values for all participants were 41.1 min/day for LPA and 20.4 min/day for MVPA. Higher LPA was observed in 1098 (51.1%), 660 (56.2%), 97 (55.1%), 284 (42.1%), and 57 (46.0%) in all participants, the robust, low muscle mass, low physical function, and sarcopenia groups, respectively. Higher MVPA was observed in 1088 (50.6%), 637 (54.2%), 104 (59.0%), 290 (43.0%), and 57 (46.0%) in all participants, the robust, low muscle mass, low physical function, and sarcopenia groups, respectively.
TABLE 1.
Characteristics of subjects and comparison between groups
| All subjects (n = 2149) | Robust (n = 1175) | Low muscle mass (n = 176) | Low physical function (n = 674) | Sarcopenia (n = 124) | P value | |
|---|---|---|---|---|---|---|
| Age, y | 75.5 ± 4.0 | 74.7 ± 3.4 | 75.1 ± 3.8 | 76.7 ± 4.5 | 77.7 ± 6.6 | <0.001 |
| Sex, women, n (%) | 1,198 (55.7) | 633 (53.9) | 89 (50.6) | 421 (62.5) | 55 (44.4) | <0.001 |
| Education, years | 12.0 ± 2.6 | 12.3 ± 2.6 | 12.6 ± 2.4 | 11.4 ± 2.7 | 11.8 ± 2.6 | <0.001 |
| GDS score, points | 2.65 ± 2.6 | 2.3 ± 2.4 | 2.6 ± 2.6 | 3.1 ± 2.8 | 3.3 ± 2.6 | <0.001 |
| MMSE scores, points | 26.3 ± 2.4 | 26.6 ± 2.3 | 26.5 ± 2.2 | 25.9 ± 2.6 | 25.4 ± 2.7 | <0.001 |
| Comorbidity | ||||||
| Heart disease, n (%) | 376 (17.6) | 196 (16.8) | 30 (17.0) | 129 (19.2) | 21 (16.9) | 0.598 |
| Hypertension, n (%) | 985 (45.8) | 563 (48.0) | 42 (23.9) | 346 (51.3) | 34 (27.4) | <0.001 |
| Diabetes, n (%) | 242 (11.3) | 106 (9.0) | 17 (9.7) | 104 (15.4) | 15 (12.1) | <0.001 |
| Hyperlipidaemia, n (%) | 895 (41.6) | 506 (43.1) | 61 (34.7) | 291 (43.2) | 37 (29.8) | 0.006 |
| Osteoporosis, n (%) | 363 (16.9) | 164 (14.0) | 31 (17.6) | 139 (20.6) | 29 (23.4) | 0.001 |
| Respiratory disease, n (%) | 380 (17.7) | 195 (16.6) | 42 (23.9) | 102 (15.1) | 41 (33.3) | <0.001 |
| Number of medications, n | 3.2 ± 2.6 | 2.9 ± 2.5 | 2.5 ± 2.1 | 3.9 ± 2.8 | 3.7 ± 3.3 | <0.001 |
| Current smoker, n (%) | 118 (5.5) | 63 (5.4) | 9 (5.1) | 36 (5.3) | 10 (8.1) | 0.166 |
| Current alcohol drinker, n (%) | 874 (40.7) | 499 (42.5) | 81 (46.0) | 256 (38.0) | 38 (30.6) | 0.005 |
| BMI, kg/m2 | 22.8 ± 2.9 | 23.3 ± 2.4 | 18.6 ± 1.4 | 23.7 ± 2.7 | 18.7 ± 1.9 | <0.001 |
| SMI, kg/m2 | 7.01 ± 0.94 | 7.18 ± 0.87 | 6.02 ± 0.62 | 7.14 ± 0.91 | 6.01 ± 0.67 | <0.001 |
| Grip strength, kg | 26.3 ± 7.5 | 28.4 ± 7.0 | 27.4 ± 6.9 | 23.1 ± 7.4 | 22.1 ± 6.2 | <0.001 |
| Walking speed, m/s | 1.11 ± 0.21 | 1.21 ± 0.15 | 1.24 ± 0.17 | 0.92 ± 0.17 | 0.97 ± 0.20 | <0.001 |
| Accelerometer wearing time, min/day | 851.2 ± 115.25 | 854.4 ± 115.2 | 861.3 ± 118.3 | 843.6 ± 113.2 | 847.8 ± 119.2 | 0.058 |
| LPA, min/day | 43.8 ± 18.0 | 45.6 ± 17.5 | 45.4 ± 16.6 | 40.8 ± 18.6 | 41.4 ± 18.5 | <0.001 |
| Higher LPA (≥41.4 min/day), n (%) | 1,098 (51.1) | 660 (56.2) | 97 (55.1) | 284 (42.1) | 57 (46.0) | <0.001 |
| MVPA, min/day | 24.6 ± 17.6 | 26.3 ± 18.3 | 27.2 ± 17.3 | 21.6 ± 16.3 | 21.5 ± 16.4 | <0.001 |
| Higher MVPA (≥20.4 min/day), n (%) | 1,088 (50.6) | 637 (54.2) | 104 (59.0) | 290 (43.0) | 57 (46.0) | <0.001 |
| Disability incidence, n (%) | 321 (15.4) | 114 (10.0) | 18 (10.7) | 151 (22.9) | 38 (33.6) | <0.001 |
BMI, body mass index; GDS, Geriatric Depression Scale; LPA, light‐intensity physical activity; MMSE, Mini‐Mental State Examination; MVPA, moderate‐to‐vigorous intensity physical activity; SMI, skeletal muscle index.
Data were expressed as mean ± SD or percentage. Kruskal–Wallis test for continuous variables and χ 2‐test for categorical variable were carried out.
Disability incidence rates were calculated except for 68 subjects who could not be followed up.
Overall, 5 year incidence of disability was observed in 321 out of 2081 participants (15.4%), except for 68 who could not be followed up due to death or relocation to another region. Mean follow‐up period until disability incidence from baseline assessment was 33.3 ± 16.2 months. Disability incidence rates were highest in individuals with sarcopenia (33.6%) and second highest in those with low physical function (22.9%). Individuals in the low muscle mass group had a similar incidence rate as those in the robust group (10.7% and 10.0%). Figure 2 shows the 5 year incidence rates of disability stratified by amount of LPA and MVPA. Individuals with higher LPA and MPVA amounts had lower disability incidence regardless of the sarcopenia characteristics.
Figure 2.

Five‐year disability incident rate stratified by (A) the amount of light‐intensity physical activity and (B) the amount of moderate‐to‐vigorous intensity physical activity. Higher activity individuals are those with light or moderate‐to‐vigorous intensity physical activity time per day of 50 percentile or more.
Results of cox proportional hazard model
In the multivariate CPH model, participants classified as sarcopenia [hazard ratio (HR), 2.31; 95% confidence interval (CI), 1.48–3.62; P < 0.001] or low physical function group (HR, 1.49; 95% CI, 1.14–1.95; P = 0.003) had an increased risk of disability incidence compared with robust group (Table 2). Figure 3 shows the HRs of disability incidence associated with high vs. low time spent in LPA and MVPA for all participants and each group. HRs, 95% CIs, and P values are shown in Tables 3 and 4. Multivariate models suggest that higher LPA was associated with a lower risk of disability in the sarcopenia group (HR, 0.35; 95% CI, 0.15–0.85; P = 0.019) and MVPA was associated with a lower risk of disability in the robust (HR, 0.58; 95% CI, 0.39–0.87; P = 0.008) and low physical function (HR, 0.66; 95% CI, 0.45–0.98; P = 0.040) groups. Neither LPA (HR, 1.36; 95% CI, 0.36–5.22; P = 0.649) nor MVPA (HR, 0.33; 95% CI, 0.10–1.10; P = 0.070) was associated with the low muscle mass group. The P values for interaction were 0.017 for LPA and 0.014 for MVPA.
TABLE 2.
Hazard ratios and 95% confidence intervals for 5 year incidence of disability according to sarcopenia characteristics.
| Crude model | Adjusted model | |||||
|---|---|---|---|---|---|---|
| Hazard ratio | 95% CI | P value | Hazard ratio | 95% CI | P value | |
| Sarcopenia characteristics | ||||||
| Robust | Reference | Reference | ||||
| Low muscle mass | 1.07 | 0.65–1.75 | 0.803 | 1.07 | 0.62–1.84 | 0.821 |
| Low physical function | 2.51 | 1.97–3.20 | <0.001 | 1.49 | 1.14–1.95 | 0.003 |
| Sarcopenia | 3.83 | 2.66–5.53 | <0.001 | 2.31 | 1.48–3.62 | <0.001 |
| Age, years | 1.15 | 1.12–1.17 | <0.001 | |||
| Sex, women | 0.47 | 0.50–0.90 | 0.007 | |||
| Education, years | 1.02 | 0.97–1.07 | 0.466 | |||
| GDS score, points | 1.05 | 1.01–1.09 | 0.024 | |||
| MMSE scores, points | 0.94 | 0.90–0.98 | 0.003 | |||
| Comorbidity | ||||||
| Heart disease | 1.08 | 0.81–1.45 | 0.599 | |||
| Hypertension | 1.04 | 0.81–1.33 | 0.782 | |||
| Diabetes | 1.00 | 0.71–1.41 | 0.995 | |||
| Hyperlipidaemia | 0.72 | 0.56–0.91 | 0.007 | |||
| Osteoporosis | 0.98 | 0.73–1.33 | 0.917 | |||
| Respiratory disease | 1.17 | 0.89–1.55 | 0.251 | |||
| Number of medications | 1.09 | 1.04–1.13 | <0.001 | |||
| Current smoker | 0.87 | 0.48–1.57 | 0.639 | |||
| Current alcohol drinker | 0.89 | 0.68–1.15 | 0.365 | |||
| BMI, kg/m2 | 1.02 | 0.94–1.07 | 0.417 | |||
BMI, body mass index; CI, confidence interval; GDS, Geriatrics Depression Scale; MMSE, Mini‐Mental State Examination.
Statistical significance was determined at P < 0.05.
Figure 3.
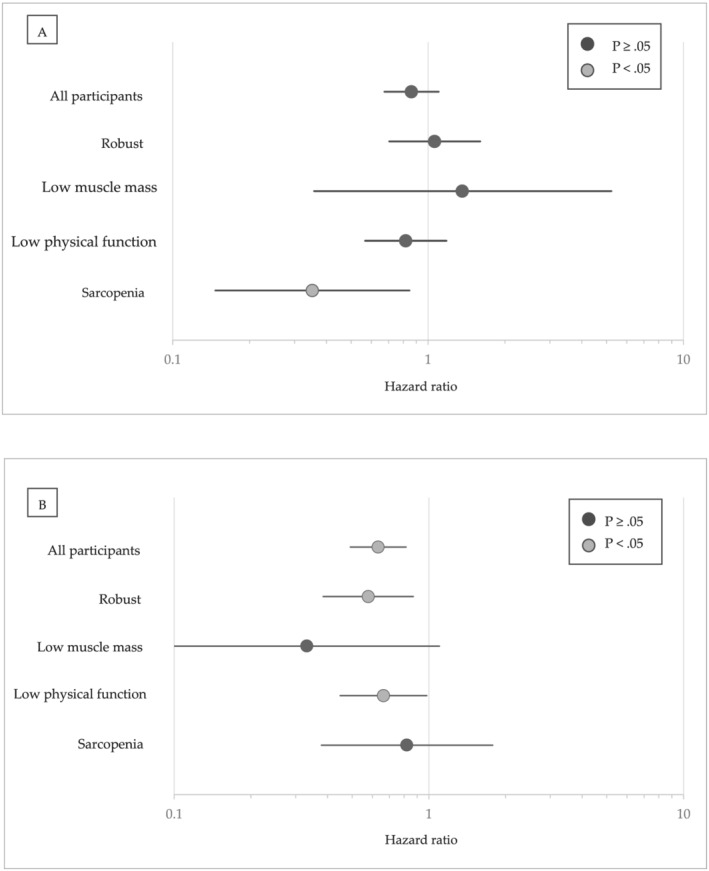
Hazard ratio of disability for individuals with (A) higher amount of light‐intensity physical activity stratified by sarcopenia characteristics. (B) Hazard ratio of disability for individuals with higher amount of moderate‐to‐vigorous intensity physical activity stratified by sarcopenia characteristics. Higher activity individuals are those with light or moderate‐to‐vigorous intensity physical activity time per day of 50 percentile or more. Individuals with lower amount of light or moderate‐to‐vigorous intensity physical activity were reference for each hazard ratios.
TABLE 3.
Hazard ratios and 95% confidence intervals for 5 year incidence of disability according to LPA stratified by sarcopenia characteristics
| Crude model | Adjusted model | |||||
|---|---|---|---|---|---|---|
| Hazard ratio | 95% CI | P value | Hazard ratio | 95% CI | P value | |
| All participants | ||||||
| Lower LPA | Reference | Reference | ||||
| Higher LPA | 0.59 | 0.47–0.74 | <0.001 | 0.86 | 0.68–1.10 | 0.224 |
| Sarcopenia characteristics | ||||||
| Robust | ||||||
| Lower LPA | Reference | Reference | ||||
| Higher LPA | 0.71 | 0.49–1.02 | 0.065 | 1.06 | 0.71–1.60 | 0.778 |
| Low muscle mass | ||||||
| Lower LPA | Reference | Reference | ||||
| Higher LPA | 0.82 | 0.33–2.07 | 0.676 | 1.36 | 0.36–5.22 | 0.649 |
| Low physical function | ||||||
| Lower LPA | Reference | Reference | ||||
| Higher LPA | 0.66 | 0.47–0.92 | 0.014 | 0.82 | 0.57–1.18 | 0.281 |
| Sarcopenia | ||||||
| Lower LPA | Reference | Reference | ||||
| Higher LPA | 0.44 | 0.22–0.88 | 0.020 | 0.35 | 0.15–0.85 | 0.019 |
CI, confidence interval; LPA, light‐intensity physical activity.
Adjusted for age, sex, education, Geriatrics Depression Scale, Mini‐Mental State Examination, body mass index, number of medications, heart disease, hypertension, hyperlipidaemia, diabetes, osteoporosis, respiratory disease, smoking status, alcohol status, moderate‐to‐vigorous intensity physical activity, and accelerometer wearing time. Statistical significance was determined at P level of less than 0.05.
TABLE 4.
Hazard ratios and 95% confidence intervals for 5 year incidence of disability according to MVPA stratified by sarcopenia characteristics
| Crude model | Adjusted model | |||||
|---|---|---|---|---|---|---|
| Hazard ratio | 95% CI | P value | Hazard ratio | 95% CI | P value | |
| All participants | ||||||
| Lower MVPA | Reference | Reference | ||||
| Higher MVPA | 0.46 | 0.36–0.57 | <0.001 | 0.63 | 0.49–0.81 | <0.001 |
| Sarcopenia characteristics | ||||||
| Robust | ||||||
| Lower MVPA | Reference | Reference | ||||
| Higher MVPA | 0.52 | 0.36–0.76 | 0.001 | 0.58 | 0.39–0.87 | 0.008 |
| Low muscle mass | ||||||
| Lower MVPA | Reference | Reference | ||||
| Higher MVPA | 0.41 | 0.16–1.05 | 0.062 | 0.33 | 0.10–1.10 | 0.070 |
| Low physical function | ||||||
| Lower MVPA | Reference | Reference | ||||
| Higher MVPA | 0.46 | 0.33–0.66 | <0.001 | 0.66 | 0.45–0.98 | 0.040 |
| Sarcopenia | ||||||
| Lower MVPA | Reference | Reference | ||||
| Higher MVPA | 0.57 | 0.30–1.10 | 0.096 | 0.82 | 0.38–1.78 | 0.616 |
CI, confidence interval; MVPA, moderate‐to‐vigorous intensity physical activity.
Adjusted for age, sex, education, Geriatrics Depression Scale, Mini‐Mental State Examination, body mass index, number of medications, heart disease, hypertension, hyperlipidaemia, diabetes, osteoporosis, respiratory disease, smoking status, alcohol status, light‐intensity physical activity, and accelerometer wearing time. Statistical significance was determined at P level of less than 0.05.
Discussion
In the present longitudinal survey of community‐dwelling older Japanese people, we identified 31.4%, 8.2%, and 5.8% individuals with low physical function, low muscle mass, and sarcopenia, respectively. Individuals with low physical function and sarcopenia had significantly higher risk for disability compared with robust. Disability incidence rate was lower in individuals with higher LPA and MVPA among all participants and in each group according to sarcopenia characteristics. In the multivariate CPH model, higher physical activity was associated with a lower incidence of disability in the robust, low physical function, and sarcopenia groups, but related physical activity intensity was different between groups. In the robust and low physical function groups, higher MVPA was protective against disability incidence, whereas there was no evidence in LPA. In the sarcopenia group, higher LPA was protective against disability incidence, whereas there was no evidence in MVPA. Higher physical activity showed no association with disability incidence in the low muscle mass group.
The prevalence of lower physical function, low muscle mass, and sarcopenia were 31.4%, 8.2%, and 5.8% in a previous study. The prevalence rates of sarcopenia detected using AWGS criteria in Japanese community‐dwelling older adults were 9.8% in men and 10.1% in women. 4 Compared with this previous report, our participants had lower prevalence rates. In the present study, participants without objectively measured physical activity were excluded, and the remaining participants relatively had favourable physical function. Physical activity, both MVPA and LPA time, was particularly decreased in the low physical function and sarcopenia group. In contrast, physical activity in the low muscle mass group that consists of individuals with low SMI and normal physical function was not decreased compared with the robust group. Previous study indicated that loss of muscle mass leads to a decline in its function and even loss in physical activity. 9 Individuals in the low physical function and sarcopenia group might have low physical activity due to deteriorated physical function, whereas those in the low muscle mass group maintained physical activity.
Disability incidence was most observed in the sarcopenia group, followed by the low physical function group. These results are consistent with those of previous studies. 27 , 28 , 29 However, the low muscle mass group had a similar incidence rate with the robust group. In a recent review, 30 lower muscle mass was reportedly a significant risk factor for disability in older adults but risk of disability for individuals with low muscle mass alone was still inconsistent. 8 , 31 , 32 , 33 , 34 Other previous studies have shown muscle function strongly predicting disability incidence compared with muscle mass volume. In addition, muscle integrity of low muscle mass assessed using phase angle of BIA is reportedly not different for robust. 35 Subjects in low muscle mass group had lower disability risk and that was not different compared with the robust group.
In the present study, higher MVPA was associated with lower disability incidence in the robust and low physical function groups, and higher LPA was associated with sarcopenia. MVPA was reportedly associated with a lower risk of disability for older adults including individuals with low physical function. 16 , 36 The results of the present study were in line with these previous studies. Recent guideline of physical activity stated that MVPA, in particular, is recommended to maintain cardiorespiratory and muscular fitness, cognitive function, and physiological health for older adults. 21 Those with higher MVPA in the robust and low physical function groups might reduce the risk of disability via maintaining physical function. Moderate or above intensity is needed to prevent disability for older adults without sarcopenia. In the present study, we did not analyse the subjects by sex, and influence of sex difference was adjusted in multivariate models. Previous studies investigated objectively measured physical activity and loss of lean body mass separately for men and women. Steps and MVPA to identify the risk of lean body mass loss were reportedly higher in men. 37 , 38 Further study that identifies the effect of physical activity by sex is needed.
The LPA was associated with disability incidence for individuals in the sarcopenia group although both LPA and MVPA were associated with physical function in older adults. 39 , 40 Ability of oxygen consumption due to low skeletal muscle mass and physical function might affect these associations. Fat‐free mass, primarily skeletal muscle, is associated with blood volume and stroke volume. 18 Previous studies reported that SMI is associated with cardiorespiratory fitness in older adults. 19 , 41 In addition, low physical function is associated with low peak VO2. 42 Individuals in the sarcopenia group who had both lower skeletal muscle mass and physical function might have lower cardiorespiratory fitness compared with those in other groups. Although intensity criteria of LPA in the present study was a generally accepted range, 21 LPA was of higher intensity for the sarcopenia group compared with the non‐sarcopenia group because of the decreased cardiorespiratory fitness. LPA was the favourable intensity for disability prevention in participants with sarcopenia, and physical activity intensity was better to increase with recovery of physical function.
Contrarily, higher physical activity—both MVPA and LPA—did not show significant association with disability incidence in the low muscle mass group. MVPA may relate to disability incidences in the low muscle mass group via promoting skeletal muscle synthesis, maintaining physical function, and mitigating frail cycle. The low statistical power was considered for this result. Low muscle mass group had small numbers of individuals with disability incidence due to smaller sample size and similar prevalence of disability incidence compared with the robust group. To clarify association of physical activity and disability incidence in low muscle mass individuals, future study with larger sample size is needed.
In general, resistance training and nutritional intervention are effective treatments for disability prevention in older adults with sarcopenia and low physical function. 10 , 11 , 43 However, the association between the pattern of daily physical activity outside training or treatment and disability incidence in older adults with sarcopenia or low physical function has been unclear. The result of the present study clarifies these associations and is useful for preventive strategies for disability. Recommended physical activity intensities are different due to sarcopenia characteristics. Daily physical activity promotion as additional treatment for sarcopenia should start with light‐intensity and the intensity should be increased along with recovery.
The major strengths of the present study are the relatively large sample size and the use of a triaxial accelerometer to measure physical activity. Physical activity data in the present study had higher validity compared with those obtained via a questionnaire. In addition, the incidence of disability was measured as a monthly follow‐up using social data from the mandatory LTCI in Japan. This criterion of disability incidence is common in Japan. The results of the present study have high generalizability because of large sample size, valid assessment, and common outcome measurements.
Limitations
The present study had several limitations. First, the participants of the present study were in relatively good health and had good physical function. Participants could independently participate in a baseline survey at the community centre, and the use of the accelerometer given to all participants was optional. A previous study showed that non‐participation in accelerometry was associated with several cardiometabolic risk factors. 44 The self‐selection bias in the baseline survey and accelerometry may have resulted in our underestimating the incidence of disability. Second, the accelerometer that we provided could not discriminate several movements, including ergometer and machine exercise. Physical activity data in the present study were underestimated in individuals who had these exercise habits. Third, physical activity data were corrected only 14 days after the baseline survey, and longitudinal change was unclear. Several patterns of physical activity trajectory in older adults including stable, increasing, or decreasing were reported. 45 These fluctuations might affect disability incidence of the present study. Finally, some potential confounding factors were lacked in the present study. Detailed nutritional assessment had not been measured, whereas malnutrition relates to sarcopenia and disability incidence for older adults. 3 , 46 In addition, time spent in sedentary time was not included in the analysis due to lack of accuracy, because we had not asked the participants to wear off the accelerometer during sleeping time. Prolonged sedentary time is associated with sarcopenia and muscle atrophy due to inflammation. 47 , 48 Future study is needed to adjust such critical confounders.
In conclusion, physical activities were associated with a lower incidence of disability in community‐dwelling older adults, but activities of related intensities were different between sarcopenia characteristics. These findings indicate the importance of muscle condition assessment and the need for an individualized approach to prevent disability.
Funding
This work was supported by Strategic Basic Research Programs Redesigning Communities for Aged Society (RISTEX) of the Japan Science and Technology Agency (JST); Health Labour Sciences Research Grants from the Japanese Ministry of Health, Labour and Welfare; Research project on health and welfare promotion for the elderly, the Research Funding for Longevity Sciences (24‐18, 25‐26, 27‐22) from the National Center for Geriatrics and Gerontology and joint research with Kao Corporation.
Conflicts of interest
H. S. received grant funding from Kao Corporation. The other authors have no conflict of interest to disclose.
Acknowledgements
We wish to thank the health‐care staff for their assistance with the study assessments. We would like to thank Editage (www.editage.jp) for English language editing. We would like to thank the JSPS KAKENHI Grant‐in‐Aid for Young Scientists (grant number: 20K18975) for their support.
Chiba I., Lee S., Bae S., Makino K., Shinkai Y., Katayama O., Harada K., Takayanagi N., and Shimada H. (2021) Difference in sarcopenia characteristics associated with physical activity and disability incidences in older adults, Journal of Cachexia, Sarcopenia and Muscle, 12, 1983–1994, 10.1002/jcsm.12801
References
- 1. Cabinet Office Japan . Annual report on the ageing society; 2020. https://www8.cao.go.jp/kourei/whitepaper/w‐2020/zenbun/02pdf_index.html
- 2. Stuck AE, Walthert JM, Nikolaus T, Büla CJ, Hohmann C, Beck JC. Risk factors for functional status decline in community‐living elderly people: a systematic literature review. Soc Sci Med 1999;48:445–469. [DOI] [PubMed] [Google Scholar]
- 3. Woo J. Sarcopenia. Clin Geriatr Med 2017;33:305–314. [DOI] [PubMed] [Google Scholar]
- 4. Makizako H, Nakai Y, Tomioka K, Taniguchi Y. Prevalence of sarcopenia defined using the Asia Working Group for Sarcopenia criteria in Japanese community‐dwelling older adults: a systematic review and meta‐analysis. Phys Ther Res 2019;22:53–57. [DOI] [PMC free article] [PubMed] [Google Scholar]
- 5. Yamada M, Nishiguchi S, Fukutani N, Tanigawa T, Yukutake T, Kayama H, et al. Prevalence of sarcopenia in community‐dwelling Japanese older adults. J Am Med Dir Assoc 2013;14:911–915. [DOI] [PubMed] [Google Scholar]
- 6. Perera S, Patel KV, Rosano C, Rubin SM, Satterfield S, Harris T, et al. Gait speed predicts incident disability: a pooled analysis. Journals Gerontol ‐ Ser A Biol Sci Med Sci 2015;71:63–71. [DOI] [PMC free article] [PubMed] [Google Scholar]
- 7. Health JN. Muscle weakness and physical disability in older Americans. 2017:1–7. https://static1.squarespace.com/static/5967d35f9de4bb164aaa3c57/t/59ad5eadd482e948b59345d5/1504534212386/Muscle+weakness+and+physical+disability+in+older+Americans
- 8. Tanimoto Y, Watanabe M, Sun W, Hirota C, Sugiura Y, Kono R, et al. Association between muscle mass and disability in performing instrumental activities of daily living (IADL) in community‐dwelling elderly in Japan. Arch Gerontol Geriatr 2012;54:e230–e233. [DOI] [PubMed] [Google Scholar]
- 9. Fried LP, Tangen CM, Walston J, Newman AB, Hirsch C, Gottdiener J, et al. Frailty in older adults: evidence for a phenotype. Journals Gerontol Ser A Biol Sci Med Sci 2001;56:M146–M157. [DOI] [PubMed] [Google Scholar]
- 10. Beaudart C, Dawson A, Shaw SC, Harvey NC, Kanis JA, Binkley N, et al. Nutrition and physical activity in the prevention and treatment of sarcopenia: systematic review. Osteoporos Int 2017;28:1817–1833. [DOI] [PMC free article] [PubMed] [Google Scholar]
- 11. Wakabayashi H, Sakuma K. Rehabilitation nutrition for sarcopenia with disability: a combination of both rehabilitation and nutrition care management. J Cachexia Sarcopenia Muscle 2014;5:269–277. [DOI] [PMC free article] [PubMed] [Google Scholar]
- 12. Sanchez VM, Schr H, Martínez JA, Vidal J, Buil‐cosiales P. Leisure‐time physical activity at moderate and high intensity is associated with parameters of body composition, muscle strength and sarcopenia in aged adults with obesity and metabolic syndrome from the PREDIMED‐Plus study Estruch. Clin Nutr 2018;38:1324–1331. [DOI] [PubMed] [Google Scholar]
- 13. Yasunaga A, Shibata A, Ishii K, Koohsari MJ, Inoue S, Sugiyama T, et al. Associations of sedentary behavior and physical activity with older adults' physical function: an isotemporal substitution approach. BMC Geriatr 2017;17:1–7. [DOI] [PMC free article] [PubMed] [Google Scholar]
- 14. Yamada M, Nishiguchi S, Fukutani N, Aoyama T, Arai H. Mail‐based intervention for sarcopenia prevention increased anabolic hormone and skeletal muscle mass in community‐dwelling Japanese older adults: the INE (Intervention by Nutrition and Exercise) Study. J Am Med Dir Assoc 2015;16:654–660. [DOI] [PubMed] [Google Scholar]
- 15. Mijnarends DM, Koster A, Schols JMGA, Meijers JMM, Halfens RJG, Gudnason V, et al. Physical activity and incidence of sarcopenia: the population‐based AGES‐Reykjavik study. Age Ageing 2016;45:614–621. [DOI] [PMC free article] [PubMed] [Google Scholar]
- 16. Pahor M, Guralnik JM, Ambrosius WT, Blair S, Bonds DE, Church TS, et al. Effect of structured physical activity on prevention of major mobility disability in older adults: the LIFE study randomized clinical trial. JAMA ‐ J Am Med Assoc 2014;311:2387–2396. [DOI] [PMC free article] [PubMed] [Google Scholar]
- 17. Bunout D, Barrera G, Hirsch S, Jimenez T, De La Maza MP. Association between activity energy expenditure and peak oxygen consumption with sarcopenia. BMC Geriatr 2018;18:1–9. [DOI] [PMC free article] [PubMed] [Google Scholar]
- 18. Hunt BE, Davy KP, Jones PP, DeSouza CA, Van Pelt RE, Tanaka H, et al. Role of central circulatory factors in the fat‐free mass‐maximal aerobic capacity relation across age. Am J Physiol 1998;275:H1178–H1182. [DOI] [PubMed] [Google Scholar]
- 19. Sugie M, Harada K, Takahashi T, Nara M, Ishikawa J, Koyama T, et al. Relationship between skeletal muscle mass and cardiac function during exercise in community‐dwelling older adults: relationship between skeletal muscle mass and cardiac function. ESC Heart Fail 2017;4:409–416. [DOI] [PMC free article] [PubMed] [Google Scholar]
- 20. Garber CE, Blissmer B, Deschenes MR, Franklin BA, Lamonte MJ, Lee IM, et al. Quantity and quality of exercise for developing and maintaining cardiorespiratory, musculoskeletal, and neuromotor fitness in apparently healthy adults: guidance for prescribing exercise. Med Sci Sports Exerc 2011;43:1334–1359. [DOI] [PubMed] [Google Scholar]
- 21. II AMA . Introducing the Physical Activity Guidelines for Americans, 2nd ed. US Dep Heal Hum Serv. https://health.gov/paguidelines/second‐edition/pdf/Physical_Activity_Guidelines_2nd_edition_Presentation.pdf [Google Scholar]
- 22. Kumahara H, Schutz Y, Ayabe M, Yoshioka M, Yoshitake Y, Shindo M, et al. The use of uniaxial accelerometry for the assessment of physical‐activity‐related energy expenditure: a validation study against whole‐body indirect calorimetry. Br J Nutr 2004;91:235–243. [DOI] [PubMed] [Google Scholar]
- 23. Gorman E, Hanson HM, Yang PH, Khan KM, Liu‐Ambrose T, Ashe MC. Accelerometry analysis of physical activity and sedentary behavior in older adults: a systematic review and data analysis. Eur Rev Aging Phys Act 2014;11:35–49. [DOI] [PMC free article] [PubMed] [Google Scholar]
- 24. Chen LK, Liu LK, Woo J, Assantachai P, Auyeung TW, Bahyah KS, et al. Sarcopenia in Asia: consensus report of the Asian working group for sarcopenia. J Am Med Dir Assoc 2014;15:95–101. [DOI] [PubMed] [Google Scholar]
- 25. Yoshida D, Shimada H, Park H, Anan Y, Ito T, Harada A, et al. Development of an equation for estimating appendicular skeletal muscle mass in Japanese older adults using bioelectrical impedance analysis. Geriatr Gerontol Int 2014;14:851–857. [DOI] [PubMed] [Google Scholar]
- 26. Tsutsumimoto K, Doi T, Shimada H, Makizako H, Hotta R, Nakakubo S, et al. Combined effect of slow gait speed and depressive symptoms on incident disability in older adults. J Am Med Dir Assoc 2016;17:123–127. [DOI] [PubMed] [Google Scholar]
- 27. Kelley GA, Kelley KS. Is sarcopenia associated with an increased risk of all‐cause mortality and functional disability? Exp Gerontol 2017;96:100–103. [DOI] [PMC free article] [PubMed] [Google Scholar]
- 28. Da Silva AT, De Oliveira Duarte YA, Ferreira Santos JL, Wong R, Lebrão ML. Sarcopenia according to the European working group on sarcopenia in older people (EWGSOP) versus dynapenia as a risk factor for disability in the elderly. J Nutr Health Aging 2013. [DOI] [PubMed] [Google Scholar]
- 29. Visser M, Goodpaster BH, Kritchevsky SB, Newman AB, Nevitt M, Rubin SM, et al. Muscle mass, muscle strength, and muscle fat infiltration as predictors of incident mobility limitations in well‐functioning older persons. Journals Gerontol ‐ Ser A Biol Sci Med Sci 2005;60:324–333. [DOI] [PubMed] [Google Scholar]
- 30. Wang DXM, Yao J, Zirek Y, Reijnierse EM, Maier AB. Muscle mass, strength, and physical performance predicting activities of daily living: a meta‐analysis. J Cachexia Sarcopenia Muscle 2020;11:3–25. [DOI] [PMC free article] [PubMed] [Google Scholar]
- 31. Janssen I, Heymsfield SB, Ross R. Low relative skeletal muscle mass (sarcopenia) in older persons is associated with functional impairment and physical disability. J Am Geriatr Soc 2002;50:889–896. [DOI] [PubMed] [Google Scholar]
- 32. Tanimoto Y, Watanabe M, Sun W, Tanimoto K, Shishikura K, Sugiura Y, et al. Association of sarcopenia with functional decline in community‐dwelling elderly subjects in Japan. Geriatr Gerontol Int 2013;13:958–963. [DOI] [PubMed] [Google Scholar]
- 33. Hirani V, Naganathan V, Blyth F, le Couteur DG, Seibel MJ, Waite LM, et al. Longitudinal associations between body composition, sarcopenic obesity and outcomes of frailty, disability, institutionalisation and mortality in community‐dwelling older men: the Concord Health and Ageing in Men Project. Age Ageing 2017;46:413–420. [DOI] [PubMed] [Google Scholar]
- 34. Amigues I, Schott AM, Amine M, Gelas‐Dore B, Veerabudun KV, Paillaud E, et al. Low skeletal muscle mass and risk of functional decline in elderly community‐dwelling women: the prospective EPIDOS study. J Am Med Dir Assoc 2013;14:352–357. [DOI] [PubMed] [Google Scholar]
- 35. Yamada M, Kimura Y, Ishiyama D, Nishio N, Otobe Y, Tanaka T, et al. Phase angle is a useful indicator for muscle function in older adults. J Nutr Health Aging 2019;23:251–255. [DOI] [PubMed] [Google Scholar]
- 36. Paterson DH, Warburton DER. Physical activity and functional limitations in older adults: a systematic review related to Canada's physical activity Guidelines. Int J Behav Nutr Phys Act 2010;7:38. [DOI] [PMC free article] [PubMed] [Google Scholar]
- 37. Park H, Park S, Shephard RJ, Aoyagi Y. Yearlong physical activity and sarcopenia in older adults: the Nakanojo study. Eur J Appl Physiol 2010;109:953–961. [DOI] [PubMed] [Google Scholar]
- 38. Shephard RJ, Park H, Park S, Aoyagi Y. Objectively measured physical activity and progressive loss of lean tissue in older Japanese adults: longitudinal data from the Nakanojo study. J Am Geriatr Soc 2013;61:1887–1893. [DOI] [PubMed] [Google Scholar]
- 39. Izawa KP, Shibata A, Ishii K, Miyawaki R, Oka K. Associations of low‐intensity light physical activity with physical performance in community‐dwelling elderly Japanese: a cross‐sectional study. PLoS ONE 2017;12:1–9. [DOI] [PMC free article] [PubMed] [Google Scholar]
- 40. Bann D, Hire D, Manini T, Cooper R, Botoseneanu A, McDermott MM, et al. Light intensity physical activity and sedentary behavior in relation to body mass index and grip strength in older adults: cross‐sectional findings from the lifestyle interventions and independence for elders (LIFE) study. PLoS ONE 2015;10:1–13. [DOI] [PMC free article] [PubMed] [Google Scholar]
- 41. Boo SH, Joo MC, Lee JM, Kim SC, Yu YM, Kim MS. Association between skeletal muscle mass and cardiorespiratory fitness in community‐dwelling elderly men. Aging Clin Exp Res 2019;31:49–57. [DOI] [PubMed] [Google Scholar]
- 42. Binder EF, Birge SJ, Spina R, Ehsani AA, Brown M, Sinacore DR, et al. Peak aerobic power is an important component of physical performance in older women. Journals Gerontol ‐ Ser A Biol Sci Med Sci 1999;54:M353–M356. [DOI] [PubMed] [Google Scholar]
- 43. Yamada M, Arai H, Yoshimura K, Kajiwara Y, Sonoda T, Nishibuchi S, et al. Nutritional supplementation during resistance training improved skeletal muscle mass in community‐dwelling frail older adults. J Frailty Aging 2012;1:64–70. [DOI] [PubMed] [Google Scholar]
- 44. Weymar F, Braatz J, Guertler D, van den Berg N, Meyer C, John U, et al. Characteristics associated with non‐participation in 7‐day accelerometry. Prev Med Rep 2015;2:413–418. [DOI] [PMC free article] [PubMed] [Google Scholar]
- 45. Jefferis BJ, Sartini C, Ash S, Lennon LT, Wannamethee SG, Lee IM, et al. Trajectories of objectively measured physical activity in free‐living older men. Med Sci Sports Exerc 2015;47:343–349. [DOI] [PMC free article] [PubMed] [Google Scholar]
- 46. Beaudart C, Sanchez‐Rodriguez D, Locquet M, Reginster J‐Y, Lengelé L, Bruyère O. Malnutrition as a strong predictor of the onset of sarcopenia. Nutrients 2019;11:2883. [DOI] [PMC free article] [PubMed] [Google Scholar]
- 47. Foong YC, Chherawala N, Aitken D, Scott D, Winzenberg T, Jones G. Accelerometer‐determined physical activity, muscle mass, and leg strength in community‐dwelling older adults. J Cachexia Sarcopenia Muscle 2016;7:275–283. [DOI] [PMC free article] [PubMed] [Google Scholar]
- 48. Buford TW, Cooke MB, Manini TM, Leeuwenburgh C, Willoughby DS. Effects of age and sedentary lifestyle on skeletal muscle NF‐kappaB signaling in men. J Gerontol A Biol Sci Med Sci 2010;65A:532–537. [DOI] [PMC free article] [PubMed] [Google Scholar]