Abstract
The cornea’s mechanical response to intraocular pressure elevations may alter in ectatic diseases such as keratoconus. Regional variations of mechanical deformation in normal and keratoconus eyes during intraocular pressure elevation have not been well-characterized. We applied a high-frequency ultrasound elastography technique to characterize the regional deformation of normal and keratoconus human corneas through the full thickness of corneal stroma. A cross-section centered at the corneal apex in 11 normal and 2 keratoconus human donor eyes was imaged with high-frequency ultrasound during whole globe inflation from 5 to 30 mmHg. An ultrasound speckle tracking algorithm was used to compute local tissue displacements. Radial, tangential, and shear strains were mapped across the imaged cross-section. Strains in the central (1 mm surrounding apex) and paracentral (1 to 4 mm from apex) regions were analyzed in both normal and keratoconus eyes. Additional regional analysis was performed in the eye with severe keratoconus presenting significant thinning and scarring. Our results showed that in normal corneas, the central region had significantly smaller tangential stretch than the paracentral region, and that within the central region, the magnitudes of radial and shear strains were significantly larger than that of tangential strain. The eye with mild keratoconus had similar shear strain but substantially larger radial strains than normal corneas, while the eye with severe keratoconus had similar overall strains as in normal eyes but marked regional heterogeneity and large strains in the cone region. These findings suggested regional variation of mechanical responses to intraocular pressure elevation in both normal and keratoconus corneas, and keratoconus appeared to be associated with mechanical weakening in the cone region, especially in resisting radial compression. Comprehensive characterization of radial, tangential, and shear strains through corneal stroma may provide new insights to understand the biomechanical alterations in keratoconus.
Keywords: High-frequency ultrasound, ultrasound elastography, corneal biomechanics, intraocular pressure, mechanical deformation, keratoconus
Impact statement
Corneal biomechanical properties are important for its shape and function. There is a knowledge gap in the spatial heterogeneity of biomechanical properties in normal and keratoconic corneas. Using a high-frequency ultrasound elastography technique, we characterized the regional variations in the cornea’s mechanical responses to intraocular pressure change. Radial, tangential, and shear strains through-the-thickness of corneal stroma were quantified in normal and keratoconic corneas, extending previous works that reported surface tangential strains. We found different regional variations for different types of strains in normal corneas. We also found that radial strains were substantially larger in the cone region of both mild and severe keratoconus as compared to normal corneas, suggesting mechanical weakening in radial direction. These findings help fill the knowledge gap in understanding the regional variations in corneal mechanical responses to intraocular pressure and provide new insights into the biomechanical alterations in keratoconus.
Introduction
The cornea is a transparent and avascular tissue occupying 1/6th of the ocular shell. The shape and the physical properties (e.g. optical and mechanical properties) of the cornea play an important role for visual acuity. In the disease of keratoconus (KC), the cornea becomes cone-shaped with local thinning and topographic changes. This abnormal shape causes significant vision impairment, and KC has been one of the leading indications for corneal transplant. 1 Advanced imaging techniques have been developed to analyze corneal topography and tomography in an effort to detect early morphological changes in KC. Mechanical instability of the cornea is also thought to play a role in KC development and progression. 2 , 3 Microstructural analysis showed marked changes in corneal stromal extracellular matrix (ECM) in the cone region of KC corneas, including reorganization and redistribution of collagen lamellae 4 , 5 and changes of proteoglycan expression (e.g. stroma keratocan increased significantly in KC). 6 The stroma accounts for nearly 90% of corneal thickness and is the primary structure responsible for corneal biomechanical properties. 7 Regional changes in stromal ECM are likely associated with regional changes in corneal biomechanical properties. However, how corneal biomechanics are altered in KC is not well understood.
Mechanical testing on dissected corneal strips showed reduced tensile modulus in KC corneas as compared with normal human corneas. 8 , 9 In vivo measurements using air puff-based techniques such as the ocular response analyzer (ORA) or CorvisST also showed significant yet small differences in the deflection responses of KC and normal corneas to an air puff excitation. 10 , 11 These methods measure the deflection responses of the whole cornea, limiting their ability to spatially resolve potentially heterogeneous regional corneal properties implicated in KC. Another line of efforts in the field aimed to measure corneal deformation in response to intraocular pressure (IOP) elevation. Optical imaging was used to quantify corneal surface strains.12–14 Tomographic imaging methods such as optic coherence tomography (OCT)15–17 and high-frequency ultrasound 18 , 19 have also been applied to characterize corneal deformation under various loads. However, few studies have reported the regional response of the cornea stroma to IOP elevations.
The primary objective of the present study was to characterize the regional deformation of the human corneal stroma to fill the knowledge gap in understanding how human corneas deform under the most relevant in vivo mechanical loading, the elevations, and fluctuations of IOP. High-frequency ultrasound offers excellent tissue penetration and spatial resolution (30 μm axially and 75 μm laterally) for imaging the cornea. 20 We have developed and validated a high-frequency ultrasound elastography technique that can achieve very high displacement sensitivity at the level of tens of nanometers. 21 , 22 More importantly, this technique allows us to spatially resolve the different types of deformation experienced by the cornea when subjected to an IOP elevation, including regional tangential, radial, and shear strains. Using this technique, we measured stroma deformation in 11 normal human corneas and 2 KC corneas. The experimental results were compared with predictions from simplified finite element models assuming isotropic tissue properties. The data from this study may provide a useful baseline for understanding the mechanical behavior of normal human corneas, as well as insights into potential mechanical alterations in KC.
Materials and methods
Donor globes
Eleven globes from nine donors (five male and four female) with no known corneal diseases or abnormalities were obtained from the Lions Eye Bank of West Central Ohio (Dayton, OH, USA). The donor age ranged from 41 to 76 years old (y. o.) (Mean ± SD: 63 ± 11 y. o.). The globes were recovered within 12 h postmortem and experiments were completed within 36 h postmortem. Two globes from two keratoconus (KC) donors were also included in this study. They were obtained from Lions VisionGift Eye Bank (Portland, OR, USA) within 24 h postmortem and experiments were completed within 96 h postmortem. One KC donor (KC1) was a 49 y.o. male with mild corneal thinning and irregular corneal topography in the central cornea. The other KC donor (KC2, 84 y.o. female) had late-stage KC with apical scarring and an apparent inferior cone with significant corneal thinning. All globes were stored in moist containers at 4°C until experimental use.
Inflation testing with high-frequency ultrasound scanning
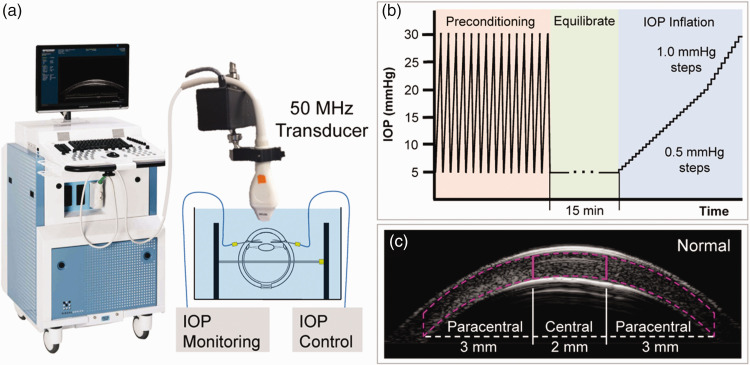
Prior to inflation, extraocular tissues were removed, and the globes were secured to a custom-built holder (Figure 1(a)) by two spinal needles with the cornea facing upwards. Two 20-gauge needles were inserted into the anterior chamber via the limbus, one connected to a programmable syringe pump (PhD Ultra, Harvard Apparatus, Boston, MA) and the other to a pressure sensor (P75, Harvard Apparatus, Boston, MA) to control and continuously monitor IOP. To reduce post-mortem corneal swelling and return the corneas to physiological hydration, the globes were immersed in and perfused with 4.25% poloxamer 188 (P188)/phosphate-buffered saline (PBS) at 4°C with IOP maintained at 15 mmHg for at least 18 h until the corneal thickness returned to normal range and stabilized. 23 The globes remained immersed in the same solution during inflation tests.
Figure 1.
Experimental setup for high-frequency ultrasound imaging of corneal deformation during IOP elevation. (a) Globes were immersed in P188/PBS solution with IOP control and monitoring. (b) Testing protocol for inflating donor eyes from 5 to 30 mmHg. (c) Segmentation of central and paracentral regions of corneal stroma. (A color version of this figure is available in the online journal.)
For all inflation testing, control of the testing apparatus and data acquisition were implemented using a customized LabView program (National Instruments, Austin, TX, USA). The globes were first preconditioned with 25 cycles of pressurization from 5 to 30 mmHg at 2 s per cycle before equilibrating at 5 mmHg for 15 min. The inflation tests were performed by gradually increasing IOP from 5 to 20 mmHg in 0.5 mmHg steps, and then from 20 to 30 mmHg with 1.0 mmHg steps (Figure 1(b)). The IOP was held constant at each pressure level for 30 s before ultrasound scans were acquired using a 50 MHz ultrasound probe (MS700, Vevo2100, FujiFilm VisualSonics Inc., Toronto). Each inflation test took about 20 min to complete for a total of 41 pressure steps (from 5 to 30 mmHg). Normal globes were scanned along the nasal-temporal (NT) meridian capturing approximately 10 mm in width centered at the corneal apex. KC globes were scanned along both the NT and superior-inferior (SI) meridians, with a 30-min equilibration time at 5 mmHg between the two sets of scans.
High-frequency ultrasound elastography
A correlation-based ultrasound speckle tracking algorithm was used to calculate displacements and strains of the corneal stroma at each step of IOP elevation. 24 Digitized ultrasound radiofrequency (RF) data were acquired during ultrasound scanning at a sampling interval of 1.5 µm × 19 µm (axial × lateral). A region of interest (ROI) was automatically defined in the scanned image to include only the corneal stroma, bound by the anterior and posterior corneal surfaces corresponding to the bright boundaries in the image (Figure 1(c)). Within the ROI, the RF data were divided into kernels, each containing 101 × 41 pixels (150 μm × 780 μm). 25 A 75% kernel overlap was used to improve spatial resolution of the displacement and strain maps. 26 The displacement of each kernel was computed by cross-correlation between RF frames at successive IOP levels within a search window. The new location of the kernel was identified by maximum correlation coefficient interpolated to subpixel resolution. The cumulative displacement vectors were calculated with respect to the kernel location at the initial IOP.
Strains were calculated using least squares estimation based on local displacement gradient in a 5 × 5 neighborhood of kernels. 27 Radial, tangential, and shear strains were obtained by coordinate transformation from Cartesian to the polar coordinates based on the tissue curvature to eliminate the effect of pure rotation and better correspond to the shape of the cornea. Displacement and strain maps were generated to visualize their spatial distribution interpolated to the pixel level.
Cornea regional deformation analysis
For regional analysis, the corneal stroma was segmented into central and paracentral regions. The central region was defined as the corneal stroma within 1-mm distance from the apex and the paracentral region was defined as the corneal stroma between 1 and 4 mm distance from the apex (Figure 1(c)). The apex was identified as the point where the anterior corneal boundary intersected with a vertical line extending from the cornea’s center of curvature, which was defined by fitting two concentric curves along the anterior and posterior corneal boundaries using nine manually selected points on each boundary. Average displacement and strain were obtained for each region. The deformation of these two regions in the normal donor corneas was compared using paired t-tests and Pearson correlations. For KC1, since it had a central cone, the central and paracentral strains were calculated for comparison with normal corneas. For KC2, in addition to the central and paracentral regions, the cone and scar regions were also segmented for comparison. The center of the cone was defined as the thinnest point calculated between the anterior and posterior corneal surfaces, and the surrounding 0.25 mm of stroma was defined as the cone. The lateral boundaries of the scar were identified manually based on its bright ultrasonic appearance in the image. The stroma within the width of the scar was defined as the scar region of KC2.
Finite element model
A 2D axisymmetric finite element model of the human eye was built in COMSOL Multiphysics (COMSOL, Inc., Burlington, MA) to compare with the experimental data. The model included a sclera (outer radius = 12 mm, thickness = 0.8 mm) and a cornea (outer radius = 9 mm, inner radius = 8 mm). The cornea merged with the sclera at 6 mm from the axis of symmetry. To simulate a normal cornea, its thickness decreased from 0.8 mm at the periphery to 0.52 mm at the apex. To simulate a cornea with mild KC, its thickness decreased from 0.8 mm at the periphery to 0.48 mm at the apex. Simplified material properties were used to model both the cornea and the sclera, and they were assumed to be linear elastic, isotropic, and homogeneous. The modulus of sclera was 5 MPa, 28 and the modulus for normal cornea was 1 MPa. 29 The modulus of the mild KC cornea was reduced to 0.5 MPa. Two other KC models were also tested: one with modulus reduced to 0.5 MPa and thickness at apex kept at 0.52 mm; and the other with modulus kept at 1 MPa and thickness at apex reduced to 0.48 mm. To optimize the simulation efficiency and accuracy, a mesh convergence study was conducted. A mesh with 14,535 quadratic triangular elements was chosen. A pressure from 5 mmHg to 30 mmHg was applied to the inner surface of the shell. The same regional analysis of central and paracentral corneal strains used for the experimental data was also performed on the simulated data.
Results
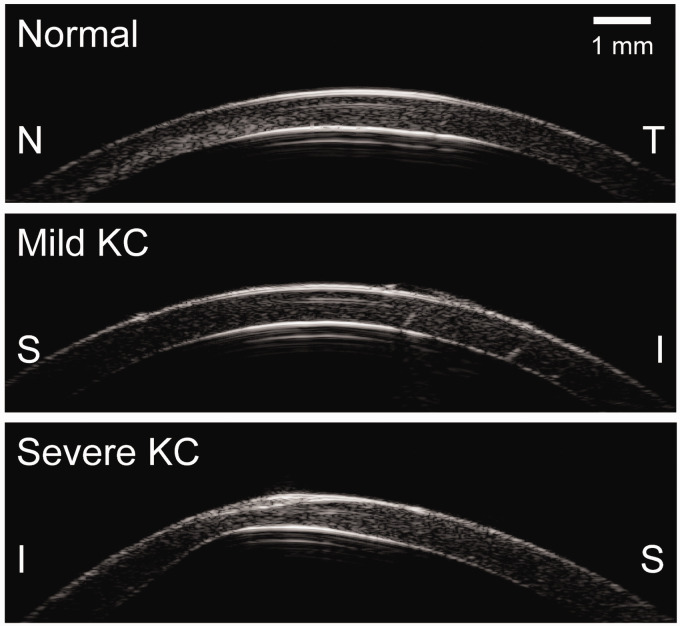
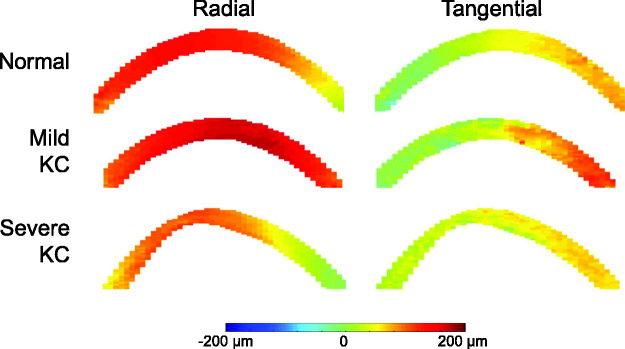
Cross-sectional ultrasound images of the cornea from a normal donor eye and from KC1 and KC2 are shown in Figure 2. Adequate speckle strength was observed through the full thickness of the corneal stroma when imaged with the high-frequency ultrasound at 50 MHz. These speckle patterns allowed successful and reliable speckle tracking, as indicated by high speckle tracking correlation coefficients (>0.99) between consecutive pressure levels in all measured eyes in the current study. Representative displacement maps corresponding to inflation from 5 to 30 mmHg are shown in Figure 3. All corneas showed consistent overall displacement patterns: axial displacements gradually increased from the periphery to the apex, while lateral displacements increased from the apex to the periphery in opposite directions on both sides of the apex.
Figure 2.
Ultrasound cross-sectional images of a representative normal cornea and both KC corneas (KC1, mild; KC2, severe). S: superior, I: inferior, N: nasal, T: temporal.
Figure 3.
Radial and tangential displacement maps at 30 mmHg in a normal cornea, KC1 (mild), and KC2 (severe). (A color version of this figure is available in the online journal.)
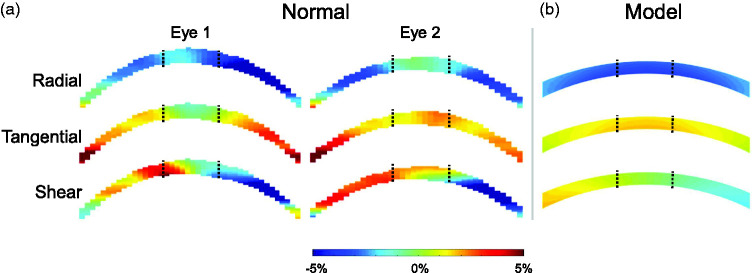
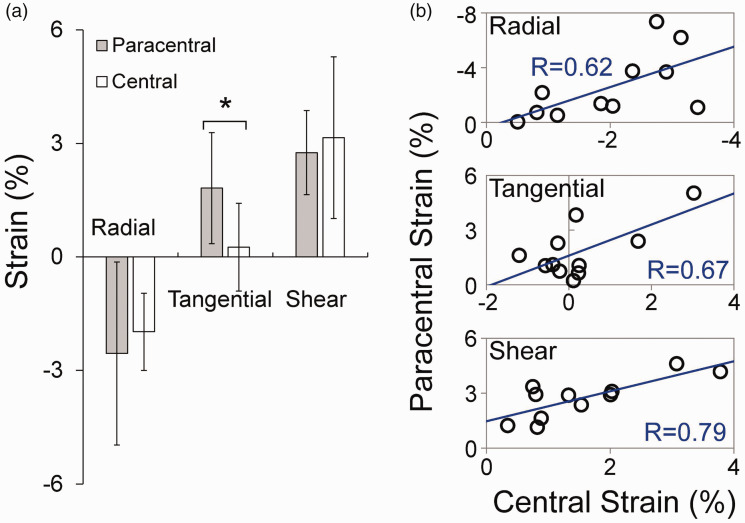
The overall average radial, tangential, and shear strain at 30 mmHg in normal corneal stroma was −2.30 ± 2.02%, 1.43 ± 1.26%, and 3.23 ± 1.35%. Strain maps from two normal eyes are presented in Figure 4. Regional strains in normal corneas are summarized in Table 1. In normal corneas, tangential strain was significantly larger in the paracentral region than the central region (P < 0.001, Figure 5(a)). In the central cornea, the magnitudes of radial and shear strains were significantly higher than the magnitudes of tangential strains (P = 0.025 and 0.007, respectively). Radial and shear strains were not significantly different between the paracentral and central regions in normal corneas (P = 0.355 and 0.380, respectively, Figure 5(a)). Radial, tangential, and shear strains were strongly correlated between the central and paracentral regions in normal corneas (R = 0.62, P = 0.041; R = 0.67, P = 0.024; and R = 0.79, P = 0.004; respectively, Figure 5(b)).
Figure 4.
(a) Radial, tangential, and shear strain maps in two normal corneas at 30 mmHg. Black dotted lines demarcate the central and paracentral regions. (b) Radial, tangential, and shear corneal strain maps generated from finite element simulations of a human eye inflated from 5 to 30 mmHg. (A color version of this figure is available in the online journal.)
Table 1.
Regional radial, tangential, and shear strains in normal and keratoconic corneas when IOP was increased from 5 to 30 mmHg.
|
Radial |
Tangential |
Shear |
||||||
|---|---|---|---|---|---|---|---|---|
| Eye | Age | Paracentral | Central | Paracentral | Central | Paracentral | Central | |
| Experimental | Normal (n=11) | 63 | −2.56±2.42% | −1.98±1.02% | 1.82±1.47% | 0.25±1.16% | 2.75±1.11% | 3.15±2.14% |
| KC1 | 49 | −9.17% | −4.93% | 1.98% | −1.47% | 2.78% | 3.83% | |
| KC2 | 84 | −3.57% | −1.58% | 0.80% | 0.34% | 2.30% | 3.59% | |
| scar | 0.25% | 0.03% | 2.63% | |||||
| cone | −6.30% | 2.15% | 1.16% | |||||
| Model | Normal (E=1.0 MPa | CCT=0.52 mm) | −2.74% | −3.18% | 1.18% | 1.64% | 1.21% | 0.26% | |
| KC (E=0.5 MPa | CCT=0.48 mm) | −5.45% | −6.53% | 2.33% | 3.31% | 2.42% | 0.56% | ||
| KCT (E=1.0 MPa | CCT=0.48 mm) | −2.75% | −3.20% | 1.11% | 1.62% | 1.21% | 0.28% | ||
| KCM (E=0.5 MPa | CCT=0.52 mm) | −5.44% | −6.48% | 2.45% | 3.34% | 2.41% | 0.52% | ||
Note: The strains in normal corneas, KC1, and KC2 measured by high-frequency ultrasound elastography are presented in the “experimental” section. The strains predicted by finite element models of human eyes with simplified geometry and mechanical properties are presented in the “model” section (E: modulus; CCT: central corneal thickness).
Figure 5.
(a) Comparisons of radial, tangential, and shear strains between central and paracentral corneal stroma at 30 mmHg in normal corneas (n = 11, * denotes P < 0.05). (b) Correlation of strains between central and paracentral regions (n = 11, R=Pearson correlation coefficient). (A color version of this figure is available in the online journal.)
In KC1, the overall radial, tangential, and shear strains at 30 mmHg were -5.40%, 1.52%, and 3.77%, respectively. In KC2, the overall radial, tangential, and shear strains at 30 mmHg were −2.97%, 0.71%, and 2.55%, respectively. Strain maps in KC1 and KC2 corneas are presented in Figure 6. Regional strains in these two KC corneas are presented in Table 1. For the mild case (KC1), ultrasound scans did not show an apparent cone. For KC2, the scar and cone regions were identifiable in the ultrasound scans and the strains within these regions were also reported (Table 1).
Figure 6.
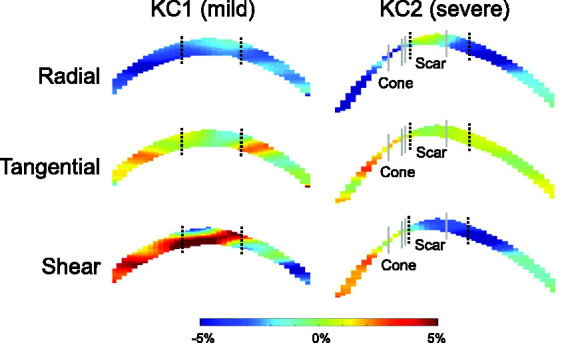
Radial, tangential, and shear strain maps of KC1 (mild) and KC2 (severe) at 30 mmHg. Black dotted lines demarcate the central and paracentral regions. Gray lines demarcate the cone and scar regions in KC2. (A color version of this figure is available in the online journal.)
The regional strains predicted by finite element models of normal and mild KC corneas are also shown in Table 1. With simplified material properties and geometry, the models predicted that the radial and tangential strains were larger in the central cornea than the paracentral cornea, while the shear strains were minimal in the central cornea in both normal and mild KC corneas. The models also predicted that all types of strains increased in the mild KC eye as compared to the normal eye. The strain increase was predominantly due to modulus decrease (Table 1, “KCM” case), while the strain changed minimally when there was only a reduction in thickness (Table 1, “KCT” case).
Discussion
In this study, we used high-frequency ultrasound elastography to measure corneal stroma strains during IOP elevation in normal and KC human donor eyes. The wide field of view allowed us to image the central and paracentral cornea simultaneously and compare regional responses. More importantly, the cross-sectional images through corneal thickness made it possible to quantify the radial, tangential, and shear strains within the corneal stroma, which were not reported before. The primary findings of this study include:
In normal corneas, the central region of corneal stroma had significantly smaller tangential strains than the paracentral region;
In normal corneas, the magnitudes of radial and shear strains in the central region were significantly larger than the magnitude of tangential strains;
KC corneas appeared to have altered deformation profiles in response to IOP elevation.
Our experimental results showed that the tangential strain in the central cornea was minimal in normal eyes (Figure 4). Previous studies using optical methods also reported a reduced surface tangential strain around the apex during inflation.12–14 Our results expanded upon this observation and confirmed that corneal stroma around the apex indeed stretched minimally under IOP elevation. This may be important for maintaining stable vision during IOP fluctuations. It is however unclear what microstructural mechanisms (e.g. collagen lamellar organization and density) 30 are responsible for minimizing stretch in the central cornea. Future studies are needed to investigate factors governing the deformation of the central cornea.
Interestingly, we found significantly larger radial and shear strains than tangential strains in the central cornea. The magnitudes of these strains fell within the range we previously reported in porcine and canine corneas. 18 , 23 , 25 This result suggested that the corneal stroma around the apex thins and bends under pressure elevation despite minimal stretch. Radial and shear strains in the central region did not differ significantly from those in the paracentral region and the strains in these two regions were significantly correlated (Figure 5(b)). Quantification of radial and shear strains, in addition to tangential strains, can provide a more complete characterization of the cornea’s deformation in response to IOP.
Although only two KC eyes were included in this study due to the low availability of these donor specimens, interesting strain patterns were observed comparing KC cornea responses with the average response of normal corneas. In the mild case (i.e. KC1), radial strains were substantially larger in both the central (2.5 times) and the paracentral (3.6 times) regions (Table 1), indicating a marked reduction in stiffness in resisting radial compression. This result was consistent with a previous study using acoustic radiation force elastic microscopy, which showed reduced elastic modulus and changes in collagen lamellae architecture in the radial direction of KC corneas. 5 Brillouin imaging also showed a reduction in longitudinal modulus in the cone region of KC corneas. 31 , 32 Furthermore, in the central cornea of KC1, where an early cone was clinically identified, the tangential strain became negative (Table 1). Interestingly, shear strains were not substantially different between normal corneas and KC1. Similar levels of shear strains were also observed in all regions of KC2, a severe case of KC. However, drastic contrast in radial and tangential strains was observed between the scar region and the cone region in KC2, even though these two regions were anatomically adjacent, and both were near the central cornea (Figure 6). The cone region in KC2 had large radial and tangential strains, 3.2 and 8.5 times larger, respectively, than those of the central cornea in normal eyes (Table 1). The scar region had very small radial and tangential strains, 1/8th and 1/9th of those in the central region of normal corneas. These results indicated that the scar region was likely stiffer due to ECM remodeling, while the cone region was mechanically weakened, presenting large regional heterogeneity in severe KC. 33
A few interesting observations are presented below comparing the experimental results with the output of simplified finite element models. First, the minimal tangential strain in the central cornea shown in our and others’ experimental data was not predicted by the models. On the contrary, the models predicted larger tangential strain in the central cornea than the paracentral cornea in both normal and KC eyes. In addition, the models predicted minimal central shear strains, while our experimental data showed large central shear strains in both normal and KC corneas. One possible explanation is that the models used isotropic material properties, while the cornea has strongly anisotropic properties dictated by its anisotropic microstructure (e.g. a circumferential ring in the limbus and a dominant in-plane alignment of collagen lamellae). This highlights the importance to use caution when interpreting model predictions. Second, the model predicts that a 2-fold decrease in modulus would result in approximately a 2-fold increase of all types of strains (comparing radial, tangential and shear strains between models of normal and KCM corneas in Table 1). This proportionality is expected for an isotropic material with isotropic changes. Our experimental results in KC corneas showed very different levels of changes in radial, tangential, and shear strains, suggesting that the disease process of keratoconus likely affects corneal structure and properties disproportionally in certain directions. Third, the model results showed that a reduction of thickness alone is likely not sufficient for inducing a strain increase as large as what we observed in the mild KC case. This provides some indication that material property change is likely substantial in KC.
There are several limitations in our current study. First, the KC sample size was small preventing meaningful statistical analysis in this group. Future studies with a larger sample size are needed to confirm the results. Second, postmortem corneal swelling and other changes may potentially alter the inflation responses from the in vivo condition. The postmortem time for KC donor eyes was longer due to additional logistical challenges. This issue was mitigated by our application of deswelling treatment to all experimental eyes, which has been shown to return the postmortem corneas to normal physiological hydration. 23 Third, NT scans were used for normal corneas, while SI scans were used for KC corneas. The SI scans were used for KC corneas because KC2 had local thinning in the inferior cornea (Figure 2). Previous studies indicated that the SI orientation could be 10–20% stiffer than the NT orientation in normal human corneas. 34 This would predict an even larger difference between normal and KC corneas than we reported if scans of the same orientation were used. Fourth, the spatial resolution of high-frequency ultrasound at 50 MHz is still lower than optical imaging methods such as OCT. However, with radiofrequency data analysis and interpolation, our ultrasound elastography technique can achieve an axial displacement sensitivity at the level of 10 s of nanometers, which approaches that of some OCT methods. The thicker beam width of ultrasound (155 μm for the imaging system used in current study) provides a higher tolerance for out-of-plane motion as indicated by the very high correlation coefficients in speckle tracking. Fifth, only one 2D radial cross-section of the cornea was analyzed in this study. Corneal strains are potentially non-uniform and asymmetrical, particularly in KC eyes. One cross-section cannot fully capture the complex responses of the whole cornea. We have developed and validated a 3D ultrasound speckle tracking technique and will aim to acquire 3D deformation of the full cornea in future studies. 25
In conclusion, we applied a high-frequency ultrasound elastography technique to quantify the regional biomechanical responses of the human cornea during IOP elevation. Using this technique, we reported full thickness corneal stroma strains in normal and KC eyes. Our findings suggested regional variations in both normal and KC corneas, while KC appeared to be associated with significant local weakening especially in resisting radial compression and in-plane stretch. The comprehensive characterization of radial, tangential, and shear strains through corneal thickness may provide new insights in understanding biomechanical alterations in KC. Furthermore, the high-frequency ultrasound elastography technique has a potential to be translated into the clinical setting to measure in vivo corneal deformation in response to intrinsic IOP fluctuations (i.e. the ocular pulse). 35 , 36 The results from the current study may lay a foundation for future in vivo studies to better understand the biomechanical mechanisms in KC development and progression.
Footnotes
AUTHORS’ CONTRIBUTIONS: All authors participated in the design, interpretation of the studies, and analysis of the data and review of the manuscript; KC conducted the experiments, SK, NH, and KC performed data processing and analysis, SK, NH, XP, and JL performed statistical analysis, SK, NH, and JL wrote the manuscript, SK, NH, KC, XP, and JL contributed to critical revisions of the manuscript.
DECLARATION OF CONFLICTING INTERESTS: The author(s) declared no potential conflicts of interest with respect to the research, authorship, and/or publication of this article.
FUNDING: The author(s) disclosed receipt of the following financial support for the research, authorship, and/or publication of this article: This work was supported by National Institute of Health [R01EY025358].
ORCID iDs: Keyton Clayson https://orcid.org/0000-0002-6176-4835
References
- 1.Kang PC, Klintworth GK, Kim T, Carlson AN, Adelman R, Stinnett S, Afshari NA. Trends in the indications for penetrating keratoplasty, 1980-2001. Cornea 2005; 24:801–3 [DOI] [PubMed] [Google Scholar]
- 2.Vellara HR, Patel DV. Biomechanical properties of the keratoconic cornea: a review. Clin Exp Optom 2015; 98:31–8 [DOI] [PubMed] [Google Scholar]
- 3.Kling S, Hafezi F. Corneal biomechanics – a review. Ophthalmic Physiol Opt 2017; 37:240–52 [DOI] [PubMed] [Google Scholar]
- 4.Meek KM, Tuft SJ, Huang Y, Gill PS, Hayes S, Newton RH, Bron AJ. Changes in collagen orientation and distribution in keratoconus corneas. Invest Ophthalmol Vis Sci 2005; 46:1948–56 [DOI] [PubMed] [Google Scholar]
- 5.Mikula E, Winkler M, Juhasz T, Brown DJ, Shoa G, Tran S, Kenney MC, Jester JV. Axial mechanical and structural characterization of keratoconus corneas. Exp Eye Res 2018; 175:14–9 [DOI] [PMC free article] [PubMed] [Google Scholar]
- 6.Joseph R, Srivastava OP, Pfister RR. Differential epithelial and stromal protein profiles in keratoconus and normal human corneas. Exp Eye Res 2011; 92:282–98 [DOI] [PubMed] [Google Scholar]
- 7.Meek KM, Knupp C. Corneal structure and transparency. Prog Retin Eye Res 2015; 49:1–16 [DOI] [PMC free article] [PubMed] [Google Scholar]
- 8.Andreassen TT, Hjorth Simonsen A, Oxlund H. Biomechanical properties of keratoconus and normal corneas. Exp Eye Res 1980; 31:435–41 [DOI] [PubMed] [Google Scholar]
- 9.Nash IS, Greene PR, Foster CS. Comparison of mechanical properties of keratoconus and normal corneas. Exp Eye Res 1982; 35:413–24 [DOI] [PubMed] [Google Scholar]
- 10.Vinciguerra R, Ambrósio R, Elsheikh A, Roberts CJ, Lopes B, Morenghi E, Azzolini C, Vinciguerra P. Detection of keratoconus with a new biomechanical index. J Refract Surg 2016; 31:803–10 [DOI] [PubMed] [Google Scholar]
- 11.Hallahan KM, Sinha Roy A, Ambrosio R, Salomao M, Dupps WJ. Discriminant value of custom ocular response analyzer waveform derivatives in keratoconus. Ophthalmology 2014; 121:459–68 [DOI] [PMC free article] [PubMed] [Google Scholar]
- 12.Hjortdal J. Regional elastic performance of the human cornea. J Biomech 1996; 29:931–42 [DOI] [PubMed] [Google Scholar]
- 13.Wilson A, Jones J, Tyrer JR, Marshall J. An interferometric ex vivo study of corneal biomechanics under physiologically representative loading, highlighting the role of the limbus in pressure compensation. Eye Vis 2020; 7:1–11 [DOI] [PMC free article] [PubMed] [Google Scholar]
- 14.Boyce BL, Grazier JM, Jones RE, Nguyen TD. Full-field deformation of bovine cornea under constrained inflation conditions. Biomaterials 2008; 29:3896–904 [DOI] [PubMed] [Google Scholar]
- 15.Kling S, Khodadadi H, Goksel O. Optical coherence elastography-based corneal strain imaging during low-amplitude intraocular pressure modulation. Front Bioeng Biotechnol 2019; 7:453. [DOI] [PMC free article] [PubMed] [Google Scholar]
- 16.Nair A, Singh M, Aglyamov SR, Larin KV. Heartbeat OCE: corneal biomechanical response to simulated heartbeat pulsation measured by optical coherence elastography. J Biomed Opt 2020; 25:055001. [DOI] [PMC free article] [PubMed] [Google Scholar]
- 17.De Stefano VS, Ford MR, Seven I, Dupps WJ. Depth-dependent corneal biomechanical properties in normal and keratoconic subjects by optical coherence elastography. Trans Vis Sci Tech 2020; 9:4. [DOI] [PMC free article] [PubMed] [Google Scholar]
- 18.Palko JR, Tang J, Perez BC, Pan X, Liu J. Spatially heterogeneous corneal mechanical responses before and after riboflavin–ultraviolet – a crosslinking. J Cataract Refract Surg 2014; 40:1021–31 [DOI] [PMC free article] [PubMed] [Google Scholar]
- 19.Hollman KW, Shtein RM, Tripathy S, Kim K. Using an ultrasound elasticity microscope to map three-dimensional strain in a porcine cornea. Ultrasound Med Biol 2013; 39:1451–9 [DOI] [PMC free article] [PubMed] [Google Scholar]
- 20.Silverman RH. High-resolution ultrasound imaging of the eye – a review. Clin Exp Ophthalmol 2009; 37:54–67 [DOI] [PMC free article] [PubMed] [Google Scholar]
- 21.Pavlatos E, Chen H, Clayson K, Pan X, Liu J. Imaging corneal biomechanical responses to ocular pulse using high-frequency ultrasound. IEEE Trans Med Imaging 2018; 37:663–70 [DOI] [PMC free article] [PubMed] [Google Scholar]
- 22.Perez BC, Pavlatos E, Morris H, Chen H, Pan X, Hart R, Liu J. Mapping 3D strains with ultrasound speckle tracking: method validation and initial results in porcine scleral inflation. Ann Biomed Eng 2016; 44:2302–12 [DOI] [PMC free article] [PubMed] [Google Scholar]
- 23.Clayson K, Sandwisch T, Ma Y, Pavlatos E, Pan X, Liu J. Corneal hydration control during ex vivo experimentation using poloxamers. Curr Eye Res 2020; 45:111–7 [DOI] [PMC free article] [PubMed] [Google Scholar]
- 24.Tang J, Liu J. Ultrasonic measurement of scleral cross-sectional strains during elevations of intraocular pressure: method validation and initial results in posterior porcine sclera. J Biomech Eng 2012; 134:091007. [DOI] [PMC free article] [PubMed] [Google Scholar]
- 25.Clayson K, Pavlatos E, Ma Y, Liu J. 3D characterization of corneal deformation using ultrasound speckle tracking. J Innov Opt Health Sci 2017; 10:1742005. [DOI] [PMC free article] [PubMed] [Google Scholar]
- 26.Ma Y, Pavlatos E, Clayson K, Kwok S, Pan X, Liu J. Three-Dimensional inflation response of porcine optic nerve head using High-Frequency ultrasound elastography. J Biomech Eng 2020; 142:1–7 [DOI] [PMC free article] [PubMed] [Google Scholar]
- 27.Kallel F, Ophir J. A least-squares strain estimator for elastography. Ultrason Imaging 1997; 19:195–208 [DOI] [PubMed] [Google Scholar]
- 28.Sigal IA, Flanagan JG, Ethier CR. Factors influencing optic nerve head biomechanics. Invest Ophthalmol Vis Sci 2005; 46:4189–99 [DOI] [PubMed] [Google Scholar]
- 29.Elsheikh A, Wang D, Brown M, Rama P, Campanelli M, Pye D. Assessment of corneal biomechanical properties and their variation with age. Curr Eye Res 2007; 32:11–9 [DOI] [PubMed] [Google Scholar]
- 30.Boote C, Kamma-Lorger CS, Hayes S, Harris J, Burghammer M, Hiller J, Terrill NJ, Meek KM. Quantification of collagen organization in the peripheral human cornea at micron-scale resolution. Biophys J 2011; 101:33–42 [DOI] [PMC free article] [PubMed] [Google Scholar]
- 31.Scarcelli G, Besner S, Pineda R, Yun SH. Biomechanical characterization of keratoconus corneas ex vivo with brillouin microscopy. Invest Ophthalmol Vis Sci 2014; 55:4490–5 [DOI] [PMC free article] [PubMed] [Google Scholar]
- 32.Scarcelli G, Besner S, Pineda R, Kalout P, Yun SH. In vivo biomechanical mapping of normal and keratoconus corneas. JAMA Ophthalmol 2015; 133:180–482 [DOI] [PMC free article] [PubMed] [Google Scholar]
- 33.Roberts CJ, Dupps WJ. Biomechanics of corneal ectasia and biomechanical treatments. J Cataract Refract Surg 2014; 40:991–8 [DOI] [PMC free article] [PubMed] [Google Scholar]
- 34.Elsheikh A, Brown M, Alhasso D, Rama P, Campanelli M, Garway-Heath D. Experimental assessment of corneal anisotropy. J Refract Surg 2008; 24:178–87 [DOI] [PubMed] [Google Scholar]
- 35.Kwok S, Clayson K, Hazen N, Pan X, Ma Y, Hendershot AJ, Liu J. Heartbeat-induced corneal axial displacement and strain measured by high frequency ultrasound elastography in human volunteers. Transl Vis Sci Technol 2020; 9:33. [DOI] [PMC free article] [PubMed] [Google Scholar]
- 36.Clayson K, Pavlatos E, Pan X, Sandwisch T, Ma Y, Liu J. Ocular pulse elastography: imaging corneal biomechanical responses to simulated ocular pulse using ultrasound. Transl Vis Sci Technol 2020; 9:5. [DOI] [PMC free article] [PubMed] [Google Scholar]


