Figure 4.
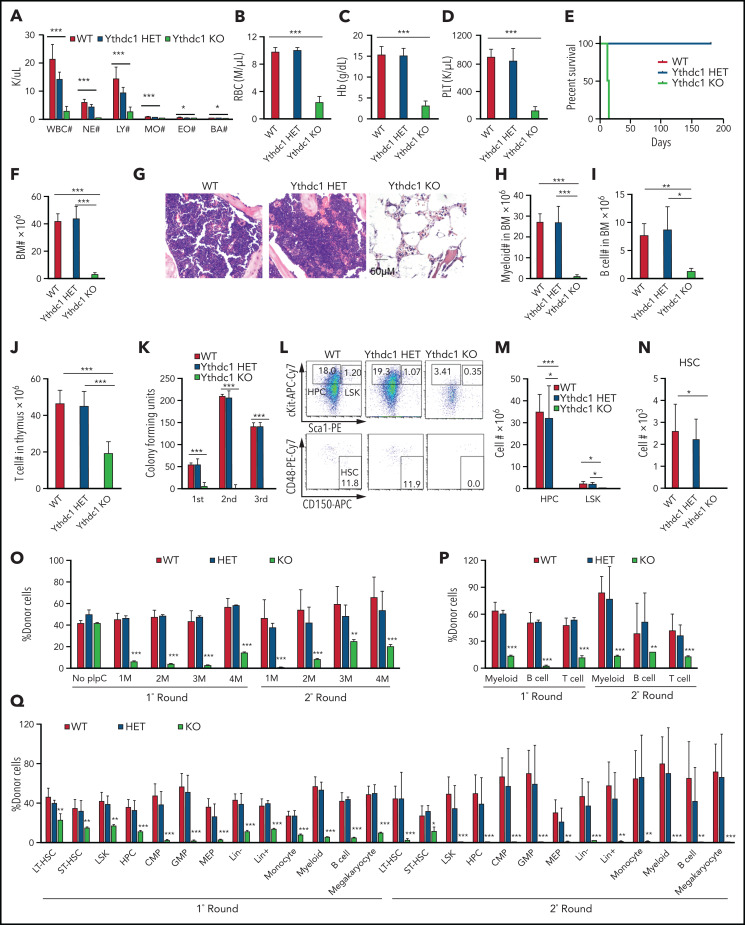
Ythdc1 is critical for normal hematopoiesis and HSC maintenance. Absolute number of WBCs, neutrophils (NE), lymphocytes (LY), monocytes (MO), eosinophils (EO), and basophils (BA) (A), as well as RBCs (B) and concentration of hemoglobin (C) and platelets (PLT) (D) in PB from Ythdc1fl/+ (WT), Ythdc1fl/+Mx1-Cre (Ythdc1 HET), and Ythdc1fl/flMx1-Cre (Ythdc1 KO) mice. Deletion was induced by pIpC injection; n = 4 mice for the WT and HET groups, n = 6 mice for the KO group. (E) Kaplan-Meier survival analysis of Ythdc1fl/+ (WT), Ythdc1fl/+Mx1-Cre (Ythdc1 HET), and Ythdc1fl/flMx1-Cre (Ythdc1 KO) mice. The graph starts from the first day after the third pIpC injection; n = 5 mice for the WT and HET groups, n = 6 mice for the KO group. (F) Total BM cell number in Ythdc1fl/+ (WT), Ythdc1fl/+Mx1-Cre (Ythdc1 HET), and Ythdc1fl/flMx1-Cre (Ythdc1 KO) mice; n = 4 mice for the WT and HET groups, n = 6 mice for the KO group. (G) Histologic analysis of hematoxylin and eosin–stained sternum from Ythdc1fl/+ (WT), Ythdc1fl/+Mx1-Cre (Ythdc1 HET), and Ythdc1fl/flMx1-Cre (Ythdc1 KO) mice; scale bar, 50 μM. Myeloid cell (Mac+Gr1+) number (H), B-cell (B220+) number (I) in BM, and T-cell number (J) in thymus in Ythdc1fl/+ (WT), Ythdc1fl/+Mx1-Cre (Ythdc1 HET), and Ythdc1fl/flMx1-Cre (Ythdc1 KO) mice; n = 4 mice for the WT and HET groups, n = 6 mice for the KO group. (K) Colony-forming units of BM cells from Ythdc1fl/+ (WT), Ythdc1fl/+Mx1-Cre (Ythdc1 HET), and Ythdc1fl/flMx1-Cre (Ythdc1 KO) mice; cells were resuspended and replated weekly in MethoCult medium containing cytokines, 10 000 cells for first input, 50 000 for second and third input. Number of LSK (M), HPCs (M), and HSC (N) in BM from Ythdc1fl/+ (WT), Ythdc1fl/+Mx1-Cre (Ythdc1 HET), and Ythdc1fl/flMx1-Cre (Ythdc1 KO) mice. Gating strategy is shown in panel L. HSC: Lin–c-Kit+Sca1+CD48–CD150+; LSK: Lin–c-Kit+Sca1+; HPC: Lin–cKit+Sca1–. n = 4 mice for the WT and HET groups, n = 3 mice for the KO group. (O) Flow cytometric analysis of the percentage of donor-derived cells in the first round and second round of recipient mice. pIpC was injected 1 month after transplantation; n = 4 mice for each group. (P) Flow cytometric analysis of the percentage of donor-derived myeloid cells, B and T cells in PB in the first round and second round of recipient mice 4 months after transplantation; n = 4 mice for each group. (Q) Flow cytometric analysis of the percentage of donor-derived cell populations in BM in the first round and second round of recipient mice, n = 4 mice for each group. Data are presented as mean ± standard deviation; Student t test or log-rank (Mantel-Cox) test for survival curve. *P < .05; **P < .01; ***P < .001. CMP, common myeloid progenitor; GMP, granulocyte-monocyte progenitor; LT-HSC, long-term HSC; MEP, megakaryocyte-erythroid progenitor; ST-HSC, short-term HSC.

