During storage, red blood cells (RBC) undergo major biochemical and morphological changes.1,2 Progression of this so-called storage lesion varies between donor units,3,4 but key manifestations are a decrease in [2,3-diphosphoglycerate] ([2,3-DPG]), which becomes depleted by 3 weeks,5 and spherical remodeling.6 These changes are predicted to affect gas handling by reducing the amount of O2 off-loaded from RBC and expanding the diffusion path-length across the cytoplasm,7 respectively. Since RBC have only a few seconds to exchange gases in capillaries, impaired O2 handling could compromise the efficacy of transfusions, particularly when an immediate improvement to tissue oxygenation is required, such as with major hemorrhage. Although multiple randomized controlled trials have failed to identify clinical consequences related to the storage lesion,8 several limitations of these trials have been pointed out,9 including the concern that the intervention being tested is storage duration, rather than a functional appraisal of O2 handling by RBC. Consequently, studies that randomize according to storage duration may lack the power to resolve the real effects of storage lesion. It is therefore important to determine how storage affects the gas-handling properties of RBC.
The effect of storage on the kinetics of O2 (un)loading is poorly understood because appropriate measurements are not routinely performed. For example, estimates of O2-binding affinity cannot predict ‘on’ and ‘off’ rates because they relate to the steady-state. A recent study10 found that storage paradoxically hastens gas exchange, despite also increasing O2-affinity, and that normalizing [2,3-DPG] has no effect on O2 release rate. However, these inferences were based on measuring the effect of RBC on extracellular O2 dynamics and are, therefore, indirect. To assess gas exchange more directly, we used single-cell HbO2 saturation imaging,7 which measures the time-constant (t) of O2-unloading and the O2-carrying capacity (k) evoked by anoxia. This technique combines ratiometric fluorescence imaging of HbO2 saturation using CellTracker Green and Deep-Red dyes, with rapid switching between oxygenated and anoxic microstreams delivered to RBC. Whole-blood units from consenting donors were collected in citrate phosphate dextrose, depleted of leukocytes, and manufactured as red cell concentrates (RCC) in saline adenine glucose-mannitol (SAG-M) within 27 h of venipuncture according to National Health Service Blood and Transplant procedures. Reference measurements were made on freshly collected venous blood from six volunteers (CUREC R46540/RE001). Data were fully anonymized.
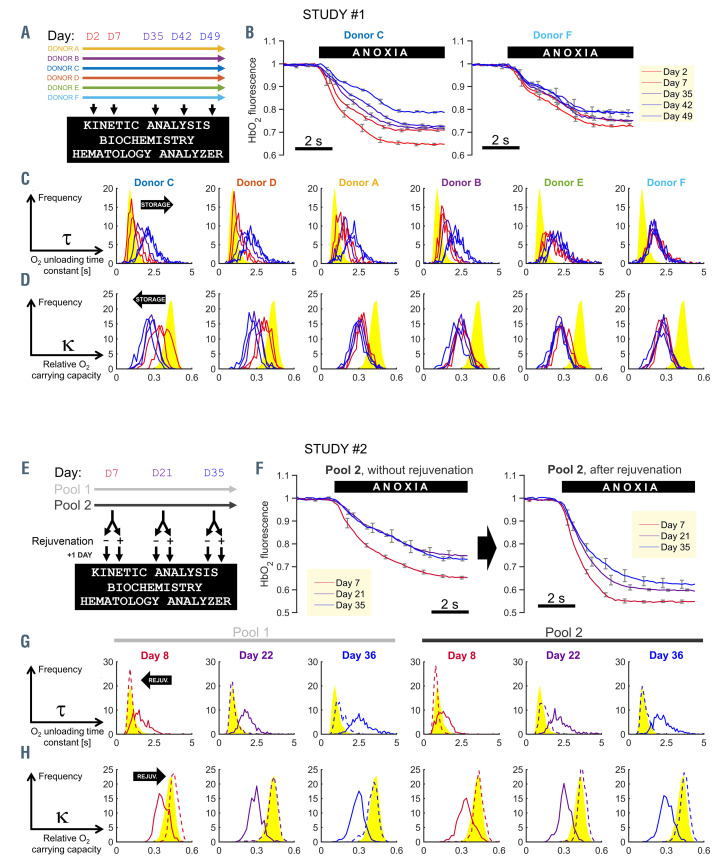
The first study investigated storage-related changes in RBC O2 handling, and how these vary between different units. RCC from six donors (A-F) were sampled at various points during storage (Figure 1A). Dye-loaded RBC were plated in a superfusion chamber mounted on a Leica LCS confocal system (excitation at 488/633 nm, emission at 500-550/650-700 nm) and O2 unloading was triggered by rapidly changing the microstream bathing cells from an oxygenated to an anoxic solution (N2-bubbled, containing 1 mM of O2 scavenger dithionite). Example time courses of the HbO2 response are shown in Figure 1B. With longer storage, cells from the RCC of donor C released O2 more slowly and in smaller quantities. This trend continued beyond week 3, at which point 2,3-DPG is depleted. In cells from the RCC of donor F, O2-handling reached its nadir already at day 2. Frequency distributions for the six RCC are presented in Figure 1C, ranked by progression of the kinetic decline. After 1 week of storage, some RCC (C, D) maintained fast O2-unloading kinetics, whereas others reached their nadir (F). With storage, the width of t distributions expanded, indicating increasing heterogeneity, but there was no evidence of bimodality. These distributions were transformed mathematically into cumulative frequency diagrams that inform about the fraction of RBC capable of unloading 95% of O2 in a given time-frame, T95 (Online Supplementary Figure S1A). The majority of freshly-collected RBC released their O2 cargo within 1 s, but with longer storage, RBC needed more time to complete gas exchange, reaching levels (T95 >2 s) that can result in diffusion- limited gas exchange at tissues. O2-carrying capacity (k) was also compromised by storage (Figure 1D).
The second study tested whether defective O2 handling is reversible with biochemical rejuvenation, a treatment previously shown to normalize [2,3-DPG].11 To determine the effect of such treatment, ABO-matched RCC units were pooled in order to reduce donor-dependent variation in measured responses. Two RCC pools were rejuvenated at specified time-points under storage, and time-matched controls received no treatment (Figure 1E). Single-cell HbO2 saturation imaging showed that biochemical rejuvenation hastened O2-handling kinetics irrespectively of storage duration (Figure 1F, G). The normalizing effects of rejuvenation on t, k and T95 are summarized in Figure 1G and H and Online Supplementary Figure S1B.
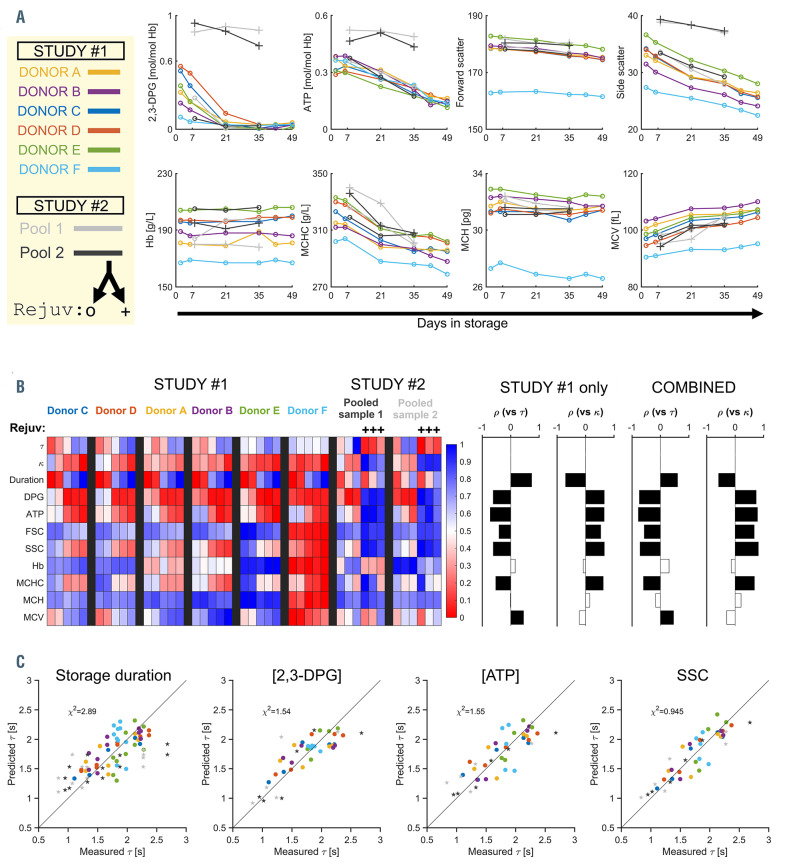
Proxies for O2-handling kinetics were sought by comparing the variables t and k against standard biochemical ([2,3-DPG], [ATP]) and flow-cytometric parameters (Sysmex XN1000 hematology analyzer), including RETRBC- Y and RET-RBC-Z channels that correspond to corpuscular forward-scatter and side-scatter (SSC) measured after treating RBC with Cellpack-DFL. [2,3-DPG] became depleted by day 21, ATP, mean corpuscular hemoglobin concentration and SSC decayed more slowly, while mean corpuscular volume increased (Figure 2A, Online Supplementary Figure S1C). The efficacy of rejuvenation was confirmed by the increases in [2,3-DPG], [ATP] and SSC (Figure 2A, Online Supplementary Figure S1D). The most significant correlates to t**********and k (Spearman test) were storage duration, [2,3- DPG], [ATP] and SSC (Figure 2B). The inverse relationship between t and k (Online Supplementary Figure S2A) suggests a common underlying cause of remodeling. A process anticipated to reduce k and raise t is [2,3-DPG] degradation; indeed, an inverse correlation was apparent between [2,3-DPG] and t (Online Supplementary Figure S2B). However, the power of [2,3-DPG] to predict t became compromised beyond day 21, after which t**********continued to increase, despite [2,3-DPG] depletion. An additional factor, such as the expanding path-length in spherically-remodeled RBC, must be contributing to dysfunctional O2 handling. Intriguingly, SSC was found to have good predictive power for t (Online Supplementary Figure S2C), and the power improved further when sample- level variation was factored into the regression (Figure 2C, Online Supplementary Figure S2D). Crucially, SSC was a considerably better predictor of changes in O2 handling than was storage duration. In contrast to [2,3- DPG], SSC continued to fall beyond day-21, is more easily measured, and provides data at single- cell resolution. SSC measured conventionally is influenced by RBC shape and composition, but upon Cellpack-DFL treatment, it also becomes sensitive to membrane permeability, and hence metabolic status. The association between SSC and 2,3-DPG (metabolism) and forward-scatter (volume) was confirmed by a metaanalysis of multiple RCC11 (Online Supplementary Figure S2E, F).
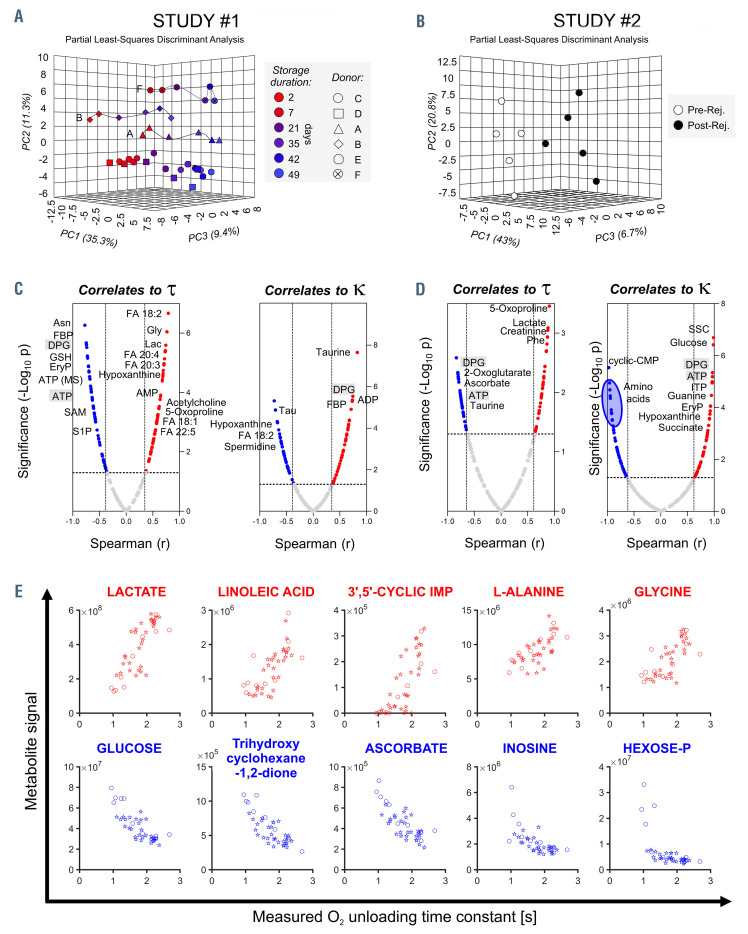
Metabolomic analyses were performed to relate specific metabolites to O2-handling dysfunction4,12 (Figure 3A, Online Supplementary Figure S3A). Established markers of the storage lesion13 were validated, including lactate, hypoxanthine, glucose and reduced glutathione. Donor unit-dependent variation was manifested in the responses of sphingosine 1-phosphate, methionine, S-adenosylmethionine, spermidine, and 20:3 and 20:5 fatty acids (Online Supplementary Figure S3). The metabolic consequences of rejuvenation (Figure 3B, Online Supplementary Figure S3B) provided additional data-points for establishing correlations against t and k (Figure 3C, D). The highest- ranking metabolic correlates to t, equal to or better than [2,3-DPG], are listed in Figure 3E.
Figure 1.
The kinetics of O2 handling in red cell concentrates are dependent on storage duration and donor, and can be normalized with rejuvenation treatment. (A) The protocol of study #1 showing color-coding for donors and indicating the days at which red cell concentrates (RCC) were sampled for analyses. (B) Example time course of HbO2 saturation in response to a rapid solution maneuver that reduces extracellular O2 tension to anoxic levels. Measurements on RCC from donor C (left) or F (right) at days 2, 7, 35, 42 and 49 of storage. Each line represents the mean of ten red blood cells (RBC); error bars are the standard deviation (SD). (C) Histograms of O2-unloading time constant t grouped by donor, and plotted for storage days 2, 7, 35, 42 and 49 (red transitioning to blue as storage duration increases). Each histogram was constructed from at least 300 RBC. Reference data from freshly collected venous blood are shown in yellow. (D) Frequency histograms of O2-carrying capacity k. (E) The protocol of study #2 showing color-coding for RCC pools #1 and #2 and days at which biochemical rejuvenation and analyses were performed. (F) Example time course of HbO2 saturation response to anoxia (mean±SD of ten cells from RCC pool #2). (G) Histograms of t, color-coded by storage duration (red to blue). Dashed lines denote measurements from rejuvenated units. Each histogram was constructed from a total of at least 300 RBC. Reference data from freshly collected venous blood are shown in yellow. (H) Frequency histograms of k.
Our findings add O2-unloading kinetics to the otherwise static definition of storage lesion. We provide metabolite correlates to O2 handling beyond 2,3-DPG and ATP for future investigations, and show that RBC SSC, a variable influenced by metabolism and corpuscular morphology, is a useful proxy for O2-exchange kinetics. Our assay identified major differences between donor units in the progression of O2-handling dysfunction under storage. The extent to which a gene-function correlation underpins this variation is testable with our method. The normalization of biochemical and flowcytometric parameters with rejuvenation explains how O2 handling is also restored to physiological levels. These observations are significant because of renewed interest in optimizing blood storage regimes for patients receiving large transfusions (in whom cumulative effects of storage lesion can be profound), or patients undergoing procedures in which sub-optimal tissue oxygenation may result in organ injury.
Figure 2.
Storage-related dysfunction of O2 handling relates to the level of 2,3- diphosphoglycerate but is best predicted by side-scatter measured on the RETRBC- Z channel of hematology analyzers. (A) Biochemical, blood count, and flow-cytometric parameters measured in red cell concentrates (RCC). Color-coding refers to the donor (study #1) and RCC pool (study #2). Parameters include concentration of diphosphoglycerate ([2,3-DPG]), [ATP], blood [Hb], mean corpuscular hemoglobin concentration (MCHC), mean corpuscular hemoglobin (MCH), mean corpuscular volume (MCV), corpuscular forward- and side-scatter (FSC, SSC) after treatment with Cellpack DFL. (B) Summary of parameters (scaled to a range 0-1) determined by single-cell HbO2 saturation imaging (t, k), biochemistry (2,3-DPG, ATP), RET-channel flow cytometry (FSC, SSC), and standard hematologic indices ([Hb], MCHC, MCH, and MCV). Correlations with t or k determined by Spearman test for datasets in study #1 alone, or the combined datasets from both studies. Filled bars indicate significant correlation (P<0.05). (C) Regression analyses determining the ability of storage duration, [2,3-DPG] normalized to [Hb], [ATP] normalized to [Hb], or SSC to predict actual t. Sample-level effects were modeled as a random intercept. Circles and stars indicate data from study #1 and #2, respectively. Goodness-of-fit was quantified by the χ2 test.
Figure 3.
Metabolomic analyses of red cell concentrates under storage and after rejuvenation identify correlates to O2-handling kinetics. (A) Mass spectrometry analyses (MetaboAnalyst) of red cell concentrates (RCC) from study #1. Partial least square-discriminant analysis (PLS-DA) indicates a significant impact of storage duration and inter-donor variability on metabolic phenotypes. Metabolites with the highest loading weights in principal components (PC) 1 and 2 were affected by storage duration across all samples (~35% of the total variance) and biological variability between donors (~11%). (B) Metabolomic analyses of RCC before and after rejuvenation. Rejuvenation had a significant impact on metabolites with the highest loading weights in PC1 (43%). (C,D) Metabolic correlates (Spearman test) to t or k for units under study #1 (C) and study #2 (D). Metabolites-of-interest are highlighted. These include 5-oxoproline and lactate as correlating positively with t; C18/20 free fatty acids (e.g. linoleic) as correlating positively with t and negatively with k; fructose 1,6-bisphosphatase (FBP) and inosine triphosphate (ITP; in rejuvenated pools, possibly a result of the inosine boost), the pentose phosphate metabolite erythrose 4-phosphate (EryP) and sphingosine 1-phosphate (S1P), dicarboxylates (2-oxoglutarate, fumarate, succinate, malate), ascorbate/dehydroascorbate, and the amino acids taurine and phenylalanine (Phe) as correlating negatively with t. DPG: 2,3-diphosphoglycerate; FA: fatty acid; Gly: glycine; Lac: lactate; SAM, S-adenosyl methionine. (E) Top five metabolites correlating positively (top, red) and negatively (bottom, blue) with t, using data from study #1 (circles) and study #2 (stars). These correlations were equal to or better than for [2,3-DPG].
Several high-quality randomized controlled trials14 have shown that transfusion of blood after prolonged storage is not associated with higher rates of adverse clinical outcomes than those after transfusion of blood stored for shorter periods. However, these trials mainly recruited participants with stable anemia and without an imminent threat to organ perfusion, and did not include patients requiring massive transfusion or those with major trauma,14 i.e., cohorts for whom the consequences of impaired gas exchange kinetics are most relevant. In the case of transfusion for major hemorrhage, the clinical imperative is to restore tissue oxygenation immediately. To achieve this, donated RBC must be capable of exchanging gases efficiently at the point of transfusion. This imperative is less relevant in patients with stable anemia because there is evidence that [2,3-DPG] recovers upon re-exposure to a physiological milieu, albeit slowly over up to 3 days.15 A functional assessment of the recovery of O2-handling kinetics in vivo is warranted to determine how the efficacy of transfusion depends on the clinical context of the recipient.
In the aforementioned trials, randomizations were based on storage duration rather than high-quality measurements of RBC physiology. We find that time in storage does not adequately describe the deterioration in O2-handling kinetics, and therefore the use of storage duration for treatment allocation may have compromised the statistical power to detect adverse clinical outcomes related to storage lesion. These considerations may explain the lack of a statistically significant effect of different storage regimes in participants with stable anemia. Given that O2-handling kinetics are mechanistically related to the physiological quality of transfused units, we propose that future investigations should consider RBC function, as determined from O2-unloading kinetics or suitable proxies.
Supplementary Material
Acknowledgments
We thank Drs Jarob Saker and Jean-Pierre Perol (Sysmex, Europe) for discussions on interpreting SSC measurements.
References
- 1.Bennett-Guerrero E, Veldman TH, Doctor A, et al. Evolution of adverse changes in stored RBCs. Proc Natl Acad Sci U S A. 2007; 104(43):17063-17068. [DOI] [PMC free article] [PubMed] [Google Scholar]
- 2.Yoshida T, Prudent M, D'Alessandro A. Red blood cell storage lesion: causes and potential clinical consequences. Blood Transfus. 2019; 17(1):27-52. [DOI] [PMC free article] [PubMed] [Google Scholar]
- 3.Tzounakas VL, Georgatzakou HT, Kriebardis AG, et al. Donor variation effect on red blood cell storage lesion: a multivariable, yet consistent, story. Transfusion. 2016;56(6):1274-1286. [DOI] [PubMed] [Google Scholar]
- 4.D'Alessandro A, Fu X, Kanias T, et al. Donor sex, age and ethnicity impact stored red blood cell antioxidant metabolism through mechanisms in part explained by glucose 6-phosphate dehydrogenase levels and activity. Haematologica. 2021;106(5):1290-1302. [DOI] [PMC free article] [PubMed] [Google Scholar]
- 5.Hess JR. Measures of stored red blood cell quality. Vox Sang. 2014; 107(1):1-9. [DOI] [PubMed] [Google Scholar]
- 6.Roussel C, Dussiot M, Marin M, et al. Spherocytic shift of red blood cells during storage provides a quantitative whole cell-based marker of the storage lesion. Transfusion. 2017;57(4):1007-1018. [DOI] [PubMed] [Google Scholar]
- 7.Richardson SL, Hulikova A, Proven M, et al. Single-cell O2 exchange imaging shows that cytoplasmic diffusion is a dominant barrier to efficient gas transport in red blood cells. Proc Natl Acad Sci U S A. 2020;117(18):10067-10078. [DOI] [PMC free article] [PubMed] [Google Scholar]
- 8.Carson JL, Stanworth SJ, Alexander JH, et al. Clinical trials evaluating red blood cell transfusion thresholds: an updated systematic review and with additional focus on patients with cardiovascular disease. Am Heart J. 2018;200:96-101. [DOI] [PubMed] [Google Scholar]
- 9.Trivella M, Stanworth SJ, Brunskill S, Dutton P, Altman DG. Can we be certain that storage duration of transfused red blood cells does not affect patient outcomes? BMJ. 2019;365:l2320. [DOI] [PubMed] [Google Scholar]
- 10.Chng KZ, Ng YC, Namgung B, et al. Assessment of transient changes in oxygen diffusion of single red blood cells using a microfluidic analytical platform. Commun Biol. 2021;4(1):271. [DOI] [PMC free article] [PubMed] [Google Scholar]
- 11.Smethurst PA, Jolley J, Braund R, et al. Rejuvenation of RBCs: validation of a manufacturing method suitable for clinical use. Transfusion. 2019;59(9):2952-2963. [DOI] [PubMed] [Google Scholar]
- 12.Stefanoni D, Shin HKH, Baek JH, et al. Red blood cell metabolism in Rhesus macaques and humans: comparative biology of blood storage. Haematologica. 2020;105(8):2174-2186. [DOI] [PMC free article] [PubMed] [Google Scholar]
- 13.Paglia G, D'Alessandro A, Rolfsson O, et al. Biomarkers defining the metabolic age of red blood cells during cold storage. Blood. 2016; 128(13):e43-50. [DOI] [PubMed] [Google Scholar]
- 14.McQuilten ZK, French CJ, Nichol A, Higgins A, Cooper DJ. Effect of age of red cells for transfusion on patient outcomes: a systematic review and meta-analysis. Transfus Med Rev. 2018;32(2):77-88. [DOI] [PubMed] [Google Scholar]
- 15.Scott AV, Nagababu E, Johnson DJ, et al. 2,3-Diphosphoglycerate concentrations in autologous salvaged versus stored red blood cells and in srgical patients after transfusion. Anesth Analg. 2016;122(3): 616-623. [DOI] [PMC free article] [PubMed] [Google Scholar]
Associated Data
This section collects any data citations, data availability statements, or supplementary materials included in this article.


