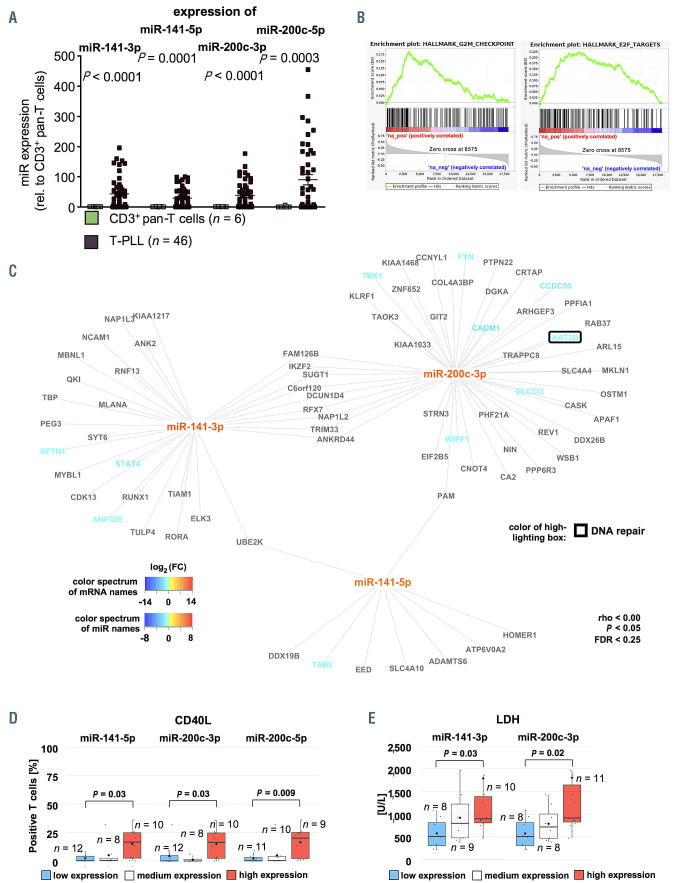
Figure 4.
Increased expression of miR-200c and miR-141 clusters is associated with deregulation of cell cycle regulators reflected in more activated phenotypes and more aggressive disease course. (A) Differential expression of miR-141 and miR-200 family members as analyzed by small-RNA sequencing showed significant upregulation of miR-141-3p (fold change [fc]=43.2; P<0.0001), miR-141-5p (fc=29.0; P=0.0001), miR-200c-3p (fc=38.2; P<0.0001) and miR-200c-5p (fc=56.6; P=0.003, n=46 T-cell prolymphocytic leukemia [T-PLL], n=6 controls). (B) Exemplary gene set enrichment analysis (GSEA) plots of miR-200/-miR-141 correlated mRNA: E2F TARGETS: NES=3.64, q<0.0001, G2M CHECKPOINT: NES=3.05, q<0.0001 (both based on miR-141-3p correlated mRNA). (C) Predicted targets (by seed sequences, see Methods section for details) correlating negatively with miR-141/-miR-200 expression in all analyzed cases and controls showed regulatory networks involved in DNA damage response and prosurvival signaling. Font color represents differential expression of mRNA comparing T-PLL cells (n=48 cases) and healthy donor-derived CD3+ pan-T cells (n=6 donors; for description of global mRNA sequencing results refer to Online Supplementary Figure S5 and Online Supplementary Table S5, blue= lower expression; red= higher expression). Color of highlighting boxes represents assignment of genes to functional groups of DNA damage response pathways (black) and prosurvival signaling (grey). (D) Groups of low and high miR-141/-200 expression were assigned by results of small-RNA sequencing: after division into three tertiles, cases of the lower were compared to those of the upper tertile. Cases were evaluated for CD40L surface expression using flow cytometry. TPLL with higher miR-141-5p, miR-200c-3p, and miR-200c-5p expression presented with a more activated T-cell phenotype (median CD40L expression: 16.5% vs. 0.05%, P=0.03; 16.5% vs. 0.05%, P=0.03, 20.0% vs. 0.0%, P=0.009; MWW). (E) Higher serum LDH levels (see Online Supplementary Table S9 for a summary of clinical data) were associated with high expression of miR-141-3p and miR-200c-3p (median 898 U/L vs. 509 U/L; P=0.03; median 917 G/L vs. 509 G/L; P=0.02; MWW). Groups were divided into three tertiles and the lower was compared against the upper tertile.

