Abstract
Failure of multiple sclerosis (MS) lesions to resolve in the months after they form leads to smouldering demyelination and axon degeneration, identifiable in vivo as paramagnetic rim lesions on MRI.1–3 To define mechanisms underlying this disabling, progressive neurodegenerative state,4–6 and to foster development of new therapeutics, we used MRI-informed single-nucleus RNA sequencing to profile the edge of demyelinated white matter (WM) lesions at various stages of inflammation. We uncovered remarkable glial and immune cell diversity, especially at the chronically inflamed lesion edge. We define “microglia inflamed in MS” (MIMS) and “astrocytes inflamed in MS,” novel glial phenotypes that demonstrate neurodegenerative programming. MIMS transcriptional profile overlaps with that of microglia in neurodegenerative diseases, suggesting that primary and secondary neurodegeneration share common mechanisms and could benefit from similar therapeutic approaches. We identify C1q as a critical mediator of MIMS activation, validated immunohistochemically in MS tissue, genetically by microglia-specific C1q ablation in mice with experimental autoimmune encephalomyelitis (EAE), and therapeutically by treating chronic EAE with C1q blockade. C1q inhibition is a potential therapeutic avenue to address chronic WM inflammation, which might be monitored by longitudinal assessment of its dynamic biomarker, paramagnetic rim lesions, by advanced MRI methods.
Mechanisms driving the leading inflammatory edge of chronically inflamed (or “chronic active”) MS lesions7,8 — important drivers of clinical deterioration4,5 — are poorly understood, in part due to the lack of preclinical models. Recent data from ultrahigh-field MRI and detailed correlative histopathology enable noninvasive identification of these lesions, which are marked by a characteristic paramagnetic rim attributable to phagocytosed iron1–3 (Fig.1a; Extended Fig.1). The paramagnetic rim lesion (PRL) biomarker correlates with elevated levels of serum neurofilament light chain, indicating active axonal injury/transection at the inflammatory lesion edge.6 These developments open the possibility of testing new therapeutic approaches for degenerative aspects of MS not targeted by currently approved treatments.
Fig. 1. snRNA-seq demonstrates pathological stage- and location-specific population diversity in MS lesions vs. control WM.
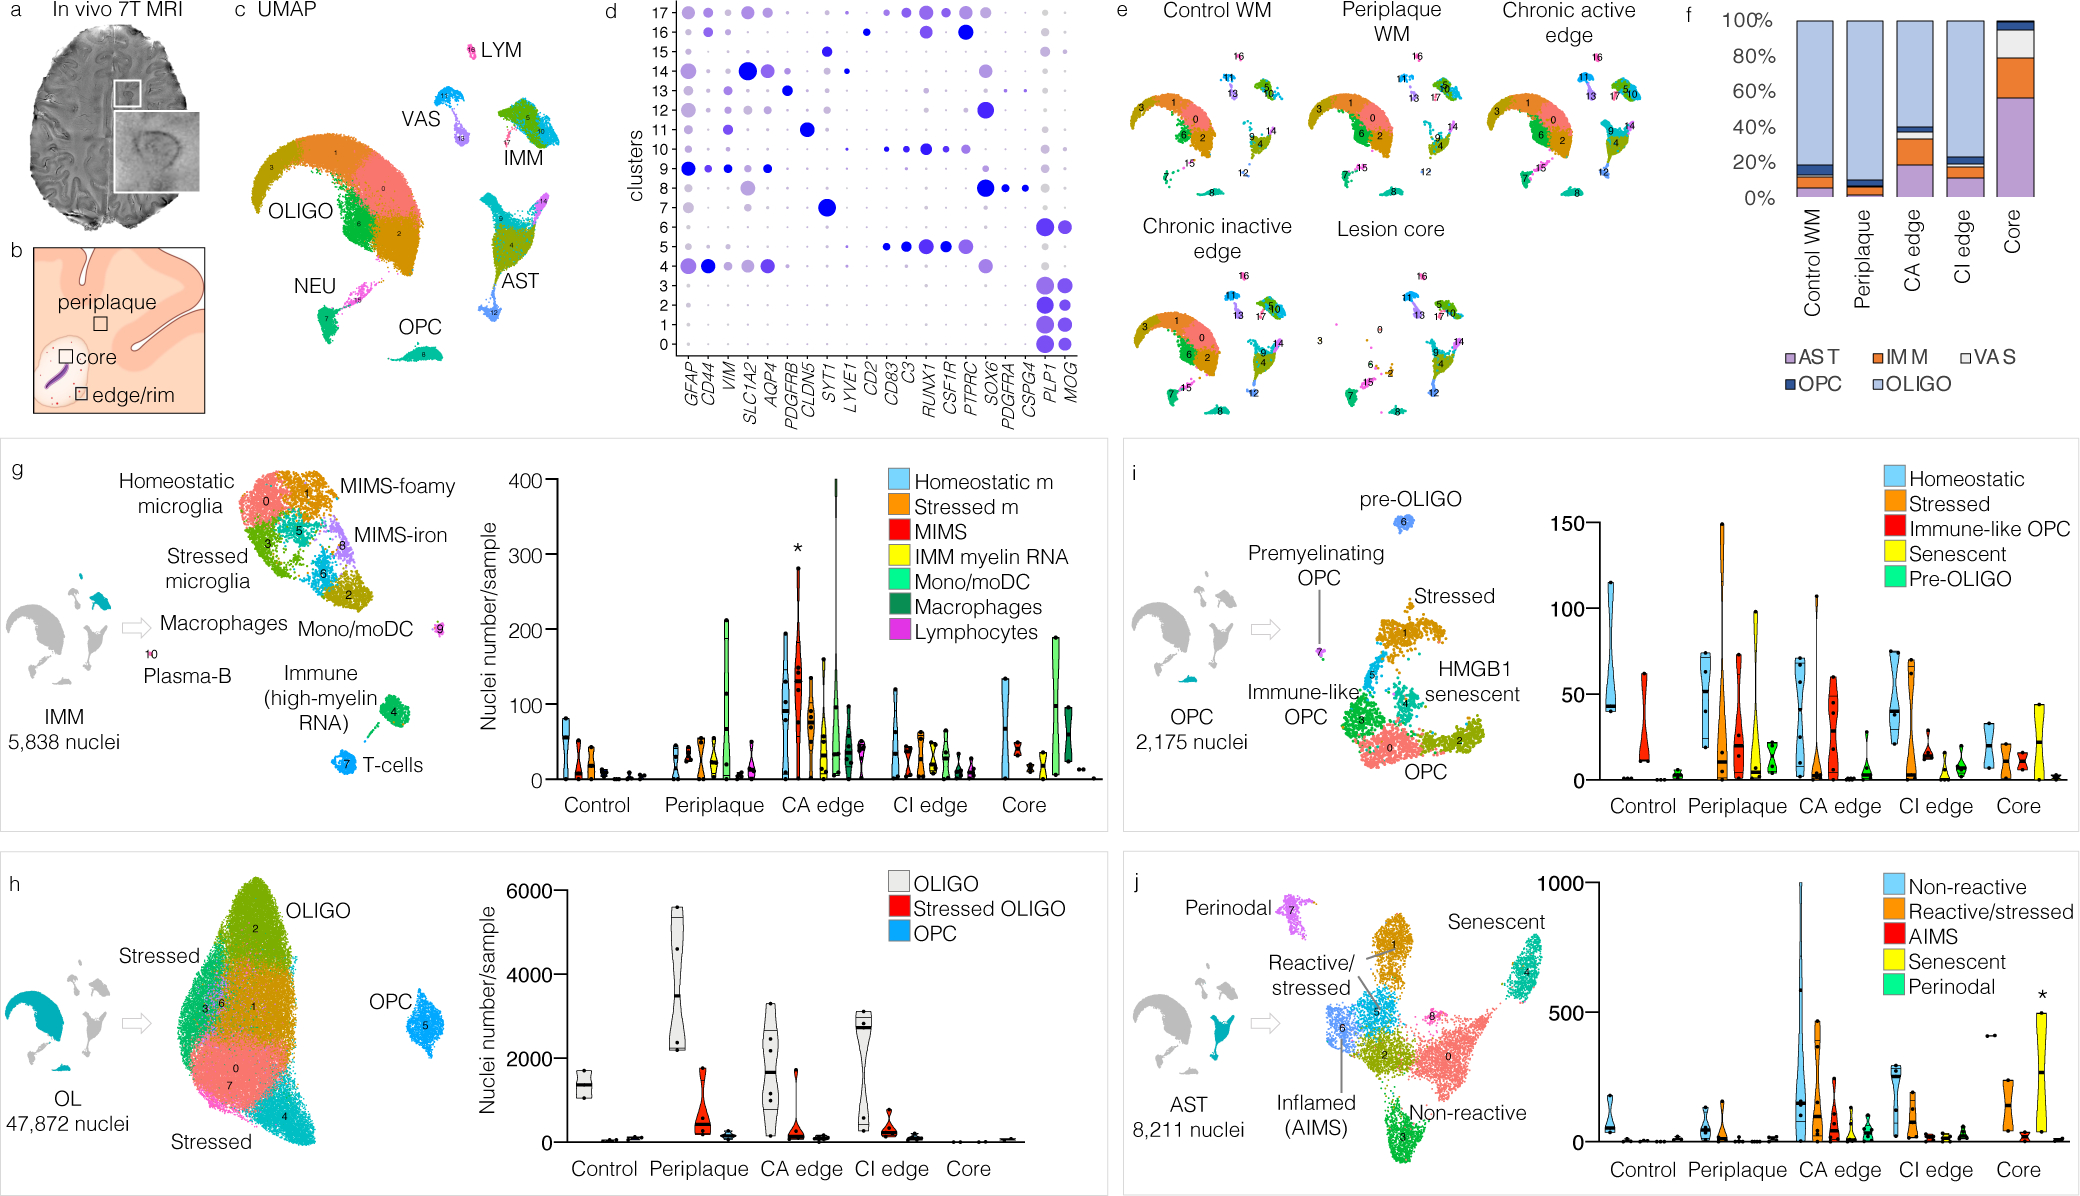
(a) 7-tesla susceptibility-weighted MRI showing a chronic active MS lesion with paramagnetic rim (magnified view, inset) of a 38-year-old man with progressive MS.
(b) Strategic sampling of MS brain tissue.
(c) snRNA-seq clustering of 66,432 nuclei by cell type, labelled based on known lineage markers, and visualized as a UMAP plot. Each dot corresponds to a single nucleus and each colour a cell-type cluster.
(d) Dot plot depicting selected differentially expressed genes for each cluster and associated cluster labelling. Dot size corresponds to the percentage of nuclei expressing the gene in each cluster, and the colour represents the average expression level (scale bars).
(e) snRNA-seq clustering split by pathological condition.
(f) Percentages of different cell populations by pathological condition. Validating our sampling procedure (b), the chronic active lesion edge showed the highest proportion of immune cells.
(g–j) Subclustering (UMAP plots) and annotation for each cell population based on differentially expressed genes in each cluster and relative pathway analysis. Violin plots show the distribution of nuclei number for sample by cell type and pathological condition. All subclustered population profiles showed significant differences across MS pathological stages (two way-ANOVA analysis, column factor p<0.05), with MIMS (g), oligodendrocytes (h), and senescent astrocytes (j) surviving the Tukey’s multiple comparison post-hoc analysis (*p<0.05).
UMAP: uniform manifold approximation and projection; IMM=immune cells, LYM=lymphocytes; OLIGO=oligodendrocytes; OPC=oligodendrocytes progenitor cells; AST=astrocytes; NEU=neurons; VAS=vascular cells; WM=white matter; mono/moDC=monocytes/dendritic cells; MIMS=microglia inflamed in MS; cl=cluster.
To build a detailed map of relevant immune and glial cells, including interactions among them, and to identify cellular and molecular mechanisms operational at the chronic active lesion edge, we applied single nucleus (sn)RNA-seq9 of frozen human brain tissue carefully dissected from the edge of demyelinated WM MS lesions at different stages of inflammation as well as the demyelinated lesion core, the WM periplaque, and normal WM from neurologically healthy brains (Fig.1b–f; Supplementary Table 1). This strategic sampling allowed us to phenotype the glial interactome in chronically inflamed vs. quiescent lesions much more deeply than prior bulk10–12 and single-cell transcriptome work.13
After filtering and quality control, snRNA-seq yielded a total of 66,432 single-nucleus transcriptomic profiles. Overall, 29,432 distinct genes were detected in our analysis. Unsupervised clustering identified 18 initial clusters that were labelled based on known lineage marker genes (Fig.1c–d). We performed subclustering based on differentially expressed genes and canonical cell-type-specific gene expression for each cell type and resolved spatial relationships with highly multiplexed immunofluorescence imaging14 of 26 primary antibodies on brain sections of the same lesions (Supplementary Table 2). We found remarkable pathological stage- and location-specific population diversity in MS lesions vs. control WM (Fig.1; Extended Fig.2–3). Detailed annotation and description of all clusters are provided as Supplementary Information, including lists of the top 100 differentially expressed genes for each (Supplementary Tables 3–7).
Cellular composition across lesion pathological stages
As expected, WM from age- and sex-matched neurologically healthy individuals (49–60 years old, n=5,291 analysed nuclei) was composed predominantly of oligodendrocytes (81%). Remaining nuclei encompassed smaller populations of immune cells (6%), astrocytes (6%), OPC (6%), and vessel-associated cells (1%) (Fig.1e–f). Prevalent cell populations for each cell type were labelled “homeostatic” and compared with cells from MS tissue.
The cellular composition of periplaque WM in MS tissue (n=19,770 analysed nuclei) overall resembled that in normal WM (89% oligodendrocytes) but harboured important differences (Fig.1g–j). Despite the absence of previous or ongoing demyelination as judged by immunostaining, peripheral immune cells infiltrated the periplaque (Fig.1g; Supplementary Table 8), including rare activated CD8 and CD4 T-cells and plasmablasts/plasma cells (CD38, IGHG1, IGHA, IGHM, not expressing MS4A1), monocytes (prevalently expressing CD14), and mature dendritic cells (CD83, NFKB1), suggesting a process of outward lesion propagation involving antigen presentation and induction of the adaptive immune response.15 Other MS-specific cell findings in the periplaque: 15% of the oligodendrocytes (labelled “stressed oligodendrocytes,” Fig.1h) upregulated the unfolded protein response;16 28% of the OPC (labelled “stressed OPC,” Fig.1i) upregulated cholesterol biosynthesis, the unfolded protein response and the regulation of response to stress; and 38% of the astrocytes (labelled “stressed astrocytes,” Fig.1j) upregulated the unfolded protein response, oxidoreductase activity (high expression of mitochondria-related genes) and regulation of cell death.
The edges of chronic active lesions (n=21,522 analysed nuclei) featured significantly more immune cells (15%) and astrocytes (19%), but relatively fewer oligodendrocytes (60%) and OPC (3%), than normal WM (Fisher’s exact test p=0.002), as well as higher population diversity with net decrease of homeostatic populations (Fig.1g–j). By contrast, the cellular composition of the chronic inactive MS lesion edge (n=15,550 analysed nuclei) showed prevalent oligodendrocytes (77%) and astrocytes (12%), whereas the hypocellular demyelinated lesion core (n=4,339 analysed nuclei) was almost devoid of oligodendrocytes (1% of all nuclei, Fig.1). In these areas where prior inflammation had resolved, transcriptomic profiles never returned to those seen in control WM for any cell type and were instead characterized by the expression of fewer inflammatory genes but broad upregulation of the unfolded protein response and oxidoreductase activity. In tissue, p16ink4a senescent cells were identified in higher proportion within the lesion core (average 47% of cells) than in other locations (ANOVA p<0.0001, Extended Fig.7c–d).
MIMS and AIMS at the chronic active lesion edge
At the chronic active lesion edge, immune cells comprised a relatively high proportion of activated T-cells and plasmablasts/plasma cells (6% and 0.6% of all immune cells, respectively) as well as “microglia inflamed in MS” (MIMS; 25% of all immune cells), monocytes/dendritic cells (19% of all immune cells), and monocyte-derived and perivascular macrophages (8% of all immune cells) (Fig.1g). Lymphocytes were predominantly cytotoxic CD8 T-cells (CD2, CD8A, CCL5, SKAP1), with some CD4 T-cells (both central memory and effector memory), and IgG1, IgG3, and IgM-expressing plasmablasts/plasma cells (Supplementary Table 8). In tissue sections, lymphocytes were mostly perivascular (Extended Fig.4, insets 1–2).
The transcriptional profile of MIMS (including TREM2, APOE, LPL, CD68, CD9, CD74, GNR, TYROBP, TIMP2, SSP1, CTSZ, CTSB, FTH1, C1Q) partially overlapped with that described in other neurodegenerative diseases and disease models, including disease-associated microglia (DAM)17–20 (Extended Fig.5). In MS tissue, however, this group of cells split into two distinct subclusters with distinct effector functions (Fig.2; Extended Fig.5), a finding confirmed by reanalysis of raw data from the transcriptomes of 3,527 immune-cell nuclei (8.4% of 41,998 nuclei) and 1,554 immune-cell nuclei (10.5% of 14,763 nuclei) reported in two published snRNA-seq studies13,21 (Extended Fig.6).
Fig. 2. Two MIMS clusters at the chronic active lesion edge have divergent effector functions.
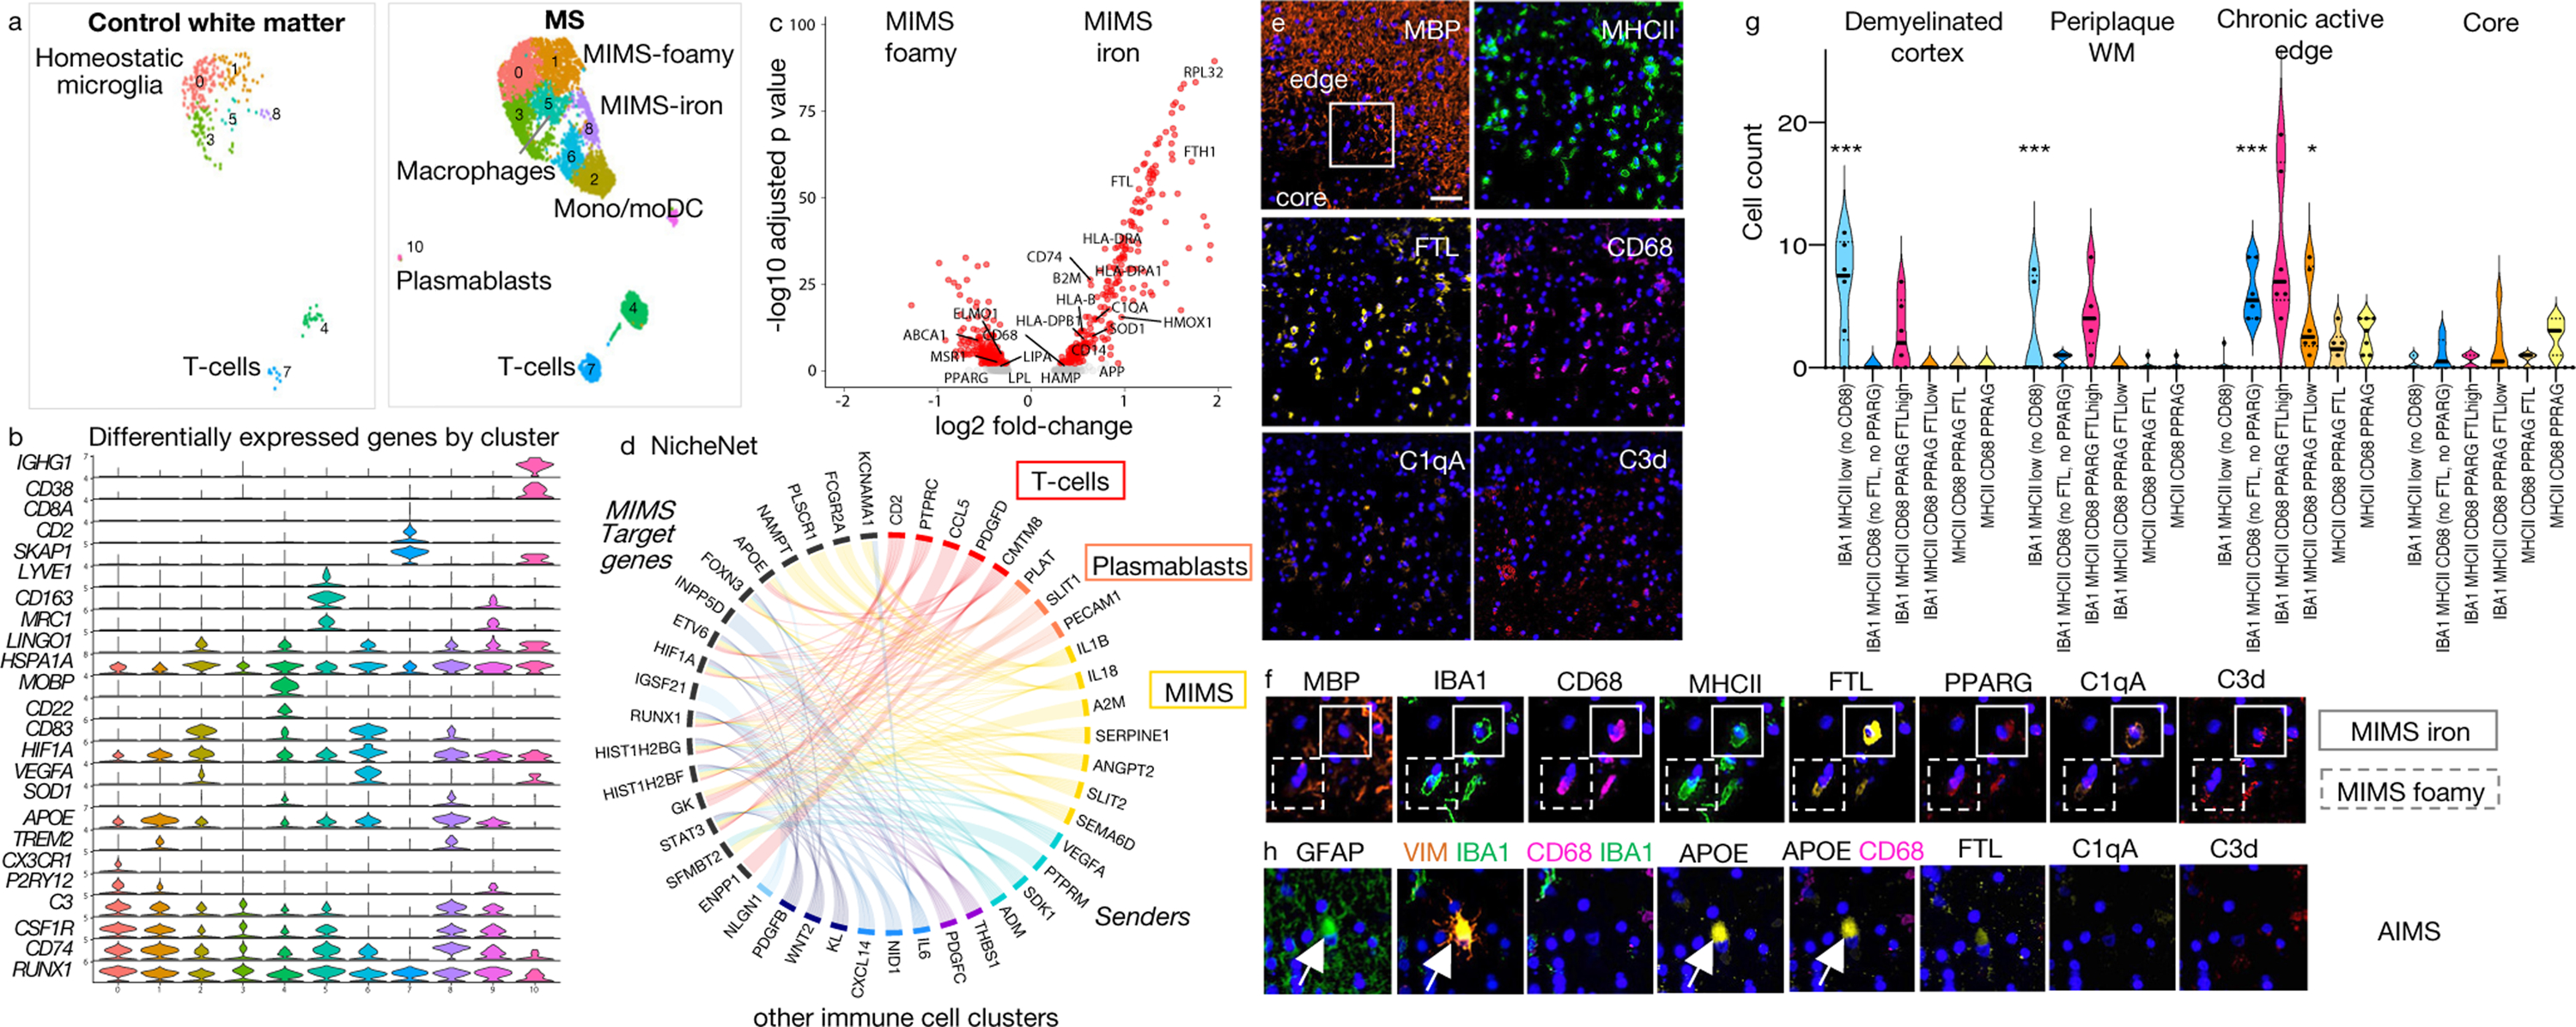
(a) Distribution of immune cell clusters in control and MS WM.
(b) Selected differentially expressed genes for each cluster.
(c) Gene expression changes in the two MIMS clusters. Both upregulated common genes, including TREM2 and APOE (b); however, MIMS-foamy showed relative upregulation of genes involved in lipid phagocytosis/storage, whereas MIMS-iron showed relative upregulation of ferritin, genes involved in antigen presentation, and C1q. p<0.05, two-tailed Student’s t test.
(d) Links between prioritized ligands from immune cells (“senders”) and predicted MIMS target genes (“receivers”) in chronic active lesion edge vs. normal WM (NicheNet). A ligand’s regulatory potential is proportional to ribbon thickness. Ribbon colour indicates subcluster of origin for each ligand; ribbons with regulatory potential below the median are shown in light grey. MIMS target genes are most strongly regulated by lymphocytes and MIMS (autocrine regulation).
(e) Representative multiplex immunostaining showing a dense myeloid inflammatory infiltrate at the chronic active lesion edge (48-year-old woman with progressive MS, case MS4); scale bar=40 𝜇m).
(f) Magnified multiplex immunostaining panel (see box in MBP panel, e) confirming the presence of the two identified MIMS populations by snRNA-seq.
(g) Tissue quantification of myeloid cell populations. All subclustered population profiles showed significant differences across MS pathological stages (two way-ANOVA analysis, column factor p<0.001, row factor p<0.001, Tukey’s multiple comparison post-hoc analysis *p<0.05, **p<0.01, ***p<0.001). The ameboid myeloid population (MIMS-iron) identified as IBA1 MHCII CD68 PPARG FTLhigh was significantly prevalent at the chronic active edge. In the demyelinated cortex and periplaque WM, myeloid populations showed prevalently a ramified morphology.
(h) Representative multiplex immunostaining panel showing AIMS at the chronic active edge.
MIMS=microglia inflamed in MS; AIMS=astrocytes inflamed in MS.
In the first MIMS cluster (labelled “MIMS-foamy”), pathway analysis enriched for foam-cell differentiation and lipid storage (MERTK, LPL, ABCA1, PPARG, MSR1, IL18, ITGAV), response to lipoprotein particles (LPL, APOE, ABCA1, PPARG, CD81), lysosome (LIPA, ASAH1, AP1B1, CTSB, PSAP, PPT1, CTSL), and regulation of inflammatory response (TREM2, APOE, LPL, NUPR1, PLA2G7, CEBPA, PPARG, CD81, PLD3, SERPINE1, HGF, IL18) (Extended Fig.5a), supporting a specific role in myelin phagocytosis and clearance — tasks critical for proper initiation of repair.22,23 These cells were identified in tissue sections by co-expression of IBA1, MHCII, CD68, PPARG, and FTLlow (Fig.2e–g; Extended Fig.4 and 7b).
The second cluster (labelled “MIMS-iron”) upregulated ribosomal proteins reflecting high activation (63 ribosomal proteins within the top 100 differentially expressed genes), MHC class II protein complex (HLA-DRA, HLA-DPA1, CD74), ferritin complex (FTL, FTH1), immunoglobulin Fc-gamma receptors (FCGRT, FCGR2A, FCGR3A), and complement component C1 complex (C1QA, C1QB) (pathway analysis, Extended Fig.5b). Microglial upregulation of Fc-gamma receptors, including FCGR2A, may help break immune tolerance in the presence of IgG immune complexes in MS.24,25 MIMS-iron showed the highest expression of the inflammatory cytokine IL1B (Z-score=1.96 relative to immune cells). When directly compared to MIMS-foamy (volcano plot, adjusted p<0.05, Fig.2c), MIMS-iron had higher expression of MHC-related and inflammatory markers, including SOD1, iron-related genes (FTH1, FTL), and complement C1-complex genes, supporting a role of MIMS-iron in antigen presentation and direct propagation of inflammatory damage at the lesion edge. Upregulation of iron-related genes is consistent with the iron retention seen by MRI at the chronic active lesion edge (PRL biomarker; Fig.1a and Extended Fig.1). MIMS-iron were identified in tissue by co-expression of IBA1, MHCII, CD68, and FTLhigh (Fig.2e–g; Extended Fig.4 and 7b).
To evaluate how the immune cell environment can modulate MIMS gene expression, we used NicheNet26 to prioritize ligands from immune cells and predict MIMS target genes. Here, we focused on the genes differentially expressed at the chronic active lesion edge relative to control WM (adjusted p<0.05). MIMS target genes are especially regulated by T-cells, plasmablasts/plasma cells and by MIMS themselves in an autocrine fashion (Fig.2d). Of note, about one third of differentially expressed genes in both MIMS populations (106/315 in MIMS-iron and 92/282 in MIMS-foamy) are regulated by interferon-gamma,27 indicating a type II interferon response.
In addition to MIMS, expanded populations of reactive and inflamed astrocytes (37% of astrocytes), stressed oligodendrocytes (19% of oligodendrocytes), and “immunological” OPC (23% of OPC) were present at the chronic active lesion edge (Fig.1). “Immunological” OPC have recently been described in mouse MS models28,29 and MS tissue21 and are thought to contribute to antigen presentation and cytotoxicity upon interferon-gamma signalling. The prevalence of premyelinating OPC (~1% of all OPC) did not significantly differ across pathological stages (Fig.1i).
Among astrocytes at the chronic active edge, an expanded population — labelled “astrocytes inflamed in MS” (AIMS) (Fig.1j) — upregulated GFAP, APOE, VIM, S100B, SOD1, and ferritin genes (FTL, FTH1). These identified in tissue by expression of VIM, GFAP, APOE, and FTLlow, but not IBA1 or CD68 (Fig.2h–4c; Extended Fig.4). AIMS enriched for response to lipid, corticosteroids, and wounding (Supplementary Table 7). Interestingly, some previously reported proinflammatory genes (“A1-astrocytes”),30 notably C3, showed higher expression in AIMS (Z-scores 1.3–2.6 relative to other astrocytes; Extended Fig.3d).
MIMS-AIMS hubs of the glial interactome
Analysis of the first 20 significant connections of the glial interactome (Z-scores 6.2–10.8, p<0.05) indicated that, in chronic active lesions, MIMS and AIMS form a central hub with direct connections to all other immune and glial clusters (Fig.3a). At the chronic inactive edge and lesion core, the interactome lacked a clear central hub and showed fewer interactions among glial clusters (n=15, Z-scores 3.3–7.5). The MIMS-AIMS gene-module interaction was further confirmed using weighted correlation network analysis (WGCNA;31 Fig.3b, Extended Fig.8, Supplementary Table 9).
Fig. 3. MIMS-AIMS anchor the glial interactome, and C1q and C3 are elevated in chronic active WM lesions.
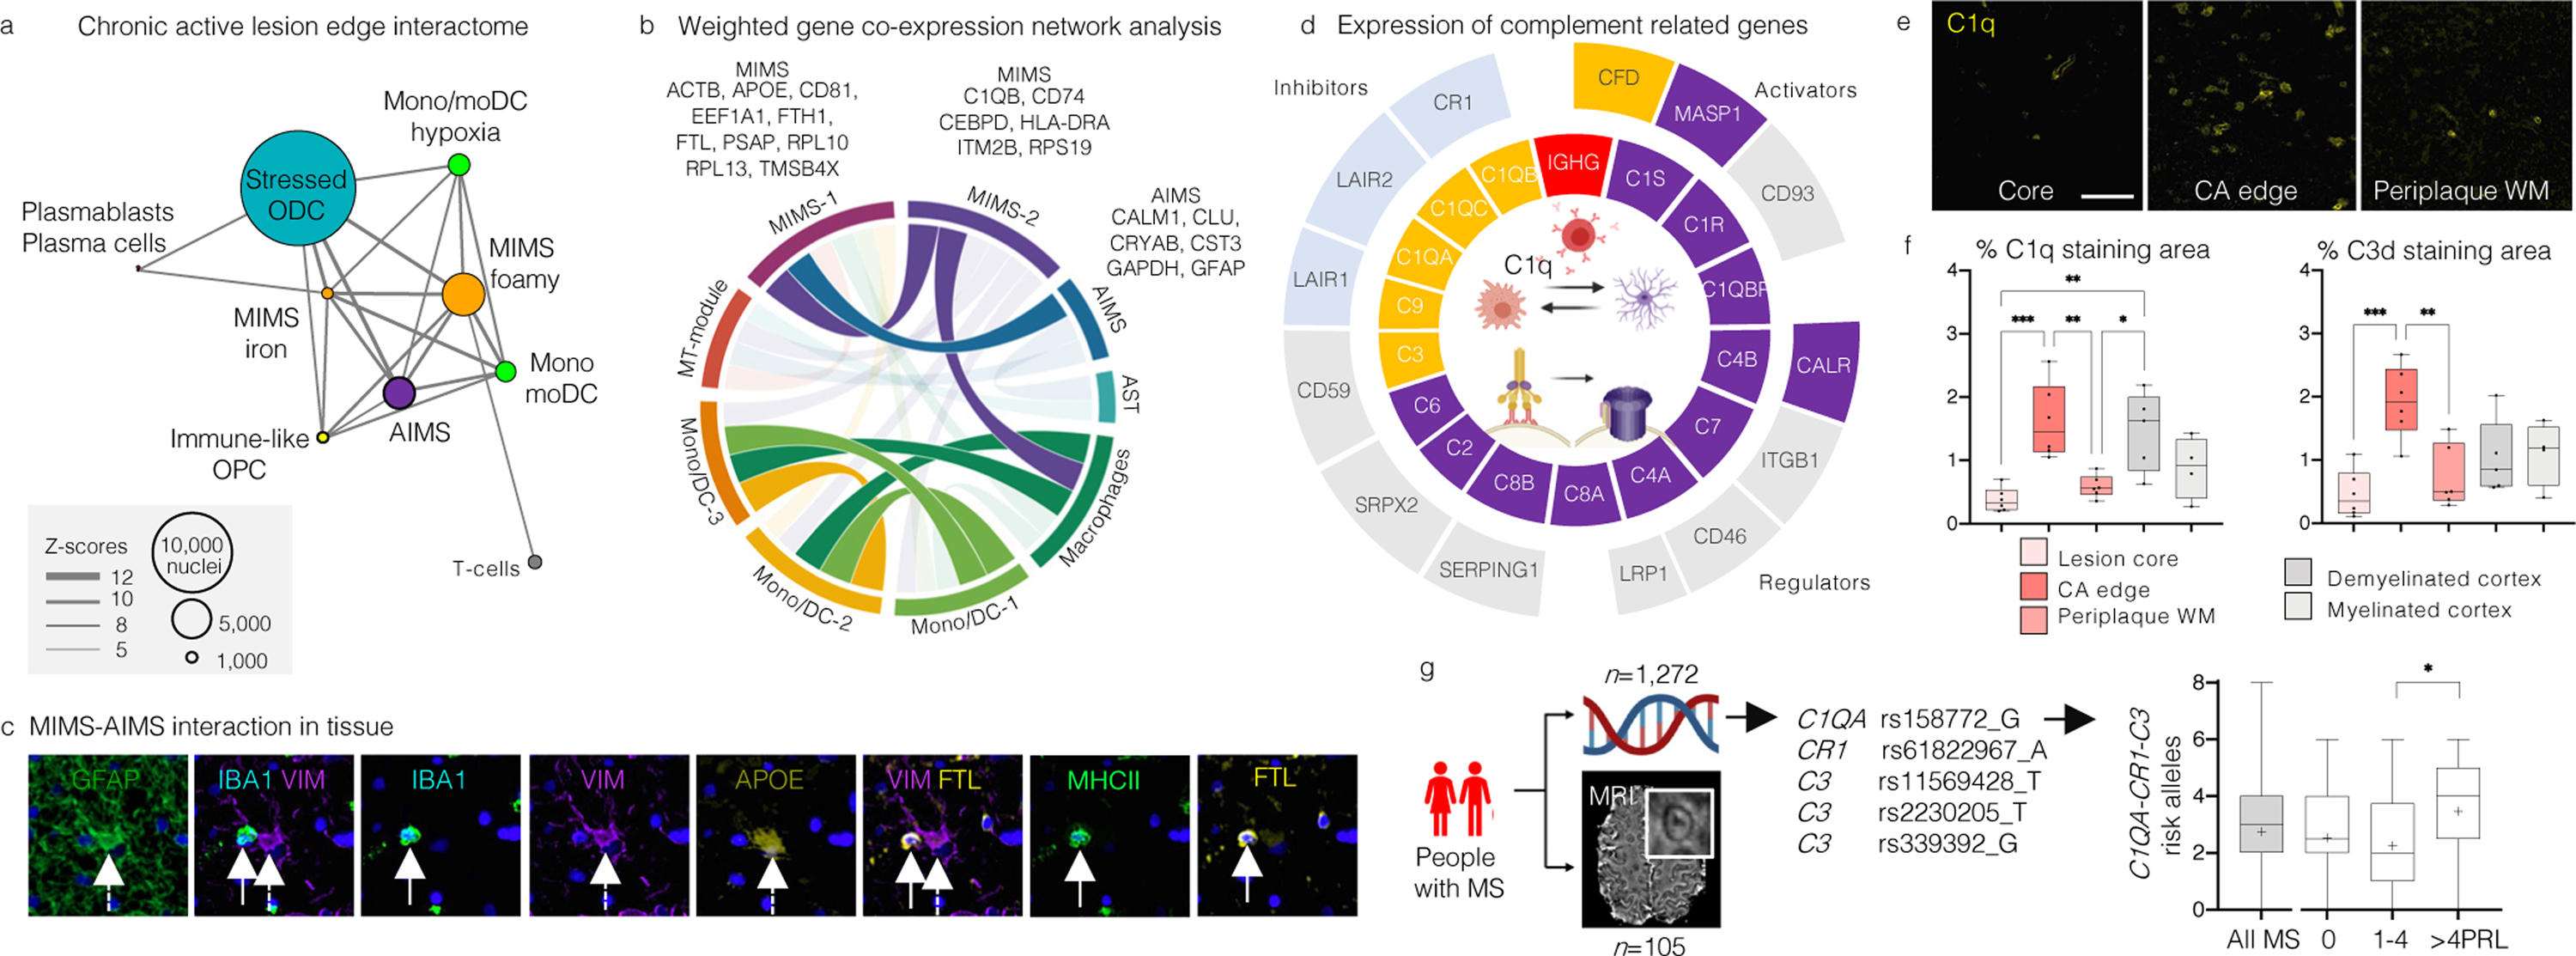
(a) Glial interactome map of the chronic active lesion edge (first 20 significant connections, p<0.05). Each node indicates a cell-type cluster; node size proportional to number of nuclei, connector thickness to Z-scores of the MetaCore interactome output.
(b) Correlations among gene modules in immune and astrocyte clusters using WGCNA, retaining only variable genes for chronic active edge vs. control WM; module size <50 genes. Ribbon colour-scale: eigengene adjacency matrix values (highest quartile, dark colour). MIMS and AIMS gene modules are highly correlated.
(c) Spatial interaction between MIMS (dashed white arrow) and AIMS (white arrow) in tissue at the chronic active edge.
(d) Z-scores (>1.5 relative to all nuclei) for expression of classical complement cascade genes (inner circle) and their regulators (outer circle). C1Q, C3, and CFD were expressed mainly by MIMS-iron, and C1R, C1S, C1QBP, C3, and CALR by AIMS.
(e) Upregulation of C1q at the chronic active edge relative to periplaque WM and lesion core (scale bar=40 𝜇m).
(f) Quantification of C1q and C3d staining percentage area (430×790μm viewing area) in tissue at different locations (ANOVA p=0.0003 and p=0.0009, respectively; Tukey’s multiple comparison post-hoc analysis *p<0.05, **p<0.01, ***p<0.001); both complement components are highly expressed at the chronic active edge.
(g) MRI-genotyping of a cohort of MS patients to assess the cumulative presence of complement risk variants and chronic active lesions (PRL) in vivo. Cases with >4 PRL had more complement-associated risk variants than those with fewer or no PRL (ANOVA p=0.04, Tukey’s multiple comparison test *p=0.035).
MIMS=microglia inflamed in MS; AIMS=astrocytes inflamed in MS; WCGNA=weighted correlation network analysis.
MIMS therapeutic modulation
The centrality of MIMS in the glial interactome prompted us to predict, based on transcriptome profile, the effects of known pharmacological compounds (Supplementary Tables 10–11). Interestingly, compounds in some of the predicted drug classes have already been tested in MS in phase 2 clinical trials, including BTK inhibitors, ibudilast, estriol, and simvastatin, but there are no clinical or radiological data regarding the effects on chronic active lesions.
To address whether PRL might potentially respond to external pharmacological intervention, we assessed their long-term evolution. In a prospective cohort of 92 MS cases,4 10 were followed yearly by 7-tesla MRI (mean: 6.1 years; range: 3.5–9.3 years). In the 70 PRL longitudinally evaluated (average PRL per case=7; range: 1–15), 27/70 (39%) paramagnetic rims were stable, 33/70 (47%) faded over time, and 10/70 (14%) disappeared at last follow-up, though the lesions themselves were still clearly visible on both T1- and T2-weighted MRI (Extended Fig.1c–d). Based on these data, we estimated the paramagnetic rim median survival time as ~7 years (Extended Fig.1e). This and previous32 findings strongly motivate the search for tissue protective and reparative therapies that would act much more rapidly to resolve chronic WM inflammation. We performed a power analysis for future proof-of-concept clinical trials, estimating that only 16 patients per arm (with a total of 112 PRL) are required to test the efficacy of trialled drugs to accelerate resolution of the paramagnetic rim over one year of study (80% power to detect 10% difference in the proportion of fading/disappeared PRL between treated and untreated groups with p<0.05).
C1q critically mediates microglia activation
Given the upregulation of C1Q at the chronic active lesion edge (Supplementary Table 12, Figure 3e–f),24 further exploration of cell-type-specific complement gene expression implicated immune, astrocyte, and vascular populations (Fig.3d–f; Extended Fig.9a–c). C1QA, C1QB, C1QC, and CFD (a C3 activator) were expressed mainly by MIMS, whereas AIMS showed ~20-fold upregulation (relative to nonreactive astrocytes) of C1q complex activators (C1S and C1R) and C1q receptors (CALR, C1QBP), as well as upregulation of C3. The expression of C3 receptors (C3AR) by MIMS further implicates early complement genes as mediators of crosstalk between MIMS and AIMS.
Based on previous results from MS genome-wide association studies (GWAS)33,34 (Extended Fig.9d), we genotyped and assessed the cumulative presence of complement risk variants (one C1QA, one CR1, and three C3 risk variants) in a cohort of 1,272 MS cases (932 women, median=3 of 10 risk variant alleles), 105 of whom were classified based on the 3T MRI presence of chronic active lesions (PRL) in vivo. Cases harbouring >4 PRL — an identified clinically relevant threshold4 — had more complement-associated risk variants than those with fewer or no PRL (ANOVA p=0.04, Tukey’s multiple comparison test p=0.035, Fig.3g), suggesting the potential role of early complement gene variants in impaired resolution of perilesional chronic inflammation.
To study whether C1q directly impacts MIMS activation, we conditionally ablated C1q in microglia in mice using the microglia-specific TMEM119-CreER driver35 (C1q cKO; Extended Fig.10a–d). As complement has been implicated in pathology at EAE onset in the visual thalamus,36 we focused our analyses in this region and this early time point (before peak disease). Control (Ctrl) mice were defined as C1qafl/fl;TMEM119-CreERT/+ littermates injected with oil or C1qafl/fl treated with tamoxifen (no apparent difference in treatments). Remarkably, following C1q microglial ablation, the vast majority of C1q immunoreactivity and mRNA in the brain was eliminated, which is consistent with previous reports demonstrating that microglia are the primary source of C1q in the CNS.37,38 However, C1q remained in peripheral infiltrating cells, and there was no change in liver mRNA levels. Density of Iba1+ cells and microglia with morphologies consistent with reactive gliosis (hypertrophic and ameboid Iba1+ cells) were higher in Ctrl mice with EAE (Ctrl-EAE) than Ctrl-CFA mice. The DAM marker Clec7a was also higher in Ctrl-EAE mice. In comparison, the increase in all these reactive microgliosis indicators was largely attenuated in microglia-specific C1q cKO mice (Extended Fig.10a–d; Source Data). Interestingly, this did not reflect a change in EAE clinical onset and score in C1q cKO mice relative to Ctrl-EAE (Extended Fig.10), possibly reflecting spinal cord pathology. Together, these data demonstrate that microglial C1q affects the reactive state of the cells in the brain and, potentially, their role in driving inflammatory neurodegeneration.
To implement a more clinically relevant paradigm, we tested the impact of a C1q-blocking antibody (ANX-M1.21; Extended Fig.10e–k, Source Data) on reactive gliosis in neighbouring hippocampal WM at a later EAE timepoint. ANX-M1.21 efficiently reduced C1q intensity staining in the brain. At day 42 post EAE induction, both Iba1+ cells and the proportion of Iba1+ FTL+ cells were significantly reduced (p<0.05), suggesting that pharmacological inhibition of C1q is a potential therapeutic avenue to address chronic inflammation in WM. Of note, this mechanism differs from that previously described in grey matter damage, which primarily implicates C3 in synaptic targeting, selective pruning, and circuit remodeling.36,39
Limitations
Larger cohorts are required to substantiate our findings regarding PRL resolution and the relevance of complement gene variants. In the snRNA-seq study, we privileged location and pathological stage in tissue selection to control for within-patient variability and restricted the age range of the cases to mitigate confounding effects of aging in glial subpopulations, thereby limiting the number of autopsy cases. Nonetheless, a thorough re-analysis of previously published snRNA-seq datasets (Extended Fig.6)13,21 shows generalizability of our main results. Additional limitations included the fact that snRNA-seq only evaluates pre-mRNA nuclear transcripts, and lymphocyte clonality analysis was not possible due to the relative low number of these cells.
In conclusion, we identified pathological stage- and location-specific population diversity in MS lesions and built a detailed map of immune and glial cell populations and their interactions. This single-nucleus transcriptome analysis was motivated by, and explicates, a recently discovered MRI biomarker (the paramagnetic rim lesion), which can identify chronic active MS lesions in vivo, track their evolution, and gauge their association with early clinical disability progression.4 This work strongly suggests that chronic inflammation in MS might be pharmacologically modulated, identifies relevant cellular and molecular targets (especially C1q), and motivates use of the PRL biomarker as an imaging readout in future proof-of-concept clinical trials.
Methods
Human single-nucleus RNA sequencing
Brain tissue
Frozen and paraffin-embedded mirror brain tissue blocks were provided by the Netherlands Brain Bank (5 progressive MS patients and 3 age- and sex-matched non-affected, non-demented controls). For tissue selection, initial pathological staging and characterization of MS lesions was provided by the Netherlands Brain Bank.40 Postmortem interval was limited to 12 hours to ensure tissue quality. For each case, 2 different tissue blocks containing MS lesions, one chronic active and one chronic inactive, were obtained to minimize the patient effect on our analysis. Details regarding the main features of brain tissue implemented and sampling strategy (using a 3mm-punch biopsy tool and a cold blade) are reported in Supplementary Table 1.
Nuclei extraction
Nuclei extraction from snap-frozen human brains was performed according to the following protocol.41 On wet ice, the frozen, dissected tissue was lysed using a Dounce homogenizer (10 strokes with the loose pestle followed by 20 strokes with the tight pestle) in 600-μl of freshly made cold lysis buffer (low sucrose buffer, Triton X-100 20%, Rnase inhibitor 40U/μl). Part of the homogenate (200 μl) was collected for bulk RNA extraction (Qiagen RNAeasy kit) and stored at −80°C for future applications. The remaining homogenate was filtered through a 40-μm cell strainer for nuclei extraction with 4-ml of low sucrose buffer (0.64M sucrose, HEPES pH8, CaCl2, MgAc, EDTA, DTT, nuclease-free water). Sonication of the homogenate was performed for 10 sec. To remove cellular and myelin debris, a sucrose gradient (12-ml of high sucrose buffer [2M sucrose, HEPES pH8, MgAc, DTT, nuclease-free water] underneath the low sucrose buffer) was centrifuged at 3,200 g for 30 minutes, and the supernatant was discarded. Nuclei were resuspended in 1-ml resuspension solution (PBS, 5% BSA and RNAse inhibitor 40U/μl) and centrifuged for 12-min at 3,200 g. Nuclei were again resuspended in 50-μl cold resuspension solution. Nuclei were counted using trypan blue and a haemocytometer under bright field. A yield of 700–1,200 nuclei/μl per sample was targeted.
Single-nucleus RNA-seq
Immediately after extraction, 5,000 nuclei/sample were loaded onto a Chromium Single Cell 3′ Chip (10X Genomics) and processed for the single-nucleus cDNA library preparation (Chromium Single Cell 3’ version 3, 10X Genomics) according to the manufacturer’s instructions without modifications. The remaining nuclei were stored at −80°C for future applications. Before sequencing at high resolution, each cDNA library was tested using the High Sensitivity DNA Assay on the Agilent 2100 Bioanalyzer. Before sequencing, samples were also pooled into groups of 8 and tested using MiSeq to estimate sequencing parameters and mapping to the human genome. All samples were judged suitable for deep sequencing. 50,000 reads/nucleus were sequenced using the Illumina HiSeq platform. Preparation of cDNA libraries and sequencing support were performed at the DNA Sequencing and Genomics Core (NHLBI/NIH). Downstream analysis utilized the computational resources of the NIH HPC Biowulf cluster (http://hpc.nih.gov). CellRanger software was implemented for library demultiplexing, barcode processing, fastq file generation, gene alignment to the human genome (pre-mRNA GRCh38-3.0 human genome), and unique molecular identifier (UMI) counts. For each sample, a CellRanger report was obtained with all the available information regarding sequencing parameters and mapping parameters. Details regarding the number of nuclei per sample implemented for the downstream snRNA-seq bioinformatic analysis are reported in Supplementary Table 1. All 20 samples were merged into a matrix using CellRanger (“cellranger -aggr” function).
Single-nucleus RNA-seq bioinformatic analysis
Downstream analysis implemented the Seurat v3 R-based package.42 The matrix was loaded to create an object in Seurat v3. Metadata, including sex, age, patient, disease, and pathological stage, were added. Based on Seurat guidelines for single-nuclear RNA seq, only nuclei with <5% of mitochondrial contamination and between 200 and 2500 genes expressed were retained for further analysis. The upper limit of 2500 for gene number excluded some oligodendrocyte and neuronal nuclei (not expected in high number due to the WM sampling) while favouring other glia and reducing the probability of doublets, which can lead to spurious conclusions. The filtered raw count matrix was log-normalized within each nucleus (“LogNormalize” method normalizes the gene expression for each nucleus by the total expression, multiplies this by a scale factor of 10,000, and log-transforms the results). The top 2000 variable genes calculated by Seurat (selection method “vst,” 2000 features per dataset) were used to harmonize and integrate sample datasets by patient (“FindIntegrationAnchors” and “IntegrateData” functions).43 The dataset was then scaled to remove unwanted sources of variation such as batch effects. On scaled data, linear dimension reduction (principal component analysis, PCA) was performed, and the top 30 PCA were implemented for the unsupervised clustering. Seurat applies a graph-based approach to clustering: the “FindNeighbors” function implements the first 10 PCA to construct the KNN graph based on the Euclidean distance in PCA space, and the “FindClusters” function applies the Louvain algorithm to iteratively group nuclei (resolution=0.5). We then calculated and implemented, for cluster visualization, the uniform manifold approximation and projection (UMAP). As an additional quality control step, to identify and remove outliers, a correlation matrix was calculated across nuclei by clusters, as was the average correlation for each nucleus with all other nuclei. The averages were then Z-scored, and only those nuclei within a cluster having an average correlation corresponding to a Z-score-based p≥0.05 were retained in the analysis (n=66,432 of the initial 72,959 nuclei). The assignment of cell type identity to clusters was then based on known cell lineage markers, as well as comparison with previously published and reported snRNA-seq studies.13,21 For each cluster, we extracted the average gene expression for all identified genes (n=29,432), as well as the top 200 differentially expressed genes. A differentially expressed gene was defined as a gene significantly expressed (p adjusted for multiple comparison p<0.05) in ≥25% of cell populations and showing, on average, >0.25-fold difference (log-scale) between groups of cells.
Subclustering
Based on the assigned cell population annotations, a series of subclusterings were done on immune cells, astrocytes, oligodendrocyte lineage cells, and OPC populations, using the same unsupervised algorithm and downstream analysis, except for the integration step, which was substituted by harmonization (by samples) using the Seurat-compatible Harmony pipeline (“RunHarmony” function).44 For peripheral immune cells (from immune clusters 2, 6, 7, and 10), where nuclei counts were relatively low, annotations were further refined by implementing a multimodal reference atlas for circulating immune cells (https://satijalab.org/seurat/v4.0/reference_mapping.html).
Gene enrichment and pathway analysis
Gene enrichment and pathway analysis was performed for each cell population using a variety of software packages (MetaCore Clarivate Analytics, Reactome,45 g:Profiler,46 Metascape47), and results were compared for consistency and overall pathological interpretation. Loading the top 100 differentially expressed genes for each glial cluster of interest, we also performed an experimental interactome analysis (MetaCore Clarivate Analytics Interactome commercial toolbox, following the manufacturer’s instructions), plotting the connectivity network using ggnetwork2 and ggplot R-based libraries (nodes=cell clusters and edge/weights=Z-scores of MetaCore interactome output). Two connectivity maps were created, one for the edge of chronic active lesions and the other for the edge of chronic inactive lesions, based on their specific distribution of cell populations. For the chronic active edge, only the first 20 significant connections (p<0.001, self-connections excluded) were plotted in the graphs for readability.
NicheNet ligand-receptor-target analysis
NicheNet26,48 was implemented to model intercellular communication between immune cells (top 50 prioritized ligands, “senders”) and MIMS (predicted target genes, “receivers”). The analysis was performed using the previously generated immune cell subset Seurat object and according to detailed instructions (https://github.com/saeyslab/nichenetr). The list of differentially expressed genes at the chronic active lesion edge vs. control white matter (expressed in ≥10% of nuclei in one cluster, adjusted p<0.05, absolute average log fold-change >0.25) was used as the input gene set. Circos plots were realized (http://circos.ca/).49
Weighted gene co-expression network analysis
The weighted gene co-expression network analysis (WGCNA) R package31 was implemented to identify gene modules and co-expression networks among immune cells (excluding lymphocytes) and reactive/inflamed astrocytes (7,438 nuclei from cluster 5, 9, and 10 of the initial UMAP). The set of 981 variable genes was identified using the ‘‘varFilter’’ package from Bioconductor. Gene module identification was performed by WGCNA’s ‘‘blockwiseModules’’ function (networkType=“signed”, soft power=10, mergeCutHeight=1E-08, deepSplit=4, minModuleSize=5). The gene module hierarchical clustering dendrogram and the eigengene adjacency matrix were plotted using the ‘‘plotEigengeneNetworks” function. We also generated Circos plots (http://circos.ca/).49
Drug-interaction prediction analysis
The drug-target interaction prediction analysis was performed using MetaCore Clarivate Analytics Drug Lookup commercial toolbox, following the manufacturer’s instructions. The top 250 differentially expressed genes (Bonferroni-adjusted p<0.001) from the comparison between MIMS clusters and homeostatic microglia were implemented as input.
Re-analysis of immune cells subset from prior single nucleus RNA-seq of MS tissue13,21
We downloaded all raw snRNA-seq data available (SRA accession number PRJNA544731) from Schirmer et al., Nature 2019,13 where nuclei were extracted from entire MS tissue sections (including demyelinated lesions, white matter, and cortex, such that neurons represented ~25% of all nuclei, n=12 cases) and compared to similarly processed non-neurological control brain tissue (n=9 cases). This procedure is importantly different from our tissue selection, which involved careful dissection of lesion pathological locations and stages. We processed the raw data, starting from the library demultiplexing, as described above for our own data.
We also downloaded the available gene expression matrix from a second snRNA-seq study (Jäkel et al., Nature 2019),21 where the nuclei were extracted from both MS lesions (n=4 cases) and non-neurological control brain tissue (n=5 cases). This dataset also includes a high percentage of neurons (23.5% of all nuclei), suggesting inclusion of both white and gray matter in tissue sampling.
For both datasets, the same Seurat code was then implemented to generate the first UMAP, with cell population annotations and subclustering as described above. Comparison between our data and the re-analysed data was based on the previously identified immune cell clusters and key differentially expressed genes for each cell population. To determine the number of nuclei overlapping with our identified clusters, immune cell datasets were also projected onto our immune cell UMAP (using the Seurat functions “SCTransform” to normalize the datasets, “FindTransferAnchors” to identify anchors between datasets and “MapQuery” to map the target dataset onto the reference dataset, as described in https://satijalab.org/seurat/articles/integration_mapping.html).
Mapping GWAS-prioritized susceptibility genes onto snRNA-seq datasets
A list of 558 prioritized MS-susceptibility genes was obtained from a recent genome-wide association study (GWAS)33 and mapped onto all 3 snRNA-seq datasets (the current dataset as well as that of Schirmer et al.13 and Jäkel et al.21). Low-expressed genes (within the 25th percentile average expression) were excluded. MS-susceptibility genes were then assigned to clusters if the z-scored average gene expression was >2. Clusters were classified based on the number of MS-susceptibility genes (>80, 50–80, 30–50, 1–30 and <10 genes) and results were colour-mapped onto each snRNA-seq UMAP.
Human multiplex immunofluorescence staining
Multiplex fluorescence immunostaining was performed on 5-μm-thick paraffin sections using 6 iterative rounds of sequential immunostaining14 with antibody panels (26 primary antibodies in total, Supplementary Table 2 and Extended Fig.7a) based on the results of snRNA-seq data. Each round of antibody staining was imaged by fluorescence microscopy, after which antibodies were stripped and the tissue re-stained with a different antibody panel. Briefly, after deparaffinization and antigen retrieval (a 10-minute heat-mediated step in 10-mM Tris/EDTA buffer pH 9.0 using an 800W microwave set at 100% power), sections were incubated with Human BD Fc Blocking solution (BD Biosciences) to saturate endogenous Fc receptors, and then in True Black Reagent (Biotium) to quench intrinsic tissue autofluorescence. The sections were then incubated for 1 hour at room temperature using a cocktail of immunocompatible Antibody Panel #1, then rinsed with PBS supplemented with 1-mg/ml bovine serum albumin (BSA) and incubated with a cocktail of the appropriately cross-adsorbed secondary fluorescent antibodies. After washing, sections were counterstained using DAPI (Thermo Fisher Scientific) for visualization of cell nuclei. Slides were then cover-slipped using Immu-Mount medium (Thermo Fisher Scientific) and imaged using a multichannel wide-field epifluorescence microscope (see below). After imaging, tissue-bound primary and secondary antibodies were both stripped off the slides after a 5-minute incubation at RT in NewBlot Nitro 5X Stripping buffer (Li-Cor Biosciences), followed by a 1-minute additional heat mediated antigen retrieval step in Tris/EDTA buffer. The above processing cycle, beginning with re-blocking of tissues in Human BD Fc Blocking solution, was repeated, and the same sections then incubated using the second, third, fourth, and fifth antibody mixtures (Supplementary Table 2).
Images were acquired from whole sections using an Axio Imager.Z2 slide scanning fluorescence microscope (Zeiss) equipped with a 20X/0.8 Plan-Apochromat (Phase-2) non-immersion objective (Zeiss), a high-resolution ORCA-Flash4.0 sCMOS digital camera (Hamamatsu), a 200W X-Cite 200DC broad band lamp source (Excelitas Technologies), and 7 customized filter sets (Semrock) optimized to detect the following fluorophores: DAPI, Alexa Fluor 430, Alexa Fluor 488, Alexa Fluor 546, Alexa Fluor 594, Alexa Fluor 647 and IRDye 800CW. Image tiles (600 × 600 μm viewing area) were individually captured at 0.325-μm/pixel spatial resolution, and the tiles were seamlessly stitched into whole-specimen images using ZEN 2 image acquisition and analysis software (Zeiss), with an appropriate colour table applied to each image channel to either match its emission spectrum or to set a distinguishing colour balance. Pseudocoloured, stitched images acquired from all 5 rounds of antibody staining and imaging were then exported to Adobe Photoshop and overlaid as individual layers to create multicoloured merged composites. Immune cell count quantification was performed in randomly selected areas (430 × 790 μm viewing area) of the lesion core and edge, periplaque white matter, and cortex. Senescent cell percentage quantification (percentage of nuclei positive for p16INK4a) was performed in randomly selected areas (430 × 790 μm viewing area) of the lesion core and edge, periplaque white matter, cortex, and control tissue using ImageJ/Fiji software.50 C1q and C3d percentage staining area were performed in randomly selected areas (430 × 790 μm viewing area) of the lesion core and edge, periplaque white matter, myelinated and demyelinated cortex using ImageJ/Fiji software.50
Chromogenic immunostaining
Tissue validation markers were tested using chromogenic immunostaining. Briefly, after deparaffinization, 5-μm-thick paraffin sections were processed for antigen retrieval (either citrate or EDTA buffer) using a steamer for 30 minutes and protein blocking solution for 20 minutes. Sections were then incubated with the primary antibodies overnight at 4°C or 1-hour at room temperature, then rinsed and incubated with secondary antibodies for 30 minutes. Either the immunoperoxidase (DAB) or the alkaline phosphatase (AP) methods was used for development. After washing, sections were counterstained with 10% haematoxylin.
Diaminobenzidine (DAB)-enhanced Turnbull (iron) staining
Five-μm-thick paraffin sections were immersed in 2% ammonium sulfide solution for 90 minutes, then washed with dH2O. Sections were incubated with 10% potassium ferrocyanide solution and 0.5% hydrochloric acid solution at temperature 37 °C (oven) for 15 minutes. After washing in dH2O five times for 3 minutes, sections were incubated in 0.3% H2O2 in methanol for blocking endogenous peroxidase. After washing in PBS, iron staining was amplified by DAB solution (Abcam, #ab94665) and counterstained with 10% haematoxylin.
Postmortem 7T MRI protocol for formalin-fixed brains
Before scanning, formalin-fixed brains were placed in an MRI-compatible container filled with Fomblin as previously described.51 Fixed brains were imaged on a Siemens Magnetom 7T MRI scanner equipped with a birdcage-type transmit coil and a 32-channel receive coil with the following sequences:
3D high-resolution multigradient-echo (GRE) T2* sequence providing both T2*-weighted magnitude contrast and susceptibility-weighted phase contrast: repetition time (TR)=60 ms; echo time (TE)=6.09, 15.99, 25.89, 35.79 ms; 4 averages; 88 slices; flip angle (FA)=10°; acquisition time (AT)=2 hours 15 min per 36-mm slab; nominal resolution=0.42 mm isometric, voxel volume=0.07 μL; 4 coronal slabs with 20% overlapping slices acquired to cover the whole brain.
Whole-brain 3D T1-MPRAGE with TR=2200 ms; TE=3.04 ms; inversion time (TI)=1050 ms; FA=7°; AT=7 min; nominal resolution=0.6 mm isometric, voxel volume=0.22 μL; 176 coronal slices.
Clinical cohort: in vivo longitudinal MRI study and clinical trial power analysis
Between January 1, 2011, and December 31, 2020, imaging, laboratory, and clinical data were collected at the National Institutes of Health (NIH) with Institutional Review Board approval after written, informed consent. Inclusion criteria were age≥18; diagnosis of MS according to the 2010 McDonald revised MS criteria,52 and availability of longitudinal 7T brain MRI studies (>3.5 years of follow up), including high-resolution susceptibility-based sequences for PRL detection and analysis (as previously described).53
The longitudinal brain MRI studies were obtained on a Siemens Magnetom 7T MRI scanner equipped with a birdcage-type transmit coil and a 32-channel receive coil with the following MRI sequences:
2D high-resolution gradient echo (GRE) sequence providing T2*-weighted and phase contrasts (TR=1300 ms; TE=32 ms; 29 axial slices; FA=50°; AT=8 min 36 sec; in-plane resolution=0.2×0.2 mm, slice thickness=1 mm; voxel volume=0.04 μL); 3 minimally overlapping slabs acquired to cover most of the supratentorial brain.
Whole-brain 3D T1-weighted magnetization-prepared rapid gradient echo (T1-MPRAGE) (TR=2200 ms; TE=2.96 ms; TI=1050 ms; 256 slices; FA=7°; AT=6 min 35 sec; nominal resolution=0.7 mm isometric, voxel volume=0.34 μL) before and at least 5 min after injection of 0.1 mmol/kg gadobutrol.
In each individual, the long-term evolution of supratentorial chronic PRL on unwrapped phase images was determined. A chronic lesion is defined as a PRL when it shows a hypointense rim on phase images and internal isointensity/slight hypointensity to extralesional white matter.54 “Fading PRL” were defined when the intensity of the paramagnetic rim was visually less on phase images in at least the last 2 available 7T scans, and/or when the rim was visible on phase images but disappeared from T2*-weighted magnitude images at follow up.
Results were implemented for clinical trial power analysis as follows. The data file included 10 subjects and 70 lesions (on average 7 lesions per subject). The outcome was dichotomized as “stable PRL” vs. “fading or disappeared PRL” and used as dependent variable. A generalized estimating equation (GEE) analysis using a generalized linear model including patient age at lesion baseline, sex, and a dummy variable for whether the PRL corresponded to a “new” lesion showed that “new” was significant (p<0.0001), but neither sex (p=0.53) nor age (p=0.82) was significant. The GEE analysis also showed that the estimate of the correlation coefficient between any pair of lesions from same subject was 0.08, indicating that lesions from same subject can be treated as independent. For the power analysis, the following assumptions were implemented: (1) lesions from same subject are treated as independent; (2) there are 7 lesions per subject; and (3) the proportion of “fading or disappeared PRL” in untreated group is 0.02, and the expected proportion of “fading or disappeared PRL” lesion is 0.12 in the treated group after one year. Fisher’s Exact Conditional Test for Two Proportions was used. The power analysis was performed based on the binary outcome (“stable PRL” vs. “fading or disappeared PRL”) and the three assumptions. The hypothesis is that the proportion of “fading or disappeared PRL” will be increased 10% by one-year of drug treatment. The power analysis using Fisher’s Exact Conditional Test indicated that a total of 32 subjects, 16 subjects per group (with a total of 112 lesions), will have 80% power to detect 10% difference in the proportion of “fading or disappeared PRL” between the treated and untreated groups at significance level 0.05.
Clinical cohort: MRI-genotyping
At Johns Hopkins Multiple Sclerosis Center, upon Institutional Review Board approval and after written informed consent, 1272 adults with confirmed diagnosis of MS52 provided blood samples for DNA extraction and were genotyped on the Illumina Global Array (MEGA). A standard GWAS quality control pipeline was implemented as previously described.34 A subset of 105 of 1272 MS patients also underwent a 3T MRI on a Philips Ingenia CX 3T scanner equipped with a body transmit coil and a 32-channel receive coil. A noncontrast whole-brain 3D segmented echo-planar imaging (EPI) sequence55 providing T2* and phase contrasts (TR=66 ms; TE=35 ms; FA=10°; AT=5 min 4 sec; 256 sagittal slices; 0.65 mm isometric voxels; voxel volume 0.27 μL) was obtained in each subject for identification of PRL. Additional routine MRI scans were acquired for clinical use, including postcontrast T1-weighted sequences.
In each individual, the number of supratentorial chronic PRL on unwrapped phase images was determined by consensus of 2 raters, as previously described.4 Infratentorial lesions were excluded a priori from the rim analysis due to the presence of susceptibility artifacts in that region, which confound interpretation. In order to compare the results of this MS cohort with previously published work,4 MS cases were further classified based on the number of PRL into 3 groups (0, 1–3, and >4 PRL), as previously described.4
Based on previous results from GWAS MS studies,33,34 in each individual we assessed 5 risk variants associated to complement genes: variant rs158772_G (linked to C1QA), variant rs61822967_A (linked to CR1), variant rs11569428_T (linked to C3), variant rs2230205_T (linked to C3), variant rs339392_G (linked to C3). In each individual, a cumulative complement risk score was obtained as the sum of the number of risk variant alleles and compared across the 3 PRL-defined groups (ANOVA and Tukey’ multiple comparison tests).
Microglial C1q conditional knock out mice experiments
Animals
C1qfl (JAX stock #031261) and TMEM119-CreERT (JAX stock #031823) mice were obtained from Jackson Labs (Bar Harbor, MA). All mice were maintained by breeding to C57BL/6J mice. For Cre-lox experiments, C1qafl mice were crossed with TMEM119-CreERT mice. C1qfl/fl;TMEM-CreERT/+ animals were administered intraperitoneal (i.p.) tamoxifen (100mg/kg/day; T5648, Sigma Aldrich, St. Louis, MO) for 3 consecutive days at 1 month of age to generate C1q cKO mice. C1qafl/fl littermates injected with tamoxifen or C1qafl/fl;TMEM-CreERT/+ littermates injected with vehicle (corn oil; C8267, Sigma, St. Louis, MO) were used as controls (Ctrl). All experiments were performed with both male and female mice. All experiments were approved by institutional animal use and care committees and performed in accordance with all NIH guidelines for the humane treatment of animals.
Experimental autoimmune encephalomyelitis induction in mice
For immunostaining analyses, experimental autoimmune encephalomyelitis (EAE) was induced in 10-week-old male and female mice using the Hooke kit (Hooke laboratories, Cat# EK-2110, Lawrence MA). Mice were given subcutaneous (s.c.) flank administration of MOG33–55 peptide in emulsion with complete Freund’s adjuvant using pre-filled syringes provided in the Hooke kit. Control animals received s.c. flank injections of the control Hooke kit (Hooke laboratories, Cat# CK-2110, Lawrence MA) emulsion, which lacks MOG33–55 peptide. Additionally, mice received i.p. injections of 150-ng pertussis toxin (Hooke laboratories, Cat# EK-2110, Lawrence MA) 1 hour post MOG administration and 48 hours later. For qPCR validation of C1q ablation in microglia, EAE was induced in 8-week-old male and female mice by s.c. administration of 200-μg of MOG33–55 peptide (AnaSpec Inc., AS-60130–10, Fremont, CA, USA) emulsified in complete Freund’s Adjuvant (CFA, Sigma, F5881, Saint Louise, MO, USA) containing 0.2-mg of Mycobacterium tuberculosis H37Ra (Difco Laboratories, #231141 Detroit, MI, USA) into the flanks of both hind-limbs. Control animals received s.c. injections lacking MOG33–55 peptide. At the time of immunization and 48 hours later, mice received i.p. injections with 500-ng pertussis toxin (List Biologicals, #180, Deisenhofen, Germany). Weights and clinical scores were recorded daily (score 0.5: distal tail limpness; score 1: complete limp tail; score 1.5: limp tail and hindlimb weakness; score 2: mild hindlimb paresis; score 2.5: unilateral hindlimb paralysis; score 3: bilateral hindlimb paralysis, score 4: moribund). For the EAE experiments presented in this study, mice were analysed at the onset of EAE, when animals displayed moderate clinical scores (typically observed day 12–14 post immunization). EAE animals were sacrificed one day after the first day of clinical presentation. None of the CFA-treated control mice developed clinical symptoms, and they were sacrificed the same day as their littermates induced with EAE.
RNA isolation and Quantitative PCR (qPCR)
Mice were deeply anesthetized and transcardially perfused with HBSS prior to brain harvest. Brains were dissected out, transferred to RNAlater (ThermoFisher Scientific, AM7021), and stored at −20°C until further processing. RNA extraction was performed using the TRIzol/Chloroform technique according to manufacturer instructions (ThermoFisher Scientific, 15596026, 25668). Following RNA extraction, the aqueous layer was added to isopropanol (isovolume) and stored overnight at −80°C with 3M sodium acetate and Glycoblue (ThermoFisher Scientific, AM9515) for precipitation of RNA. Pellets were washed twice with 70% ethanol and resuspended in ddH20. RNA concentrations were measured using a Nanodrop spectrophotometer, and DNase clean-up was performed using the Turbo-DNA free kit (Invitrogen, AM1907). cDNA synthesis was performed using the PowerSYBR Green Cells-to-CT kit (Invitrogen, 44-029-54, Carlsbad, CA). Predesigned Taqman probes C1q (Assay ID: Mm00432142_m1) and beta actin (Assay ID: NM_007393.1) were used to assay gene expression by qPCR with a C100Touch thermal cycler (Biorad; Hercules, CA). The ΔΔCT method was used to calculate relative expression, with beta actin used as the housekeeping gene.
Immunostaining
Mice were deeply anesthetized and transcardially perfused with PBS followed by 4% paraformaldehyde (PFA) in 0.1M phosphate buffer (PB) or perfused with PBS prior to brain tissue harvest. Dissected brains were post-fixed at 4°C in PFA overnight and then transferred to 30% sucrose in 0.1M PB. After tissue was allowed to sink in sucrose, they were embedded in a 1:2 mixture of OCT compound (ThermoFisher Scientific) and 30% sucrose in 0.1M PB. Tissue was cryo-sectioned into 10- and 16-μm coronal brain sections. Sections were blocked in 10% goat serum, 0.3% Triton X-100 (TX-100) in 0.1M PB for 1 hour before primary immunostaining antibodies were applied overnight. Secondary antibodies were applied for 2 hours the following day. All steps were conducted at room temperature. The following antibodies were used: rabbit anti-C1q (clone 4.8, Abcam, ab182451, 1:100), chicken anti-IBA1 (Synaptic Systems, 234 006, 1:500), rabbit anti-Iba1 (Wako Chemicals, #019-19741, 1:500), and rat anti-Clec7a (InvivoGen, mabg-mdect, 1:200). The following day, sections were incubated with appropriate Alexa-fluorophore-conjugated secondary antibodies (ThermoFisher Scientific) and mounted with vectashield containing DAPI (Vector laboratories, Burlingame, CA, USA).
Imaging and Image analysis
All images were acquired on a Zeiss Observer microscope equipped with Zen Blue acquisition software (Zeiss; Oberkochen, Germany). Each cohort of animals was imaged together on the same day with the same settings. All subsequent analyses were performed blind to genotype using ImageJ/Fiji software (NIH).50 For fluorescence intensity analysis of C1q expression, 40x fields of view within the dorsal lateral geniculate nucleus (dLGN) were acquired. The intensity measurement of the 3 fields of view were averaged. This average intensity value was background-corrected by subtraction of the background ROI pixel intensity and then normalized to the values of Ctrl-CFA animals for each cohort. For determining percentage area of Clec7a signal in the LGN, 1–2 20x fields of view (FOV) containing the dLGN were acquired with 70 z-stack steps at 0.31-mm spacing with a Zeiss Observer microscope equipped with Zen Black acquisition software (Zeiss; Oberkochen, Germany). In Zen, a maximum intensity projection was made from each z-stack. A ROI was selected in each maximum projection image containing the LGN, and the area of this ROI was measured. A predetermined threshold was used, and Clec7a signal area was measured blinded. To quantify percentage area, the area of Clec7a signal was divided by the total area of the ROI containing the LGN. Data from each FOV were averaged for a given animal and normalized to values of Ctrl-CFA mice. For determining the density of Iba1+ cells in the LGN, single plane 20x epifluorescence images were collected. In ImageJ (NIH), an area outlining the LGN was defined, and the area was recorded. Then, Iba1+ cells were counted within the defined area, and the individual morphologies (ramified, hypertrophic, and amoeboid) for each cell counted were noted. The density of Iba1+ cells and mean fluorescent intensity (MFI) were calculated for each section and normalized to the ctrl-CFA mice for each cohort. For each section, the percentage of total Iba1+ cells with each morphology was also calculated.
Treatment with C1q-blocking antibody mice EAE experiments
C57BL/6 J female mice were purchased from The Jackson Laboratory (stock number 000664). The animals were housed in the pathogen-free animal facility at the Johns Hopkins University School of Medicine. The mice were kept in 12 hour/12 hour light/dark cycles and fed with standard food and water. All experimental protocols were performed in accordance with the NIH guidelines for the use of experimental animals and approved by the Johns Hopkins Institutional Animal Care and Use Committee. Chronic EAE was induced in 10-week-old C57BL/6 J mice with myelin oligodendrocyte glycoprotein (MOG)/CFA emulsion and pertussis toxin, as previously described.28 Briefly, mice were immunized on day 1 s.c. at two sites over the lateral abdomen with an emulsion of MOG (200 μg) in CFA containing 400-μg Mycobacterium tuberculosis H37RA (Difco laboratories). Pertussis toxin (List Biological Labs, Campbell, California, USA) was injected 250 ng/mouse i.p. on days 0 and 2. Mice were treated i.p. with either coded drug Y, monoclonal anti-C1q antibody (M1.21), or coded drug Z, isotype control, daily from time of onset of disease to the end of the experiment. All immunized mice were weighed and scored daily using the following established 5-point standard scoring scale: 0, no signs of disease; 1, loss of tail tonicity; 2, loss of tail tonicity and mild paralysis of hindlimbs; 3, paralysis of hindlimbs; 4, hindlimb paralysis and mild paralysis of forelimbs; and 5, complete paralysis or death. Mice were sacrificed at the post-immunization day 42, corresponding to the late phase of EAE. Codes were not unblinded until both behavioural score and pathology were quantified. Free-floating brain sections (40 μM) were stained with anti-FTL (anti-ferritin light chain antibody, rabbit-anti-mouse, Novus biologicals, JM10-37, dilution 1:100) and anti-Iba1 primary antibodies (anti-Iba1 antibody, mouse anti-mouse, Millipore Sigma, MABN92, dilution 1:500), and imaged using a Zeiss epifluorescence microscope at 40X magnification. Quantification focused on the hippocampus white matter using ImageJ/Fiji software.50
Statistical analysis and data visualization
Statistical analysis used two-tailed parametric or non-parametric t-tests for two groups, and Fisher’s exact test and one-way analysis of variance with corresponding post-hoc tests for multiple group comparisons. Data distributions are presented as violin plots (with individual data points when <10), and p values are labelled as *p <0.05, **p <0.01, ***p <0.001, ****p <0.0001. Gene expression values in the dot plots and heat maps were averaged, mean-centred, and z-score-scaled. Dot size indicates the percentage of nuclei in the cluster in which the gene was detected; among the nuclei in which the gene was detected, the expression level was mean-centred and scaled. For aggregated list of genes, a relative colour scheme was used to indicate the level of expression. Volcano plots were constructed by plotting the log2 fold change between two cell populations in the x axis and by plotting the negative log10 of the adjusted p value in the y axis (only genes with adjusted p<0.05 were included). Analyses were performed using GraphPad Prism (GraphPad Software v9.0). See dedicated paragraph for the details of the snRNA-seq bioinformatic analysis; differentially expressed genes were defined as genes significantly expressed (p adjusted for multiple comparisons <0.05) in ≥25% of cell populations, and showing, on average, >0.25-fold difference (log-scale) between groups of nuclei. For animal studies, sample sizes were chosen on the basis of standard power calculations (⍺ = 0.05 and power of 0.8) performed for similar experiments that were previously published. In general, statistical methods were not used to re-calculate or predetermine sample sizes. Graphical objects in Fig.3 and Extended Fig.7 and 10 were created with BioRender.com.
Reporting summary
Further information on research design is available in the Nature Research Reporting Summary linked to this paper.
Data availability
All raw snRNA-seq data (fastq files) were deposited to GEO (https://www.ncbi.nlm.nih.gov/geo/ under accession number GSE180759). Source data files depicting the quantification values mentioned in the text or plotted in graphs are available in the online version of this paper.
Code availability
Codes used to analyse the single-nucleus RNA-seq data in the current study are available from the corresponding authors upon request.
Extended Data
Extended Data Fig. 1. Chronic active/slowly expanding rim lesions can be visualized with MRI in vivo.
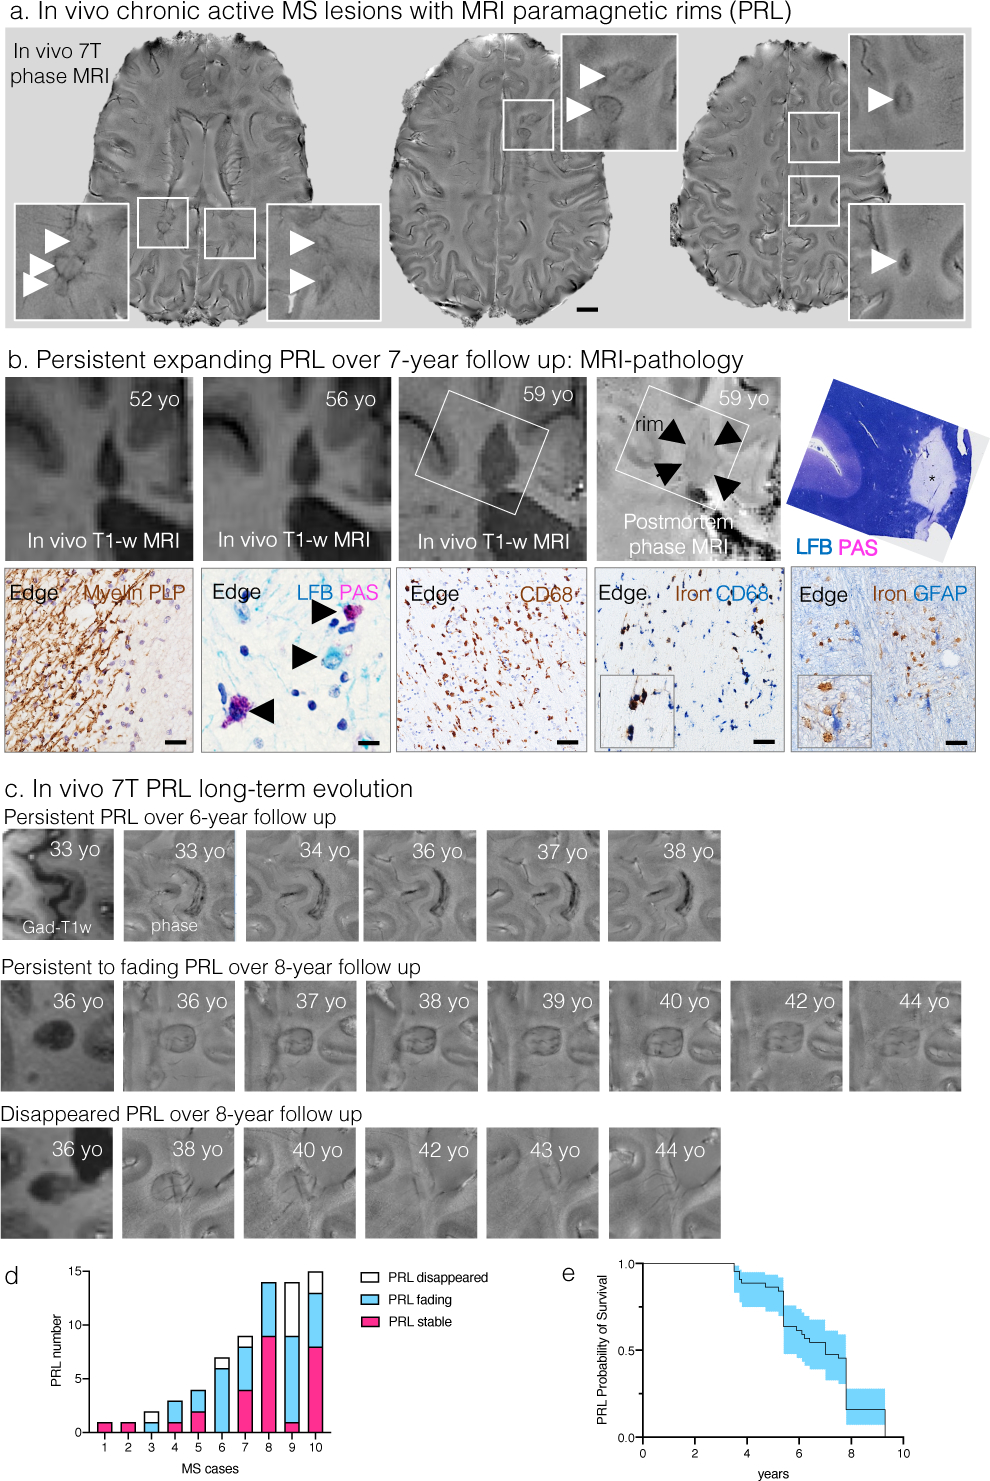
(a) Susceptibility-based axial MRI at three levels showing the chronic active MS lesions with paramagnetic rims (magnified view in the insets, arrows) of a 38-year-old man with progressive MS, who requires assistance to walk 100 meters without resting. Scale bar=10 mm.
(b) MRI-pathology of a frontal periventricular chronic active/slowly expanding lesion in a man with progressive MS who died at age 59. On the serial in vivo T1-weighted coronal images (clinical MR images sensitive to both demyelination and axonal loss), the rim lesion clearly expanded over a period of 7 years. The lesion was classified as chronic active by histological analysis. Accumulation of iron-laden phagocytes (CD68 and Turnbull iron staining) was seen at the lesion edge (asterisk on LFB-PAS staining). Smouldering demyelination can also be inferred by the co-presence of early (LFB+, blue) and late (PAS+, purple) myelin degradation products within phagocytes at the lesion edge. Most reactive GFAP+ astrocytes do not contain iron. Magnified views are shown in the insets. Scale bar=20 μm (myelin PLP); 10 μm (LFB-PAS); 50 μm (CD68, Turnbull iron/CD68, Turnbull iron/GFAP).
(c) In vivo long-term evolution of paramagnetic rim lesions: representative examples of persistent/stable, faded, and disappeared rims.
(d) Bar graph showing the evolution of paramagnetic rim lesions in each MS case followed over time. All cases had >5 years of yearly MRI follow up, except for cases 2–4, where follow-up was between 3.5 and 5 years.
(e) Survival analysis showed that the median PRL survival time is about 7 years.
Extended Data Fig. 2. Cell cluster proportions vary across tissue types.
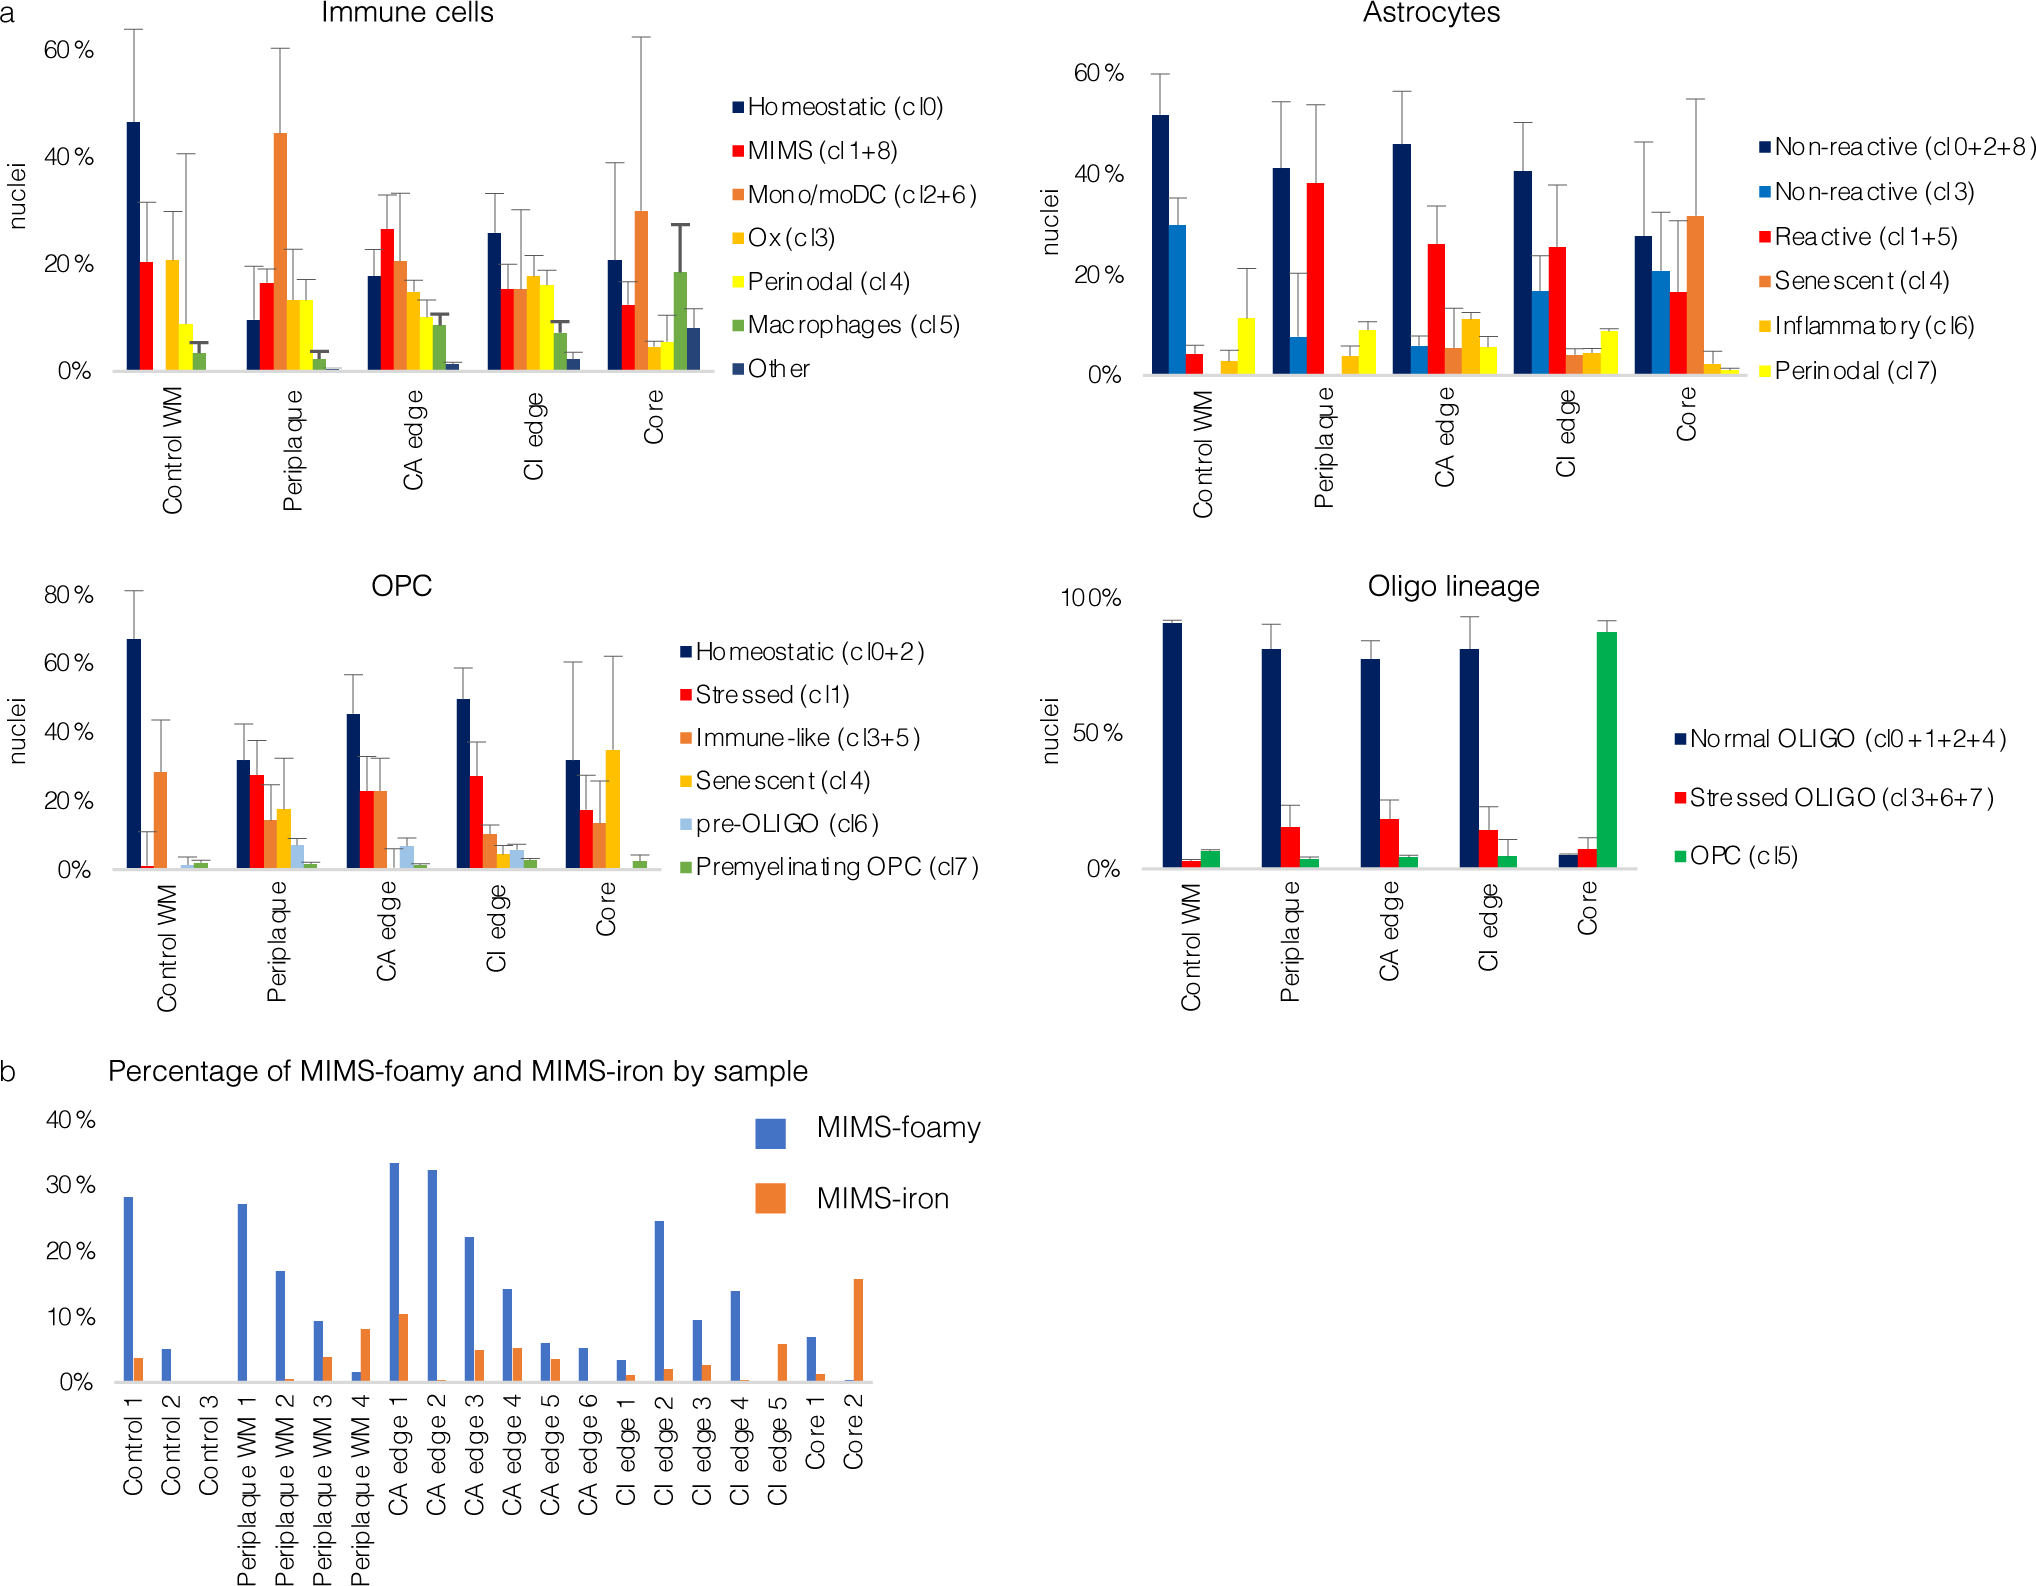
(a) Bar graphs showing the distribution of nuclei percentages by cell type (mean, standard error). See Fig. 2 for corresponding UMAP plots and distribution of nuclei count per sample.
(b) Bar graph showing the percentage of MIMS-foamy and MIMS-iron nuclei for each sample and location.
WM=white matter; CA=chronic active; CI=chronic inactive; UMAP=uniform manifold approximation and projection; MIMS=microglia inflamed in multiple sclerosis; OPC=oligodendrocyte progenitor cell; monoDC=monocyte/dendritic cell; Ox=oxidative stress.
Extended Data Fig. 3. Subclustering markers for astrocytes, oligodendrocytes, and OPC.
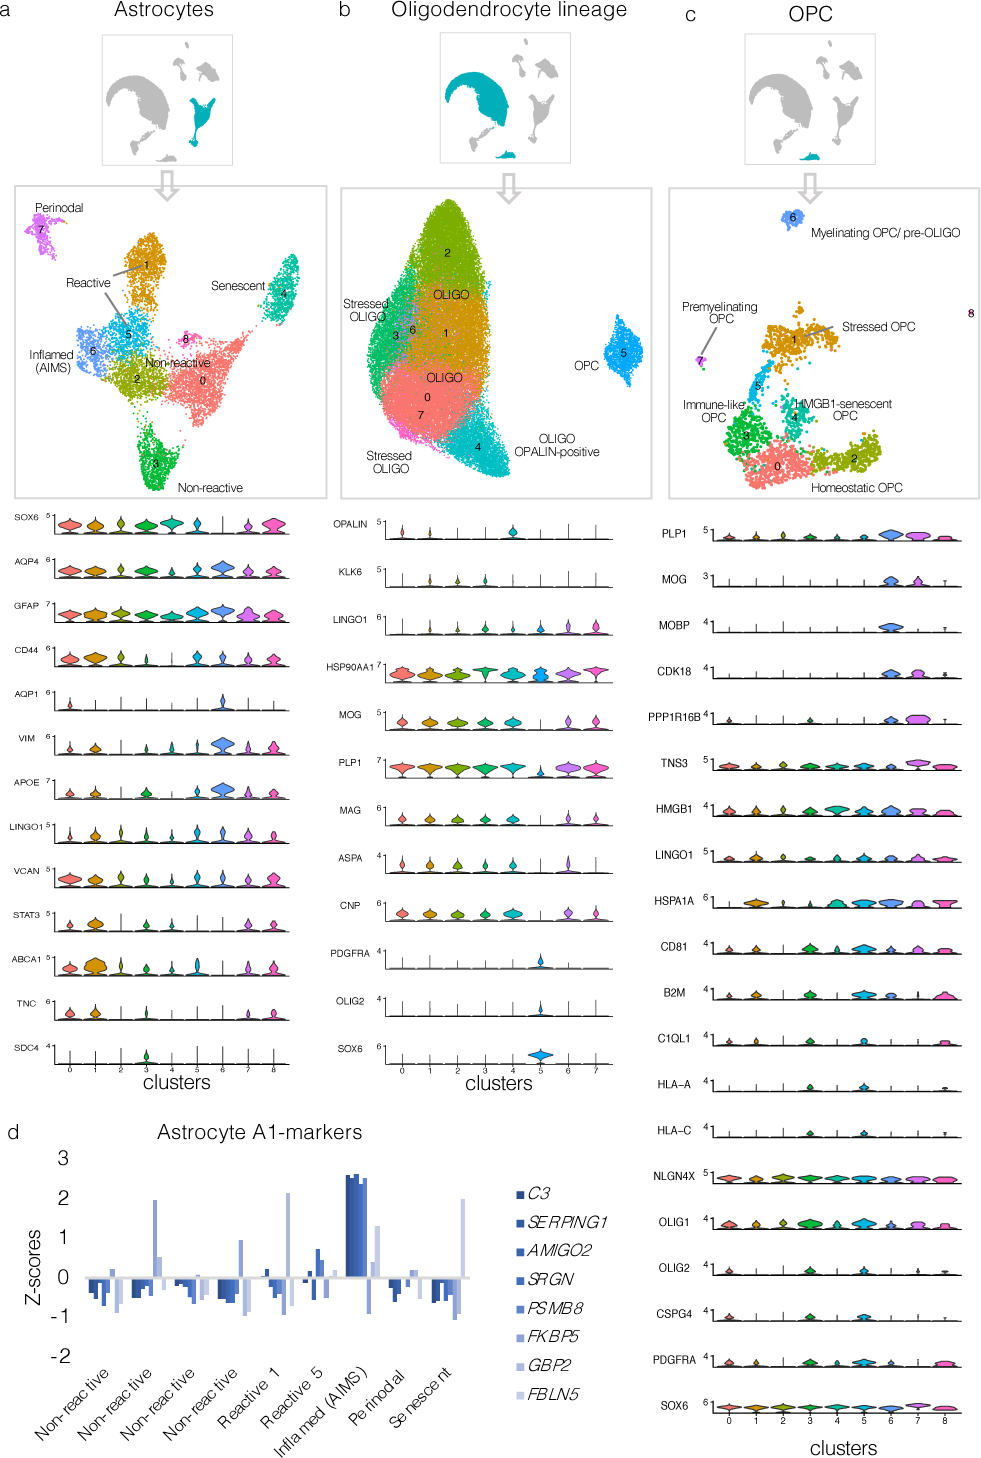
(a–c) Subclustering UMAP plots in astrocytes, oligodendrocytes, and OPC and associated stacked violin plots depicting selected differentially expressed genes for each subcluster.
(d) Bar graph showing A1-marker30 expression (Z-scores relative to all astrocytes) for each astrocyte cluster. Most A1 markers were highly expressed in AIMS.
UMAP=uniform manifold approximation and projection; OPC=oligodendrocyte progenitor cells; AIMS=astrocytes inflamed in MS.
Extended Data Fig. 4. Lymphocytes, monocyte-derived dendritic cells, MIMS, and AIMS are identified at the chronic active lesion edge.
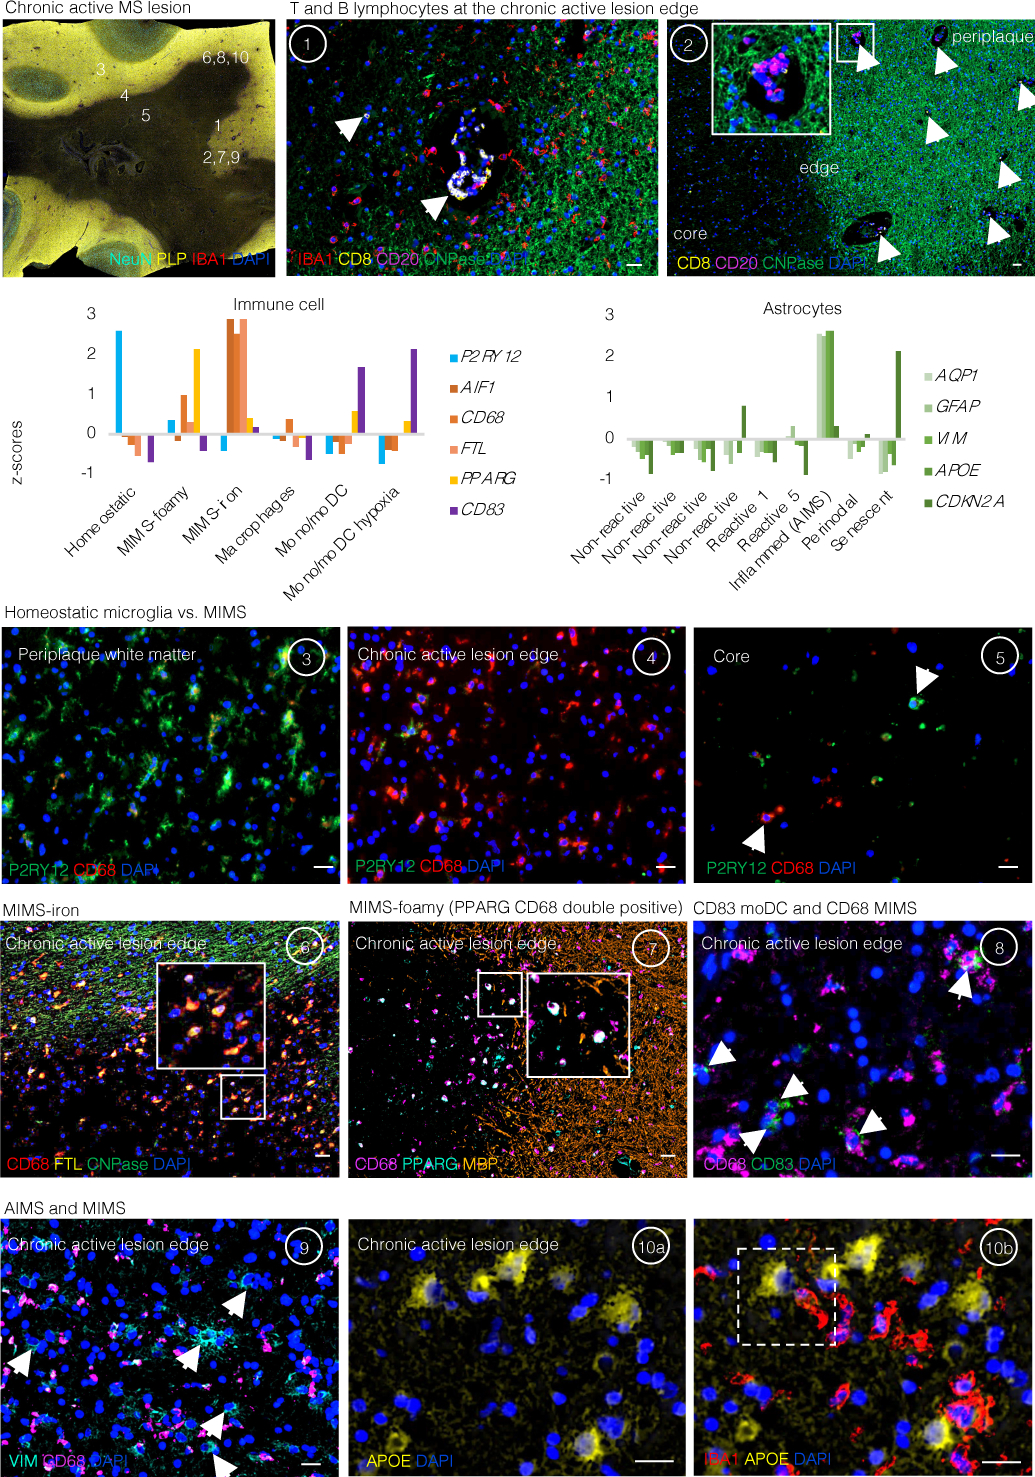
Chronic active lesion overview. Multiplex immunostaining of a brain tissue block from a 48-year-old woman with progressive MS (case MS4 in Supplementary Table 1), including a chronic active demyelinated lesion (devoid of myelin proteolipid protein (PLP) staining). Numbers indicate areas magnified in subsequent panels for validation of immune cell and inflamed astrocytes and represent the chronic active lesion edge, lesion centre, and periplaque WM.
Lymphocytes and microglia at the lesion edge (panels 1 and 2). At the chronic active lesion edge, there are groups of CD8 T-cells within the perivascular space and sparsely within the parenchyma (arrows). CD20 B-cells are fewer than CD8 T-cells and are located prevalently within the perivascular space (dashed arrows). Transition from myelination to demyelination is shown with staining for CNPase, an oligodendrocyte and myelin marker. Residual myelin fragments can be seen at the edge (arrowheads), presumably not yet removed by phagocytes. IBA1-microglia/macrophages are frequent, and they have an activated morphology (round shape without ramifications).
Bar graphs (second row) show the gene expression Z-scores of markers implemented for the identification in tissue of the most relevant glial cell populations at the chronic active lesion edge.
Homeostatic microglia vs. MIMS: different spatial locations (insets 3–5). In the periplaque WM, most microglia are P2RY12+ (a homeostatic marker) with short and thick processes, whereas at the chronic active lesion edge, most are CD68+ (indicating upregulation of antigen and lipid processing) with round, activated morphology. At the lesion core, fewer microglia can be identified, and these show a round morphology consistent with activation. Interestingly, some of them are P2RY12+, potentially suggesting the return of some homeostatic markers.
MIMS-iron (inset 6). Accumulation of iron-laden phagocytes (CD68 and ferritin light chain, FTL) is seen at the lesion edge. FTL is within the first 100 top differentially expressed genes in MIMS, especially in MIMS-iron (Fig. 3c). Iron retention in phagocytes can be seen by MRI at the chronic active lesion edge as a paramagnetic rim (MRI biomarker; Fig. 1a).
MIMS-foamy (inset 7). Colocalization of PPARG and CD68. PPARG and CD68 double positive (white, arrows) microglia are especially seen at the lesion edge, suggesting their involvement in energy metabolism and modulation of inflammation as well as clearance of myelin debris.
Monocytes/monocyte-derived dendritic cells and MIMS (inset 8). CD68 microglia outnumber CD83 monocyte-derived mature dendritic cells (arrows) at the chronic active lesion edge.
AIMS and MIMS (insets 9, 10a, and 10b). In addition to IBA1+/CD68+ microglia, the lesion edge is enriched for inflamed astrocytes (positive for VIM and APOE but negative for IBA1 and CD68), sometimes in close proximity (dashed white box). Compared to activated microglia, inflamed astrocytes are bigger and show radial processes.
moDC= mature monocyte-derived dendritic cells; MIMS=microglia inflamed in MS; AIMS=astrocytes inflamed in MS. Scale bar: 20 μm.
Extended Data Fig. 5. Pathway analysis of the two MIMS populations and comparison with DAM.
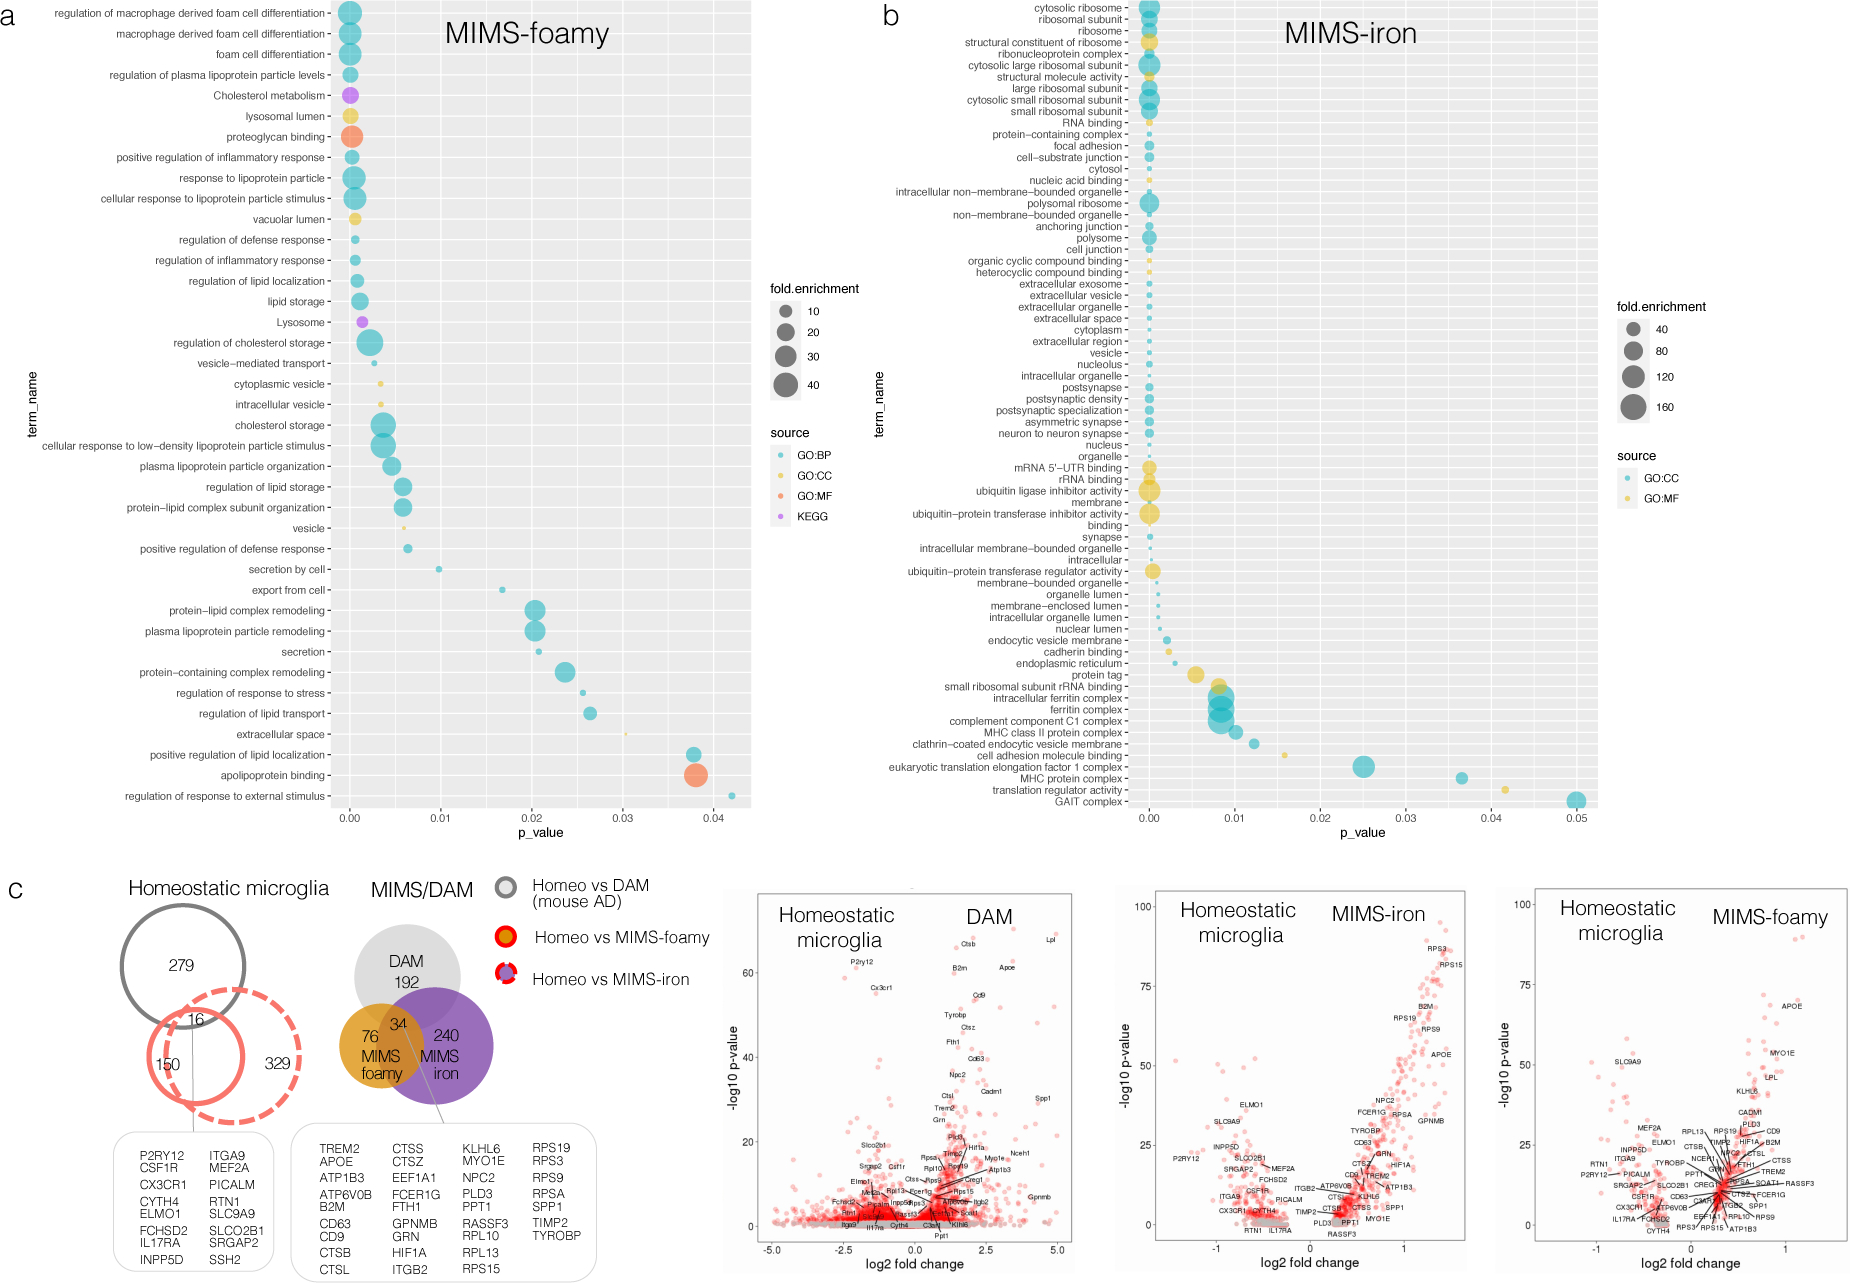
(a–b) Gene enrichment and pathway analysis of the top 100 differentially expressed genes are shown for MIMS-foamy and MIMS-iron populations, separately. Using the gProfileR package, different sources were compared (GO:BP, GO:CC, GO:MF, KEGG). Only significant pathway terms are plotted in the graphs (p-value <0.05, correction methods “g_SCS”). See the text for interpretation.
(c) Homeostatic microglia vs. MIMS vs. DAM: direct comparison of two single-cell RNA-seq datasets (MS [current work] and a mouse AD model [5XFAD]). Data for the AD model are derived from Supplementary Table 2 of Keren-Shaul et al., Cell 2017.18 In each dataset, only significant differentially expressed genes in the comparison between homeostatic vs. MIMS and homeostatic vs. DAM were retained (p<0.001), respectively. Volcano plots report overlapping genes for each microglia phenotype.
MS=multiple sclerosis; MIMS=microglia inflamed in MS; AD=Alzheimer disease; DAM=degenerative disease-associated microglia.
Extended Data Fig. 6. Two MIMS populations were identified through re-analysis of two published snRNA-seq MS datasets.
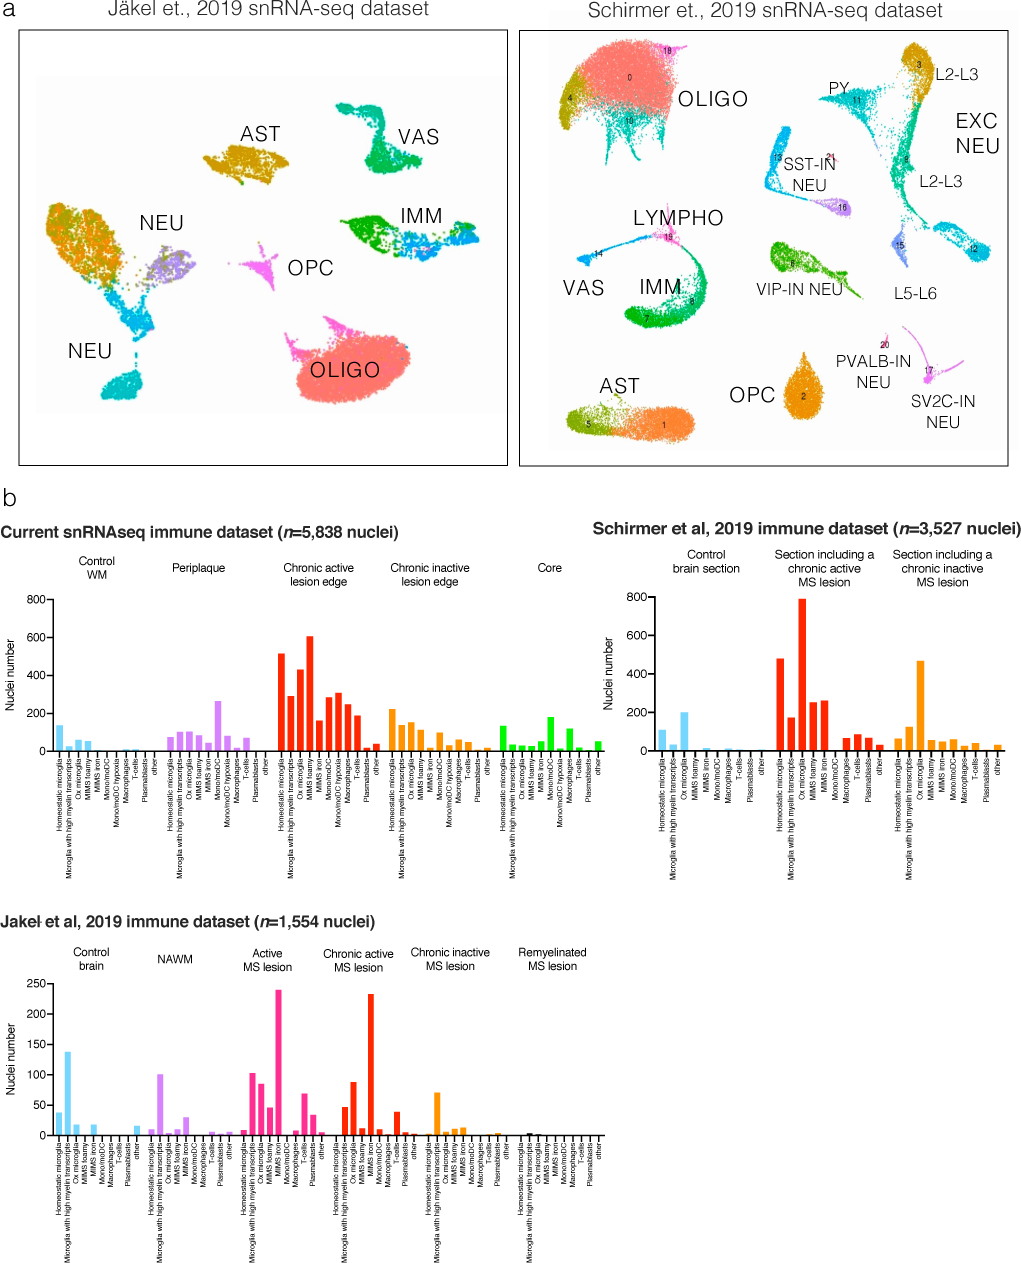
(a) snRNA-seq initial mapping (UMAP plot) and annotations based on the top differentially expressed genes in each cluster after re-analysis of raw data from Schirmer et al.13 and Jäkel et al.21
(b) Immune cell nuclei were mapped onto our immune subclustering map. Most of the immune cell populations identified were seen also in the other datasets, including the two MIMS populations.
UMAP=uniform manifold approximation and projection; MIMS=microglia inflamed in MS.
Extended Data Fig. 7. Multiplex immunostaining of human chronic active lesions.
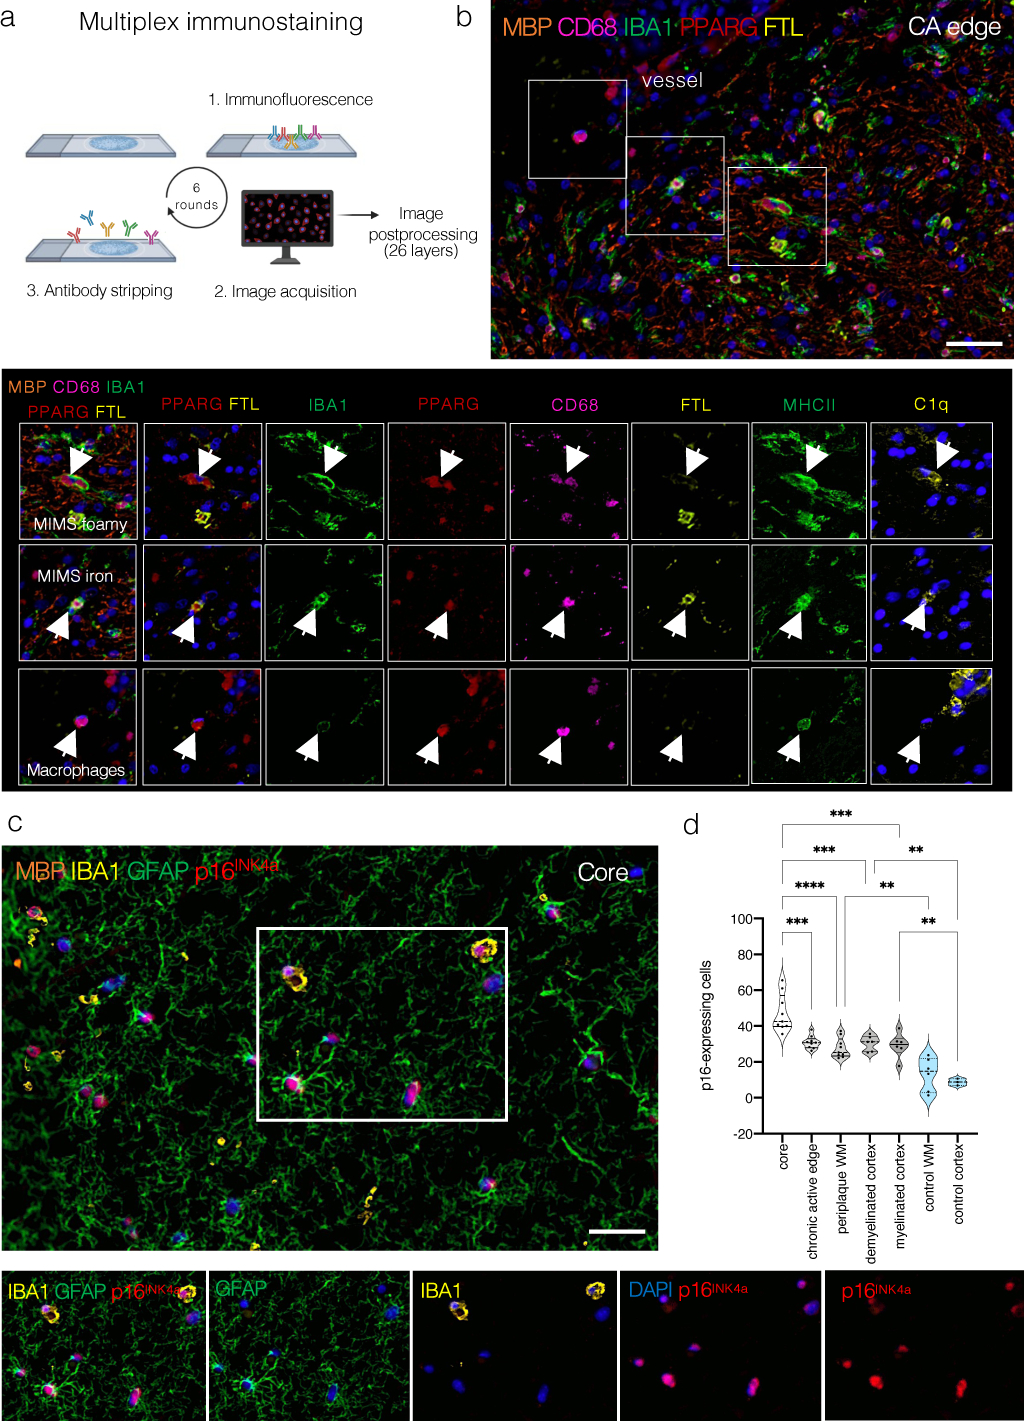
(a) Overview of the multiplex immunostaining method (see the text for details).
(b) A representative example of the chronic active edge and myeloid subpopulations. In the magnified view, identification of MIMS-foamy, MIMS-iron, and macrophages using 7 primary antibodies (combined or separate channels).
(c) Within the lesion core, most cells (both myeloid cells and astrocytes) are positive for the senescent marker p16INK4a. Separate channels are shown to facilitate the visualization of different markers.
(d) Quantification of the proportion of p16-positive nuclei at different locations. The lesion core showed the higher percentage of p16-positive nuclei (ANOVA p<0.0001, Tukey’s multiple comparison post-hoc analysis *p<0.05, **p<0.01, ***p<0.001).
Scale bar: 20 μm. Blue: DAPI (nuclei).
Extended Data Fig. 8. MIMS-AIMS gene modules and correlation.
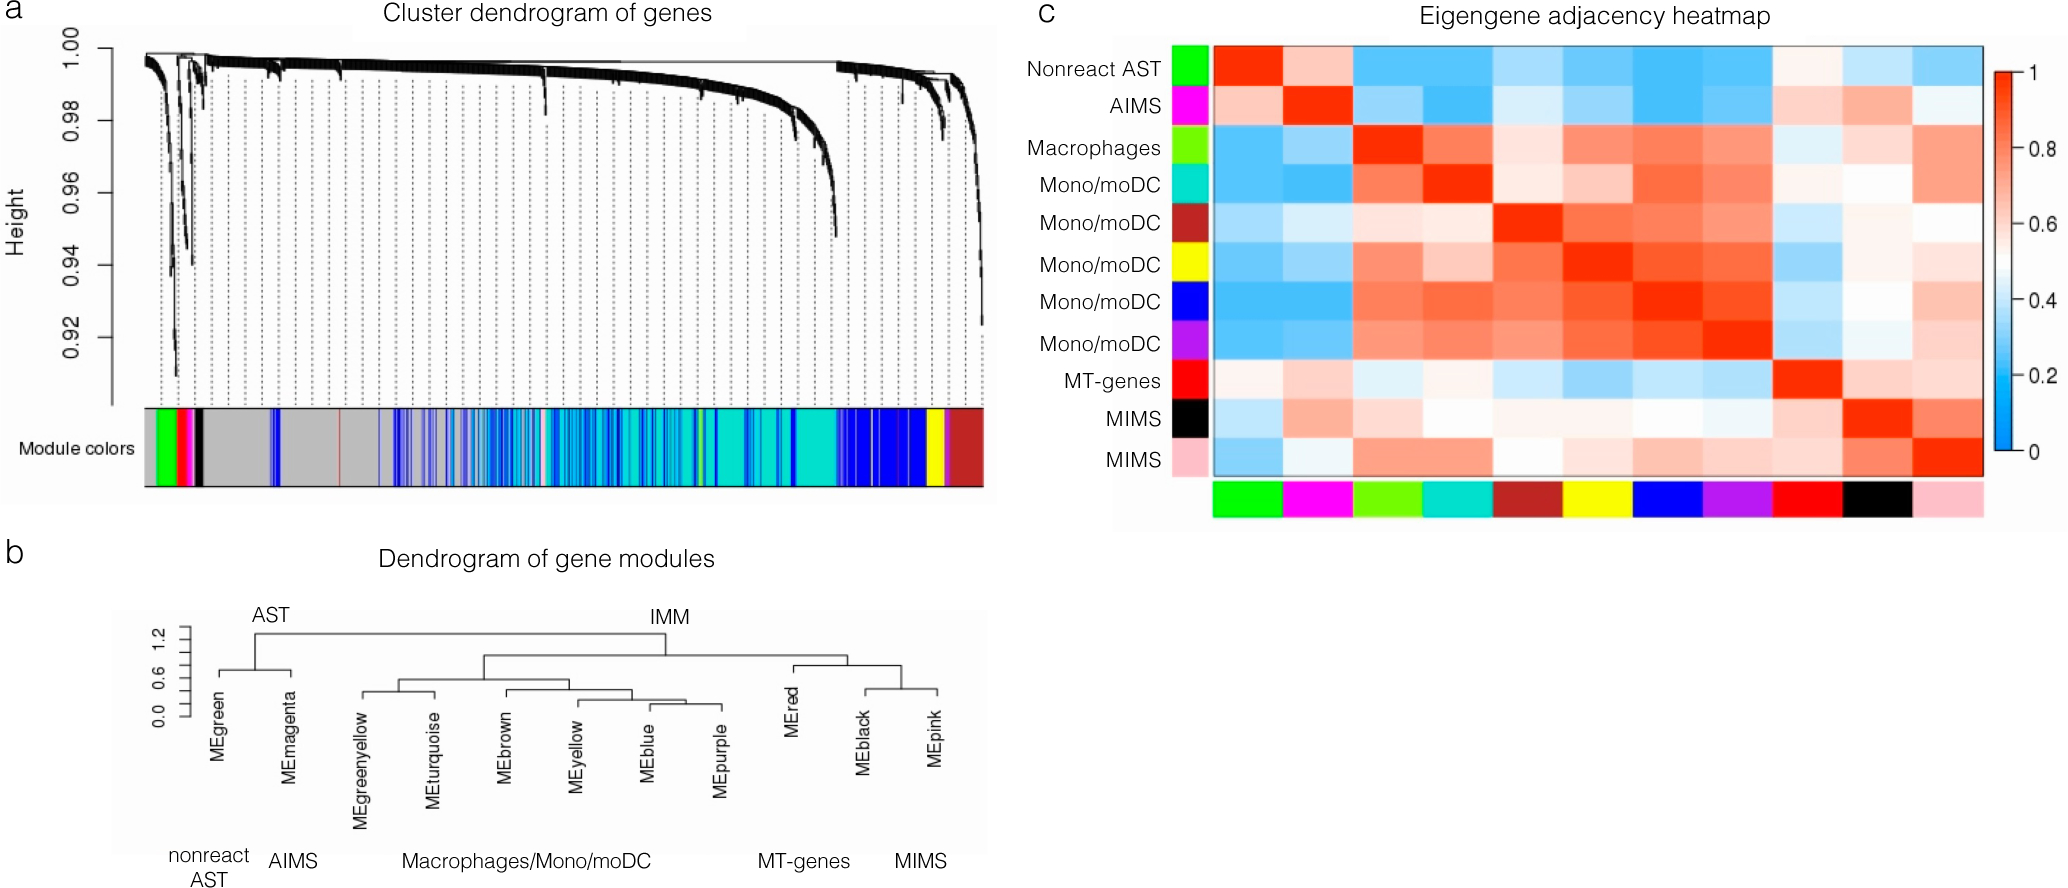
(a–b) Hierarchical clustering dendrograms of genes (a) and module colours (b) based on weighted correlation network analysis (WGCNA) of 918 variable genes from immune cells and astrocyte clusters 5, 9, 10. We identified: 2 MIMS gene modules (pink: C1QB, CD74, CEBPD, HLA-DRA, ITM2B, RPS19; black: ACTB, APOE, CD81, EEF1A1, FTH1, FTL, PSAP) and an AIMS gene module (magenta: CALM1, CLU, CRYAB, CST3, GAPDH, GFAP). The complete list of modules is shown in Supplementary Table 9.
(c) Heatmap showing the eigengene adjacency matrix that represents the relationships among the identified gene modules. MIMS gene modules (pink and black) were highly correlated with other myeloid gene modules and with the AIMS module, but not with the nonreactive astrocyte module.
AST=astrocytes; IMM=immune cells; MIMS=microglia inflamed in MS; AIMS=astrocytes inflamed in MS; ME=module eigengene.
Extended Data Fig. 9. Mapping complement and MS susceptibility genes onto the snRNA-seq dataset.
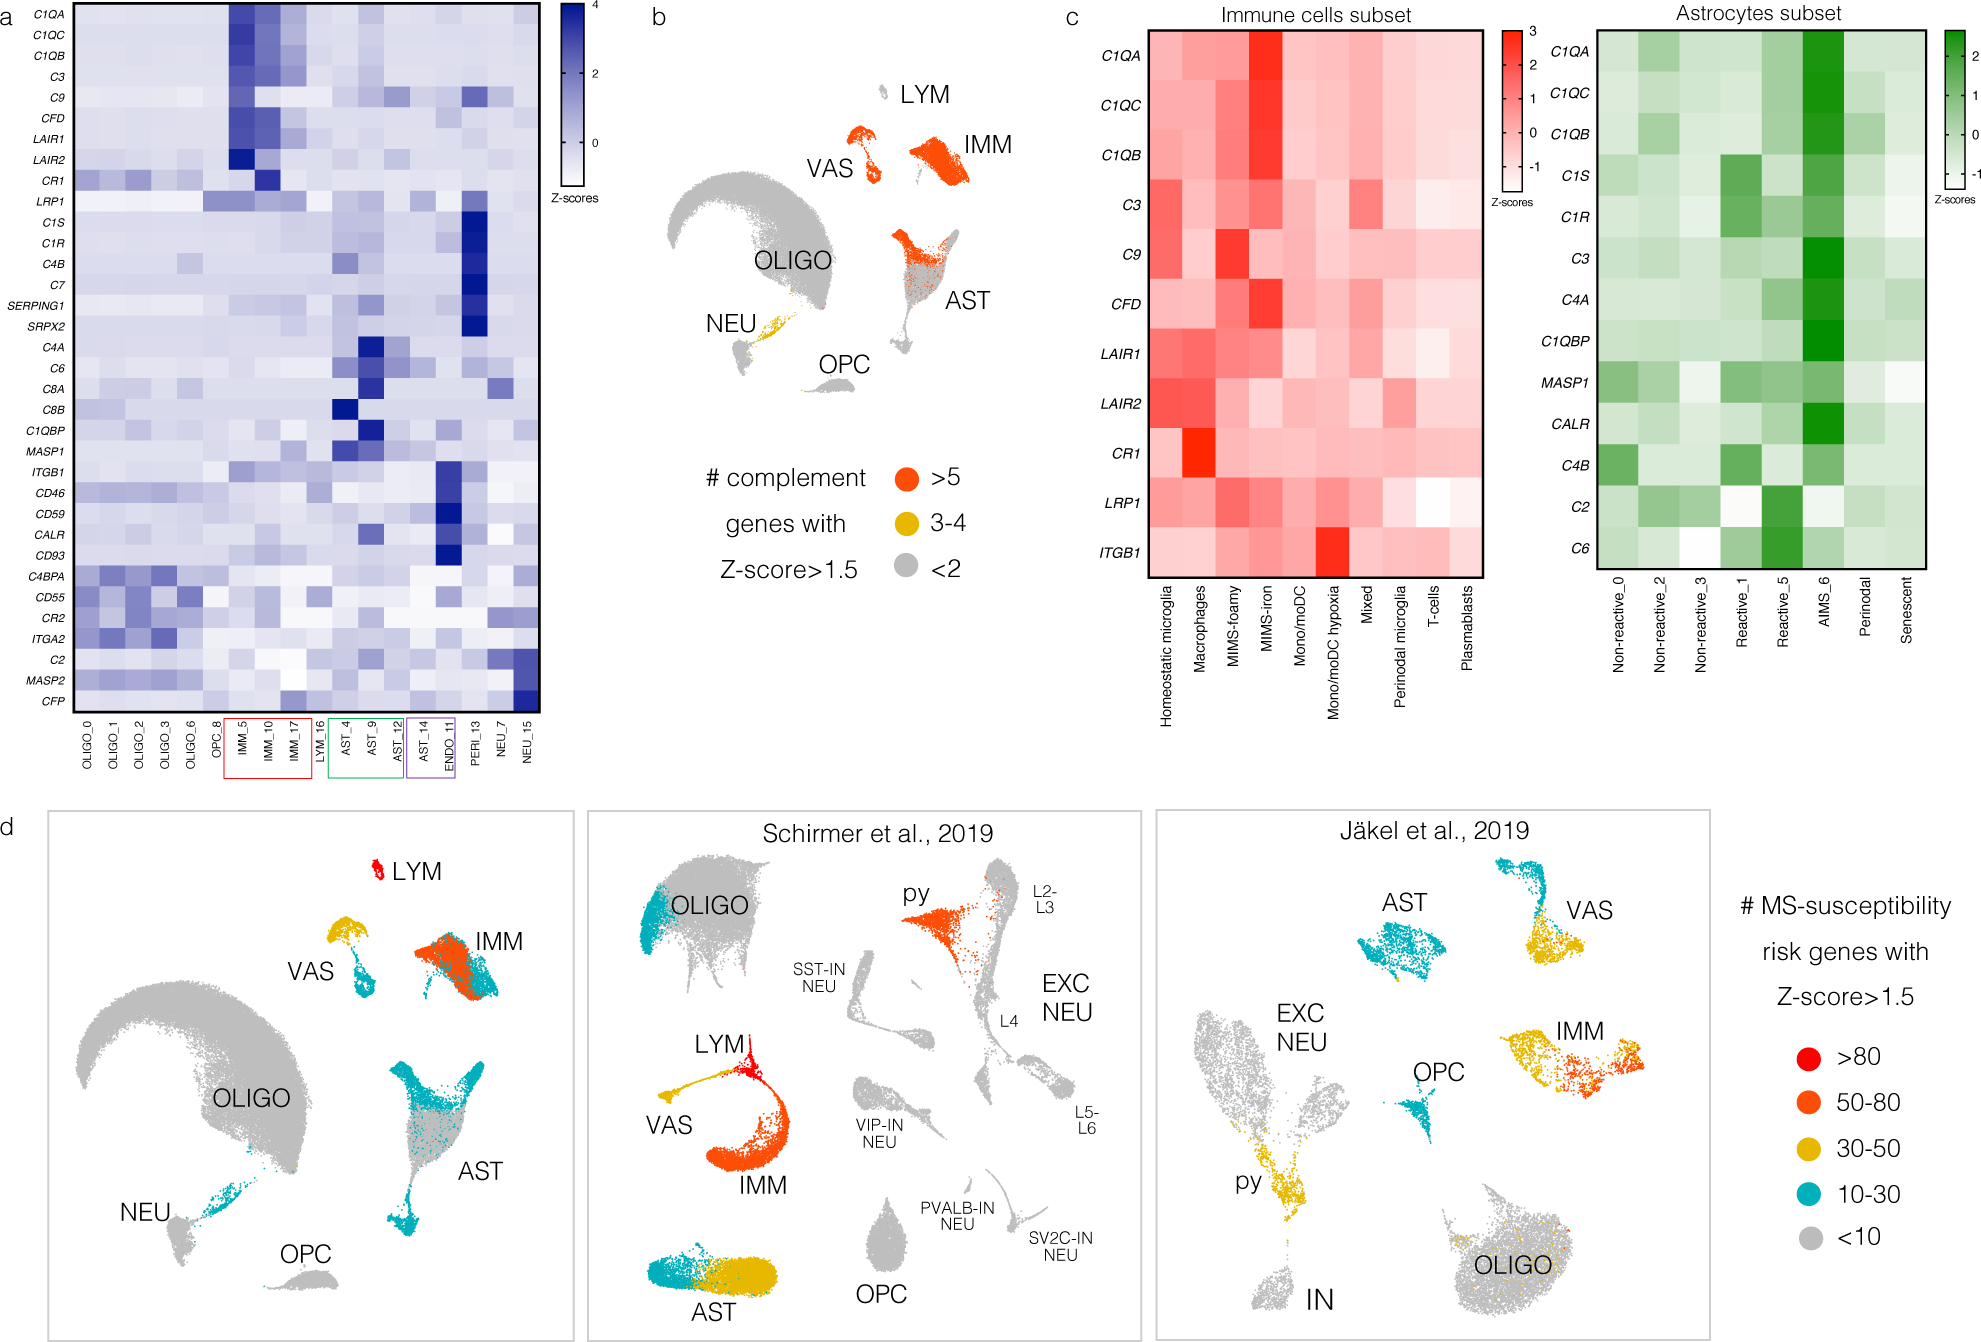
(a) Heatmap showing the expression of genes involved in the classical complement cascade, including complement genes, receptors, and regulators. Z-scores are relative to all cells. Most of these genes map onto immune cell, astrocyte, and vascular cell populations.
(b) For each cell population, the number of complement cascade-related genes with Z-score>1.5 is plotted on the UMAP.
(c) Heatmaps showing the expression of genes involved in the classical complement cascade for the immune cell (left, pink) and astrocyte (right, green) subclusters. Z-scores are relative to immune cells and astrocytes, respectively. C1Q, C3, and CFD (C3 activator) were expressed mainly by MIMS-iron, whereas negative regulators of complement activation (LAIR1, LAIR2, CR1) were expressed mainly by homeostatic microglia and perivascular macrophages. C1 complex (C1Q, C1R, C1S, C1QBP), C3, C4, and CALR were expressed mainly by AIMS, whereas C2 and C6 were expressed by some other reactive astrocytes.
(d) Mapping MS-susceptibility risk genes onto the snRNA-seq dataset: the list of 558 prioritized MS susceptibility genes was obtained from a recent genome-wide association study (GWAS)33 and mapped onto all three snRNA-seq datasets (the current dataset as well as that of Schirmer et al.13 and Jäkel et al.21). Low-expressed genes (within the 25th percentile average expression) were excluded. MS susceptibility genes were then assigned to clusters if the z-scored average gene expression was >2. Clusters were classified based on the number of MS susceptibility genes (>80, 50–80, 30–50, 1–30 and <10 genes). Results were colour-mapped onto each snRNA-seq UMAP. Most MS susceptibility genes mapped onto the immune and vascular cell clusters. Interestingly, an excitatory neuronal population (“py”) expressed some MS susceptibility genes as well.
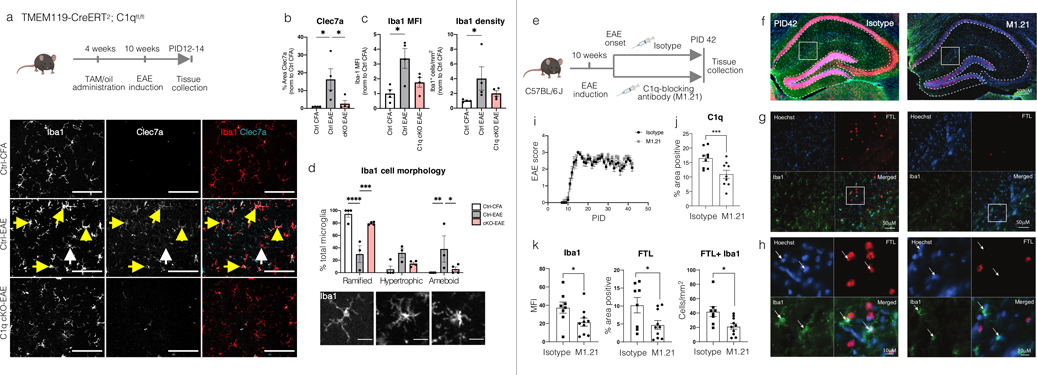
Extended Data Fig.10. C1q mediates microglia activation in mouse EAE.
Iba1+ cells in microglia-specific C1q cKO with EAE appear less reactive.
(a) Visual thalamus was immunostained at PID12-14 for Iba1 (microglia/macrophages) and Clec7a (disease-associated microglia). Yellow arrows denote Iba1+Clec7a+ cells, white arrows Iba1+Clec7a- cells. Scale bar=100μm.
(b–c) Clec7a decreased in cKO mice with EAE compared to Ctrl-EAE littermates. The density of Iba1+ cells and Iba1 MFI was attenuated to control values in cKO-EAE mice. *p<0.05, by one-way ANOVA and Tukey’s posthoc test (b) or Kruskal-Wallis test and Dunn posthoc test (c).
(d) Iba1+ cells were morphologically characterized into 3 categories (representative images in the panel below the quantification, scale bar=20 μm). Iba1+ cells in cKO-EAE mice were indistinguishable from CFA controls. cKO-EAE showed more ramified Iba1+ cells and fewer amoeboid cells compared to Ctrl-EAE littermates. **p<0.01, ***p<0.001, ****p<0.0001 by two-way ANOVA and Tukey’s posthoc test. Error bars: SEM.
Anti-C1q treatment reduces expression of FTL and Iba1 in chronic EAE.
(e) Experimental paradigm (twice weekly treatment with isotype control or C1q-blocking antibody (M1.21) from EAE onset until PID42).
(f) Representative images of FTL and Iba1 immunostaining; higher magnifications (g–h). White arrows: Iba1+ cells.
(i) EAE scores for each treatment arm.
(j–k) Quantification of the expression of C1q, FTL, and Iba1 in hippocampal WM (outlined with the dashed line in panel f) and count of Iba1+FTL+ cells. Student t-test, p*≤0.05, ***≤0.001. Error bars: SEM.
EAE=experimental autoimmune encephalomyelitis; cKO=conditional knock out; TAM=tamoxifen; FTL=ferritin light chain; MFI= mean fluorescent intensity; PID=post-immunization day; SEM=standard error of the mean.
Supplementary Material
Acknowledgments
This study was supported by the Intramural Research Program of NINDS, the Adelson Medical Research Foundation (to DS Reich and DP Schafer) and, the Conrad N. Hilton Foundation (grant #17313 to M Absinta) and the Cariplo Foundation (grant#2019-1677 to M Absinta).
We thank Yuesheng Li and Yan Luo from the DNA Sequencing and Genomics Core (NHLBI/NIH) and, Giampaolo Trivellin (NICHD/NIH) who helped in some technical aspects of single nucleus RNA-seq processing. We thank Cesare Covino from the Advanced Light and Electron Microscopy BioImaging Center (ALEMBIC, Vita-Salute San Raffaele University, Milan) who provided some help with the visualization of the immunofluorescent multiplex. We thank Ted Yednock and Vidhu Mehta at Annexon Biosciences for providing the anti-C1q monoclonal antibody (ANX-M1.21). We also thank Dwight Bergles, Robin Franklin, Jonathan Kipnis, and Nicole Mihelson for fruitful discussion of the results.
Footnotes
Competing interests
The authors declare no competing interests. MA received consulting fees from Sanofi, unrelated to this study. PC received grant support from Annexon Biosciences for testing the anti-C1q-blocking antibody in EAE. The funders of the study had no role in the collection, analysis, or interpretation of data, in the writing of the manuscript, or in the decision to submit the paper for publication.
References
- 1.Bagnato F, et al. Tracking iron in multiple sclerosis: a combined imaging and histopathological study at 7 Tesla. Brain 134, 3602–3615 (2011). [DOI] [PMC free article] [PubMed] [Google Scholar]
- 2.Absinta M, et al. Persistent 7-tesla phase rim predicts poor outcome in new multiple sclerosis patient lesions. J Clin Invest 126, 2597–2609 (2016). [DOI] [PMC free article] [PubMed] [Google Scholar]
- 3.Dal-Bianco A, et al. Slow expansion of multiple sclerosis iron rim lesions: pathology and 7 T magnetic resonance imaging. Acta Neuropathol 133, 25–42 (2017). [DOI] [PMC free article] [PubMed] [Google Scholar]
- 4.Absinta M, et al. Association of Chronic Active Multiple Sclerosis Lesions With Disability In Vivo. JAMA Neurol 76, 1520 (2019). [DOI] [PMC free article] [PubMed] [Google Scholar]
- 5.Elliott C, et al. Chronic white matter lesion activity predicts clinical progression in primary progressive multiple sclerosis. Brain 142, 2787–2799 (2019). [DOI] [PMC free article] [PubMed] [Google Scholar]
- 6.Maggi P, et al. Chronic white matter inflammation and neurofilament levels in patients with multiple sclerosis. Neurology (2021). [DOI] [PMC free article] [PubMed] [Google Scholar]
- 7.Kuhlmann T, et al. An updated histological classification system for multiple sclerosis lesions. Acta Neuropathol 133, 13–24 (2017). [DOI] [PubMed] [Google Scholar]
- 8.Reich DS, Lucchinetti CF & Calabresi PA Multiple Sclerosis. N Engl J Med 378, 169–180 (2018). [DOI] [PMC free article] [PubMed] [Google Scholar]
- 9.Krishnaswami SR, et al. Using single nuclei for RNA-seq to capture the transcriptome of postmortem neurons. Nat Protoc 11, 499–524 (2016). [DOI] [PMC free article] [PubMed] [Google Scholar]
- 10.Hendrickx DAE, et al. Gene Expression Profiling of Multiple Sclerosis Pathology Identifies Early Patterns of Demyelination Surrounding Chronic Active Lesions. Front Immunol 8, 1810 (2017). [DOI] [PMC free article] [PubMed] [Google Scholar]
- 11.Elkjaer ML, et al. Molecular signature of different lesion types in the brain white matter of patients with progressive multiple sclerosis. Acta Neuropathol Commun 7, 205 (2019). [DOI] [PMC free article] [PubMed] [Google Scholar]
- 12.Jackle K, et al. Molecular signature of slowly expanding lesions in progressive multiple sclerosis. Brain 143, 2073–2088 (2020). [DOI] [PubMed] [Google Scholar]
- 13.Schirmer L, et al. Neuronal vulnerability and multilineage diversity in multiple sclerosis. Nature 573, 75–82 (2019). [DOI] [PMC free article] [PubMed] [Google Scholar]
- 14.Maric D, et al. Whole-brain tissue mapping toolkit using large-scale highly multiplexed immunofluorescence imaging and deep neural networks. Nat Commun 12, 1550 (2021). [DOI] [PMC free article] [PubMed] [Google Scholar]
- 15.Comabella M, Montalban X, Munz C & Lunemann JD Targeting dendritic cells to treat multiple sclerosis. Nat Rev Neurol 6, 499–507 (2010). [DOI] [PubMed] [Google Scholar]
- 16.Clayton BLL & Popko B Endoplasmic reticulum stress and the unfolded protein response in disorders of myelinating glia. Brain Res 1648, 594–602 (2016). [DOI] [PMC free article] [PubMed] [Google Scholar]
- 17.Krasemann S, et al. The TREM2-APOE Pathway Drives the Transcriptional Phenotype of Dysfunctional Microglia in Neurodegenerative Diseases. Immunity 47, 566–581 e569 (2017). [DOI] [PMC free article] [PubMed] [Google Scholar]
- 18.Keren-Shaul H, et al. A Unique Microglia Type Associated with Restricting Development of Alzheimer’s Disease. Cell 169, 1276–1290 e1217 (2017). [DOI] [PubMed] [Google Scholar]
- 19.Masuda T, et al. Spatial and temporal heterogeneity of mouse and human microglia at single-cell resolution. Nature 566, 388–392 (2019). [DOI] [PubMed] [Google Scholar]
- 20.Sankowski R, et al. Mapping microglia states in the human brain through the integration of high-dimensional techniques. Nat Neurosci 22, 2098–2110 (2019). [DOI] [PubMed] [Google Scholar]
- 21.Jakel S, et al. Altered human oligodendrocyte heterogeneity in multiple sclerosis. Nature 566, 543–547 (2019). [DOI] [PMC free article] [PubMed] [Google Scholar]
- 22.Miron VE, et al. M2 microglia and macrophages drive oligodendrocyte differentiation during CNS remyelination. Nat Neurosci 16, 1211–1218 (2013). [DOI] [PMC free article] [PubMed] [Google Scholar]
- 23.Cignarella F, et al. TREM2 activation on microglia promotes myelin debris clearance and remyelination in a model of multiple sclerosis. Acta Neuropathol (2020). [DOI] [PMC free article] [PubMed] [Google Scholar]
- 24.Breij EC, et al. Homogeneity of active demyelinating lesions in established multiple sclerosis. Ann Neurol 63, 16–25 (2008). [DOI] [PubMed] [Google Scholar]
- 25.van der Poel M, Hoepel W, Hamann J, Huitinga I & Dunnen JD IgG Immune Complexes Break Immune Tolerance of Human Microglia. J Immunol 205, 2511–2518 (2020). [DOI] [PubMed] [Google Scholar]
- 26.Browaeys R, Saelens W & Saeys Y NicheNet: modeling intercellular communication by linking ligands to target genes. Nat Methods 17, 159–162 (2020). [DOI] [PubMed] [Google Scholar]
- 27.Rusinova I, et al. Interferome v2.0: an updated database of annotated interferon-regulated genes. Nucleic Acids Res 41, D1040–1046 (2013). [DOI] [PMC free article] [PubMed] [Google Scholar]
- 28.Kirby L, et al. Oligodendrocyte precursor cells present antigen and are cytotoxic targets in inflammatory demyelination. Nat Commun 10, 3887 (2019). [DOI] [PMC free article] [PubMed] [Google Scholar]
- 29.Falcao AM, et al. Disease-specific oligodendrocyte lineage cells arise in multiple sclerosis. Nat Med 24, 1837–1844 (2018). [DOI] [PMC free article] [PubMed] [Google Scholar]
- 30.Liddelow SA, et al. Neurotoxic reactive astrocytes are induced by activated microglia. Nature 541, 481–487 (2017). [DOI] [PMC free article] [PubMed] [Google Scholar]
- 31.Zhang B & Horvath S A general framework for weighted gene co-expression network analysis. Stat Appl Genet Mol Biol 4, Article17 (2005). [DOI] [PubMed] [Google Scholar]
- 32.Dal-Bianco A, et al. Long-term evolution of multiple sclerosis iron rim lesions in 7 T MRI. Brain 144, 833–847 (2021). [DOI] [PubMed] [Google Scholar]
- 33.International Multiple Sclerosis Genetics, C. Multiple sclerosis genomic map implicates peripheral immune cells and microglia in susceptibility. Science 365(2019). [DOI] [PMC free article] [PubMed] [Google Scholar]
- 34.Fitzgerald KC, et al. Early complement genes are associated with visual system degeneration in multiple sclerosis. Brain 142, 2722–2736 (2019). [DOI] [PMC free article] [PubMed] [Google Scholar]
- 35.Kaiser T & Feng G Tmem119-EGFP and Tmem119-CreERT2 Transgenic Mice for Labeling and Manipulating Microglia. eNeuro 6(2019). [DOI] [PMC free article] [PubMed] [Google Scholar]
- 36.Werneburg S, et al. Targeted Complement Inhibition at Synapses Prevents Microglial Synaptic Engulfment and Synapse Loss in Demyelinating Disease. Immunity 52, 167–182 e167 (2020). [DOI] [PMC free article] [PubMed] [Google Scholar]
- 37.Fonseca MI, et al. Cell-specific deletion of C1qa identifies microglia as the dominant source of C1q in mouse brain. J Neuroinflammation 14, 48 (2017). [DOI] [PMC free article] [PubMed] [Google Scholar]
- 38.Stephan AH, et al. A dramatic increase of C1q protein in the CNS during normal aging. J Neurosci 33, 13460–13474 (2013). [DOI] [PMC free article] [PubMed] [Google Scholar]
- 39.Michailidou I, et al. Complement C1q-C3-associated synaptic changes in multiple sclerosis hippocampus. Ann Neurol 77, 1007–1026 (2015). [DOI] [PubMed] [Google Scholar]
- 40.van der Valk P & De Groot CJ Staging of multiple sclerosis (MS) lesions: pathology of the time frame of MS. Neuropathol Appl Neurobiol 26, 2–10 (2000). [DOI] [PubMed] [Google Scholar]
- 41.Matson KJE, et al. Isolation of Adult Spinal Cord Nuclei for Massively Parallel Single-nucleus RNA Sequencing. J Vis Exp (2018). [DOI] [PMC free article] [PubMed] [Google Scholar]
- 42.Butler A, Hoffman P, Smibert P, Papalexi E & Satija R Integrating single-cell transcriptomic data across different conditions, technologies, and species. Nat Biotechnol 36, 411–420 (2018). [DOI] [PMC free article] [PubMed] [Google Scholar]
- 43.Stuart T, et al. Comprehensive Integration of Single-Cell Data. Cell 177, 1888–1902 e1821 (2019). [DOI] [PMC free article] [PubMed] [Google Scholar]
- 44.Korsunsky I, et al. Fast, sensitive and accurate integration of single-cell data with Harmony. Nat Methods 16, 1289–1296 (2019). [DOI] [PMC free article] [PubMed] [Google Scholar]
- 45.Fabregat A, et al. The Reactome Pathway Knowledgebase. Nucleic Acids Res 46, D649–D655 (2018). [DOI] [PMC free article] [PubMed] [Google Scholar]
- 46.Raudvere U, et al. g:Profiler: a web server for functional enrichment analysis and conversions of gene lists (2019 update). Nucleic Acids Res 47, W191–W198 (2019). [DOI] [PMC free article] [PubMed] [Google Scholar]
- 47.Zhou Y, et al. Metascape provides a biologist-oriented resource for the analysis of systems-level datasets. Nat Commun 10, 1523 (2019). [DOI] [PMC free article] [PubMed] [Google Scholar]
- 48.Bonnardel J, et al. Stellate Cells, Hepatocytes, and Endothelial Cells Imprint the Kupffer Cell Identity on Monocytes Colonizing the Liver Macrophage Niche. Immunity 51, 638–654 e639 (2019). [DOI] [PMC free article] [PubMed] [Google Scholar]
- 49.Krzywinski M, et al. Circos: an information aesthetic for comparative genomics. Genome Res 19, 1639–1645 (2009). [DOI] [PMC free article] [PubMed] [Google Scholar]
- 50.Schindelin J, et al. Fiji: an open-source platform for biological-image analysis. Nat Methods 9, 676–682 (2012). [DOI] [PMC free article] [PubMed] [Google Scholar]
- 51.Absinta M, et al. Postmortem magnetic resonance imaging to guide the pathologic cut: individualized, 3-dimensionally printed cutting boxes for fixed brains. J Neuropathol Exp Neurol 73, 780–788 (2014). [DOI] [PMC free article] [PubMed] [Google Scholar]
- 52.Polman CH, et al. Diagnostic criteria for multiple sclerosis: 2010 revisions to the McDonald criteria. Ann Neurol 69, 292–302 (2011). [DOI] [PMC free article] [PubMed] [Google Scholar]
- 53.Absinta M, et al. Identification of Chronic Active Multiple Sclerosis Lesions on 3T MRI. AJNR Am J Neuroradiol 39, 1233–1238 (2018). [DOI] [PMC free article] [PubMed] [Google Scholar]
- 54.Yao B, et al. Chronic multiple sclerosis lesions: characterization with high-field-strength MR imaging. Radiology 262, 206–215 (2012). [DOI] [PMC free article] [PubMed] [Google Scholar]
- 55.Sati P, et al. Rapid, high-resolution, whole-brain, susceptibility-based MRI of multiple sclerosis. Mult Scler 20, 1464–1470 (2014). [DOI] [PMC free article] [PubMed] [Google Scholar]
Associated Data
This section collects any data citations, data availability statements, or supplementary materials included in this article.
Supplementary Materials
Data Availability Statement
All raw snRNA-seq data (fastq files) were deposited to GEO (https://www.ncbi.nlm.nih.gov/geo/ under accession number GSE180759). Source data files depicting the quantification values mentioned in the text or plotted in graphs are available in the online version of this paper.


