

Abstract
Introduction
Ensuring adequate and equitable distribution of resources to support persons living with dementia relies on understanding the burden and distribution of dementia in a population. Our goal was to develop an approach to estimate dementia prevalence at the local level in the United States using publicly available data.
Methods
Our approach combines publicly available data on dementia prevalence and demographic data from the US Census to estimate dementia prevalence. We illustrate this approach by estimating dementia prevalence in persons aged 65 and older in Philadelphia, PA; Chicago, IL; and Atlanta, GA.
Results
Overall, we estimate the prevalence of dementia among those 65 and older to be 11.9% in Philadelphia, 11.8% Chicago, and 12.3% in Atlanta. Estimates across Philadelphia localities vary from 9.3% to 15.9%.
Discussion
Our approach provides a cost‐effective method to generate estimates of dementia prevalence at the local level.
HIGHLIGHTS
Brain health needs assessments require understanding of local dementia prevalence.
Our approach can be used to estimate dementia prevalence in individual communities.
This information can inform decisions about distribution of resources.
Keywords: Alzheimer's disease, dementia, needs assessment, prevalence, surveillance
1. INTRODUCTION
Dementia is a debilitating disease that places enormous strain on the health‐care system and on loved ones, who often become informal caregivers. Resources and services received by persons living with dementia and their care partners are typically offered and coordinated at the state or local level. Critically, ensuring adequate funding, availability, and equitable distribution of public health programs for dementia relies on understanding the disease burden and distribution in a population. Such information can inform decisions about the allocation of resources, whether the availability of programs and services to support those living with dementia and their care partners meets community needs, and whether subpopulations most impacted by dementia have access to a proportional share of services. As such, municipalities could benefit from an understanding of the burden of dementia in their communities.
In the United States, estimating dementia prevalence in a given municipality can be challenging. Presently, there is no national surveillance system for dementia, and given the costs of developing and maintaining successful surveillance systems, 1 it is unclear if and when we can expect one in the United States. Until such a system is implemented, we must rely on other approaches. Other administrative sources of information, such as Medicare claims, are unlikely to provide adequate information, as many people with dementia remain undiagnosed, and the sensitivity and specificity of a Medicare claim for identifying people living with dementia varies across sociodemographic subgroups. 2 , 3 , 4 , 5 Existing epidemiologic studies that estimate and forecast the prevalence of dementia have focused on the national population, 6 , 7 , 8 and so have limited utility for public health planning at the local level.
Our goal was to develop an approach for estimation of dementia prevalence at the local level using publicly available data. Broadly, this approach uses available, if limited, information on dementia prevalence from US‐based cohort studies to generate prevalence estimates for predetermined demographic subgroups, which are then combined with census data to estimate dementia prevalence in specific geographic areas. Here we describe and illustrate our approach by generating estimates of dementia prevalence for three major US cities—Philadelphia, PA; Chicago, IL; and Atlanta, GA—as well as in smaller geographic units (public use microdata areas, or PUMAs) within Philadelphia.
2. METHODS
2.1. Overview of approach
To begin, we reviewed the published literature and cohort websites for reports of dementia prevalence or incidence, stratified by age, sex, and/or race‐ethnicity. We then selected a subset of these reports—based on availability of stratified risk estimates, racial/ethnic diversity of the sample, and calendar period for the reported risk estimates—to inform our approach. Using data from these reports, we generated estimates of dementia prevalence within defined age‐, sex‐, and race/ethnicity categories. Next, we combined these stratified estimates with demographic information from the US Census Bureau to estimate dementia prevalence in persons aged 65 and older in populations of interest (Figure 1). As we rely on published or publicly‐available statistics, this work is not human subjects research.
FIGURE 1.
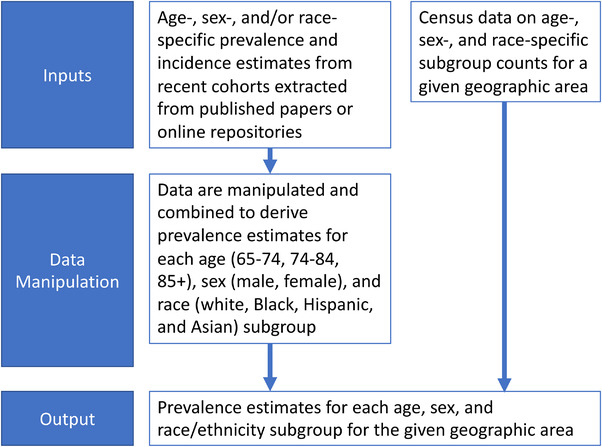
Visual representation of our overall approach to estimating dementia prevalence
2.2. Literature search
We searched PubMed for US population‐based studies published after 2000 using the search terms “dementia,” “prevalence,” “incidence,” and “United States.” Relevant articles identified from reference lists of articles found through PubMed were also reviewed and considered. If there was more than one article available for a particular cohort, the most recent article was considered. For cohorts identified or known to us with both dementia ascertainment and continuous enrollment, we accessed cohort websites to determine whether recent data on dementia risk by demographic subgroups was available there.
RESEARCH IN CONTEXT
Systematic Review: The authors reviewed PubMed for recent articles reporting on dementia prevalence or incidence in demographic subgroups. Relevant articles were used as source material for our approach to estimating local dementia prevalence.
Interpretation: Our findings illustrate that it is possible to derive actionable estimates of dementia prevalence at the local level based on publicly available data.
Future Directions: Estimates of local dementia prevalence can be used to inform efforts to ensure adequate and equitable distribution of resources to support persons living with dementia. Our approach provides a reasonable and cost‐effective solution to generating local estimates in the context of local brain health needs assessment efforts, when other options for generating such statistics are not feasible.
We reviewed each identified report, and we excluded reports that identified persons with dementia solely from cognitive test data or other algorithmic approaches and those that did not provide information on dementia incidence or prevalence in subgroups defined by age, sex, and/or race. Ultimately, we chose reports from six samples to inform our dementia prevalence calculator (Table 1). 9 , 10 , 11 , 12 , 13 , 14
TABLE 1.
Available data used for developing or validating dementia prevalence estimates
| Source | Study population | Dementia diagnosis definition | Years | Description of available statistics and source | Use in dementia prevalence calculator |
|---|---|---|---|---|---|
| Atherosclerosis Risk in the Community (ARIC), Knopman et al., 2016 | ARIC participants were recruited to be representative of four US communities at baseline (1987): Minneapolis suburbs, MN; black residents of Jackson, MS; Washington County, MD; and Forsyth County, NC; sample participants are those who were alive at the time of Visit 5. | For persons who attended Visit 5, dementia status was determined based on expert review of cognitive testing, informant interview, and functional assessment versus DSM‐V criteria. For participants who did not attend Visit 5, dementia status was ascertained based on telephone interviews, informant interviews, and hospital and death records, as available. | 2011 to 2013 | Prevalence of dementia for subgroups cross‐classified by age group (65–69, 70–74, 75–79, 80–84, and 85–89), sex, and race (White and Black) in 2011 to 2013 in four US communities | Estimation of dementia prevalence for Non‐Hispanic Whites and Non‐Hispanic Blacks |
| Chicago Health and Aging Project (CHAP), Rajan et al., 2019 | Participants recruited from four neighborhoods in Southside Chicago from 1994 to 2012 | Dementia status was determined by board‐certified neurologist based on cognitive testing, medical history, and neurologic examination, using NINCDS‐ADRDA criteria. | 1994 to 2012 | Prevalence of AD dementia for subgroups cross‐classified by age group (65–74, 75–84, and 85+) and race (non‐Hispanic White and Black) | Estimation of dementia prevalence for Non‐Hispanic Whites and Non‐Hispanic Blacks. Estimate of dementia duration using dementia prevalence and incidence rates |
|
Kaiser Permanente Northern California membership Mayeda et al. 2016 |
Members of Kaiser Permanente Northern California who were at least 60 years old in 2000 | Dementia status was defined based on ICD‐9 codes for AD, vascular dementia, and nonspecific dementia in electronic medical records. | 2000 to 2013 | Incidence of dementia for subgroups cross‐classified by age group (65–69, 70–74, 75–79, 80–84, 85–89, 90+), sex, and race (African American, American Indian or Alaska Native, Latino, Pacific Islander, White, and Asian American) |
Estimation of dementia prevalence for Non‐Hispanic Whites and Non‐Hispanic Blacks. Estimation of multiplier for estimating dementia prevalence in Hispanics and Asians relative to non‐Hispanic Whites |
| Memory and Aging Project (MAP) & Minority Aging Research Study (MARS), radc.rush.edu – 6/11/2020 | Community‐dwelling adults in Chicago and northern Illinois who were at least 65 years old at recruitment (1997–2020 for MAP, 2004–2020 for MARS) | Dementia status is determined by a neuropsychologist after review of cognitive testing, neurologic examination, informant interview, and other clinical data, using NINCDS/ADRDA criteria. | 1994 to 2020 | Prevalence of dementia for subgroups cross‐classified by age group (65–84, 85–89, and 90+), sex, and race (White and Black) among living participants of MAP and MARS as of June 11, 2020 | Estimation of dementia prevalence for Non‐Hispanic Whites and Non‐Hispanic Blacks |
|
Aging, Demographics, and Memory Study (ADAMS) Plassman et al., 2007 |
Stratified random sample of participants in the Health and Retirement Study, a nationally representative cohort. | Dementia status was determined by expert consensus at a clinical case conference, based on review of cognitive testing, neurologic exam, functional impairment, informant interview, and other relevant data using DSM‐III‐R or DSM‐IV criteria. | 2001 to 2003 | Prevalence of dementia and dementia subtypes for subgroups based on age (71–79, 80–89, 90+), and sex in 2001–2003 | Used the female: male prevalence ratio to estimate sex‐specific prevalence in CHAP and WHICAP‐I. Used to validate our calculator. |
|
Washington Heights–Inwood Columbia Aging Project–Phase I (WHICAP‐I) Tang et al., 2001 |
Probability sample of Medicare beneficiaries in the Washington Heights and Inwood neighborhoods in New York City | Dementia status was determined by expert consensus at a clinical case conference, based review of cognitive testing, and other relevant information using on DSM‐IV criteria. 42 | 1992 to 1999 | Incidence of dementia for subgroups based on age group (65–74, 75–84, and 85+) and race (African‐American, Caribbean Hispanic, and White) in 1992–1999; participants were Medicare beneficiaries in the Washington Heights and Inwood neighborhoods in New York City who agreed to enroll in the study. | Development of multiplier for estimating dementia prevalence in Hispanics relative to non‐Hispanic Whites |
Abbreviations: AD, Alzheimer's disease; DSM, Diagnostic and Statistical Manual of Mental Disorders; ICD‐9, International Classification of Diseases, Ninth Revision; NINCDS‐ADRDA, National Institute of Neurological and Communicative Disorders and Stroke–Alzheimer's Disease and Related Disorders Association.
2.3. Samples used to inform dementia calculator
We used or derived age, sex, and race/ethnicity‐specific dementia prevalence estimates for four samples (Table 1, Figure 2): the Atherosclerosis Risk in Communities (ARIC) 9 study, the Chicago Health and Aging Project (CHAP) 11 study, the Kaiser Permanente Northern California membership (Kaiser), 10 and a combined sample consisting of both the Rush Memory and Aging Project (MAP) 15 and Rush Minority Aging Research Study (MARS). 16 MAP and MARS are designed to be combined and have harmonized protocols. These samples were chosen because they reported dementia prevalence or incidence in strata defined by at least two of our three demographic characteristics of interest (age, sex, and race/ethnicity), reported on relevant statistics in more than one racial/ethnic group, and reported findings from relatively recent calendar years or from a population‐based sample. Data from ARIC, CHAP, and Kaiser were based on peer‐reviewed reports. 9 , 10 , 11 Data from MAP/MARS were obtained from the Rush Alzheimer's Disease Center (RADC) Research Resource Sharing Hub on June 11, 2020. 12
FIGURE 2.
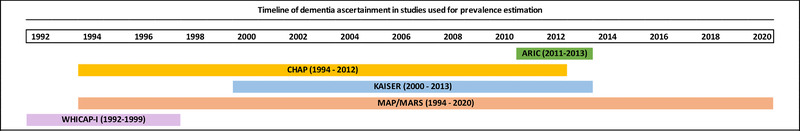
Timeline of studies used for dementia prevalence estimates. ARIC, Atherosclerosis Risk in the Community; CHAP, Chicago Health and Aging Project; KAISER, Kaiser Permanente; MAP/MARS, Memory and Aging Project/Minority Aging Research Study; WHICAP, Washington Heights–Inwood Columbia Aging Project
We also used data from two additional samples (Table 1). As described in detail below, we used data from the Aging, Demographics and Memory Study (ADAMS) 13 to help extrapolate from reported age‐ and race/ethnicity‐specific prevalence estimates in CHAP to age‐, sex‐, and race/ethnicity specific prevalence estimates. Similarly, because the Hispanic population represented in the Kaiser cohort is largely Mexican‐American, and dementia risk varies across Latino subgroups, 10 we used data from the Washington Heights–Inwood Columbia Aging Project–Phase I (WHICAP‐I), 14 along with data from Kaiser, 10 to develop prevalence estimates for Hispanics. Because the data from these two samples are older (from the early 1990s or early 2000s), they were not used as primary sources. All studies obtained informed consent for cohort participation.
2.4. Derivation of age‐, sex‐, and race‐specific dementia prevalence estimates
ARIC, Kaiser, CHAP, and MAP/MARS did not directly report dementia prevalence for subgroups that were identical across studies or which matched the categories used by the US Census. Therefore, we estimated the prevalence of dementia in each sample for subgroups defined by age (65–74, 75–84, and 85+), sex (male and female), and race (Black, White, Hispanic/Latino, and Asian). Below, we detail the processes used to derive comparable statistics across each sample.
2.4.1. Incidence‐to‐prevalence approximation
ARIC 9 and CHAP 11 published stratified dementia prevalence estimates. We were able to extract dementia prevalence estimates by age, sex, and race/ethnicity from MAP/MARS through the RADC Research Resource Sharing Hub. 12 However, Kaiser published dementia incidence rates by age, sex, and race/ethnicity, rather than prevalence. 10 Therefore, we derived the dementia prevalence in strata defined by age, sex, and race/ethnicity using the conversion: prevalence odds = incidence rate × average duration, assuming average dementia duration to be 7.4 years, derived based on data from CHAP. 11
2.4.2. Derivation of prevalence estimates in desired age categories
Our next step was to estimate dementia prevalence within age categories that matched those used by the US Census: 65 to 74, 75 to 84, and 85+. CHAP reported dementia prevalence by these age breakdowns. For ARIC and MAP/MARS, we used predicted values from an exponential regression best fit line, consistent with evidence of dementia risk increasing exponentially with age, 17 , 18 , 19 fit to the reported data on age group–specific prevalence, to derive estimates for alternate age categories. 20 MAP/MARS reported sex‐ and race‐specific dementia prevalence estimates for the 65 to 84, 85 to 89, and 90+ age groups. Within each sex‐ and race‐specific subgroup, we estimated the prevalence of dementia in age groups, 65 to 74, 75 to 84, and 85+, using an exponential best‐fit line, assuming that the midpoint of each desired category is representative of the prevalence in that category for 65 to 74 and 75 to 84, and assuming dementia prevalence at age 90 is representative of dementia prevalence in the 85+ group. The ARIC cohort reported sex‐ and race‐specific dementia prevalence for 5‐year age groups from 65 to 89. Similarly, we used these data to estimate an exponential best‐fit line, which we then used to estimate the dementia prevalence for individuals 90+, assuming the estimated dementia prevalence at age 92 is representative of the 90+ category. This yielded prevalence estimates for the age groups of 65 to 69, 70 to 74, 75 to 79, 80 to 84, 85 to 89, and 90+. We then calculated a weighted average of age group–specific dementia prevalence to derive estimates within the 65 to 74 and 75 to 84 age groups, based on the reported number of individuals in each age group. The prevalence of dementia for individuals 85+ was calculated as a simple average of the dementia prevalence for those 85 to 89 and 90+. Kaiser reported dementia prevalence stratified by 5‐year age groups. Because the Kaiser study did not report sample sizes for each age group, we used the number of individuals in each 5‐year age category from the 2013 5‐year US census population data for the 48 northernmost California counties serviced by Kaiser Permanente 21 to create a weighted average of the 5‐year categories, yielding dementia prevalence in the 65 to 74 and 75 to 84 age categories. The prevalence of dementia for individuals 85+ was calculated as a simple average of the dementia prevalence for those 85 to 89 and 90+.
2.4.3. Sex‐specific prevalence approximation
ARIC, Kaiser, and MAP/MARS provided relevant statistics stratified by age, sex, and race/ethnicity. However, CHAP provided statistics by age and race only. We derived sex‐specific dementia prevalence estimates within each age and race group in CHAP based on the proportion of males and females in each race–age group, and the ratios of dementia prevalence of women to men in each age category. We used the estimated prevalence of dementia for females and for males from ADAMS 13 to derive the women–men prevalence ratios. (In the absence of more specific data, we chose ADAMS because it was designed to allow recovery of nationally representative estimates and allowed us to keep estimates across the four samples independent, but we acknowledge that using a single ratio may not fully represent changes in sex difference by age and race.) For deriving the proportion of males and females in each age–race category, we used the number of males and females in each age–race group as reported in the 2012 US Census 5‐year population estimates for the three Chicago neighborhoods from which CHAP participants were recruited. 21 Assuming the dementia prevalence in each age–race category is a weighted average of the prevalence of dementia in men and the prevalence of dementia in women in each age–race category, we were thus able to solve for age‐, sex‐, and race‐specific dementia prevalence.
2.4.4. Estimated dementia prevalence in non‐Hispanic Whites and non‐Hispanic Blacks
Using the steps above, we were able to generate estimates of dementia prevalence within subcategories defined by age (65–74, 75–84, and 85+), sex (male and female), and two racial categories (Black, White) in all four primary samples (ARIC, CHAP, Kaiser, MAP/MARS). For non‐Hispanic Whites and Blacks, we averaged the race‐, age‐, and sex‐specific dementia prevalence estimates from ARIC, Kaiser, CHAP, and MAP/MARS to produce an estimated dementia prevalence for each race–age–sex group. As an initial check, we confirmed these were reasonably similar to reported statistics from other samples. 22 , 23
2.4.5. Estimated dementia prevalence in Asians and Hispanics
To estimate the age‐ and sex‐specific dementia prevalence in Asian and Hispanic groups, we multiplied the final age‐ and sex‐specific dementia prevalence estimates in non‐Hispanic Whites by the estimated prevalence ratios comparing dementia prevalence in Hispanics or Asians to non‐Hispanic Whites. For Asians, this prevalence ratio was based on data from Kaiser, 10 which was the only large, recent study with the relevant data. For Hispanics, this prevalence ratio was based on data from both Kaiser 10 and WHICAP‐I, 14 which include different Hispanic/Latinx subpopulations. Similar to CHAP, WHICAP‐I only published AD dementia incidence rates cross‐classified by age and race. Therefore, we first calculated age‐ and race‐specific prevalence rates assuming a 7.4‐year duration of dementia. We then approximated sex‐specific dementia prevalence rates within each stratum using the ADAMS‐derived prevalence ratios for sex and the American Communities Survey (ACS) 5‐year estimates of census tracts between 155th Street and 181th Street in the Washington Heights and Inwood neighborhoods in New York in 2010, 21 using a process identical to that described above for CHAP. Finally, we averaged race‐specific prevalence rates from the two cohorts for Whites and Hispanics, then calculated a prevalence ratio comparing the prevalence of dementia in Hispanics to that in Whites.
2.4.6. Estimation of dementia prevalence based on demographic information
The steps above ultimately result in a single set of dementia prevalence estimates for subgroups defined by age (65–74, 75–84, and 85+), sex (male and female), and race/ethnicity (non‐Hispanic Black, non‐Hispanic White, Asian, and Hispanic). For persons who are not White, Black, Hispanic, or Asian, we assumed the risk of dementia in each age/sex category to be equivalent to that observed for non‐Hispanic Whites. We then used information on the age, sex, and racial/ethnic make‐up of a given population provided by the US Census Bureau to derive estimates of dementia prevalence for that population. Specifically, the number of individuals of a given population in each age, sex, and racial/ethnic group is multiplied by the estimated dementia prevalence for that group, producing the expected number of persons in each group with dementia. The total number of expected cases of dementia in the given population is then divided by the population size over 65 to estimate the overall prevalence of dementia in older adults.
2.5. Validation of the dementia prevalence calculator
To validate our dementia prevalence calculator, we predicted dementia prevalence in ADAMS and in the United States and compared these values to those previously reported by Plassman et al. (for ADAMS) 13 or the Alzheimer's Association 2020 Alzheimer's Disease Facts and Figures report (for the United States). 24
The ADAMS validation focused on Hispanic, non‐Hispanic Black, and non‐Hispanic White participants, given limited number of participants who were Asian or of other racial/ethnic groups in the sample. Plassman et al. 13 did not report sample sizes for each race/sex category. However, reported prevalence statistics were weighted to represent the US population aged 71 and older in the year 2002. Therefore, we used ACS 2002 1‐year estimates for Hispanic, non‐Hispanic Black, and non‐Hispanic White persons in the United States 21 to estimate the prevalence of dementia in those 71 and older in 2002, and compared our results to those reported in Plassman et al. 13 Because our calculator predicts prevalence for those age 65 to 74, rather than 71 to 74, we multiplied the number of adults in each race/sex/65 to 74 group by 0.4 to estimate the number of individuals aged 71 to 74, therefore conservatively assuming the prevalence of dementia does not change within the 65 to 74 age group.
As a separate validation exercise, we also estimated the prevalence of dementia in 2018 using ACS 2018 1‐year US population estimates 21 and compared our results to those published in the Alzheimer's Association 2020 Alzheimer's Disease Facts and Figures report. 24
2.6. Estimation of dementia prevalence in selected US cities
We chose to illustrate our approach by estimating the prevalence of dementia in three US cities: Philadelphia, PA; Chicago, IL; and Atlanta, GA. Though two of the cohorts used for prevalence estimation were based in Chicago (CHAP and MAP/MARS), neither was intended to be representative of the entire city. To estimate dementia prevalence in Chicago and Atlanta we used ACS 1‐year estimates for the 2019 population. 21 All of our cities of interest were defined as census places. To demonstrate that our approach can capture local variation in dementia prevalence, we leveraged data from Philadelphia's 11 PUMAs. For Philadelphia specifically, PUMAs are roughly spatially aligned with planning districts, and therefore may be useful for local planning purposes. For Philadelphia and the 11 Philadelphia PUMAs, we used the ACS 5‐year estimates for the 2018 population, as 1‐year estimates were incomplete for specific PUMAs. 21
3. RESULTS
Our validation exercises produced estimates of dementia prevalence consistent with those reported elsewhere. Because of growing evidence of declining dementia risk since 2002, 25 when ADAMS participants were recruited, and our reliance on dementia risk statistics from more recent years from multiple sources in our process, we would expect to slightly underestimate the prevalence estimate reported in ADAMS. Indeed, our estimated overall prevalence of dementia in 2002 in the ADAMS sample was 12.6%, which is predictably slightly lower than the published prevalence of 13.9%. Our estimate of national dementia prevalence in 2018 was 9.6%. This was consistent with the prevalence of 10.0% from Alzheimer's Association's 2020 Alzheimer's Disease Facts and Figures report. 24
Overall, we estimate the dementia prevalence among those 65 and older to be 11.9% in Philadelphia, 11.8% in Chicago, and 12.3% in Atlanta (Table 2). As expected, prevalence was higher in older age groups, and in Black or Hispanic subpopulations. Dementia prevalence was largely consistent within demographic subgroups across cities. However, the prevalence of dementia among Asians differed across cities, reflecting the different age distribution of Asians aged 65 and older in Chicago, Atlanta, and Philadelphia. Estimates of dementia prevalence varied from 9.3% to 15.9% across Philadelphia PUMAs (Table 3 and Figure 3).
TABLE 2.
Estimated dementia prevalence among persons age 65 and older in three US cities
| Philadelphia | Chicago | Atlanta | |
|---|---|---|---|
| Overall | 11.9% | 11.8% | 12.3% |
| Male | 10.0% | 10.0% | 10.9% |
| Female | 13.1% | 13.1% | 13.3% |
| Age 65–74 | 4.2% | 4.3% | 4.5% |
| Age 75–84 | 14.8% | 15.1% | 16.8% |
| Age 85+ | 37.9% | 37.4% | 38.3% |
| Non‐Hispanic White | 10.1% | 9.8% | 9.0% |
| Non‐Hispanic Black | 15.1% | 15.1% | 14.4% |
| Hispanic | 10.4% | 11.3% | 10.1% |
| Asian | 6.4% | 9.0% | 17.8% |
TABLE 3.
Estimated dementia prevalence among persons age 65 and older in Philadelphia, PA, based on American Community Survey 2018, 5‐year demographic data
| Philadelphia | Far Northeast | Near Northeast–‐West | Near Northeast–East | North | Northwest | East | Central | West | Center city | Southwest | Southeast | |
|---|---|---|---|---|---|---|---|---|---|---|---|---|
| Overall | 11.9% | 10.2% | 10.9% | 9.3% | 12.7% | 12.6% | 9.8% | 15.9% | 15.3% | 9.8% | 14.8% | 11.1% |
| Male | 10.0% | 9.1% | 9.3% | 8.4% | 10.5% | 10.8% | 9.0% | 12.8% | 12.5% | 8.4% | 11.4% | 10.0% |
| Female | 13.1% | 11.1% | 12.0% | 9.8% | 13.9% | 13.9% | 10.4% | 17.9% | 16.8% | 11.0% | 16.9% | 11.9% |
| 65–74 | 4.2% | 3.0% | 3.6% | 3.5% | 5.3% | 4.2% | 4.3% | 5.6% | 5.4% | 3.4% | 5.2% | 3.4% |
| 75–84 | 14.8% | 11.4% | 12.0% | 12.3% | 18.0% | 15.7% | 13.6% | 19.5% | 18.6% | 12.7% | 17.9% | 13.2% |
| 85+ | 37.9% | 33.1% | 33.5% | 34.0% | 43.2% | 37.8% | 37.4% | 44.4% | 43.4% | 35.5% | 43.9% | 35.2% |
| White | 10.1% | 10.3% | 11.8% | 9.2% | 9.8% | 9.9% | 8.7% | 14.6% | 13.3% | 8.4% | 10.0% | 10.5% |
| Black | 15.1% | 13.5% | 10.8% | 11.3% | 13.8% | 15.6% | 13.6% | 16.4% | 16.0% | 15.6% | 16.0% | 15.9% |
| Hispanic | 10.4% | 12.2% | 10.1% | 10.3% | 9.7% | 11.3% | 9.6% | 10.3% | 12.0% | 12.4% | 18.5% | 10.2% |
| Asian | 6.4% | 6.5% | 5.2% | 4.5% | 6.9% | 6.8% | 6.3% | 7.5% | 6.2% | 9.0% | 5.6% | 5.6% |
FIGURE 3.
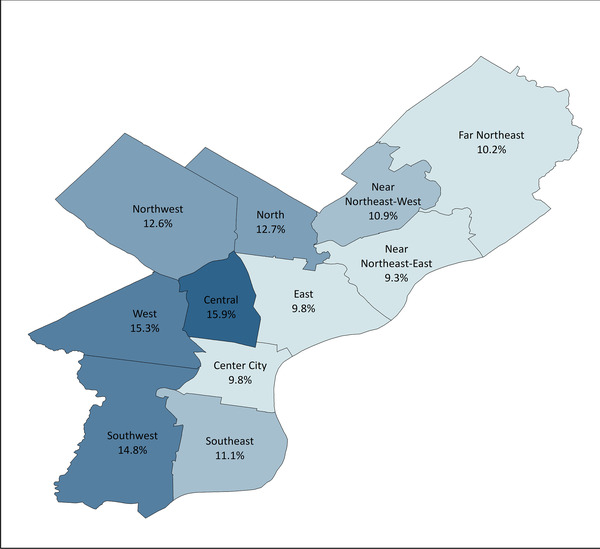
Geographic distribution of dementia prevalence across Philadelphia public use microdata areas
4. DISCUSSION
Here we demonstrate a method that uses publicly available data to generate actionable estimates of dementia prevalence at the local level. This approach is cost effective and can be used to quantify expected differences in dementia prevalence within and across municipalities.
Given that there is no cure for dementia, much of the public health discussion and guidance from the US Centers for Disease Control focuses on risk factor prevention and early identification of cognitive decline. 26 Even with these preventive steps, the country will see an increase in dementia prevalence in the coming years due to the changing age structure of the US population. To confront this growing public health concern, public health departments need tools to estimate the local burden of dementia and identify disparities within their coverage area to properly and equitably allocate resources. This is especially true in the absence of formal national and local surveillance systems. While a dementia surveillance system would enhance our public institutions’ ability to respond to the needs of those living with dementia, there are concerns about the cost and accuracy of dementia surveillance, 1 especially given that half of all persons living with dementia may be undiagnosed. 27 Additionally, these surveillance programs may take years to build, and public health practitioners will require tools to estimate dementia prevalence in local communities in the meantime. Our approach serves this need.
Our approach has several strengths. Our validation exercises show that our approach can produce reasonable estimates of dementia prevalence in settings where a dementia surveillance study is infeasible given time or resource constraints. We were able to identify several data sources with dementia prevalence or incidence estimates from recent years stratified by age, sex, and race/ethnicity. Combining data across these varied datasets likely strengthens the validity of our overall estimates. We were able to validate our estimates against other estimates of dementia prevalence and illustrate close agreement. In addition, our approach is versatile, and can be used to generate dementia prevalence estimates for other regions of the United States, or for other recent years, provided appropriate demographic information is available. Finally, this approach is adaptable, and can incorporate newly published prevalence data from US cohorts should these become available in the future.
We recognize that this approach also has limitations. Our results are based on the relatively small number of studies with recent, relevant data. The available data could not be readily combined with census data without manipulation, and we weighted estimates from the four samples equally. It may be worth considering weighting cohort‐specific prevalence estimates based on the representativeness of each cohort population to the target population in question. While calculating prevalence rates of dementia in the Kaiser cohort, we assume prevalence was constant during the study period. Because dementia ascertainment was conducted in the two studies during overlapping timeframes (see Figure 2), we believe this assumption is justifiable. We make similar assumptions about the relative prevalence of dementia among men and women across cohorts. Additionally, with the exception of the WHICAP cohort, 28 we lacked information on the proportion of participants in each cohort residing in a nursing home, a population that may be of particular interest for local public health departments. While our approach makes use of the available data, and is rational and well considered, other choices may also be justifiable and would likely result in slightly different dementia prevalence estimates. While other methods, such as small area estimation, 29 , 30 could be used to quantify disease prevalence in smaller geographic areas and may have relative advantages, our approach remains a practical option for obtaining dementia prevalence data for cities and their subunits.
Our approach precludes calculating measures of uncertainty, including prediction or confidence intervals. Rather, we prioritize communicating actionable information on the burden of dementia, while acknowledging that these are estimates. Although diagnostic criteria for dementia varied across studies, we assumed that they are measuring the same quantity. However, differences in criteria may contribute to differences across study‐specific estimates of dementia prevalence. 31 , 32 We also assume that dementia prevalence estimates in regions from which our cohorts of interest are drawn will generalize to other regions in the United States after accounting for differences in demographic distributions. Specifically, our approach assumes that, across the United States, equivalent age–sex–race/ethnic groups (such as non‐Hispanic White females aged 65–74) have similar distributions of other dementia‐related predictors, such as education. This assumption may not be appropriate in some settings. Given lack of information, we assumed the prevalence of dementia for persons identifying as a racial/ethnic group other than non‐Hispanic White, non‐Hispanic Black, Hispanic, and Asian was equivalent to that of non‐Hispanic Whites. We are also unable to explore potential heterogeneity in dementia prevalence within our defined subgroups, despite evidence that dementia risk varies across Hispanic and Asian subpopulations. 10 , 14 , 33 , 34 Unfortunately, existing studies are inadequate to characterize dementia risk across Hispanic or Asian subpopulations, and current census data do not provide granular information on the age and sex distributions of Hispanic and Asian American subpopulations. Thus, by necessity, our approach assumes homogenous risk within Hispanic and Asian populations. We rely on the 2018 5‐year ACS estimates for Philadelphia—1‐year data are considered unreliable for geographic levels as small as a PUMA 35 , 36 —thus, we assume that demographic characteristics remain consistent from 2013 to 2018. Finally, given the impact of COVID‐19 is unequal, 37 , 38 , 39 , 40 , 41 existing demographic data may no longer reflect current demographics. If COVID‐19 also substantially impacts the prevalence of dementia within groups defined by age, sex, and race/ethnicity, use of this process to estimate dementia prevalence in 2020 and beyond may produce less accurate estimates.
Here, we demonstrate that it is possible to use publicly available data on dementia risk to derive local estimates of dementia prevalence. This approach is cost effective and can provide valuable information to municipalities, states, and local governments as they plan to support persons living with dementia and their care partners.
CONFLICTS OF INTEREST
Melinda C. Power reports grants from the United States National Institutes of Health (NIH), Department of Defense (DOD), and DC Health. N Maritza Dowling reports grants from the United States National Institutes of Health (NIH). All authors were supported by a grant from DC Health.
ACKNOWLEDGMENTS
This work was funded by a grant from DC Health to MCP (CHA2020‐000024). The funders had no role in the design and conduct of the study; collection, management, analysis, and interpretation of the data; preparation, review, or approval of the manuscript; and decision to submit the manuscript for publication.
Bennett EE, Kwan A, Gianattasio KZ, Engelman B, Dowling NM, Power MC. Estimation of dementia prevalence at the local level in the United States. Alzheimer's Dement. 2021;7:e12237. 10.1002/trc2.12237
REFERENCES
- 1. Krysinska K, Sachdev PS, Breitner J, Kivipelto M, Kukull W, Brodaty H. Dementia registries around the globe and their applications: a systematic review. Alzheimers Dement. 2017;13:1031‐1047. [DOI] [PMC free article] [PubMed] [Google Scholar]
- 2. Gianattasio KZ, Prather C, Glymour MM, Ciarleglio A, Power MC. Racial disparities and temporal trends in dementia misdiagnosis risk in the United States. Alzheimers Dement (NY). 2019;5:891‐898. [DOI] [PMC free article] [PubMed] [Google Scholar]
- 3. Taylor DH Jr, Ostbye T, Langa KM, Weir D, Plassman BL. The accuracy of Medicare claims as an epidemiological tool: the case of dementia revisited. J Alzheimers Dis. 2009;17:807‐815. [DOI] [PMC free article] [PubMed] [Google Scholar]
- 4. Lang L, Clifford A, Wei L, et al. Prevalence and determinants of undetected dementia in the community: a systematic literature review and a meta‐analysis. BMJ Open. 2017;7:e011146. [DOI] [PMC free article] [PubMed] [Google Scholar]
- 5. Power MC, Gianattasio KZ, Ciarleglio A. Implications of the use of algorithmic diagnoses or Medicare claims to ascertain dementia. Neuroepidemiology. 2020;54:462‐471. [DOI] [PMC free article] [PubMed] [Google Scholar]
- 6. Zissimopoulos JM, Tysinger BC, St Clair PA, Crimmins EM. The impact of changes in population health and mortality on future prevalence of Alzheimer's disease and other dementias in the United States. J Gerontol B Psychol Sci Soc Sci. 2018;73:S38‐S47. [DOI] [PMC free article] [PubMed] [Google Scholar]
- 7. Matthews KA, Xu W, Gaglioti AH, et al. Racial and ethnic estimates of Alzheimer's disease and related dementias in the United States (2015‐2060) in adults aged >/= 65 years. Alzheimers Dement. 2019;15:17‐24. [DOI] [PMC free article] [PubMed] [Google Scholar]
- 8. Hebert LE, Weuve J, Scherr PA, Evans DA. Alzheimer disease in the United States (2010‐2050) estimated using the 2010 census. Neurology. 2013;80:1778‐1783. [DOI] [PMC free article] [PubMed] [Google Scholar]
- 9. Knopman DS, Gottesman RF, Sharrett AR, et al. Mild cognitive impairment and dementia prevalence: the atherosclerosis risk in communities neurocognitive study (ARIC‐NCS). Alzheimers Dement (Amst). 2016;2:1‐11. [DOI] [PMC free article] [PubMed] [Google Scholar]
- 10. Mayeda ER, Glymour MM, Quesenberry CP, Whitmer RA. Inequalities in dementia incidence between six racial and ethnic groups over 14 years. Alzheimers Dement. 2016;12:216‐224. [DOI] [PMC free article] [PubMed] [Google Scholar]
- 11. Rajan KB, Weuve J, Barnes LL, Wilson RS, Evans DA. Prevalence and incidence of clinically diagnosed Alzheimer's disease dementia from 1994 to 2012 in a population study. Alzheimers Dement. 2019;15:1‐7. [DOI] [PMC free article] [PubMed] [Google Scholar]
- 12. Rush Alzheimer's Disease Center (RADC) . RADC Research Resource Sharing Hub. Rush Alzheimer's Disease Center (RADC). Accessed June 11, 2020, at https://www.radc.rush.edu/ [Google Scholar]
- 13. Plassman BL, Langa KM, Fisher GG, et al. Prevalence of dementia in the United States: the aging, demographics, and memory study. Neuroepidemiology. 2007;29:125‐132. [DOI] [PMC free article] [PubMed] [Google Scholar]
- 14. Tang MX, Cross P, Andrews H, et al. Incidence of AD in African‐Americans, Caribbean Hispanics, and Caucasians in Northern Manhattan. Neurology. 2001;56:49‐56. [DOI] [PubMed] [Google Scholar]
- 15. Bennett DA, Schneider JA, Buchman AS, Barnes LL, Boyle PA, Wilson RS. Overview and findings from the rush memory and aging project. Curr Alzheimer Res. 2012;9:646‐663. [DOI] [PMC free article] [PubMed] [Google Scholar]
- 16. Barnes LL, Shah RC, Aggarwal NT, Bennett DA, Schneider JA. The Minority Aging Research Study: ongoing efforts to obtain brain donation in African Americans without dementia. Curr Alzheimer Res. 2012;9:734‐745. [DOI] [PMC free article] [PubMed] [Google Scholar]
- 17. Alonso A, Mosley T, Gottesman RF, Catellier D, Sharrett AR, Coresh J. Risk of dementia hospitalisation associated with cardiovascular risk factors in midlife and older age: the Atherosclerosis Risk in Communities (ARIC) study. J Neurol Neurosurg Psychiatry. 2009;80:1194‐1201. [DOI] [PMC free article] [PubMed] [Google Scholar]
- 18. Jorm AF, Jolley D. The incidence of dementia: a meta‐analysis. Neurology. 1998;51:728‐733. [DOI] [PubMed] [Google Scholar]
- 19. Fitzpatrick AL, Kuller LH, Ives DG, et al. Incidence and prevalence of dementia in the cardiovascular health study. J Am Geriatr Soc. 2004;52:195‐204. [DOI] [PubMed] [Google Scholar]
- 20. Ganguli M, Lee CW, Snitz BE, Hughes TF, McDade E, Chang CC. Rates and risk factors for progression to incident dementia vary by age in a population cohort. Neurology. 2015;84:72‐80. [DOI] [PMC free article] [PubMed] [Google Scholar]
- 21. U.S. Census Bureau . Explore Census Data. U.S. Census Bureau. Retrieved September 24, 2020, from https://data.census.gov/cedsci/ [Google Scholar]
- 22. Kukull WA, Higdon R, Bowen JD, et al. Dementia and Alzheimer disease incidence: a prospective cohort study. Arch Neurol. 2002;59:1737‐1746. [DOI] [PubMed] [Google Scholar]
- 23. Yaffe K, Falvey C, Harris TB, et al. Effect of socioeconomic disparities on incidence of dementia among biracial older adults: prospective study. BMJ. 2013;347:f7051. [DOI] [PMC free article] [PubMed] [Google Scholar]
- 24. Alzheimer's Association . 2020 Alzheimer's Disease Facts and Figures. Alzheimer's Association; 2020. [Google Scholar]
- 25. Wolters FJ, Chibnik LB, Waziry R, et al. Twenty‐seven‐year time trends in dementia incidence in Europe and the United States. Alzheimer Cohorts Consortium. 2020;95:e519‐e531. [DOI] [PMC free article] [PubMed] [Google Scholar]
- 26. Olivari BS, French ME, McGuire LC. The public health road map to respond to the growing dementia crisis. Innov Aging. 2020;4:igz043. [DOI] [PMC free article] [PubMed] [Google Scholar]
- 27. Winblad B, Amouyel P, Andrieu S, et al. Defeating Alzheimer's disease and other dementias: a priority for European science and society. Lancet Neurol. 2016;15:455‐532. [DOI] [PubMed] [Google Scholar]
- 28. Albert SM, Costa R, Merchant C, Small S, Jenders RA, Stern Y. Hospitalization and Alzheimer's disease: results from a community‐based study. J Gerontol A Biol Sci Med Sci. 1999;54:M267‐M271. [DOI] [PubMed] [Google Scholar]
- 29. NATSEM University of Canberra . A review of small area estimation problems and methodolgical developments. Discussion Paper 66. Prepared by Azizur Rahman. (2008); Pages 6–56. https://researchoutput.csu.edu.au/en/publications/a‐review‐of‐small‐area‐estimation‐problems‐and‐methodologicaldev
- 30. Zhang X, Holt JB, Lu H, et al. Multilevel regression and post stratification for small‐area estimation of population health outcomes: a case study of chronic obstructive pulmonary disease prevalence using the behavioral risk factor surveillance system. Am J Epidemiol. 2014;179:1025‐1033. [DOI] [PubMed] [Google Scholar]
- 31. Brookmeyer R, Evans DA, Hebert L, et al. National estimates of the prevalence of Alzheimer's disease in the United States. Alzheimer's Dement. 2011;7:61‐73. [DOI] [PMC free article] [PubMed] [Google Scholar]
- 32. Wilson RS, Weir DR, Leurgans SE, et al. Sources of variability in estimates of the prevalence of Alzheimer's disease in the United States. Alzheimer's Dement. 2011;7:74‐79. [DOI] [PMC free article] [PubMed] [Google Scholar]
- 33. Mehta K, Yeo G. Systematic review of dementia prevalence and incidence in US race/ethnic populations. Alzheimer's Dement. 2016;13:72‐83. [DOI] [PubMed] [Google Scholar]
- 34. Mayeda ER, Glymour MM, Quesenberry CP Jr, Whitmer RA. Heterogeneity in 14‐year dementia incidence between Asian American subgroups. Alzheimer Dis Assoc Disord. 2017;31:181‐186. [DOI] [PMC free article] [PubMed] [Google Scholar]
- 35. U.S. Census Bureau . When to Use 1‐year, 3‐year, or 5‐year Estimates. U.S. Census Bureau. Retrieved September 24, 2020, from https://www.census.gov/programs-surveys/acs/guidance/estimates.html [Google Scholar]
- 36. U.S. Census Bureau . Understanding and Using ACS Single‐Year and Multiyear Estimates. Understanding and Using American Community Survey Data: What all Data Users Need to Know. Washington, DC, U.S. Government Printing Office; 2018. https://www.census.gov/content/dam/Census/library/publications/2020/acs/acs_general_handbook_2020.pdf [Google Scholar]
- 37. Moore JT, Ricaldi JN, Rose CE, et al. Disparities in incidence of COVID‐19 among underrepresented racial/ethnic groups in counties identified as hotspots during June 5‐18, 2020 ‐ 22 States, February‐June 2020. MMWR Morb Mortal Wkly Rep. 2020;69:1122‐1126. [DOI] [PMC free article] [PubMed] [Google Scholar]
- 38. Dorn AV, Cooney RE, Sabin ML. COVID‐19 exacerbating inequalities in the US. Lancet. 2020;395:1243‐1244. [DOI] [PMC free article] [PubMed] [Google Scholar]
- 39. Yancy CW. COVID‐19 and African Americans. JAMA. 2020;323:1891‐1892. [DOI] [PubMed] [Google Scholar]
- 40. Apicella M, Campopiano MC, Mantuano M, Mazoni L, Coppelli A, Del Prato S. COVID‐19 in people with diabetes: understanding the reasons for worse outcomes. Lancet Diabetes Endocrinol. 2020;8:782‐792. [DOI] [PMC free article] [PubMed] [Google Scholar]
- 41. Wortham JM, Lee JT, Althomsons S, et al. Characteristics of persons who died with COVID‐19—United States, February 12‐May 18, 2020. MMWR Morb Mortal Wkly Rep. 2020;69:923‐929. [DOI] [PubMed] [Google Scholar]
- 42. Zhu CW, Ornstein KA, Cosentino S, Gu Y, Andrews H, Stern Y. Misidentification of dementia in Medicare claims and related costs. J Am Geriatr Soc. 2019;67:269‐276. [DOI] [PMC free article] [PubMed] [Google Scholar]