

Abstract
An epidemic of chronic kidney disease (CKD) of unknown etiology, known as Mesoamerican Nephropathy (MeN), has been ongoing in Latin America for at least two decades. MeN primarily affects young adults without traditional CKD risk factors, and agricultural workers are disproportionately afflicted. We previously identified an acute phase of MeN that involves acute kidney injury (AKI) with tubulointerstitial nephritis and systemic inflammation. Because clinical disease progression in MeN is not yet understood, we sought to determine clinical predictors for progression from acute MeN to CKD. Through ongoing surveillance in Nicaragua, local physicians reported cases of acute MeN and CKD among agricultural workers. We analyzed clinical data collected during the acute MeN encounter to identify factors associated with progression to CKD. From February 2015 to May 2017, 586 agricultural workers (median age 27.8 years, 90% male) presented with acute MeN. The majority had a normal baseline creatinine, and leukocyturia (98.8%) and peripheral leukocytosis (80.7%) were common. Ultimately, 49 (8.4%) progressed to CKD, the majority of those within 6 months. CKD was attributed to MeN in all cases, and none had diabetes or hypertension. The strongest predictors of CKD progression were anemia and paresthesias at presentation, while leukocytosis was associated with renal recovery. Clinical markers of acute MeN may help clinicians identify patients at high risk for rapid progression to CKD, which in turn can inform early clinical management. Future studies should seek to determine the underlying etiology of disease and identify optimal interventions to interrupt the pathophysiologic process of MeN.
Keywords: acute kidney injury, chronic kidney disease of nontraditional causes, chronic kidney disease of unknown etiology, Chronic Interstitial Nephritis in Agricultural Communities, Mesoamerican nephropathy, tubulointerstitial nephritis
CKD of unknown etiology (CKDu) is a phenomenon that afflicts individuals of working age, largely without chronic comorbidities, in various tropical regions of the world. CKDu in Central America, termed MeN, was first documented in El Salvador in 1999.1 It has since swept across the region, resulting in an estimated 50,000 premature deaths.1–3 The epidemic of MeN currently affects communities in nearly all of Mesoamerica, from southern Mexico to Panama, and new evidence points to its emergence as early as the mid-1970s.1–15 A major barrier to ending the MeN epidemic is the lack of understanding about its underlying cause and pathophysiology.
The epidemiology, risk factors, and clinical features of MeN differ from those of renal diseases most commonly occurring in most of the world. Classic risk factors, such as hypertension and diabetes, do not underlie disease; MeN first appears as a community-onset, rather than hospital-acquired, renal disease, and young, working-age individuals bear the highest disease burden.2,16–19 MeN clusters geographically in hot, tropical Pacific lowlands of Central America and disproportionately affects communities of low socioeconomic status who depend primarily on agriculture work and other manual labor. Hotspots of high MeN prevalence exist where resources for diagnosis and management, such as renal biopsy, dialysis and transplant are scarce.5,19–21 Clinical recognition and management at the earliest possible stage are imperative for reducing MeN-associated mortality.
The incidence of CKD at a major MeN hotspot in Nicaragua, where our studies are based, was 239 per 100,000 agricultural workers in 2015. In the same year, the incidence of acute kidney injury (AKI) was 1593 per 100,000 workers.18 In this locale, CKD is overwhelmingly attributed to MeN, and we previously documented AKI as a precursor to MeN in this same population. Patients with acute MeN usually present with AKI and marked systemic inflammation, and renal biopsies demonstrate tubulointerstitial nephritis as the hallmark pathology.18,22 A subset of individuals with acute MeN, though not all, develop CKDu. A greater understanding of the roles of acute clinical markers in the disease process can provide clues to the curious pathophysiology of MeN and guide research into its underlying cause. Until we know its etiology, evidence-based guidelines for clinical recognition and management of AKI to prevent CKD and end-stage renal disease (ESRD) are the most urgent needs. In order to facilitate the early, noninvasive identification of individuals at high risk for CKDu in Mesoamerica, we analyzed clinical data on patients with acute MeN to identify clinical predictors of disease progression.
RESULTS
From February 27, 2015, to May 04, 2017, 586 agriculture workers presented with acute signs of renal impairment and were presumptively diagnosed with acute MeN; 35 patients (6.0%) presented with multiple episodes. Patients were typically young (median: 27.8 years [range 18.4–58.5]), primarily male (90.3%), and had been working at the agriculture estate for a median of 6 years (range 0–40) (Table 1 and Supplementary Table S1). The most common occupations were crop cutting (29.9%) and irrigation and drainage systems work (17.6%). Medical histories were largely unremarkable, except that 11.3% reported having frequent urinary tract infections at some point in the past, 14.3% self-reported a history of anemia, and 11.9% were classified as obese (body mass index ≥30). Diabetes (2.0%) and hypertension (4.1%) were uncommon. No patient had a prior CKD diagnosis, though 16.5% reported a prior episode of elevated creatinine.
Table 1 |.
Characteristics of study population (N = 586)
| n | No CKD n (%) | CKD n (%) | All n (%) | P value | |
|---|---|---|---|---|---|
| 537 (91.6) | 49 (8.4) | ||||
| Demographics | |||||
| Sex | |||||
| Male | 586 | 484 (90.1) | 45 (91.8) | 529 (90.3) | 1.000 |
| Female | 53 (9.9) | 4 (8.2) | 57 (9.7) | ||
| Age (yr) | |||||
| <25 | 586 | 187 (34.8) | 9 (18.4) | 196 (33.5) | 0.033 |
| 25–29 | 142 (26.4) | 12 (24.5) | 154 (26.3) | ||
| 30–34 | 94 (17.5) | 10 (20.4) | 104 (17.8) | ||
| ≥35 | 114 (21.2) | 18 (36.7) | 132 (22.5) | ||
| Social history | |||||
| Number of years working in sugarcane fields | |||||
| ≤2 | 518 | 153 (32.3) | 5 (11.4) | 158 (30.5) | 0.011 |
| 3–6 | 151 (31.9) | 16 (36.4) | 167 (32.2) | ||
| 7–10 | 91 (19.2) | 9 (20.5) | 100 (19.3) | ||
| >10 | 79 (16.7) | 14 (31.8) | 93 (18) | ||
| Occupation | |||||
| Crop cutter | 585 | 157 (29.3) | 18 (36.7) | 175 (29.9) | 0.276 |
| Irrigation, drainage worker | 585 | 92 (17.2) | 11 (22.5) | 103 (17.6) | 0.353 |
| Seeder, planter | 585 | 81 (15.1) | 3 (6.1) | 84 (14.4) | 0.092 |
| Pest, weed control worker | 585 | 54 (10.1) | 7 (14.3) | 61 (10.4) | 0.356 |
| Past medical history | |||||
| Prior elevated creatinine | 568 | 83 (15.96) | 11 (22.92) | 94 (16.55) | 0.215 |
| Frequent UTIs | 560 | 58 (11.3) | 5 (10.4) | 63 (11.3) | 1.000 |
| Diabetes | 559 | 11 (2.2) | 0 (0) | 11 (2) | 0.611 |
| Hypertension | 558 | 19 (3.7) | 4 (8.3) | 23 (4.1) | 0.126 |
| Gout | 559 | 3 (0.6) | 1 (2.1) | 4 (0.7) | 0.302 |
| Anemia | 558 | 69 (13.5) | 11 (23.4) | 80 (14.3) | 0.064 |
| Kidney stones | 560 | 11 (2.1) | 1 (2.1) | 12 (2.1) | 0.931 |
| Renal injury | 558 | 2 (0.4) | 0 (0) | 2 (0.4) | 1.000 |
| Pancreatitis | 557 | 5 (0.98) | 0 (0) | 5 (0.9) | 1.000 |
| Sexually transmitted infection | 558 | 3 (0.6) | 0 (0) | 3 (0.5) | 1.000 |
| Hepatitis | 560 | 3 (0.6) | 0 (0) | 3 (0.5) | 1.000 |
| Leptospirosis | 559 | 3 (0.6) | 1 (2.2) | 4 (0.7) | 0.291 |
| Malaria | 236 | 7 (3.1) | 0 (0) | 7 (3.0) | 1.000 |
| Dengue | 235 | 10 (4.5) | 2 (18.2) | 12 (5.1) | 0.102 |
| Chikungunya | 244 | 40 (17.3) | 2 (15.4) | 42 (17.2) | 1.000 |
| Any of above infections | 244 | 48 (20.88) | 3 (23.1) | 51 (20.9) | 0.738 |
| n | Median (range) | P value | |||
| Age (yr) | 586 | 27.5 (18.4–58.5) | 31.2 (19.6–53) | 27.8 (18.4–58.5) | 0.013 |
| Number of years working cane fields | 518 | 5 (0–40) | 7.5 (1–36) | 5 (0–40) | 0.004 |
CKD, chronic kidney disease; UITs, urinary tract infections.
At the time of acute presentation, patients were largely normotensive (90.6% <130/90 mm Hg) and reported diverse symptoms (Table 2 and Supplementary Table S1). The most common complaints were nausea or vomiting (72.7%), fever (70.8%, self-reported or measured at ≥38.0 °C), back pain (60.5%), and headache (54.9%). Paresthesia was notably common (41.7%) and was associated with anemia (P < 0.001) but not with electrolyte imbalance. Most patients were treated with intravenous fluids and electrolytes (91.6%), while only a few were administered acetaminophen (5.4%), ranitidine (5.6%), allopurinol (3.6%), or antibiotics (1.4%).
Table 2 |.
Clinical Assessment and Management
| n | No CKD n (%) | CKD n (%) | All n (%) | P value | |
|---|---|---|---|---|---|
| 537 (91.6) | 49 (8.4) | ||||
| Acute presentation | |||||
| Normotensive (<120/80 mm Hg) | 577 | 458 (86.7) | 43 (87.8) | 501 (86.8) | 0.841 |
| BMI ≥25 kg/m2 | 564 | 240 (46.2) | 15 (33.3) | 255 (45.2) | 0.095 |
| Fever, chills | 504 | 328 (70.8) | 29 (70.7) | 357 (70.8) | 0.988 |
| Nausea, vomiting | 579 | 390 (73.6) | 31 (63.3) | 421 (72.7) | 0.121 |
| Back pain | 557 | 311 (61.1) | 26 (54.2) | 337 (60.5) | 0.348 |
| Headache | 548 | 278 (55.6) | 23 (47.9) | 301 (54.9) | 0.307 |
| Debility | 533 | 190 (39.2) | 20 (41.7) | 210 (39.4) | 0.736 |
| Paresthesia | 459 | 162 (38.7) | 30 (75.0) | 192 (41.8) | <0.001 |
| Cramps | 468 | 202 (47.3) | 23 (56.1) | 225 (48.1) | 0.282 |
| Abdominal pain | 534 | 159 (32.7) | 11 (22.9) | 170 (31.8) | 0.164 |
| Myalgia | 533 | 163 (33.5) | 13 (28.3) | 176 (33.0) | 0.473 |
| Arthralgia | 538 | 154 (31.2) | 13 (28.9) | 167 (31.0) | 0.744 |
| Dizziness | 290 | 84 (31.8) | 10 (38.5) | 94 (32.4) | 0.490 |
| Urinary symptoms | 529 | 88 (18.2) | 7 (15.2) | 95 (18.0) | 0.612 |
| Fatigue | 524 | 96 (20.1) | 13 (28.3) | 109 (20.8) | 0.192 |
| Decreased or loss of appetite | 481 | 30 (6.8) | 6 (14.6) | 36 (7.48) | 0.069 |
| Tremors | 520 | 41 (8.6) | 6 (13.3) | 47 (9.0) | 0.293 |
| Neck pain | 511 | 43 (9.3) | 4 (8.7) | 47 (9.2) | 1.000 |
| Diarrhea | 426 | 23 (5.9) | 3 (8.8) | 26 (6.1) | 0.452 |
| Cough | 523 | 23 (4.8) | 7 (15.2) | 30 (5.7) | 0.004 |
| Chest pain | 512 | 25 (5.4) | 2 (4.4) | 27 (5.3) | 1.000 |
| Blurred vision | 519 | 13 (2.8) | 0 (0) | 13 (2.5) | 0.618 |
| Edema | 515 | 6 (1.3) | 1 (2.1) | 7 (1.4) | 0.490 |
| Respiratory difficulty, dyspnea | 521 | 13 (2.7) | 0 (0) | 13 (2.5) | 0.617 |
| Rash | 516 | 6 (1.3) | 0 (0) | 6 (1.7) | 1.000 |
| Jaundice | 517 | 4 (0.9) | 0 (0) | 4 (0.8) | 1.000 |
| Confusion | 240 | 4 (1.8) | 2 (10.0) | 6 (2.5) | 0.081 |
| Asymptomatic | 586 | 4 (0.7) | 0 (0) | 4 (0.7) | 1.000 |
| n | Median (range) | P value | |||
| Temperature (°C) | 585 | 36.7 (36.0–40.0) | 36.5 (36.0–38.9) | 36.7 (36.0–40.0) | 0.206 |
| BMI (kg/m2) | 564 | 24.5 (14.8–61.1) | 22.8 (20.2–35.9) | 24.4 (14.8–61.1) | 0.075 |
BMI, body mass index; CKD, chronic kidney disease.
The median serum creatinine level during these acute episodes was 2.0 mg/dl (range 0.9–5.1) (Table 3 and Supplementary Table S2). Hematology and blood chemistry revealed leukocytosis (80.5%), neutrophilia (85.4%), and elevated C-reactive protein (75.9%); 19.1% had extreme leukocytosis (>20,000 cells/mm3). A high proportion of patients had lymphopenia (46.5%), anemia (63.6%), low red blood cell (RBC) counts (57.3%), hyperuricemia (29.7%), elevated blood urea nitrogen ([BUN]; 30.6%), elevated creatinine phosphokinase (18.2%) or decreased electrolytes (hypomagnesemia [38.6%], hypokalemia [35.8%], and hyponatremia [9.9%]). BUN-creatinine ratios were low (<10.0) in more than half of patients (53.2%).
Table 3 |.
Clinical laboratory findings–hematology and blood chemistry
| n | No CKD n (%) | CKD n (%) | All n (%) | P value | |
|---|---|---|---|---|---|
| 537 (91.6) | 49 (8.4) | ||||
| Creatinine >2.0 mg/dl | 586 | 240 (44.7) | 28 (57.1) | 268 (45.7) | 0.094 |
| Leukocytosis >10,000 cells/mm3 | 581 | 440 (82.4) | 29 (61.7) | 469 (80.7) | 0.001 |
| Neutrophilia >67% | 581 | 456 (85.4) | 40 (85.1) | 496 (85.4) | 0.957 |
| Lymphopenia <20% | 581 | 256 (47.9) | 14 (29.8) | 270 (46.5) | 0.017 |
| Eosinophilia >4% | 564 | 33 (6.4) | 3 (6.5) | 36 (6.4) | 1.000 |
| Hemoglobin anemia <13.5 g/dl male, <12.0 g/dl female | 308 | 168 (60.9) | 28 (87.5) | 196 (63.6) | 0.003 |
| Hematocrit anemia <38.8% male, <34.9% female | 581 | 305 (57.1) | 38 (80.9) | 343 (59) | 0.002 |
| Low red blood cell count <4.3 × 10⁶ cells/ml male, <3.9 × 10⁶ cells/ml female | 75 | 24 (45.3) | 19 (86.4) | 43 (57.3) | 0.002 |
| Hyperuricemia >7.0 mg/dl male, >6.0 mg/dl female | 552 | 143 (28.2) | 21 (47.7) | 164 (29.7) | 0.006 |
| Hypocalcemia (ionized) <1.1 mmol/l | 564 | 76 (14.7) | 10 (21.7) | 86 (15.3) | 0.201 |
| Hypomagnesemia <1.9 mg/dl | 536 | 186 (37.7) | 21 (50.0) | 207 (38.6) | 0.115 |
| Hypokalemia <3.5 mmol/l | 573 | 191 (36.4) | 14 (29.2) | 205 (35.8) | 0.318 |
| Hyponatremia <135 mmol/l | 564 | 46 (8.9) | 10 (20.8) | 56 (9.9) | 0.008 |
| CPK | 474 | 82 (18.9) | 4 (10.0) | 86 (18.1) | 0.201 |
| >336 μ/l male; >176 μ/l female | |||||
| BUN >23.3 mg/dl | 408 | 112 (30.2) | 13 (35.1) | 125 (30.6) | 0.534 |
| BCR <10.0 | 408 | 196 (52.8) | 21 (56.8) | 217 (53.2) | 0.817 |
| C-reactive protein ≥6 mg/dl | 212 | 153 (76.9) | 8 (61.5) | 161 (75.9) | 0.311 |
| n | Median (range) | P value | |||
| Creatinine (mg/dl) | 586 | 2.0 (0.9–5.1) | 2.1 (1.2–3.4) | 2.0 (0.9–5.1) | 0.178 |
| Leukocytes (cells/mm3) | 581 | 14,800 (4,600–36,000) | 11,150 (6,016–23,400) | 14,500 (4,600–36,000) | 0.001 |
| Neutrophils (%) | 581 | 79.5 (40–96) | 75 (51–94) | 79 (40–96) | 0.071 |
| Lymphocytes (%) | 581 | 20 (4–54) | 24 (6–49) | 20 (4–54) | 0.042 |
| Hemoglobin (g/dl) | 308 | 12.8 (8.1–19.5) | 11.1 (8.0–16.0) | 12.5 (8.0–19.5) | <0.001 |
| Hematocrit (%) | 581 | 37.4 (23.0–54.0) | 34.0 (20.0–51.0) | 37.0 (20.0–54.0) | 0.001 |
| Red blood cell count (× 106 cells/ml) | 75 | 4.4 (3.0–5.7) | 3.8 (2.7–5.5) | 4.0 (2.7–5.7) | 0.015 |
| Uric acid (mg/dl) | 552 | 6.0 (1.7–35.0) | 6.9 (3.4–12.5) | 6.0 (1.7–35.0) | 0.003 |
| BUN (mg/dl) | 408 | 20.0 (1.9–81.0) | 22.0 (10.2–39.0) | 20.0 (1.9–81.0) | 0.116 |
BCR, BUN-creatinine ratio; BUN, blood urea nitrogen; CKD, chronic kidney disease; CPK, creatine phosphokinase.
Urine microscopy demonstrated leukocyturia in 98.8% of patients, and some had clumping of leukocytes (24.1%) and leukocyte casts (30.7%) (Table 4 and Supplementary Table S3). Bacteriuria (24.2%; >few) was noted but was associated with epithelial cells in the specimen (P < 0.001), and urine cultures performed on 12 patients were negative. Crystalluria (49.0%) was often composed of amorphous urate crystals (49.1%). Urine dipstick findings included proteinuria (42.0%; >trace levels), hemoglobinuria (35.6%), and occasional glucosuria (13.7%). Specific gravity (median: 1.020 [range 1.000–1.030]) and pH (median: 6.0 [range 5.0–9.0]) were mostly normal.
Table 4 |.
Clinical laboratory findings—urine analysis
| n | No CKD n (%) | CKD n (%) | All n (%) | P value | |
|---|---|---|---|---|---|
| 537 (91.6) | 49 (8.4) | ||||
| Turbid aspect | 583 | 405 (75.7) | 21 (43.8) | 426 (73.1) | <0.001 |
| Protein (mg/dl) | |||||
| None | 583 | 261 (48.8) | 33 (68.8) | 294 (50.4) | 0.060 |
| Trace | 40 (7.5) | 4 (8.3) | 44 (7.6) | ||
| 30 | 98 (18.3) | 6 (12.5) | 104 (17.8) | ||
| 100 | 106 (19.8) | 5 (10.4) | 111 (19.0) | ||
| >100 | 30 (5.6) | 0 (0) | 30 (5.2) | ||
| Glucosea | 583 | 79 (14.8) | 1 (2.1) | 80 (13.7) | 0.008 |
| Hemoglobina | 581 | 191 (35.8) | 16 (33.3) | 207 (35.6) | 0.729 |
| Leukocytes | |||||
| 0–2 per field | 583 | 26 (4.9) | 6 (12.5) | 32 (5.5) | 0.095 |
| 3–14 per field | 95 (17.8) | 10 (20.8) | 105 (18.0) | ||
| 15–29 per field | 91 (17.0) | 10 (20.8) | 101 (17.3) | ||
| ≥30 per field | 150 (28.0) | 13 (27.1) | 163 (28.0) | ||
| Too numerous to count | 173 (32.3) | 9 (18.8) | 182 (31.2) | ||
| Castsa | 579 | 238 (44.7) | 11 (23.4) | 249 (43.0) | 0.005 |
| Leukocytic castsa | 579 | 169 (31.8) | 9 (19.2) | 178 (30.7) | 0.072 |
| Crystalsa | 580 | 268 (50.3) | 16 (34.0) | 284 (49.0) | 0.033 |
| Amorphous uratesa | 580 | 229 (43.0) | 14 (29.8) | 243 (41.9) | 0.079 |
| Microalbuminuria ≥30 mg/dl | 331 | 193 (62.9) | 7 (29.2) | 200 (60.4) | 0.001 |
| Bacteriuria >Few per field | 583 | 138 (25.8) | 3 (6.3) | 141 (24.2) | 0.001 |
| n | Median (range) | P value | |||
| Specific gravity | 582 | 1020 (1000–1030) | 1020 (1005–1030) | 1020 (1000–1030) | 1.000 |
| pH | 582 | 6.0 (5.0–9.0) | 6.0 (5.0–8.0) | 6.0 (5.0–9.0) | 1.000 |
CKD, chronic kidney disease.
Present at any level.
Healthy baseline serum creatinine levels were available for 514 patients. Using these baseline levels (median: 1.0 mg/dl [range 0.6–1.3]), we assessed change in creatinine from baseline to acute presentation and found that 90.5% of patients presented acutely with AKI, most with Acute Kidney Injury Network (AKIN) stage 2 (40.3) or stage 3 (38.5%) AKI (Table 5); the remaining 9.5% of patients did not meet specific AKIN criteria, despite having abnormal creatinine levels or creatinine clearance. Acute creatinine levels reflected a 2-fold (range 0.9–6.1) increase over baseline after a median of only 113 (range 5–356) days.
Table 5 |.
Change in renal function from healthy baseline to acute presentation
| n | No CKD n (%) | CKD n (%) | All n (%) | P value | |
|---|---|---|---|---|---|
| AKI at acute presentation | |||||
| None | 514 | 42 (9.0) | 7 (15.6) | 49 (9.5) | 0.315 |
| Stage 1 | 193 (41.2) | 14 (31.1) | 207 (40.3) | ||
| Stage 2 | 181 (38.6) | 17 (37.8) | 198 (38.5) | ||
| Stage 3 | 53 (11.3) | 7 (15.6) | 60 (11.7) | ||
| CrCl at baseline (ml/min) | |||||
| ≥90 | 498 | 320 (70.6) | 22 (48.9) | 342 (68.7) | 0.003 |
| <90 | 133 (29.4) | 23 (51.1) | 156 (31.3) | ||
| eGFR (CKD-EPI) at baseline (ml/min per 1.73 m2) | |||||
| ≥90 | 514 | 307 (65.5) | 23 (51.1) | 330 (64.2) | 0.055 |
| <90 | 162 (34.5) | 22 (48.9) | 184 (35.8) | ||
| eGFR (MDRD) at baseline (ml/min per 1.73 m2) | |||||
| ≥90 | 514 | 178 (38.0) | 13 (28.9) | 191 (37.2) | 0.229 |
| <90 | 291 (62.1) | 32 (71.1) | 323 (62.8) | ||
| n | Median (range) | P value | |||
| Serum creatinine at baseline (mg/dl) | 514 | 1.0 (0.6–1.3) | 1.1 (0.7–1.3) | 1.0 (0.6–1.3) | 0.015 |
| CrCl at baseline (ml/min) | 498 | 102.8 (54.2–219.1) | 89.4 (60.0–160.5) | 102.1 (54.2–219.1) | 0.003 |
| Time from baseline to acute presentation (days) | 514 | 110 (5–356) | 139 (9–278) | 113 (5–356) | 0.040 |
| Change from healthy baseline | |||||
| Serum creatinine increase from baseline (mg/dl) | 514 | 1.0 (−0.1 to 4) | 1.2 (0.1–2.3) | 1.0 (−0.1 to 4.0) | 0.090 |
| Serum creatinine fold-increase from baseline | 514 | 2.0 (0.9–6.1) | 2.1 (1.1–3.2) | 2.0 (0.9–6.1) | 0.489 |
| Serum creatinine % increase from baseline | 514 | 100.0 (−6.4 to 514.3) | 108.3 (8.3–218.2) | 100.0 (−6.4 to 514.3) | 0.489 |
AKI, acute kidney injury; CKD, chronic kidney disease; CKD-EPI, Chronic Kidney Disease–Epidemiology Collaboration; CrCl, creatinine clearance; eGFR, estimated glomerular filtration rate; MDRD, Modification of Diet in Renal Disease study.
Progression to CKD
Of these 586 patients with acute MeN, 49 (8.4%) have been diagnosed with CKD (as of November 30, 2017), most (65.4%) with stage 3 or worse (Table 6). Patients were notably young (median: 31.7 years [range 20.0–53.0]) at the time of CKD diagnosis, and most (91.8%) were male. When we consider the subset of cases from the first year of surveillance only (i.e., those with the longest follow-up time [range 642–1007 days]), 10.8% have developed CKD. All CKD diagnoses reported herein are attributed to MeN, and no patient had any other known cause of CKD. Progression from acute disease to CKD was rapid, with diagnoses following a median of 3 months (101 days [range 1–883]) from acute presentation. Most (78.5%; n = 38) were diagnosed within the first 6 months, while only 20.4% (n = 10) of patients developed CKD a year or more after their acute episodes.
Table 6 |.
Characteristics at CKD diagnosis (n = 49)
| n | n (%) | |
|---|---|---|
| Diagnosed CKD stage | ||
| 1 | 49 | 2 (4.1) |
| 2 | 13 (26.5) | |
| 3 | 30 (61.2) | |
| 4 | 2 (4.1) | |
| Unknown | 2 (4.1) | |
| Age at CKD diagnosis (yr) | ||
| <25 | 49 | 7 (14.3) |
| 25-<30 | 12 (24.5) | |
| 30-<35 | 12 (24.5) | |
| ≥35 | 18 (36.7) | |
| n | Median (range) | |
| Age at CKD diagnosis (yr) | 49 | 31.7 (20.0–53.3) |
| Serum creatinine at CKD diagnosis (mg/dl) | 48 | 1.5 (1.1–3.2) |
| Change from acute presentation | ||
| Change in serum creatinine from acute presentation to CKD (mg/dl) | 48 | −0.6 (−2.1 to 0.4) |
| Time from acute presentation to CKD (d) | 49 | 101 (1–883) |
| Change from healthy baseline | ||
| Change in serum creatinine from baseline to CKD (mg/dl) | 46 | 0.5 (0–2.3) |
| Percent Increase in serum creatinine from baseline to CKD (%) | 46 | 47.7 (−3.2 to 263.6) |
| Fold increase in serum creatinine from baseline to CKD | 46 | 1.5 (1.0–3.6) |
| Time from baseline to CKD (d) | 46 | 234 (42–925) |
| n | CKD-EPI (ml/min per 1.73 m2) | MDRD (ml/min per 1.73 m2) n (%) | Cockcroft-Gault (ml/min) | |
|---|---|---|---|---|
| Renal filtration rate at CKD diagnosis | ||||
| 90-<120 | 48 | 1 (2.1) | 0 (0) | 5 (10.4) |
| 60-<90 | 18 (37.5) | 11 (22.9) | 20 (41.7) | |
| 45-<60 | 22 (45.8) | 21 (43.8) | 18 (37.5) | |
| 30-<45 | 5 (10.4) | 14 (29.2) | 3 (6.3) | |
| <30 | 2 (4.2) | 2 (4.2) | 2 (4.2) | |
| n | Median (range) | |||
| Renal filtration rate at CKD diagnosis | 48 | 56.7 (24.6–90.9) | 50.4 (22.9–79.8) | 61.6 (29.3–110.4) |
| Change in renal filtration rate from baseline | 46 | −33.3 (−90.4 to 3.0) | −28.0 (−78.6 to 2.6) | −29.0 (−92.9 to 2.5) |
CKD, chronic kidney disease; CKD-EPI, Chronic Kidney Disease–Epidemiology Collaboration; MDRD, Modification of Diet in Renal Disease study.
We could characterize change in renal function from healthy baseline for 46 of the CKD case-patients, who were diagnosed with CKD a median of only 8 months (234 days [range 42–925]) from the time of their healthy baseline serum creatinine measurements. Median final serum creatinine levels were 47.7% (range −3.2 to 263.6) above baseline levels and correspond to an overall decrease in estimated glomerular filtration rate (eGFR) of 33.3 ml/min per 1.73 m2 (range −3.0 to 90.4) and a final, residual eGFR of 56.7 ml/min per 1.73 m2 (range 24.6–90.9).
At least 1 patient in our study died due to MeN. He was 20 years old at the time of his death, only 14 months after his AKI and 10 months after being diagnosed with stage 2 CKD. He had worked <2 harvest seasons as a sugarcane cutter. He initially presented with stage 1 AKI, anemia (hematocrit 33.0%, hemoglobin 11.0 g/dl, and 3.7 × 10⁶ RBC/ml), leukocyturia (too numerous to count), and borderline hyperuricemia (7.1 mg/dl); he lacked proteinuria and had normal white cell count (8780 cells/mm3), electrolytes, creatinine phosphokinase (170 m/l), and BUN (20.0 mg/dl).
Predictors of CKD progression
Although individuals with acute MeN are largely young, patients who went on to be diagnosed with CKD were older and more likely than non-CKD cases to have presented with acute MeN at age $30 years (prevalence ratio [PR]: 1.99 [95% confidence interval [95% CI]: 1.16–3.41]; P = 0.012) (Table 7). They were also more likely to have worked >2 years in sugarcane fields (PR: 2.99 [95% CI: 1.14–7.82]; P = 0.026), though longer working histories were not associated with CKD. The most common acute complaint in the patients who later progressed to CKD was paresthesia (75.0%; n = 30), which was significantly more frequent than in non-CKD progressors (PR: 3.94 [95% CI: 1.95–7.93]; P < 0.001). We found that CKD patients were more likely to have self-treated with electrolyte solutions (PR: 2.23 [95% CI: 1.06–4.67]; P = 0.033) and to have been given allopurinol while in the hospital (PR: 2.63 [95% CI: 1.16–5.98]; P = 0.021), although these were uncommon occurrences.
Table 7 |.
Association of select patient characteristics and clinical factors with progression to CKD (N = 586)
| Prevalence ratioa (95% CI) | P value | |
|---|---|---|
| Demographics and social history | ||
| Female sex | 0.76 (0.29–1.98) | 0.569 |
| Age ≤30 yr | 1.99 (1.16–3.41) | 0.012 |
| Has worked >2 seasons in sugarcane fields | 2.99 (1.14–7.82) | 0.026 |
| Has worked >5 seasons in sugarcane fields | 1.48 (0.76–2.87) | 0.248 |
| Most recently worked as a cutter | 1.56 (0.88–2.77) | 0.124 |
| Most recently worked as a seeder or planter | 0.46 (0.14–1.5) | 0.198 |
| Health history | ||
| History of anemia | 1.89 (0.98–3.65) | 0.058 |
| History of hypertension | 1.45 (0.55–3.83) | 0.458 |
| History of dengue infection | 3.85 (0.85–17.42) | 0.080 |
| Baseline CrCl <90 ml/min (Cockcroft-Gault) | 2.02 (1.17–3.49) | 0.011 |
| Baseline eGFR <90 ml/min per 1.73 m2 (CKD-EPI) | 1.38 (0.78–2.44) | 0.272 |
| Baseline eGFR <90 ml/min per 1.73 m2 (MDRD) | 1.18 (0.60–2.33) | 0.635 |
| Acute clinical presentation and management | ||
| Presented with AKI | 0.67 (0.31–1.44) | 0.307 |
| Overweight (BMI ≥25 kg/m2) | 0.48 (0.26–0.89) | 0.020 |
| Nausea or vomiting | 0.71 (0.42–1.23) | 0.222 |
| Paresthesia | 3.94 (1.95–7.93) | <0.001 |
| Abdominal pain | 0.6 (0.32–1.14) | 0.121 |
| Muscle cramps | 1.29 (0.71–2.34) | 0.407 |
| Fatigue | 1.46 (0.8–2.65) | 0.217 |
| Decrease or loss of appetite | 2.02 (0.91–4.46) | 0.082 |
| Cough | 2.61 (1.30–5.27) | 0.007 |
| Confusion | 4.33 (1.66–11.26) | 0.003 |
| Self-treated with hydration, electrolyte solution | 2.23 (1.06–4.67) | 0.033 |
| Allopurinol administered in hospital | 2.63 (1.16–5.98) | 0.021 |
| Acute clinical laboratory findings in blood | ||
| Serum creatinine >2.0 mg/dl | 1.58 (0.92–2.71) | 0.098 |
| Leukocytosis >10,000 WBCs/mm3 | 0.43 (0.24–0.74) | 0.003 |
| Moderate leukocytosis >12,000 WBCs/mm3 | 0.35 (0.19–0.64) | 0.001 |
| Severe leukocytosis >15,000 WBCs/mm3 | 0.15 (0.06–0.39) | <0.001 |
| Lymphopenia <20% | 0.57 (0.31–1.07) | 0.081 |
| Hemoglobin anemia <13.5 g/dl male, <12.0 g/dl female | 3.97 (1.46–10.85) | 0.007 |
| Hematocrit anemia <38.8% male, <34.9% female | 2.89 (1.43–5.84) | 0.003 |
| Low RBC count <4.3 × 10⁶ cells/ml male, <3.9 × 10⁶ cells/ml female | 5.02 (1.69–14.9) | 0.004 |
| Hyperuricemia >7.0 mg/dl male, >6.0 mg/dl female | 2.25 (1.28–3.94) | 0.005 |
| Hyponatremia <135 mmol/l | 2.23 (1.20–4.15) | 0.011 |
| Hypomagnesemia <1.9 mg/dl | 1.53 (0.87–2.71) | 0.141 |
| BUN >20.0 mg/dl | 2.09 (1.06–4.13) | 0.034 |
| Acute clinical laboratory findings in urine | ||
| Turbidity | 0.31 (0.18–0.55) | <0.001 |
| Proteinuria ≥30 mg/dl | 0.46 (0.23–0.91) | 0.025 |
| Glucoseb | 0.15 (0.02–1.07) | 0.059 |
| Leukocyturia ≥5 per field | 0.46 (0.24–0.87) | 0.017 |
| Castsb | 0.45 (0.23–0.90) | 0.023 |
| Leukocytic castsb | 0.57 (0.28–1.16) | 0.122 |
| Crystalsb | 0.6 (0.33–1.09) | 0.091 |
| Amorphous urate crystalsb | 0.64 (0.35–1.17) | 0.148 |
| Bacteriuria >few | 0.22 (0.07–0.71) | 0.011 |
| Microalbuminuria ≥30 mg/dl | 0.27 (0.12–0.64) | 0.003 |
AKI, acute kidney injury; BMI, body mass index; BUN, blood urea nitrogen; CI, confidence interval; CKD, chronic kidney disease; CKD-EPI, Chronic Kidney Disease–Epidemiology Collaboration; CrCl, creatinine clearance; eGFR, estimated glomerular filtration rate; MDRD, Modification of Diet in Renal Disease study; RBCs, red blood cells; WBCs, white blood cells.
Adjusted for age and sex.
Present at any level.
Surprisingly, CKD cases had lower leukocyte counts (median: 11,150 cells/mm3 [range 6,016–23,400]) during their acute episodes than patients who did not progress to CKD (median: 14,800 cells/mm3 [range 4,600–36,000]; P = 0.001). CKD progressors were less than half as likely to have had leukocytosis (PR: 0.43 [95% CI: 0.24–0.74]; P = 0.003) or leukocyturia (≥5 cells per field; PR: 0.46 [95% CI: 0.24–0.87]; P = 0.017). More specifically, they were significantly less likely to have had moderate (>12,000 cells/mm3; PR: 0.35 [95% CI: 0.19–0.64]; P = 0.001) or severe (>15,000 cells/mm3; PR: 0.15 [95% CI: 0.06–0.39]; P < 0.001) leukocytosis. Anemia was overwhelmingly prevalent (87.5%) in patients who went on to develop CKD, nearly 4 times as high than in non-CKD cases (PR: 3.97 [95% CI: 1.46–10.85]; P = 0.007 for hemoglobin anemia and PR: 2.89 [95% CI: 1.43–5.84]; P = 0.003 for hematocrit anemia). Low RBC counts (PR: 5.02 [95% CI: 1.69–14.90]; P = 0.004), hyperuricemia (PR: 2.25 [95% CI: 1.28–3.94]; P = 0.005), hyponatremia (PR: 2.23 [95% CI: 1.20–4.15]; P = 0.011), and elevated BUN (PR: 2.09 [95% CI: 1.06–4.13]; P = 0.034) were also associated with later CKD. Non-CKD cases were more likely to present with bacteriuria (PR: 0.22 [95% CI: 0.07–0.71]; P = 0.011) and turbid urine specimens (PR: 0.31 [95% CI: 0.18–0.55]; P < 0.001), as well as microalbuminuria (≥30 mg/dl; PR: 0.27 [95% CI: 0.12–0.64]; P = 0.003). Lastly, despite the fact that we considered only technically normal creatinine levels in our healthy baseline analysis, CKD cases were more likely to have had depressed creatinine clearance (CrCl) at baseline, compared with other patients (<90 ml/min; PR: 2.04 [95% CI: 1.17–3.58]; P = 0.013).
Rate of progression to CKD
The overall incidence rate of CKD in this acute MeN patient population was 54 per 1000-person years (95% CI: 40.5–70.9). Rates were lower in younger patients (30 per 1000 for <25 years; 95% CI: 15.6–57.6) than in older patients (87 per 1000 for ≥35 years; 95% CI: 55.0–138.7) (see Figure 1). Progression occurred more quickly in patients who experienced acute MeN at age ≥30 years (hazard ratio [HR]: 2.02 [95% CI: 1.15–3.54]; P = 0.014). Age- and sex-adjusted incident rates were higher in patients with anemia (73 per 1000; HR: 3.07 [95% CI: 1.50–6.32]; P = 0.002), hyperuricemia (88 per 1000; HR: 2.43 [95% CI: 1.33–4.41]; P = 0.004), hyponatremia (139 per 1000; HR: 2.49 [95% CI: 1.27–4.91]; P = 0.008), paresthesia (112 per 1000; HR: 4.20 [95% CI: 2.01–8.77]; P < 0.001), and baseline CrCl <90 ml/min (97 per 1000; HR: 2.00 [95% CI: 1.11–3.60]; P = 0.020). Consistent with the negative association between leukocyte count and developing CKD, patients with leucocytosis progressed more slowly (39 per 1000; HR: 0.40 [95% CI: 0.22–0.73]; P = 0.003).
Figure 1 |. Nelson-Aalen cumulative hazard of chronic kidney disease (CKD) progression*: overall and by demographic and other characteristics at acute Mesoamerican nephrology (MeN) presentation.
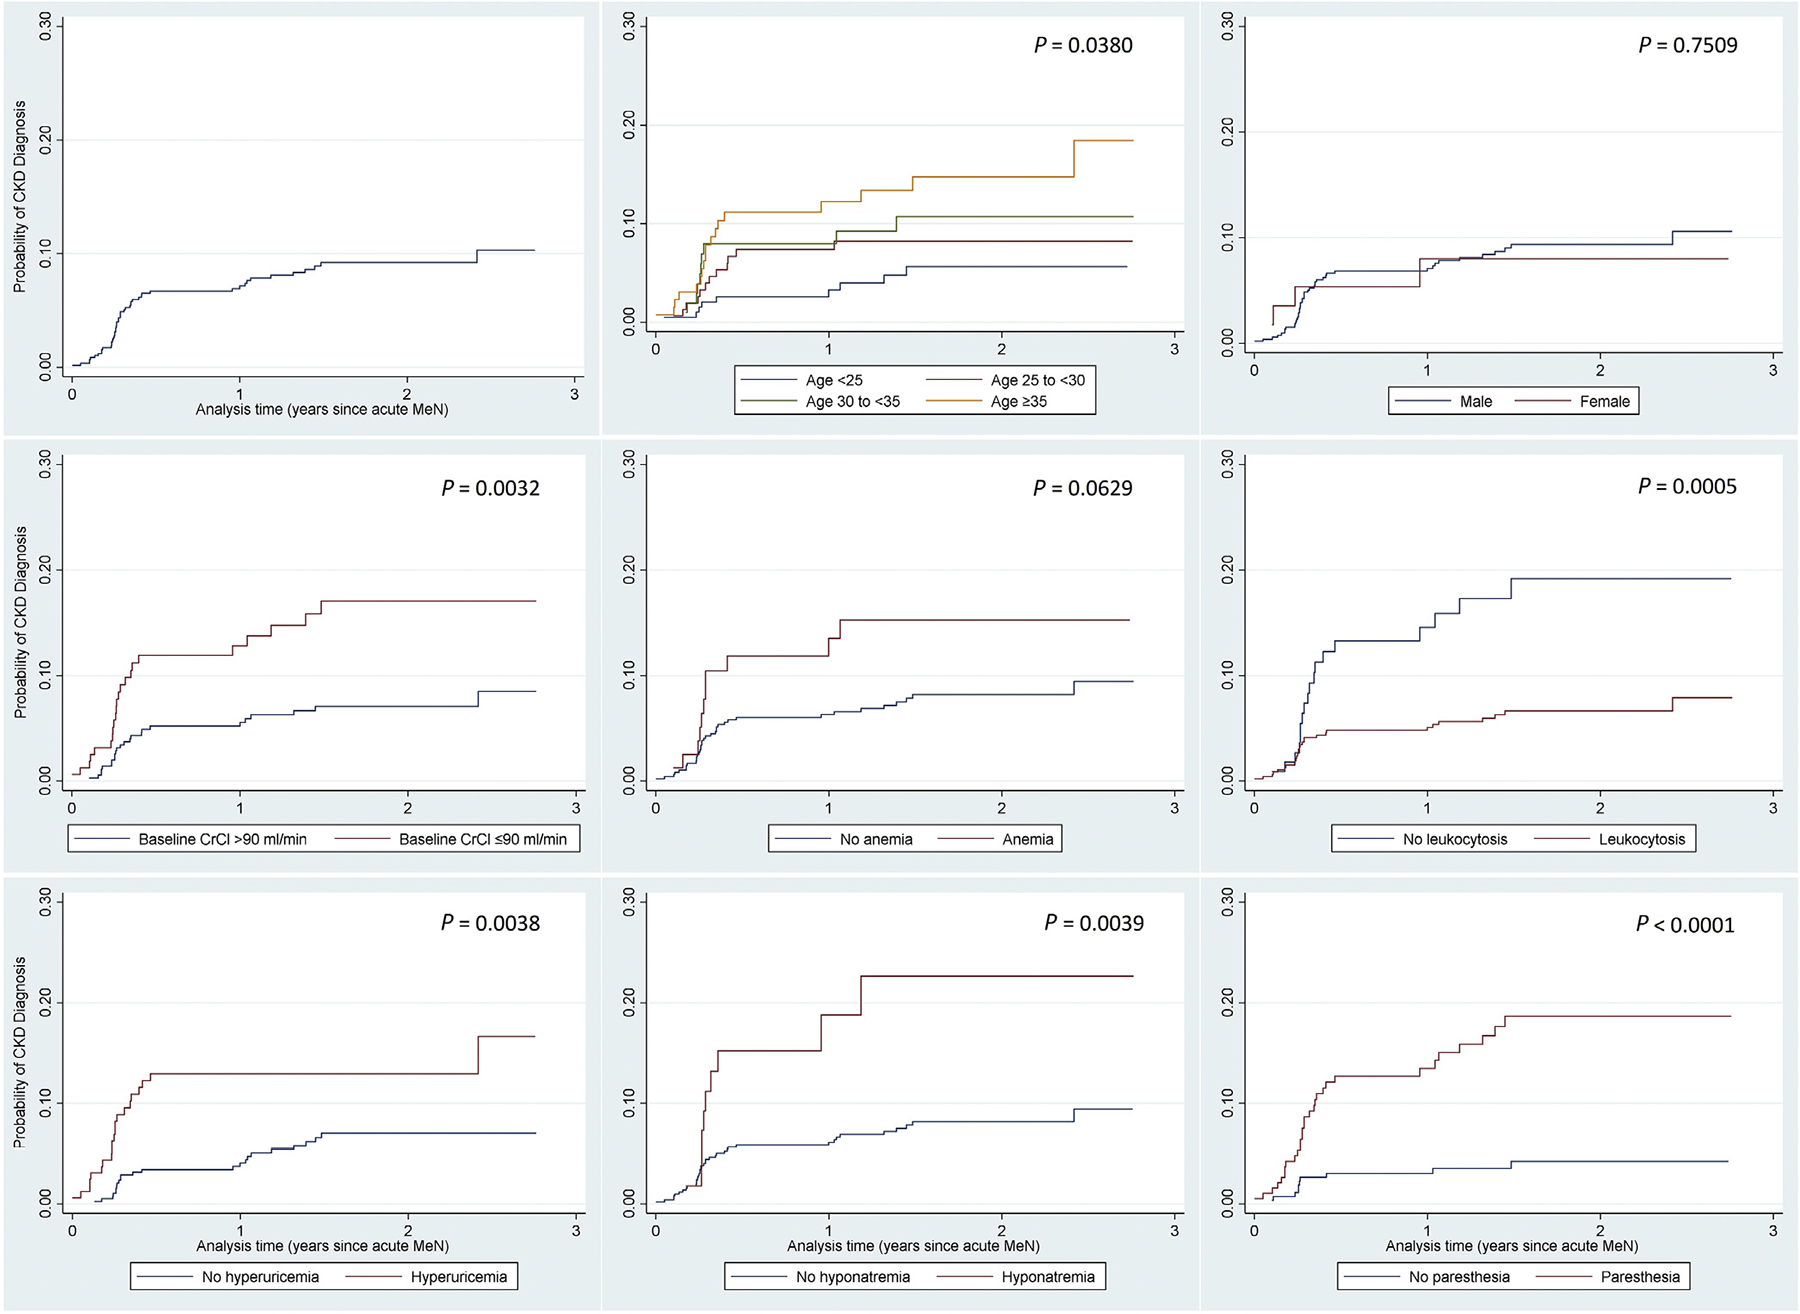
*Unadjusted estimates. CrCl, creatinine clearance.
DISCUSSION
Without a comprehensive understanding of the natural history of MeN, high morbidity and mortality due to untreated or inadequately treated renal disease in Mesoamerica are unlikely to end.21 Based on newly discovered clinical evidence of an acute phase of MeN, after which some patients, but not all, rapidly develop CKD, we sought to determine acute clinical features that can help predict this disease progression.
Acute MeN occurs at a young age, which serves as an important prognosticator. However, even more remarkable is the young age at which patients develop CKD. Almost half of patients were younger than 30 years when diagnosed. AKI and CKD often result in ESRD, but the risk of ESRD is particularly high in young patients, when it can even exceed the already substantial risk of mortality due to low eGFR.23 With extremely limited access to dialysis in most areas impacted by MeN, the heightened ESRD risk in young MeN patients could be the major reason for the excess risk of MeN-related premature mortality across Central America. Tools for the early detection of MeN, identification of patients at highest risk of advanced disease, and clinical management to prevent CKD and death are exceedingly urgent in the current situation.
We documented that 8.4% of individuals with acute MeN developed CKD in this large, high-risk population, although we suspect that this is a conservative estimate, and a more accurate estimate may be 10.8% or greater. These new data also confirm MeN as an extremely rapidly progressing disease from the earliest detectable stage, since most patients in our analysis who developed CKD did so within 6 months of the first clinical signs of MeN. Moreover, failure to recover from the acute episode is a significant concern. Importantly, we herein document a high frequency of MeN-associated AKI and evidence that CKD follows very quickly thereafter in a subset of these cases. Given this new data on the previously unrecognized epidemic of AKI in the region, coinciding with the long-standing epidemic of MeN CKD, the relationship between AKI and CKD in the context of MeN begs further investigation.
Remarkably, over 60% of patients with acute MeN were anemic, a phenomenon we previously observed.18 Malnutrition may be implicated, but even in populations at high risk for anemia in Nicaragua, the prevalence of anemia is only 13% (childbearing-aged women) to 19% (children under 5 years of age).24 Anemia is a known risk factor for AKI, failed renal recovery, CKD progression, and renal-related mortality.25–28 Decreased partial pressure of oxygen in the kidneys and oxidative stress contribute to acute tubular injury, glomerulosclerosis, and chronic tubulointerstitial damage.28,29 Interstitial injury negatively impacts erythropoietin production, suppressing RBC production, a process perhaps underlying the low RBC counts we also observed. Whether our findings reflect severity of acute interstitial injury, its simultaneous occurrence (e.g., hemolysis or bone marrow suppression), or its role in or impact on later progression is unknown. However, given the lifespan of RBCs, anemia likely developed over a substantial period of time prior to acute presentation and may result from insidious inflammation related to chronic or repeated exposure to a toxin or pathogen. Whatever the case, the burden of anemia in our study and its association with CKD implicate it as a critical component of this disease and warrants further investigation.
Curiously, leukocytosis was less overt in patients who went on to develop CKD. This is counterintuitive to the conventional paradigm for CKD progression and surprising, given the high degree of leukocytosis that is characteristic of acute MeN.18 Inflammation surrounding kidney dysfunction is generally thought to be important in disease progression.30,31 Perhaps leukocyte count is not an ideal inflammatory marker, and without data on other markers, our understanding of the inflammatory process in MeN at this juncture remains limited and allows only speculation. Clearly, the role of inflammation in MeN warrants immediate investigation, particularly since immunosuppressive therapy is often used to reduce inflammatory damage in AKI and CKD.
It is not surprising that hyperuricemia preceded CKD, since it impairs renal function through crystal deposition and afferent arteriolar vasoconstriction, as well as through crystal-independent mechanisms involving renin-angiotensin system activation, reduced nitric oxide, and endothelial dysfunction.32–35 Hyperuricemic injury is associated with kidney disease onset and progression. It has been implicated as the underlying mechanism of MeN, and the glomerular ischemia observed in late stage disease could be explained by excess vasoconstriction and renin-angiotensin system activation.36–42 However, tubulointerstitial disease predominates during acute disease, which would reduce uric acid reabsorption, and hyperuricemia is not a primary feature of acute MeN. Further studies should distinguish whether uric acid plays an initial role in MeN or if its, consequently, reduced clearance promotes CKD in acutely hyperuricemic patients. If this is a mechanism at play, the difference between acute and chronic levels could reflect the time lag of progression, in which case, treatment could slow the process; further research is needed to determine the most appropriate therapies.22,43,44
Although electrolyte imbalance has been explored in the context of MeN CKD, hyponatremia is an inconsistent characteristic of late-stage disease.18,45,46 Low sodium levels result from nonosmotic stimuli, usually reduced effective circulating volume, inducing vasopressin release and excess water reabsorption. We are only starting to understand the acute disease process, but without apparent volume overload, the correlation between hyponatremia in acute MeN and later CKD may reflect impaired renal recovery in a setting of transient acute dehydration. The fact that CKD progressors actively rehydrated at symptom onset also suggests a sense of dehydration. However, normal BUN levels but low BUN-creatinine ratios point to decreased proximal tubular reabsorption due to low sodium avidity or early intrinsic injury and make acute dehydration an unlikely principal culprit of MeN. Creatinine phosphokinase levels below what is typical of muscle injury associated with conventional AKI also make rhabdomyolysis an unlikely initial mechanism. Despite these findings, we cannot rule out subclinical injury related to chronic or acute dehydration, either ongoing muscle breakdown or impaired recovery, as contributors to the MeN process.
Although more severe AKI did not predict CKD, renal injury severity is implied by the degree of increase in creatinine from baseline, which in turn impacts the residual functioning renal mass. In our study population, baseline function was often already suboptimal, especially among later CKD cases, and we may have consequently underestimated severity of acute injury. We also could not ascertain the occurrence, number, or severity of prior AKI events in these patients, which could be meaningful in disease progression. Importantly, lower baseline function carries higher ESRD and death risks, especially in young patients, such as those in our cohort.23 Screening for creatinine, which is routine at nearly every medical encounter at our study site and other facilities treating MeN, should be complemented with filtration rate estimation to better understand function. Even so, given their young ages, traditional staging systems may not fully characterize renal function in MeN patients.
Although this study augments what is known about early disease process and rate of progression of MeN, we suspect that there is a higher frequency of subsequent CKD than we measured. It is possible that some unknown CKD cases were misclassified as noncases, namely because of slow disease progression or because they failed to return for care (i.e., sought care elsewhere, not at all, or died in the interim), meaning they would not be captured by our method of surveillance. Similarly, patients with acute MeN who did not seek medical attention (e.g., asymptomatic or mild illness) or sought care elsewhere would not be captured.18 The highly sensitive nature of our surveillance means that we likely captured all-cause AKI events, making it unlikely that that many acute MeN events went undetected. With the documented high burden of MeN CKD in this locale, we suspect the high incidence of AKI we documented in this population is further evidence of the MeN epidemic and that other-cause renal injury is not substantial. The proteinuria observed in some of our patients is uncommon in MeN and may reflect AKI resulting from other mechanisms; other mechanisms could result in slower disease courses but do not underlie disease in the majority of our patients.47 Importantly, no formalized case definition of MeN (neither CKD nor acute MeN) yet exists. This is a major limitation to research into its cause, clinicopathology, and prevention. Even so, all patients with CKD in this analysis had the typical MeN characteristics reported and referenced by others and summarized by the Pan-American Health Organization.48,49 Patients in our study overwhelmingly lacked renal disease risk factors, other than fitting the classic MeN profile. Furthermore, since all diagnostic decisions in our study were made by local clinicians familiar with MeN, we expect to have analyzed primarily correctly classified, true MeN CKD cases.
It is important to note that since we relied on data from case reports and medical records, we analyzed only routinely collected data. MeN surveillance has been ongoing for >2 decades at this site, including routine creatinine measurements, and the engagement of local clinical expertise in recognition of renal injury is a major strength of our study. Still, our surveillance was conducted in a well-characterized and high-risk population, and replication studies in additional settings should be established to confirm these findings. Continued surveillance and longitudinal studies in this population and others will allow greater accuracy in measurement and classification, more precise statistical analysis, and predictive modelling of disease progression. Additional tests (e.g., for markers of inflammation or renal injury) on serially collected samples will lend further insight into the natural history of MeN, its pathologic process, and how AKI severity and recurrence contribute to MeN-associated CKD, ESRD, and death.
We propose that 2 distinct but related processes, perhaps through an interplay of external and intrinsic factors, require discussion: (i) the underlying cause of a heretofore unrecognized epidemic of AKI in the context of MeN, and (ii) what factors drive progression to CKD in some patients with acute MeN, while others experience renal recovery. Answering the former will inform prevention efforts to reduce morbidity, while further understanding the latter will aid targeted, evidence-based management of high-risk patients to reduce mortality.
Conclusions
We herein document, for the first time, clinical markers that can be informative in deciding risk of disease progression in MeN from the earliest renal signs to CKD. Importantly, the disease course is exceedingly rapid, with progression to CKD typically within only 6 months. Specifically, patients in MeN-dense regions are at high risk of developing CKD if they present with elevated creatinine and anemia, particularly if they are 30 years of age or older and experience paresthesia; hyperuricemia and hyponatremia, although less prevalent, are also risk indicators. We also report that a robust immune or inflammatory response may be protective against CKD, rather than promote it. These findings are important clues to the natural history of MeN. Patients with MeN or other CKDu will continue to pose challenges to already resource-constrained health systems, and dialysis and other treatments are not often available in hotspots of MeN. Without effective and low-cost treatments, the high and premature mortality associated with MeN is not likely to abate. Future research should focus on discovering the etiology, designing effective interventions, and defining risk factors for acute and chronic MeN, while also clarifying the role of anemia, systemic inflammation, hyperuricemia, and other clinical events in the pathophysiology of this poorly understood disease. Given the aggressive nature of MeN and the reach of the epidemic, filling these gaps in knowledge are urgent needs and will save lives.
METHODS
Study population and data collection
We initiated prospective surveillance of MeN at a private hospital located at a large, commercial agriculture plantation in the Pacific coastal lowlands of Nicaragua, a region known for its high density of MeN.18 The hospital provides primary health care to all workers at the plantation and their families. For acute MeN surveillance, hospital physicians identify and report all patients presenting to the emergency department with signs of acute renal impairment, locally defined as having elevated serum creatinine (>1.3 mg/dl for male subjects or >1.1 mg/dl for female subjects) or reduced CrCl (<90 ml/min). Physicians record clinical presentation, medical and social history, and demographics, using medical records and structured patient interviews, and the hospital clinical laboratory records diagnostic testing results (hematology, blood chemistry, urinalysis, and any other diagnostics). Patients with acute MeN were those without other attributable or suspected cause of renal impairment. The most recent normal creatinine levels from the medical record or from routine occupational health screenings served as healthy, baseline data.
For CKD surveillance, all patients diagnosed locally as having CKD are recorded, along with date of diagnosis, final serum creatinine level, disease stage, and cause of nephropathy, if known. CKD diagnoses are made according to standard Kidney Disease Improving Global Outcomes (KDIGO) guidelines (see Supplementary Tables S4 and S5). Patients with MeN-attributed CKD were those who lacked any other known cause or risk factor for CKD. Biopsies were not performed in this setting.
Analysis
We present proportions for categorical variables and means (mean ± SD)/medians (median [range]) for continuous variables. For patients presenting with acute kidney impairment on >1 occasion, we analyzed data from only the first episode. For this analysis, CKD surveillance data was linked to acute surveillance data to ascertain progression to CKD: “CKD cases” are those patients diagnosed with CKD by hospital physicians and reported during CKD surveillance, with diagnoses and stages reported as locally assessed. All other patients are considered “non-CKD cases” or “nonprogressors.”
We used the AKIN50 classification system to characterize AKI at acute presentation, treating the most recent normal serum creatinine levels (within the prior year) as healthy baseline levels. Creatinine levels were determined at the hospital clinical laboratory by modified Jaffe assay (Dialab, Wiener Neudorf, Austria), traceable to isotope-dilution mass spectrometry reference methods. Laboratory reference ranges, specified in the tables, were set according to individual assay specifications, and if reference ranges were not applicable, standard cutoffs were applied.
We estimated renal filtration rates from serum creatinine levels using the Cockcroft-Gault equation51 for CrCl, the method employed at our study site, and the Chronic Kidney Disease Epidemiology (CKD-EPI) Collaboration (2009)52 and the Modification of Diet in Renal Disease (MDRD) Study Group (2006)53,54 equations for eGFR.
In this cross-sectional analysis to determine acute-phase characteristics associated with later CKD, we conducted univariate analyses with χ2 P value or Fisher exact P value (for categorical data) and P value from Student t-test (for means) or quartile regression (for medians). We conducted survival analysis by Cox regression to analyze the rate of progression to CKD. To distinguish features of patients who developed CKD from those who did not, we report age- and sex-adjusted PRs (by Poisson regression) and HRs with 95% CI (PR or HR [95% CI]), with robust variance estimation, on variables of interest or with univariate P value <0.20.55,56 Statistical procedures were performed in Stata SE 15 (StataCorp LP, College Station, TX).
Supplementary Material
Table S1. Local criteria for diagnosis of chronic kidney disease (CKD).
Table S2. Local Spanish language terms and their English interpretations for this analysis.
Table S3. Characteristics of study population (N = 586).
Table S4. Supplemental laboratory findings—blood chemistry and hematology.
Table S5. Supplemental laboratory findings—urine analysis.
ACKNOWLEDGMENTS
We would like to thank the medical, technical, and administrative staff at the Hospital Alfredo Pellas Chamoro and the Gerencia de Salud Ocupacional at Ingenio San Antonio, specifically Dra. Lesbia Palma, Dra. Rosa Argentina Cano, Lic. Ruth Montenegro, and Lic. Jeissel Perez Lopez. This study was partly funded by a grant from El Comité Nacional de Productores de Azúcar de Nicaragua.
DISCLOSURE
DC and FG are employed by Nicaragua Sugar Estates, Ltd., the owner of the hospital that is our study site. KM serves on a Scientific Advisory Board for research to solve the mystery of MeN in Nicaragua Sugar Estates workers. The other authors declared no competing interests.
This study was partly funded by a grant from El Comité Nacional de Productores de Azúcar de Nicaragua. Neither the funding foundation nor owners or administrators of Nicaragua Sugar Estates had a role in study concept, design, data collection, analysis, or interpretation; nor did they aid in or influence preparation of this report, its contents, or the decision to publish.
Footnotes
ETHICAL CONSIDERATIONS
This study was approved by the Nicaragua Ministry of Health, Baylor College of Medicine Institutional Review Board (H-36498), and the Medical Director of Hospital Alfredo Pellas Chamorro.
SUPPLEMENTARY MATERIAL
Supplementary material is linked to the online version of that paper at www.kidney-international.org.
REFERENCES
- 1.Trabanino RG, Aguilar R, Silva CR, et al. Nefropatía terminal en pacientes de un hospital de referencia en El Salvador [End-stage renal disease among patients in a referral hospital in El Salvador]. Rev Panam Salud Pública. 2002;12:202–206 [in Spanish]. [DOI] [PubMed] [Google Scholar]
- 2.Ramirez-Rubio O, McClean MD, Amador JJ, Brooks DR. An epidemic of chronic kidney disease in Central America: an overview. J Epidemiol Community Health. 2012;67:1–3. [DOI] [PubMed] [Google Scholar]
- 3.Ordunez P, Nieto FJ, Martinez R, et al. Chronic kidney disease mortality trends in selected Central America countries, 1997–2013: clues to an epidemic of chronic interstitial nephritis of agricultural communities. J Epidemiol Community Health. 2018;72:280–286. [DOI] [PubMed] [Google Scholar]
- 4.Cuadra S, Hogstedt C, Jakobsson K, et al. Chronic Kidney Disease: Assessment of Current Knowledge and Feasibility for Regional Research Collaboration in Central America. Heredia, Costa Rica: SALTRA, IRET-UNA; 2006. [Google Scholar]
- 5.García-Trabanino R, Trujillo Z, Colorado AV, et al. Prevalencia de pacientes con tratamiento sustitutivo renal en El Salvador en 2014 [Prevalence of patients receiving renal replacement therapy in El Salvador in 2014]. Nefrología. 2016;36:631–636 [in English and Spanish]. [DOI] [PubMed] [Google Scholar]
- 6.Orantes CM, Herrera R, Almaguer M, et al. Chronic kidney disease and associated risk factors in the Bajo Lempa region of El Salvador: Nefrolempa study, 2009. MEDICC Rev. 2011;13:14–22. [DOI] [PubMed] [Google Scholar]
- 7.Central American Institute for Studies on Toxic Substances (IRET-UNA) and Program on Work Environment and Health in Central America in CA (SALTRA). Report from the First International Research Workshop on Mesoamerican Nephropathy (MeN). In: Wesseling C, Crowe J, Hogstedt C, et al. , eds. Title. San Jose, Costa Rica: SALTRA; 2013. [Google Scholar]
- 8.Central American Institute for Studies on Toxic Substances (IRET-UNA) and Program on Work E and H in CA (SALTRA). Report from the Second International Research Workshop on Mesoamerican Nephropathy (MeN). In: Wegman DH, Crowe J, Hogstedt C, et al. , eds. Title. San Jose, Costa Rica: SALTRA; 2016:pp. [Google Scholar]
- 9.Wesseling C, van Wendel de Joode B, Crowe J, et al. Mesoamerican nephropathy: geographical distribution and time trends of chronic kidney disease mortality between 1970 and 2012 in Costa Rica. Occup Environ Med. 2015;72:714–721. [DOI] [PubMed] [Google Scholar]
- 10.Laux TS, Barnoya J, Guerrero DR, Rothstein M. Dialysis enrollment patterns in Guatemala: evidence of the chronic kidney disease of nontraditional causes epidemic in Mesoamerica. BMC Nephrol. 2015;16:54. [DOI] [PMC free article] [PubMed] [Google Scholar]
- 11.Cerdas M Chronic kidney disease in Costa Rica. Kidney Int. 2005;68:31–33. [DOI] [PubMed] [Google Scholar]
- 12.Torres C, Aragón A, González M, et al. Decreased kidney function of unknown cause in Nicaragua: a community-based survey. Am J Kidney Dis. 2010;55:485–496. [DOI] [PubMed] [Google Scholar]
- 13.O’Donnell JK, Tobey M, Weiner DE, et al. Prevalence of and risk factors for chronic kidney disease in rural Nicaragua. Nephrol Dial Transplant. 2011;26:2798–2805. [DOI] [PMC free article] [PubMed] [Google Scholar]
- 14.Correa-Rotter R, Wesseling C, Johnson RJ. CKD of unknown origin in Central America: the case for a Mesoamerican nephropathy. Am J Kidney Dis. 2014;63:506–520. [DOI] [PMC free article] [PubMed] [Google Scholar]
- 15.PanAmerican Health Organization. Chronic kidney diseases (N18): renal failure (N17-N19) mortality, countries of the Americas. Available at: http://ais.paho.org/phip/viz/nmh_renalfailure_ckd_visualization.asp. Accessed November 17, 2017.
- 16.Orantes CM, Herrera R, Almaguer M, et al. Epidemiology of chronic kidney disease in adults of Salvadoran agricultural communities. MEDICC Rev. 2014;16:23–30. [DOI] [PubMed] [Google Scholar]
- 17.Weiner DE, McClean MD, Kaufman JS, Books DR. The Central American epidemic of CKD. Clin J Am Soc Nephrol. 2013;8:504–511. [DOI] [PubMed] [Google Scholar]
- 18.Fischer RSB, Mandayam S, Chavarria D, et al. Clinical evidence of acute Mesoamerican nephropathy. Am J Trop Med Hyg. 2017;97:124–1256. [DOI] [PMC free article] [PubMed] [Google Scholar]
- 19.Ponce D, Balbi A. Acute kidney injury: risk factors and management challenges in developing countries. Int J Nephrol Renovasc Dis. 2016;9:193–200. [DOI] [PMC free article] [PubMed] [Google Scholar]
- 20.Pecoits-Filho R, Rosa-Diez G, Gonzalez-Bedat M, et al. Renal replacement therapy in CKD: an update from the Latin American Registry of Dialysis and Transplantation. J Bras Nefrol. 2015;37:9–13. [DOI] [PubMed] [Google Scholar]
- 21.Remuzzi G, Perico N. International Society of Nephrology’s perspective on the emergence of chronic kidney diseases of unknown/undetermined etiology. MEDICC Rev. 2014;16:75–76. [DOI] [PubMed] [Google Scholar]
- 22.Fischer RSB, Vangala C, Truong L, et al. Early detection of acute tubulointerstitial nephritis in the genesis of Mesoamerican nephropathy. Kidney Int. 2018;93:681–690. [DOI] [PubMed] [Google Scholar]
- 23.O’Hare AM, Choi AI, Bertenthal D, et al. Age affects outcomes in chronic kidney disease. J Am Soc Nephrol. 2007;18:2758–2765. [DOI] [PubMed] [Google Scholar]
- 24.World Health Organization. The Global Prevalence of Anaemia in 2011. Geneva, Switzerland; 2011. [Google Scholar]
- 25.Han SS, Baek SH, Ahn SY, et al. Anemia is a risk factor for acute kidney injury and long-term mortality in critically ill patients. Tohoku J Exp Med. 2015;237:287–295. [DOI] [PubMed] [Google Scholar]
- 26.Hu SL, Said FR, Epstein D, et al. The impact of anemia on renal recovery and survival in acute kidney injury. Clin Nephrol. 2013;79:221–228. [DOI] [PubMed] [Google Scholar]
- 27.Iseki K, Ikemiya Y, Iseki C, Takishita A. Haematocrit and the risk of developing end-stage renal disease. Nephrol Dial Transplant. 2003;18: 899–905. [DOI] [PubMed] [Google Scholar]
- 28.Rossert J, Froissart M. Role of anemia in progression of chronic kidney disease. Semin Nephrol. 2006;26:283–289. [DOI] [PubMed] [Google Scholar]
- 29.Brezis M, Heyman SN, Dinour D, et al. Role of nitric oxide in renal medullary oxygenation: studies in isolated and intact rat kidneys. J Clin Invest. 1991;88:390–395. [DOI] [PMC free article] [PubMed] [Google Scholar]
- 30.Tonelli M, Sacks F, Pfeffer M, et al. , for the CARE Trial Investigators. Biomarkers of inflammation and progression of chronic kidney disease. Kidney Int. 2005;68:237–245. [DOI] [PubMed] [Google Scholar]
- 31.Amdur RL, Feldman HI, Gupta J, et al. , for the CRIC Study Investigators. Inflammation and progression of CKD: the CRIC study. Clin J Am Soc Nephrol. 2016;11:1546–1556. [DOI] [PMC free article] [PubMed] [Google Scholar]
- 32.Mazzali M, Hughes J, Kim YG, et al. Elevated uric acid increases blood pressure in the rat by a novel crystal-independent mechanism. Hypertension. 2001;38:1101–1106. [DOI] [PubMed] [Google Scholar]
- 33.Nakagawa T, Mazzali M, Kang DH, et al. Hyperuricemia causes glomerular hypertrophy in the rat. Am J Nephrol. 2003;23:2–7. [DOI] [PubMed] [Google Scholar]
- 34.Perlstein TS, Gumieniak O, Hopkins PN, et al. Uric acid and the state of the intrarenal renin-angiotensin system in humans. Kidney Int. 2004;66: 1465–1470. [DOI] [PubMed] [Google Scholar]
- 35.Zharikov S, Krotova K, Hu H, et al. Uric acid decreases NO production and increases arginase activity in cultured pulmonary artery endothelial cells. Am J Physiol Cell Physiol. 2008;295:C1183–C1190. [DOI] [PMC free article] [PubMed] [Google Scholar]
- 36.Wijkström J, Leiva R, Elinder CG, et al. Clinical and pathological characterization of Mesoamerican nephropathy: a new kidney disease in Central America. Am J Kidney Dis. 2013;62:908–918. [DOI] [PubMed] [Google Scholar]
- 37.Wijkström J, González-Quiroz M, Hernandez M, et al. Renal morphology, clinical findings, and progression rate in Mesoamerican nephropathy. Am J Kidney Dis. 2017;69:626–636. [DOI] [PubMed] [Google Scholar]
- 38.Weiner DE, Tighiouart H, Elsayed EF, et al. Uric acid and incident kidney disease in the community. J Am Soc Nephrol. 2008;19:1204–1211. [DOI] [PMC free article] [PubMed] [Google Scholar]
- 39.Chonchol M, Shlipak MG, Katz R, et al. Relationship of uric acid with progression of kidney disease. Am J Kidney Dis. 2007;50:239–247. [DOI] [PubMed] [Google Scholar]
- 40.Obermayr RP, Temml C, Gutjahr G, et al. Elevated uric acid increases the risk for kidney disease. J Am Soc Nephrol. 2008;19:2407–2413. [DOI] [PMC free article] [PubMed] [Google Scholar]
- 41.Wesseling C, Aragón A, González M, et al. Heat stress, hydration and uric acid: a cross-sectional study in workers of three occupations in a hotspot of Mesoamerican nephropathy in Nicaragua. BMJ Open. 2016;6:e011034. [DOI] [PMC free article] [PubMed] [Google Scholar]
- 42.Roncal-Jimenez C, García-Trabanino R, Barregard L, et al. Heat stress nephropathy from exercise-induced uric acid crystalluria: a perspective on Mesoamerican nephropathy. Am J Kidney Dis. 2015;67:20–30. [DOI] [PubMed] [Google Scholar]
- 43.Goicoechea M, Garcia De Vinuesa S, Verdalles U, et al. Allopurinol and progression of CKD and cardiovascular events: long-term follow-up of a randomized clinical trial. Am J Kidney Dis. 2015;65:543–549. [DOI] [PubMed] [Google Scholar]
- 44.Goicoechea M, de Vinuesa SG, Verdalles U, et al. Effect of allopurinol in chronic kidney disease progression and cardiovascular risk. Clin J Am Soc Nephrol. 2010;5:1388–1393. [DOI] [PMC free article] [PubMed] [Google Scholar]
- 45.Kupferman J, Amador JJ, Lynch KE, et al. Characterization of Mesoamerican nephropathy in a kidney failure hotspot in Nicaragua. Am J. Kidney Dis 2016:68716–68725. [DOI] [PubMed] [Google Scholar]
- 46.Herrera R, Orantes C, Almaguer M, et al. Clinical characteristics of chronic kidney disease of nontraditional causes in Salvadoran farming communities. MEDICC Rev. 2014;16:39–48. [DOI] [PubMed] [Google Scholar]
- 47.Keane WF, Eknoyan G. Proteinuria, albuminuria, risk, assessment, detection, elimination (PARADE): a position paper of the National Kidney Foundation. Am J Kidney Dis. 1999;33:1004–1010. [DOI] [PubMed] [Google Scholar]
- 48.Lozier M, Turcios-Ruiz RM, Noonan G, Ordunez P. Chronic kidney disease of nontraditional etiology in Central America: a provisional epidemiologic case definition for surveillance and epidemiologic studies. Rev Panam Salud Publica. 2016;40:294–300. [PMC free article] [PubMed] [Google Scholar]
- 49.Ferreiro A, Álvarez-Estévez G, Cerdas-Calderón M, et al. Confirmed clinical case of chronic kidney disease of nontraditional causes in agricultural communities in Central America: a case definition for surveillance. Rev Panam Salud Publica. 2016;40:301–308. [PubMed] [Google Scholar]
- 50.Mehta RL, Kellum JA, Shah SV, et al. Acute Kidney Injury Network: report of an initiative to improve outcomes in acute kidney injury. Crit Care. 2007;11:R31. [DOI] [PMC free article] [PubMed] [Google Scholar]
- 51.Cockcroft DW, Gault MH. Prediction of creatinine clearance from serum creatinine. Nephron. 1976;16:31–41. [DOI] [PubMed] [Google Scholar]
- 52.Levey AS, Stevens LA, Schmid CH, et al. , for the CKD-EPI Collaboration. A new equation to estimate glomerular filtration rate. Ann Intern Med. 2009;150:604–612. [DOI] [PMC free article] [PubMed] [Google Scholar]
- 53.Levey AS, Bosch JP, Lewis JB, et al. , for the Modification of Diet in Renal Disease Study Group. A more accurate method to estimate glomerular filtration rate from serum creatinine: a new prediction equation. Ann Intern Med. 1999;130:461–470. [DOI] [PubMed] [Google Scholar]
- 54.Levey AS, Coresh J, Greene T, et al. , for the CKD-EPI Collaboration. Using standardized serum creatinine values in the Modification of Diet in Renal Disease study equation for estimating glomerular filtration rate. Ann Intern Med. 2006;145:247–254. [DOI] [PubMed] [Google Scholar]
- 55.Barros AJ, Hirakata VN. Alternatives for logistic regression in cross-sectional studies: an empirical comparison of models that directly estimate the prevalence ratio. BMC Med Res Methodol. 2003;3:21. [DOI] [PMC free article] [PubMed] [Google Scholar]
- 56.Coutinho LMS, Scazufca M, Menezes PR. Methods for estimating prevalence ratios in cross-sectional studies. Rev Saude Publica. 2008;42: 992–998. [PubMed] [Google Scholar]
Associated Data
This section collects any data citations, data availability statements, or supplementary materials included in this article.
Supplementary Materials
Table S1. Local criteria for diagnosis of chronic kidney disease (CKD).
Table S2. Local Spanish language terms and their English interpretations for this analysis.
Table S3. Characteristics of study population (N = 586).
Table S4. Supplemental laboratory findings—blood chemistry and hematology.
Table S5. Supplemental laboratory findings—urine analysis.