

Abstract
Introduction
Sex‐dependent risk factors may underlie sex differences in Alzheimer's disease (AD).
Methods
Using sex‐stratified genome‐wide association studies (GWAS) of AD, we evaluated associations of 12 traits with AD through polygenic risk scores (PRS) and Mendelian randomization (MR), and explored joint genetic architecture among significant traits by genomic structural equation modeling and network analysis.
Results
AD was associated with lower PRS for premorbid cognitive performance, intelligence, and educational attainment. MR showed a causal role for the cognition‐related traits in AD, particularly among females. Their joint genetic components encompassed RNA processing, neuron projection development, and cell cycle pathways that overlap with cellular senescence. Cholesterol and C‐reactive protein showed pleiotropy but no causality with AD.
Discussion
Lower cognitive reserve is causally related to AD. The stronger causal link between cognitive performance and AD in females, despite similar PRS between sexes, suggest these differences may result from gene–environmental interactions accumulated over the lifespan.
Keywords: Alzheimer's disease, causality, cognitive performance, cognitive reserve, educational attainment, genomic structural equation modeling, intelligence, Mendelian randomization, network analysis, polygenic risk score, sex differences
1. INTRODUCTION
Late‐onset Alzheimer's disease (AD) is a neurodegenerative disorder with high genetic heritability. 1 A growing literature demonstrates sex differences in multiple aspects of AD, including clinical manifestation, neuroimaging changes, biomarker levels, effects of apolipoprotein E (APOE), and other risk factors. 2 As a complex polygenic disease, AD etiology reflects combined effects of multiple risk and protective factors, many of which may differ between sexes. 3 Recent evidence on AD genetic architecture suggests sex‐related variation in the effects of genes along the APOE and neurotrophic signaling pathways in AD. 3 Although several sex‐specific genomic loci were reported, more studies focused on genome‐wide analysis on sex differences are needed. 3
We applied a three‐pronged approach to investigate the genetic underpinnings of AD in the context of sex differences, including through genetic correlation, causality, and joint genetic architecture of traits found to be causally linked to AD.
In our genetic correlation analyses, we examined AD associations of polygenic risk scores (PRS) for 12 selected traits that represent various aspects of AD etiology, and examined sex differences in those associations. Because the nature of any observed associations is unclear, which may reflect pleiotropy, consequences of disease, or confounding, we next performed Mendelian randomization (MR). MR estimates the causal effect of an exposure on an outcome using genetic variants as instruments, akin to randomized controlled trials. MR analysis has been applied to examine causal effects of metabolic, vascular, inflammatory, and neurocognitive traits on AD. 4 , 5 , 6 Here, we extended this MR approach to the above factors using sex‐stratified genome‐wide association studies (GWAS). 7
Finally, we explored the biological pathways through which the identified causal traits may influence AD risk. We applied genomic structural equation modelling (SEM) to extract a common genetic latent factor among the identified traits, and hierarchical network analysis to elucidate the framework of the common biological pathways.
2. METHODS
2.1. Samples
The two‐phase ADGC (Alzheimer's Disease Genetics Consortium) data were used for sex‐stratified GWAS and calculation of AD polygenic risk scores. The data include a total of 24,186 participants of European ancestry in 26 cohorts. The institutional review boards of all participating institutions approved the procedures for all ADGC substudies. Written informed consent was obtained from all participants or surrogates. Additional details of the ADGC datasets can be found in previous publications. 8 , 9
Research in Context
Systemic review: We reviewed recent literature and evidence of genetic architecture underlying phenotypic sex differences in Alzheimer's disease (AD).
Interpretation: Results of this study support protective effects of educational attainment, premorbid intelligence, and premorbid cognitive performance on AD risk, particularly in females. Functional enrichment analysis suggested multiple mechanisms including RNA processing, neuron projection development, and cell cycle pathways that overlap with cellular senescence pathways that may underlie these effects.
Future directions: Sex‐stratified AD genome‐wide association studies with large sample sizes and bidirectional Mendelian randomization analyses with adequate statistical power on a broader set of AD‐related traits are needed to verify our findings, to elucidate more of the genetic contributors to AD, and to identify sex differences in genetic risk factors, as well as the interactions among risk factors.
Published GWAS summary statistics from previously published papers and UK Biobank data (http://www.ukbiobank.ac.uk) were used to calculate polygenic risk scores for the 12 AD‐related traits (Table S1 in supporting information).
2.2. Exploratory sex‐stratified AD GWAS
We previously performed sex‐stratified GWAS of 38,043,163 single nucleotide polymorphisms (SNPs) in 8682 males (4010 AD cases and 4672 controls) and 12,772 females (5705 cases and 7067 controls) from both phases of ADGC, using logistic regressions implemented in PLINK 1.9 (supporting information). 7 As unequal sample sizes between sexes leads to discrepancy in power and might bias sex difference findings, a female subcohort with matched numbers of cases and controls as the male cohort was generated by random sampling. Summary statistics of these sex‐stratified GWAS were used for MR.
2.3. AD‐related traits
We selected 12 AD‐related traits reflecting different aspects of AD etiology, based on literature review 10 and the availability of GWAS summary statistics. These traits include comorbidities (total cholesterol [TC], 11 type 2 diabetes [T2D], 12 blood pressure, 13 body mass index [BMI], 14 and inflammation [C‐reactive protein (CRP)] 15 ), psychosocial factors (educational attainment [EA], 16 premorbid intelligence [INT], 17 premorbid cognitive performance [COG], 18 and overall subjective well‐being [SWB] 19 ), and neuroimaging features (hippocampal volume, susceptibility‐weighted T1 imaging [SWI] linked to age‐related iron deposition in the brain; Table S1).
The GWAS summary statistics of these traits underwent quality control steps (supporting information) and were used for PRS calculation, MR, and genomic SEM. We flipped alleles when necessary to ensure that positive effect sizes for each SNP related to greater likelihood of possessing the trait for ease of interpretation for PRS analyses.
2.4. Polygenic risk scores
Using the GWAS statistics of AD‐related traits and the ADGC samples, we generated PRS of each trait using a Bayesian regression approach and continuous shrinkage priors, PRS‐CS, with the default parameters (supporting information). 20
Linear mixed effects (LME) modeling was performed with the standardized trait PRS (z‐score) as the dependent variable; diagnosis of AD, sex, a sex x AD interaction term, age at disease onset (or at data collection for the control group), and the top 10 genetic principal components (PCs) as independent variables, and cohort indicators as random effects. Effect sizes (Cohen's d) of the PRS from each trait were calculated from the LME results by the lme.dscore function of EMAtools (version 0.1.3) package for R, and compared between AD and control groups.
The effective number of independent traits (te ) was determined as 11 by Matrix Spectral Deposition (matSpD). 21 Significance was defined as P‐value < 4.55×10⁻³, derived by dividing alpha (0.05) by te using Bonferroni correction.
2.5. Mendelian randomization
We performed generalized summary‐based MR (GSMR) 22 to evaluate causal effects of the 12 traits on AD, using statistics from the sex‐stratified GWAS of AD and from the GWAS of each trait. Linkage disequilibrium‐independent (r 2 < 0.05, 1Mb) significant SNPs (P < 5×10⁻⁸, except for SWI and SWB where P < 1×10⁻⁵ due to insufficient number of SNPs after clumping) were included as candidate instrumental variables. The results were validated by alternative MR methods, including the inverse‐variance weighted (IVW) estimator and MR‐Egger regression implemented in radial MR and MR‐PRESSO test.
Significance was defined as P‐value < 4.55×10⁻³ as described above. MR power was evaluated and is shown in Table S2 in supporting information. Although our sex‐stratified AD GWAS lacked statistical power for gene discovery, 7 they had adequate MR power (≥ 70%) for 8 of the 12 traits (Table S2). We repeated the analysis on the female subcohort that matched the male sample size to evaluate whether findings of sex difference were due to the power discrepancy.
2.6. Genomic SEM, gene mapping, and network analysis
The joint genetic architecture of the traits found to be causally related to AD in the MR analyses was studied under a common factor model by genomic SEM, using their GWAS statistics. 23 Genome‐wide SNPs significantly associated with the common factor were mapped to genes by FUMA v1.3.6a using positional, expression quantitative trait loci, and chromatin interaction mapping, and by MAGMA v1.08 implemented in FUMA (Table S8‐9 in supporting information). FUMA‐mapped genes were further annotated by the GENE2FUNC procedure in FUMA (Table S10 in supporting information). 24 We also mapped significant SNPs to genes from each original GWAS of these three traits using the same strategies in FUMA.
To investigate the common biological pathways underlying the putative causal traits, we built a hierarchical map of systems, integrating the FUMA‐mapped genes of the common factor from the genomic SEM results, with the STRING high‐confidence interactome. Clusters of densely interconnected genes were identified by the HiDeF algorithm of Community Detection Application and Service (CDAPS) in Cytoscape, and labeled according to functional enrichment by gProfiler in CDAPS. 25 We also compared the proportion of overlapping FUMA‐mapped genes between each cluster and trait.
3. RESULTS
3.1. PRS for case‐control comparison and sex differences in AD
Significant effect sizes were observed with lower PRS for EA (d = –0.071, P = 3.21×10⁻⁸), INT (d = –0.088, P = 7.97×10⁻¹²), COG (d = –0.062, P = 1.33×10⁻⁶), and CRP (d = –0.156, P = 1.38×10⁻³³), and higher PRS for TC (d = 0.184, P = 3.59×10–46) in AD patients (Figure 1A). Associations of TC and CRP with AD likely reflect pleiotropy within the APOE region because effects were no longer significant after excluding this region (TC: d = 0.027, P = .037; CRP: d = 0.023, P = .079). In contrast, effects remained significant for EA (d = –0.072, P = 2.23×10⁻⁸), INT (d = –0.090, P = 2.68×10⁻¹²), and COG (d = –0.063, P = 1.13×10⁻⁶; Figure S1 in supporting information).
FIGURE 1.
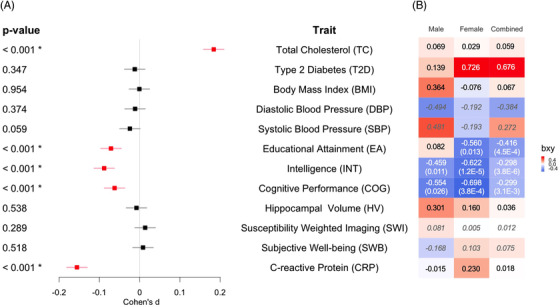
Associations and causal effects of 12 traits and AD. A, Cohen's d of trait PRS between cases and controls. Bonferroni‐corrected significant (regression coefficient P < 4.55×10⁻³) traits are labeled with asterisks and highlighted in red. B, Standardized estimated causal effects (bxy) from GSMR based on sex‐stratified and combined AD GWAS. Traits with significant (P < 4.55×10⁻³) or nominal (P < .05) causality consistent across radial MR (IVW and MR‐Egger) and MR‐PRESSO after correction for outliers are labeled with P‐values from GSMR in parentheses. bxy values of four traits with underpowered analyses are in italics (DBP, SBP, SWI, and SWB). AD, Alzheimer's disease; GSMR, generalized summary‐based Mendelian randomization; GWAS, genome‐wide association studies; IVW, inverse‐variance weighted; MR, Mendelian randomization; PRS, polygenic risk scores
We did not observe a significant AD‐by‐sex interaction in the LME model with or without the APOE region (Figure S2‐3 in supporting information), using PRS calculated from combined or sex‐stratified GWAS (Figure S4 in supporting information), suggesting no significant sex differences in PRS for these traits.
Because most existing GWAS use sex‐combined samples, we repeated the above analyses on two available sex‐stratified GWAS of two phenotypes (BMI 26 and EA 16 ) as a sensitivity analysis, to test if results differ between using PRS derived from sex‐combined or sex‐stratified GWAS. The results for these two tested traits remained the same, suggesting that our finding of no significant sex differences in PRS may not be primarily due to using sex‐combined GWAS to derive PRS (Table S1).
3.2. MR for causal effects of AD‐related traits on AD
After correction for outliers, significant causal effects on AD were seen for low EA (bxy = –0.416, P = 4.52×10⁻⁴), INT (bxy = –0.298, P = 3.78×10⁻⁶), and COG (bxy = –0.299, P = 3.08×10⁻³), in the sex‐combined AD GWAS (Figure 1B, Table S3 in supporting information). In the sex‐stratified AD GWAS, significant causal effects of low INT and COG on AD were observed in females (INT: bxy = –0.622, P = 1.22×10⁻⁵; COG: bxy = –0.698, P = 3.83×10⁻⁴), with nominal effects in males (INT: bxy = –0.459, P = .011; COG: bxy = –0.554, P = .026). A nominal causal effect of low EA on AD was seen in females (bxy = –0.560, P = .013) but not in males (bxy = 0.082, P = .775; Figure 1B).
Causal effects of COG (bxy = –0.676, P = 4.52×10⁻³) were observed in the female subcohort, which had matched sample size to the male cohort (Table S3), implying that the sex difference in this trait was not due to power discrepancy. In contrast, causal effects of INT were reduced to nominal significance in the female subcohort (P = .008), as in the male sample.
Outlier SNPs identified in GSMR and verified by radial MR or MR‐PRESSO were reported and likely contribute to horizontal pleiotropy (Table S5 in supporting information). Significant horizontal pleiotropy was seen in TC, BMI, SWB, and CRP on AD with the identified outlier SNPs showing close association with the APOE region, lipid metabolism, or T2D (Table S5). Horizontal pleiotropy occurs when a genetic variant affects the outcome variable through pathways other than or in addition to the exposure variable. 27
3.3. Genomic SEM, gene mapping, and network analysis
Because the MR analyses identified significant causal effects of EA, INT, and COG on AD, we evaluated the common and unique genetic bases of EA, INT, and COG. We observed high correlation among the three traits under a common factor model (Figure 2A) with excellent model fit (confirmatory fit index = 1, standardized root mean squared residual = 4.5×10⁻¹¹). Based on estimated effects of individual SNPs in the common factor model (Figure S5 in supporting information), 651 genome‐wide significant (P < 2.7×10⁻⁶) protein‐coding genes were annotated by MAGMA (Figure 2B), and 1557 genes including non‐coding RNA and pseudogenes by FUMA (Table S8). These genes are involved in biological processes such as RNA processing, neuron projection development, and mitotic cell cycle pathways that overlap with cellular senescence (e.g., PBRM1, NEK4, FOXO3, CDK2AP1; Figure 2C, S6 in supporting information). The proportion of overlapping FUMA‐mapped genes between the common factor and individual trait are shown in pie charts (Figure 2C).
FIGURE 2.
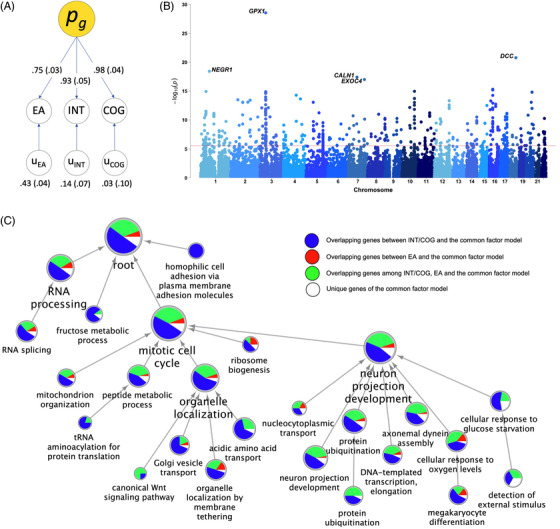
Genomic structural equation modelling, gene mapping, and network analysis on educational attainment (EA), premorbid intelligence (INT), and premorbid cognitive performance (COG). A, Path diagram of common factor model. Values denote standardized estimates with standard errors in parentheses. B, Manhattan plot of MAGMA‐annotated genes based on effects of individual single nucleotide polymorphisms associated with the common factor. The red line denotes genome‐wide significance (2.7×10⁻⁶). C, Hierarchical network of enriched biological processes based on FUMA‐annotated 818 protein‐coding genes in the common factor model as well as 454 genes of EA, 901 of INT, and 869 of COG. Proportion of overlapping genes between the common factor and individual trait are shown in pie charts
4. DISCUSSION
This investigation of genetic associations of AD‐related traits showed that lower PRS for CRP and cognition‐related factors (EA, INT, and COG), and higher PRS for TC were significantly associated with AD for both males and females. MR analysis indicated that low EA, INT, and COG were causally associated with AD, with suggestion of stronger effects among females than males. Shared genetic components among cognition‐related traits were identified with annotated hierarchical pathways.
Consistent with published observational and MR studies, 4 , 5 , 6 , 28 our PRS and MR results demonstrate protective effects of three cognition‐related traits against AD (Figure 1B). Both EA and INT are recognized contributors to cognitive reserve, while COG is a direct reflection of cognitive reserve. 28 The observed protective effects of these three traits are consistent with the cognitive reserve hypothesis, which states that higher cognitive reserve protects against the clinical manifestation of AD pathology. 29
Although EA, INT, and COG have been consistently associated with lower risk of AD, pathways through which they are linked to AD remain underexplored. The association between low cognitive reserve and dementia likely involves multiple mechanisms including genetic effects related to low intelligence, inefficient brain metabolism and function, increased mutation load and oxidative stress, and increased exposure to environmental risk factors. 29 Our analyses of the joint genetic architecture among EA, INT, and COG, which revealed a common latent factor underlying these highly interconnected traits, support the above proposed mechanisms. The top annotated genes associated with the common factor (Figure 2B) encompass oxidative stress response (GPX1), neuron development (NEGR1, DCC), and exocytosis (CALN1, EXOC4). Network analysis also showed significant enrichment in these biological processes (Figure 2C). Furthermore, cellular senescence may contribute to both aging and neurodevelopment across the lifespan, 30 and we found overlapping cell cycle and senescence genes in the annotated pathways. 31
Results from the present study further support putative sex differences in the causal effects of cognitive reserve on AD. Our sex‐stratified MR revealed a stronger protective effect of higher COG in females than in males. A similar trend was also observed in EA and INT, although the analyses were likely underpowered to detect significant effects among males, leaving the presence of sex differences in these measures of cognitive reserve inconclusive. As the majority of ADGC participants were enrolled at 60 years of age and above, the observed sex differences in effect of COG on AD may reflect gender norms in earlier generations, which resulted in disparities of education, occupation, physical activities, and exposure to environmental factors between sexes. 28 The MR estimate reflects the phenotypic effect (with both genetic and environmental components) of an exposure on an outcome, whereas PRS analysis focuses on genetic risk. Intriguingly, our PRS analysis did not identify significant AD‐by‐sex interaction for any of the AD related traits, including COG, which showed sex differences in causality from the MR analysis even after matching the sample sizes of both sexes. Although this discrepancy might be due to power issues in the different methods, an alternative explanation could be that the subtle, statistically insignificant sex differences in genetic risk of the COG trait become amplified through gene–environmental interactions accumulated over the lifespan. With the ongoing change of gender norms, modernization, and life expectancy, future investigations on the impact of the generational differences on AD‐related factors will extend our knowledge of their sex differences.
Previous findings demonstrated overall genetic overlap among AD, plasma lipids, and CRP levels. 32 We further showed the directions of significant horizontal pleiotropy between elevated TC levels and increased AD risk, as well as between decreased CRP levels and increased AD risk. The observation suggests genetic variants with effects on both AD and TC/CRP, which are predominantly from the APOE region. CRP levels are related to immune dysregulation, an important etiology of AD. 33 There are repeated observations of inverse association between risk of AD and cancer, 34 as well as higher CRP and cancer. 35 Although survival bias and confounders should be considered, the shared genetic mechanisms among AD and CRP in lipid metabolism and immune dysregulation are worth further exploration.
The present study is limited by the power. Therefore, our sex‐stratified GWAS were not suitable for bidirectional MR, although reverse causality might be unlikely for certain traits. A report supported this possibility showing absence of reverse causality between INT and AD. 17 Moreover, while the present study attempted to include traits representative of various AD risk factors and etiological pathways, it could not cover all the AD‐related traits. Future studies on an expanded collection of traits are needed. In addition, inclusion of other approaches such as colocalization analysis that takes account of LD structure, may provide converging evidence to verify the findings of network analysis.
The strengths of our study include the three‐pronged approach for examining the genetic association and their sex‐differences, and the use of sex‐stratified GWAS. Our results suggest a role of complex gene–environmental interaction in sex‐related heterogeneity of AD risk, which may imply opportunities for prevention and intervention of AD by improving access to factors that are related to cognitive reserve. 5 , 28
CONFLICTS OF INTEREST
The authors declare that the research was conducted in the absence of any commercial or financial relationships that could be construed as a potential conflict of interest.
AUTHOR CONTRIBUTIONS
H.W. and C.‐H.C. contributed to the conception and design of the study. H.W., S.B.R., M.‐T.L., M.F., and C.‐H.C. contributed to the data analysis. H.W., L.K.M., and C.‐H.C. contributed to data interpretation. H.W. and C.‐H.C. contributed to drafting the manuscript. All authors reviewed and commented on the manuscript.
Supporting information
Supporting Information
Tables S1‐S11
ACKNOWLEDGMENTS
This study was supported by National Institutes of Health R56AG061163, R01MH118281; The Alzheimer's Disease Genetics Consortium (ADGC) were supported by a grant from the National Institute on Aging/National Institutes of Health UO1AG032984 and complete acknowledgments for ADGC are detailed on the ADGC website (http://www.adgenetics.org/content/acknowledgements).
Wang H, Rosenthal BS, Makowski C, et al. Causal association of cognitive reserve on Alzheimer's disease with putative sex difference. Alzheimer's Dement. 2021;13:e12270. 10.1002/dad2.12270
Contributor Information
Hao Wang, Email: chc101@ucsd.edu.
Chi‐Hua Chen, Email: haw040@ucsd.edu.
REFERENCES
- 1. Gatz M, Reynolds CA, Fratiglioni L, et al. Role of genes and environments for explaining Alzheimer disease. Arch Gen Psychiatry. 2006;63(2):168‐174. [DOI] [PubMed] [Google Scholar]
- 2. Dubal DB. Sex difference in Alzheimer's disease: an updated, balanced and emerging perspective on differing vulnerabilities. Handbook of Clinical Neurology. Elsevier B.V.; 2020:261‐273. [DOI] [PubMed] [Google Scholar]
- 3. Dumitrescu L, Mayeda ER, Sharman K, Moore AM, Hohman TJ. Sex Differences in the Genetic Architecture of Alzheimer's Disease. Curr Genet Med Rep. 2019;7(1):13‐21. [DOI] [PMC free article] [PubMed] [Google Scholar]
- 4. Larsson SC, Traylor M, Malik R, Dichgans M, Burgess S, Markus HS. Modifiable pathways in Alzheimer's disease: mendelian randomisation analysis. BMJ. 2017;359:j5375. [DOI] [PMC free article] [PubMed] [Google Scholar]
- 5. Kuźma E, Hannon E, Zhou A, et al. Which Risk Factors Causally Influence Dementia? A Systematic Review of Mendelian Randomization Studies. J Alzheimer's Dis. 2018;64(1):181‐193. [DOI] [PMC free article] [PubMed] [Google Scholar]
- 6. Anderson EL, Howe LD, Wade KH, et al. Education, intelligence and Alzheimer's disease: evidence from a multivariable two‐sample Mendelian randomization study. Int J Epidemiol. 2020;49(4):1163‐1172. [DOI] [PMC free article] [PubMed] [Google Scholar]
- 7. Wang H, Lo M‐T, Rosenthal SB, et al. Similar Genetic Architecture of Alzheimer’s Disease and Differential APOE Effect Between Sexes. Front Aging Neurosci.. 2021;13: [DOI] [PMC free article] [PubMed] [Google Scholar]
- 8. Naj AC, Jun G, Beecham GW, et al. Common variants at MS4A4/MS4A6E, CD2AP, CD33 and EPHA1 are associated with late‐onset Alzheimer's disease. Nat Genet. 2011;43(5):436‐441. [DOI] [PMC free article] [PubMed] [Google Scholar]
- 9. Jun G, Ibrahim‐Verbaas CA, Vronskaya M, et al. A novel Alzheimer disease locus located near the gene encoding tau protein. Mol Psychiatry. 2016;21(1):108‐117. [DOI] [PMC free article] [PubMed] [Google Scholar]
- 10. Deckers K, Köhler S, Ngandu T, et al. Quantifying dementia prevention potential in the FINGER randomized controlled trial using the LIBRA prevention index. Alzheimer's Dement. 2021;17:1205‐1212. [DOI] [PMC free article] [PubMed] [Google Scholar]
- 11. Willer CJ, Schmidt EM, Sengupta S, et al. Discovery and refinement of loci associated with lipid levels. Nat Genet. 2013;45(11):1274‐1283. [DOI] [PMC free article] [PubMed] [Google Scholar]
- 12. Mahajan A, Taliun D, Thurner M, et al. Fine‐mapping type 2 diabetes loci to single‐variant resolution using high‐density imputation and islet‐specific epigenome maps. Nat Genet. 2018;50(11):1505‐1513. [DOI] [PMC free article] [PubMed] [Google Scholar]
- 13. Evangelou E, Warren HR, Mosen‐Ansorena D, et al. Genetic analysis of over 1 million people identifies 535 new loci associated with blood pressure traits. Nat Genet. 2018;50(10):1412‐1425. [DOI] [PMC free article] [PubMed] [Google Scholar]
- 14. Locke AE, Kahali B, Berndt SI, et al. Genetic studies of body mass index yield new insights for obesity biology. Nature. 2015;518(7538):197‐206. [DOI] [PMC free article] [PubMed] [Google Scholar]
- 15. Ligthart S, Vaez A, Võsa U, et al. Genome Analyses of >200,000 Individuals Identify 58 Loci for Chronic Inflammation and Highlight Pathways that Link Inflammation and Complex Disorders. Am J Hum Genet. 2018;103(5):691‐706. [DOI] [PMC free article] [PubMed] [Google Scholar]
- 16. Okbay A, Beauchamp JP, Fontana MA, et al. Genome‐wide association study identifies 74 loci associated with educational attainment. Nature. 2016;533(7604):539‐542. [DOI] [PMC free article] [PubMed] [Google Scholar]
- 17. Savage JE, Jansen PR, Stringer S, et al. Genome‐wide association meta‐analysis in 269,867 individuals identifies new genetic and functional links to intelligence. Nat Genet. 2018;50(7):912‐919. [DOI] [PMC free article] [PubMed] [Google Scholar]
- 18. Lee JJ, Wedow R, Okbay A, et al. Gene discovery and polygenic prediction from a genome‐wide association study of educational attainment in 1.1 million individuals. Nat Genet. 2018;50(8):1112‐1121. [DOI] [PMC free article] [PubMed] [Google Scholar]
- 19. Okbay A, Baselmans BML, De Neve JE, et al. Genetic variants associated with subjective well‐being, depressive symptoms, and neuroticism identified through genome‐wide analyses. Nat Genet. 2016;48(6):624‐633. [DOI] [PMC free article] [PubMed] [Google Scholar]
- 20. Ge T, Chen CY, Ni Y, Feng YCA, Smoller JW. Polygenic prediction via Bayesian regression and continuous shrinkage priors. Nat Commun. 2019;10(1):1‐10. [DOI] [PMC free article] [PubMed] [Google Scholar]
- 21. Li J, Ji L. Adjusting multiple testing in multilocus analyses using the eigenvalues of a correlation matrix. Heredity (Edinb). 2005;95(3):221‐227. [DOI] [PubMed] [Google Scholar]
- 22. Zhu Z, Zheng Z, Zhang F, et al. Causal associations between risk factors and common diseases inferred from GWAS summary data. Nat Commun. 2018;9(1):1‐12. [DOI] [PMC free article] [PubMed] [Google Scholar]
- 23. Grotzinger AD, Rhemtulla M, de Vlaming R, et al. Genomic structural equation modelling provides insights into the multivariate genetic architecture of complex traits. Nat Hum Behav. 2019;3(5):513‐525. [DOI] [PMC free article] [PubMed] [Google Scholar]
- 24. Watanabe K, Taskesen E, van Bochoven A, Posthuma D. Functional mapping and annotation of genetic associations with FUMA. Nat Commun. 2017;8(1):1826. [DOI] [PMC free article] [PubMed] [Google Scholar]
- 25. Singhal A, Cao S, Churas C, et al. Multiscale community detection in Cytoscape. Przytycka TM, ed. PLOS Comput Biol. 2020;16(10):e1008239. [DOI] [PMC free article] [PubMed] [Google Scholar]
- 26. Pulit SL, Stoneman C, Morris AP, et al. Meta‐Analysis of genome‐wide association studies for body fat distribution in 694 649 individuals of European ancestry. Hum Mol Genet. 2019;28(1):166‐174. [DOI] [PMC free article] [PubMed] [Google Scholar]
- 27. Hemani G, Bowden J, Smith G. Evaluating the potential role of pleiotropy in Mendelian randomization studies. Hum Mol Genet. 2018;27(R2):R195‐R208. [DOI] [PMC free article] [PubMed] [Google Scholar]
- 28. Subramaniapillai S, Almey A, Natasha Rajah M, Einstein G. Sex and gender differences in cognitive and brain reserve: implications for Alzheimer's disease in women. Front Neuroendocrinol. 2021;60:100879. [DOI] [PubMed] [Google Scholar]
- 29. Yeo RA, Arden R, Jung RE. Alzheimer's disease and intelligence. Curr Alzheimer Res. 2011;8(4):345‐353. [DOI] [PubMed] [Google Scholar]
- 30. Wanner E, Thoppil H, Riabowol K. Senescence and Apoptosis: Architects of Mammalian Development. Front Cell Dev Biol. 2021;8:620089. [DOI] [PMC free article] [PubMed] [Google Scholar]
- 31. Avelar RA, Ortega JG, Tacutu R, et al. A multidimensional systems biology analysis of cellular senescence in aging and disease. Genome Biol. 2020;21(1):1‐22. [DOI] [PMC free article] [PubMed] [Google Scholar]
- 32. Desikan RS, Schork AJ, Wang Y, et al. Polygenic Overlap Between C‐Reactive Protein, Plasma Lipids, and Alzheimer Disease. Circulation. 2015;131(23):2061‐2069. [DOI] [PMC free article] [PubMed] [Google Scholar]
- 33. Yarchoan M, Louneva N, Xie SX, et al. Association of plasma C‐reactive protein levels with the diagnosis of Alzheimer's disease. J Neurol Sci. 2013;333(1‐2):9‐12. [DOI] [PMC free article] [PubMed] [Google Scholar]
- 34. Ospina‐Romero M, Glymour MM, Hayes‐Larson E, et al. Association Between Alzheimer Disease and Cancer With Evaluation of Study Biases: a Systematic Review and Meta‐analysis. JAMA Netw Open. 2020;3(11):e2025515. [DOI] [PMC free article] [PubMed] [Google Scholar]
- 35. Allin KH, Bojesen SE, Nordestgaard BG. Baseline C‐reactive protein is associated with incident cancer and survival in patients with cancer. J Clin Oncol. 2009;27(13):2217‐2224. [DOI] [PubMed] [Google Scholar]
Associated Data
This section collects any data citations, data availability statements, or supplementary materials included in this article.
Supplementary Materials
Supporting Information
Tables S1‐S11