Abstract
The β1-adrenergic receptor (β1-AR) can activate two families of G proteins. When coupled to Gs, β1-AR increases cardiac output, and coupling to Gi leads to decreased responsiveness in myocardial infarction. By comparative structural analysis of turkey β1-AR complexed with either Gi or Gs, we investigate how a single G-protein-coupled receptor simultaneously signals through two G proteins. We find that, although the critical receptor-interacting C-terminal α5-helices on Gαi and Gαs interact similarly with β1-AR, the overall interacting modes between β1-AR and G proteins vary substantially. Functional studies reveal the importance of the differing interactions and provide evidence that the activation efficacy of G proteins by β1-AR is determined by the entire three-dimensional interaction surface, including intracellular loops 2 and 4 (ICL2 and ICL4).
The β1-adrenergic receptor (β1-AR) is the most abundant of the β-ARs (~70–85%) in the adult human heart1,2. β1-AR is implicated in hypertension and heart disease, which are the world’s two most prevalent chronic diseases and are notable contributors to mortality and vascular morbidity1,2. Down regulation of β1-ARs has also been described in most cases of heart failure, which is a leading cause of death in the developed world3. β1-AR belongs to the family of G-protein-coupled receptors (GPCRs) that relay signals to G proteins to initiate myriad cellular responses4. G proteins are heterotrimers composed of Gα, Gβ and Gγ sub units and are classified according to their Gα subunits (Gαs, Gαi, Gαq/11 and Gα12/13 families). How these four families of G proteins are able to faithfully transduce specific signals from the ~800 GPCRs in humans is poorly understood. Although some GPCRs couple to one specific family of G proteins, others can signal through multiple families of G proteins. Thus, determining how one GPCR can couple to and activate different families of heterotrimeric G proteins is essential for understanding the physiological functions of GPCRs and G proteins.
Activated β1-AR couples to Gs and increases cardiac 3',5'-cyclic adenosine monophosphate (cAMP) levels, which leads to increased heart rate, conduction and contractility1,2. However, β1-AR can also couple to Gi (refs. 5–10). This Gi-mediated β1-AR signaling contributes to the decreased receptor responsiveness in myocardial infarction and β-arrestin-mediated biased signaling6,7. The molecular basis for this dual G-protein signaling ability is profoundly important for understanding β1-AR physiology, and GPCR/G-protein physiology more broadly, yet coupling specificity is poorly understood. To elucidate the mechanisms by which β1-AR selectively couples and activates G proteins, we determined cryo-EM structures of β1-AR in complex with heterotrimeric Gi (composed of Gαi1, Gβ1 and Gγ2) and of β1-AR with a modified Gi heterotrimer in which the C-terminal 11 amino acids of the Gαi1 subunit were replaced with Gαs (which we call the ‘Gi/s’ chimera) and compared them with a structure of β1-AR in complex with heterotrimeric Gs (composed of Gαs, Gβ1 and Gγ2)11. We have revealed the structural differences between the interactions of β1-ARs with Gs and Gi. We have shown that, although many interactions between β1-ARs and the two Gα subunits are conserved or positionally conserved, others are Gαi - or Gαs -specific, resulting in differences in the overall orientation of the two Gα subunits with respect to β1-ARs. In particular, the requirement for β1-AR residues that form a Gαi-specific interaction with intracellular loops 2 and 4 (ICL2 and ICL4) for the nucleotide-exchange activity has been demonstrated by mutagenesis studies. Furthermore, we have shown that the structural differences between the β1-AR–Gi and β1-AR–Gs complexes do not depend on the sequence of the Gα C-terminal α5-helix, which forms the major contact surface with the receptor, as demonstrated by the structure of β1-AR in complex with the Gi/s chimera.
Results
Structure of the complex of isoproterenol-bound β1-AR and Gi.
We first sought to establish a structural framework for interrogating the mechanism of Gi recognition and activation by β1-AR. To do this, we determined a cryo-EM structure of the complex of turkey β1-AR (with two point mutations, Arg68Ser and Met90Val) and Gi (the rat Gαi1 (G203A) and bovine Gβ1Gγ2) at a resolution of 3.0 Å (Fig. 1a–c, Table 1, Extended Data Figs. 1 and 2 and Supplementary Fig. 1). In this complex with the full agonist isoproterenol and heterotrimeric Gi, β1-AR adopts a canonical GPCR active-state conformation11 (Fig. 1a–c and Extended Data Figs. 3 and 4). The salient conformational features of the active state are made clear by comparison with the inactive state of β1-AR (PDB 4GPO)12 (Extended Data Fig. 3a–d). Together, these structural data reveal the rearrangements that occur in β1-AR to accommodate Gi binding in the transducer binding pocket (Extended Data Fig. 3e–g).
Fig. 1. Cryo-EM structure of the complex of isoproterenol-bound β1-AR and Gi.
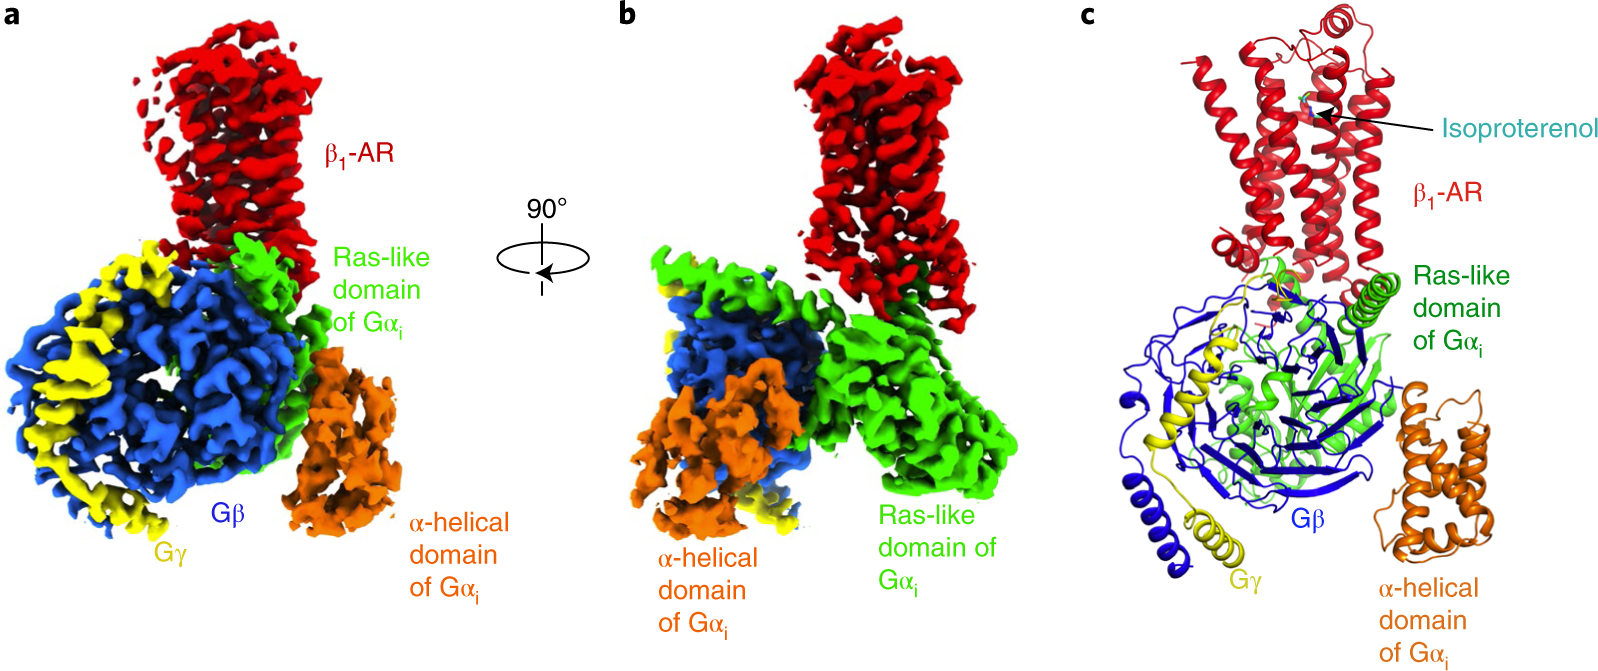
a,b, Cryo-EM density map (a) and the same map rotated by 90° (b) of the β1-AR–Gi complex colored by subunit (β1-AR in red, Gαi Ras-like domain in green, Gαi α-helical domain in orange, Gβ in blue, Gγ in yellow). c, Cartoon diagram of the β1-AR–Gi complex with the full agonist isoproterenol shown as sticks.
Table 1 |.
Cryo-EM data collection, refinement and validation statistics
| β1-AR–Gi (EMD-24789) (PDB 7S0F) | β1-AR–Gi/s (EMD-24790) (PDB 7S0G) | ||||
|---|---|---|---|---|---|
| Consensus | β1-AR focus | Gi focus | Consensus | Gi/s focus | |
| Data collection and processing | |||||
| Magnification | 105,000× | 105,000× | 105,000× | 105,000× | 105,000× |
| Voltage (kV) | 300 | 300 | 300 | 300 | 300 |
| Electron exposure (e−/Å2) | 67 | 67 | 67 | 71 | 71 |
| Defocus range (μm) | −1.0 to −2.5 | −1.0 to −2.5 | −1.0 to −2.5 | −1.0 to −2.5 | −1.0 to −2.5 |
| Pixel size (Å) | 1.0735 | 1.0735 | 1.0735 | 1.0735 | 1.0735 |
| Symmetry imposed | C1 | C1 | C1 | C1 | C1 |
| Initial particle images (no.) | 1,935,000 | 1,935,000 | 1,935,000 | 6,013,000 | 6,013,000 |
| Final particle images (no.) | 227,041 | 227,041 | 227,041 | 168,662 | 168,662 |
| Map resolution (Å) | 2.96 | 3.18 | 2.80 | 3.86 | 3.59 |
| FSC threshold | 0.143 | 0.143 | 0.143 | 0.143 | 0.143 |
| Refinement | |||||
| Initial model used (PDB code) | 4GPO and 1GG2 | 4GPO and 1GG2 | |||
| Model resolution (Å) | 2.91 / 2.47 | 4.13 / 3.68 | |||
| FSC threshold | 0.50 / 0.143 | 0.50 / 0.143 | |||
| Map sharpening B factor (Å2) | −93 | −185 | |||
| Model composition | |||||
| Nonhydrogen atoms | 6,998 | 6,992 | |||
| Protein residues | 892 | 893 | |||
| Ligands | 1 | 1 | |||
| B factors (Å2) | |||||
| Protein | 78.43 | 84.48 | |||
| Ligand | 80.65 | 88.30 | |||
| R.m.s. deviations | |||||
| Bond lengths (Å) | 0.003 | 0.003 | |||
| Bond angles (°) | 0.431 | 0.422 | |||
| Validation | |||||
| MolProbity score | 1.40 | 1.35 | |||
| Clashscore | 2.95 | 3.54 | |||
| Poor rotamers (%) | 1.74 | 0 | |||
| Ramachandran plot | |||||
| Favored (%) | 97.27 | 96.71 | |||
| Allowed (%) | 2.61 | 3.29 | |||
| Disallowed (%) | 0.11 | 0 | |||
Structural basis of the activation of Gi by β1-AR.
Having established how β1-AR responds to Gi engagement, we next sought to understand how this engagement drives activation of Gi by comparing its conformation in the β1-AR–Gi structure with a previously determined X-ray crystal structure for the inactive, GDP-bound Gi heterotrimer (Gαi1 (G203A)Gβ1 Gγ2 trimer; PDB 1GG2)13 (Fig. 2a–d and Extended Data Figs. 5 and 6). For the Gβγ subunits, the conformations of the seven-bladed β-propeller of Gβ are similar (Fig. 2a). The N-terminal helix of Gβ forms a parallel coiled-coil with the N-terminal helix of Gγ, and this coiled-coil changes markedly in the β1-AR–Gi complex (Fig. 2a). For the Gαi1 subunit, the largest conformational change is the rotating opening of the α-helical domain, as observed in other GPCR–G protein complexes (Extended Data Fig. 5). Gα consists of two domains: a Ras-like GTPase domain and an α-helical domain, which is unique to heterotrimeric G proteins (Extended Data Fig. 5a,b). The Ras-like domain and the α-helical domain are connected by two flexible linkers, Linker 1 and Linker 2 (Linker 2 is also named Switch I; Extended Data Fig. 5a). The α-helical domain has been suggested to play roles in the stabilization of nucleotide binding, in the rate of nucleotide exchange and, together with the Ras-like domain, in the regulation of GDP release and GTP binding through a clamshell-like motion between the two domains14 (Extended Data Fig. 5a,b). In the closed inactive state, the two domains come together to form a guanine nucleotide-binding pocket (Extended Data Fig. 5b). In this conformation, the nucleotide is essentially occluded from the bulk solvent15,16. Our structure reveals that, during activation, the principal change is a large rotational opening of the α-helical domain by ~79°, which results in an ~37-Å displacement of its mass center relative to the Ras-like GTPase domain that anchors the heterotrimer to β1-AR (Extended Data Fig. 5a,b). Critically, the maximum rotation is limited by the position of Gβγ, with Gβγ acting as a buttress that prevents further rotation (Extended Data Fig. 5c,d). The location of the α-helical domain in the β1-AR–Gi complex is different from those in the complexes of β2-AR–Gs and β1-AR–Gs (refs. 11,17) and is slightly closer to that in the complex of rhodopsin–Gi, which is stabilized by a Fab fragment (Fab-G50) that simultaneously binds to the α-helical domain and Gβ (ref. 18; Extended Data Fig. 5e,f). The biological significance of these different locations for the α-helical domains in Gs and Gi needs further investigations. The α5-helix of Gαi undergoes structural rearrangements during Gi activation by β1-AR (Fig. 2b)13,19. In the crystal structure of inactive Gi, the last three amino acid residues (Lys349 to Cys351) of the C terminus of the α5-helix are disordered and unresolved (Fig. 2b). In the β1-AR–Gi complex, these residues form a helix extension and interact extensively with β1-AR (Fig. 3). The last four amino acids form a C-terminal Schellman capping motif that stabilizes the helix ends20 (Fig. 2b). In addition to the α5-helix being extended, the entire helix is also shifted by one helical turn towards β1-AR, and rotates by one residue (Fig. 2b,c). These structural rearrangements of the α5-helix probably serve as a transduction pathway from β1-AR to the GDP-binding pocket, to weaken the binding of GDP and facilitate nucleotide release (Fig. 2b,c).
Fig. 2. Structural basis of the activation of Gi by β1-AR.
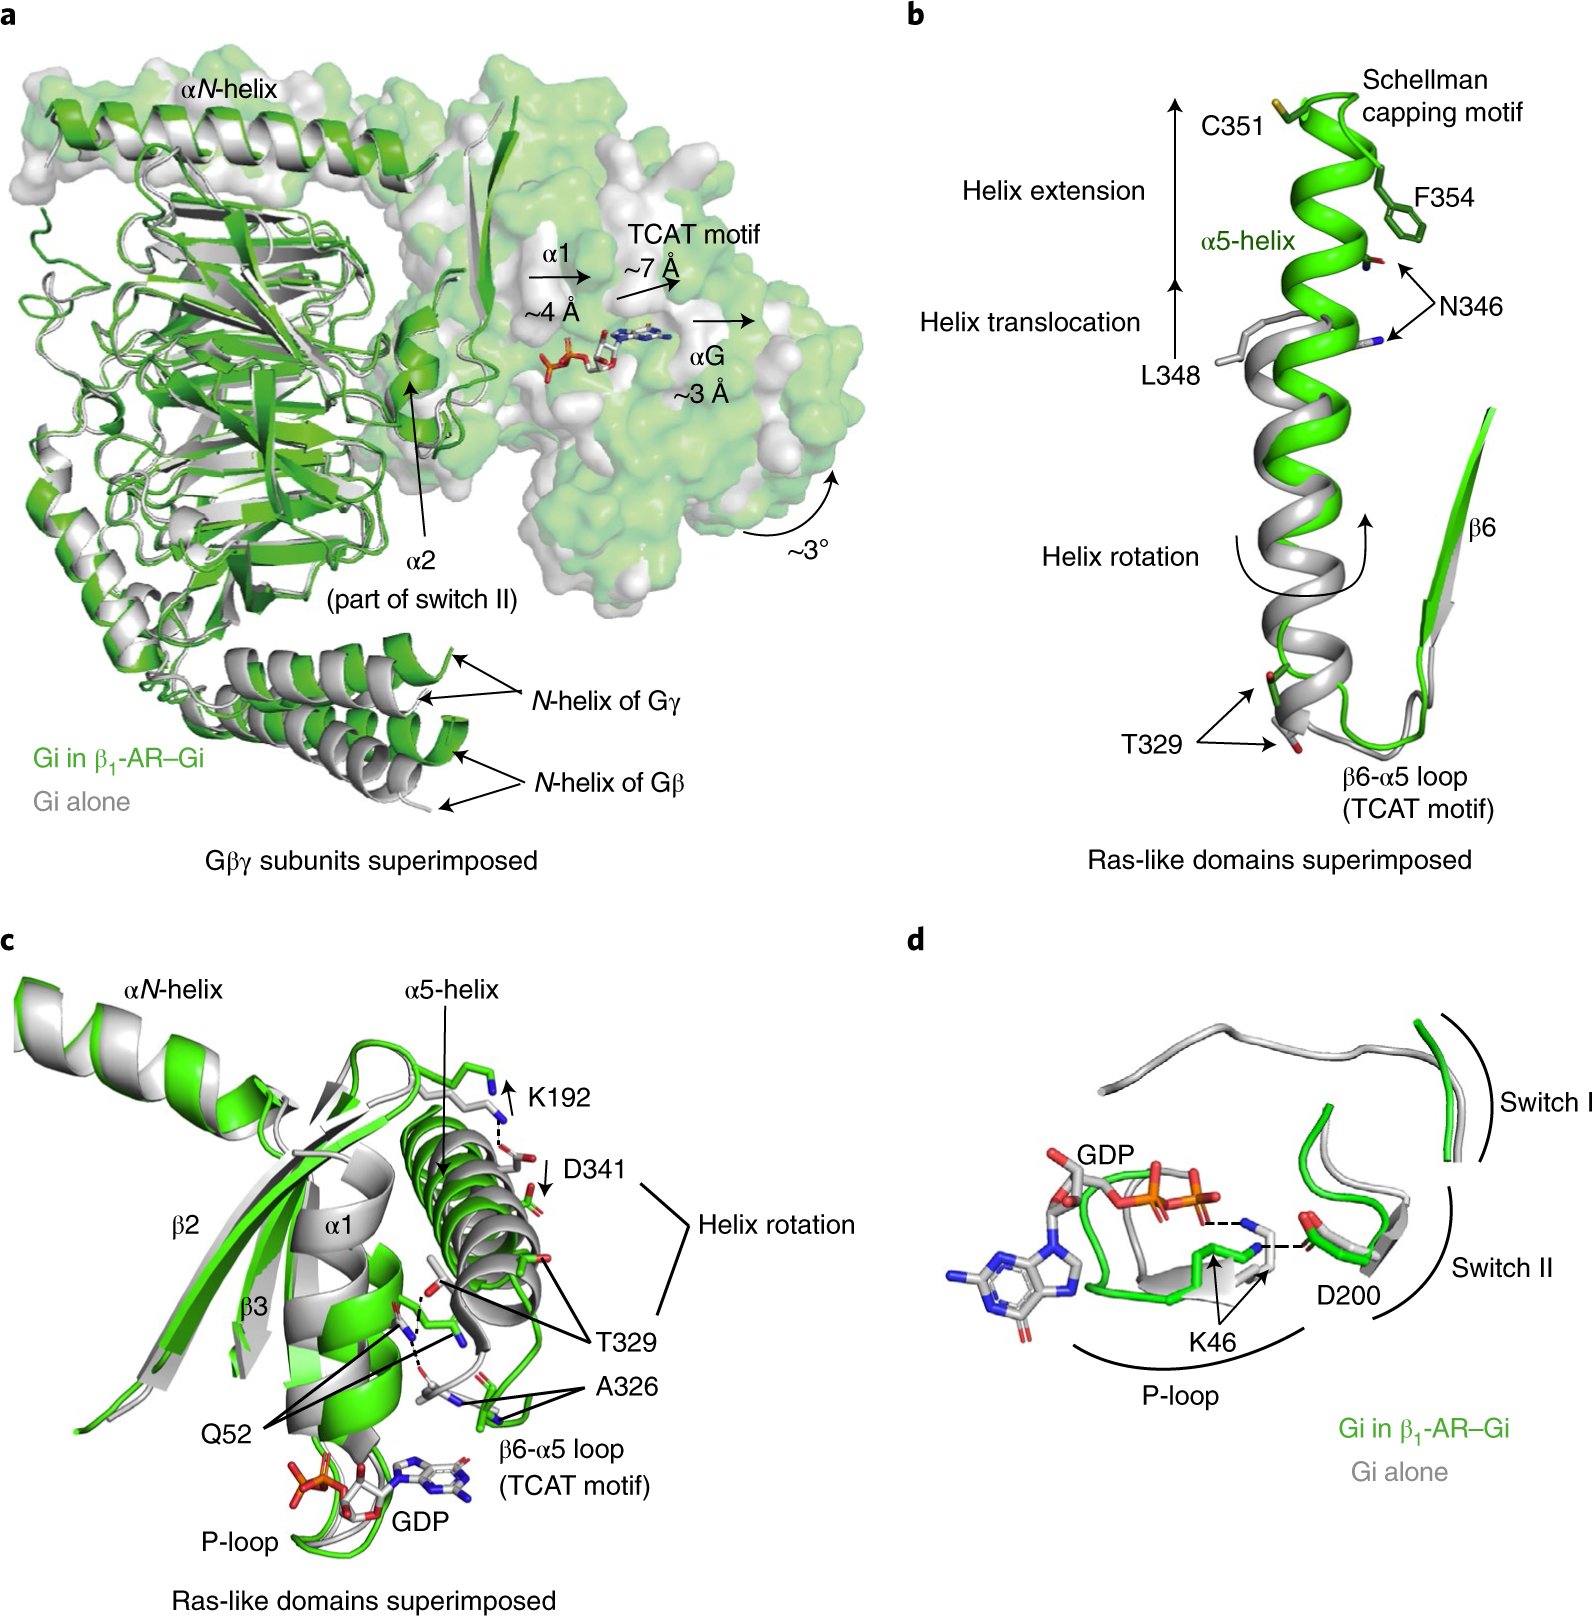
a, Structural changes of the GDP-binding pocket of Gαi in the complex of β1-AR–Gi (in green) when compared with the inactive Gαi(GDP)Gβγ trimer (in gray), when Gβγ subunits are superimposed. b, Structural differences in the α5-helices of the β1-AR–Gi complex (in green) and in the inactive GαiGβγ heterotrimer (in gray), when the Ras-like domains are superimposed. c, Disruptions of the α5- and α1-helix interactions of Gαi during Gi activation by β1-AR. An ionic interaction between the side chain of Asp341 in the α5-helix and the side chain of Lys192 in the β2-β3 loop is broken. An interacting network involving the side chain of Gln52 in the α1-helix, the backbone carbonyl of Ala326 in the β6-α5 loop, and the side chain of Thr329 in the α5-helix is disrupted. d, A newly formed interaction between Lys46 in the α1-helix (part of the P-loop) and Asp200 in β3 (part of Switch II) during or after GDP release.
Fig. 3. Functional studies of the interacting residues in β1-AR for the activation of Gi.
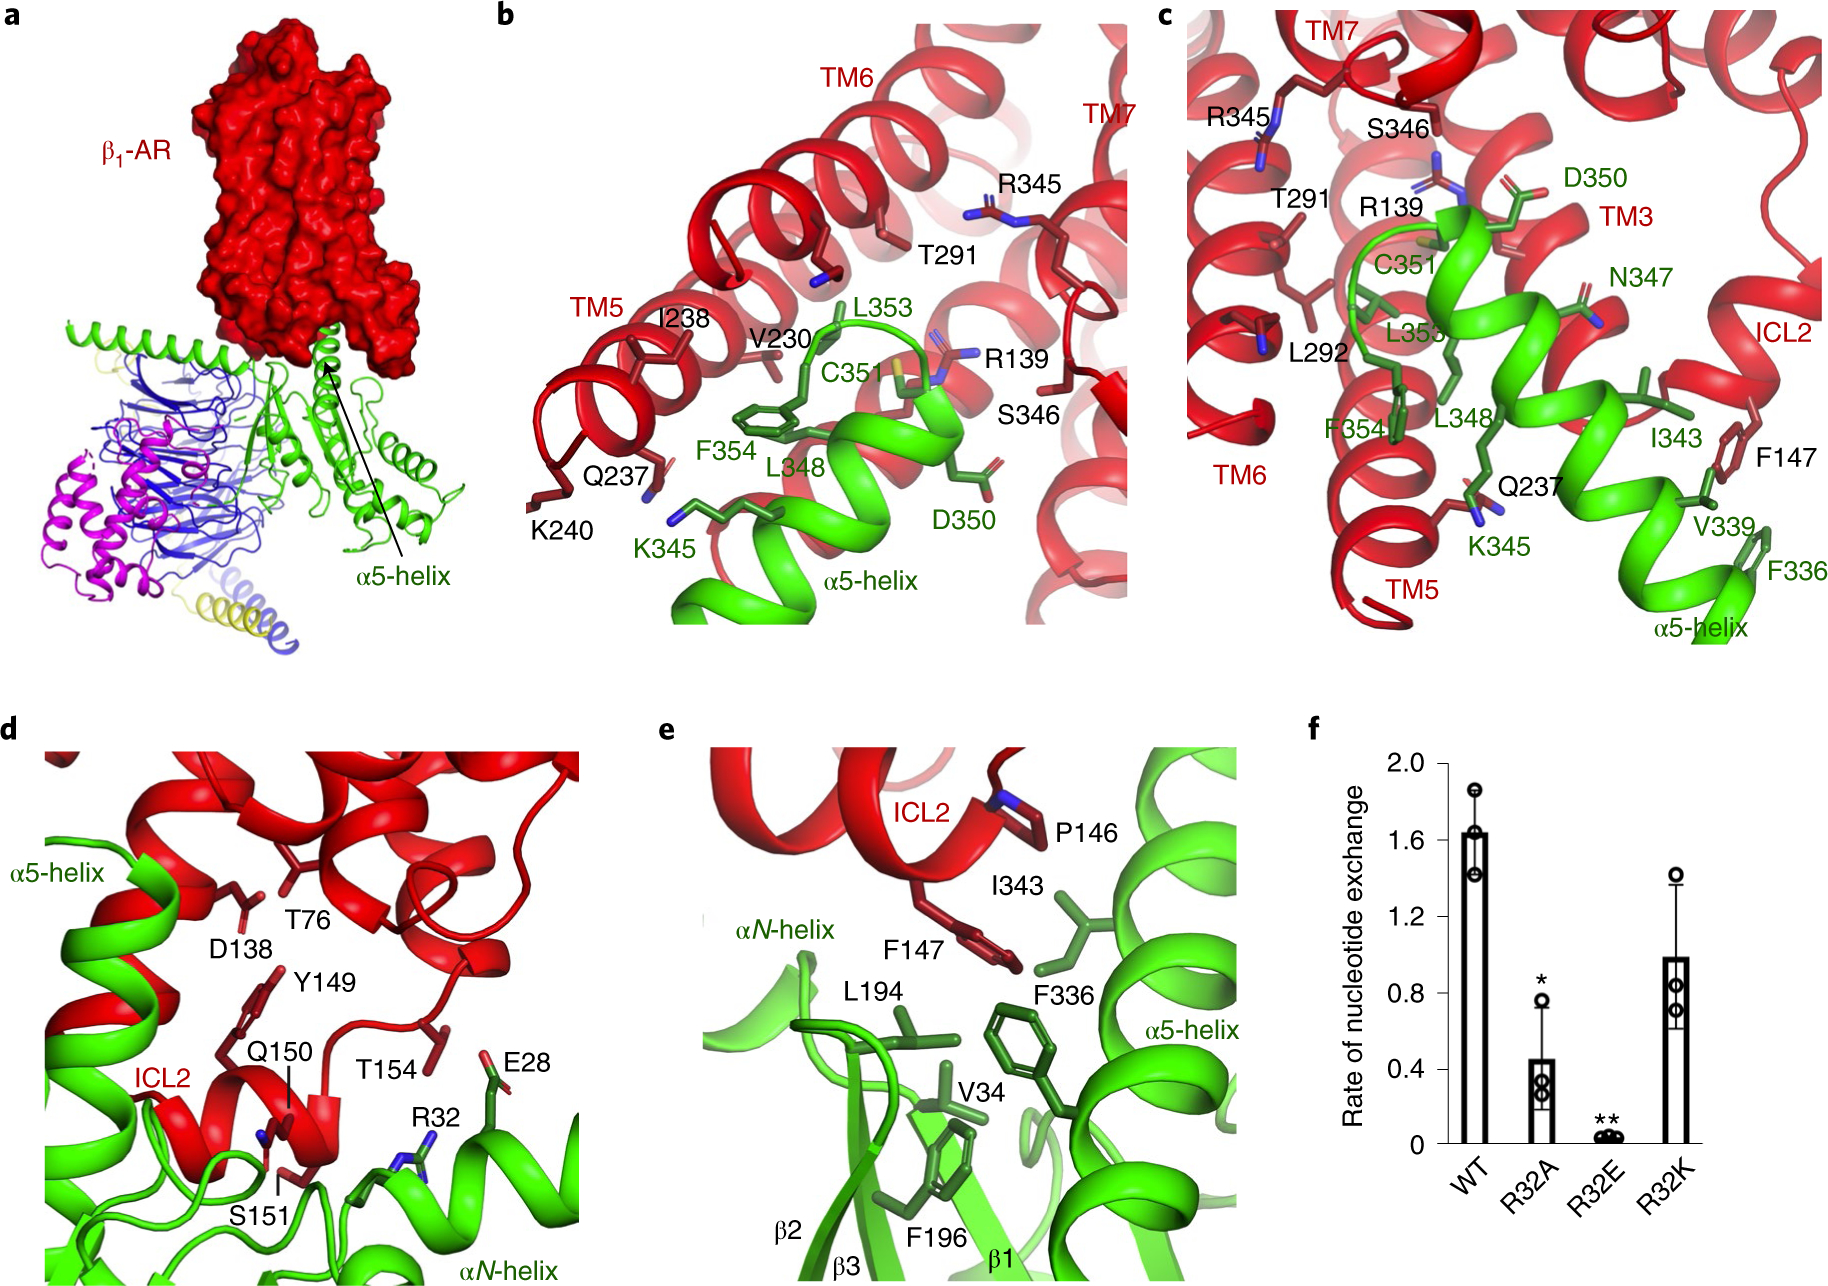
a, β1-AR uses its cytoplasmic surface like a saddle to cradle the α5-helix of the Ras-like domain of Gαi. b,c, Interactions between β1-AR and the α5-helix of Gα as viewed from different angles. d–f, Role of the interaction between ICL2 of β1-AR and the N-terminal hinge between the αN-helix and β1-strand of Gαi in Gi activation by β1-AR. ICL2 of β1-AR (in red) interacts with the N-terminal hinge between the αN-helix and β1-strand of Gαi (in green) as well as the α5-helix and the β2-β3 loop of Gαi (d,e). Activation of wild-type and mutant Gαi proteins by β1-AR monitored by the BODIPY-GTPγS binding (f). Data from three independent experiments of the BODIPY-GTPγS binding assays are shown, and the initial rate of BODIPY-GTPγS binding catalyzed by β1-AR is reported as mean±s.d. *P =0.004; **P= 0.0002 (Student’s t-test).
Conformational changes in Gi during its activation.
The Ras-like GTPase domain of Gαi undergoes additional conformational changes upon receptor activation. Given that GDP dissociation is an essential part of G-protein activation, we focused on the conformational changes in the GDP-binding pocket, which is characterized by a guanine recognition motif and a P-loop that envelops the α and β phosphates of GDP (Fig. 2c and Extended Data Fig. 6e). In the β1-AR–Gi structure, regions surrounding the GDP-binding pocket, including α1, αG and the β6-α5 loop (the TCAT motif), move away from the GDP-binding pocket (Fig. 2a). There is an expansion of this nucleotide-binding region (Fig. 2a). However, the interaction interface between the Ras-like domain and Gβγ seems not markedly disrupted, because the Gβγ-contacting regions such as αN and α2 (part of Switch II) do not change (Fig. 2a and Extended Data Fig. 7a). It is possible that Gβγ holds αN and α2 in place, while the rest of the Ras-like domain is moving away, for example, pulled by the α5-helix translocation and rotation (Fig. 2a,b and Extended Data Fig. 7). The same expansion of the GDP-binding site is also observed in the Ras-like domain of Gαs in the β1-AR–Gs complex when compared with the inactive Gαs(GDP)Gβ1γ2 trimer structure (PDB 6EG8)21 (Extended Data Fig. 7b). Thus, the conformation of the GDP-binding pocket in the β1-AR–Gi complex is changed with the effect of weakening the interaction between GDP and Gαi. Together, the local rearrangements in the nucleotide-binding pocket and the opening of the α-helical domain provide a structural basis for the release of GDP. It is worth noting that several residues involved in GDP binding (such as Ser44, Ser47, Asn269, K270 and Asp272) do not markedly change their conformations (Extended Data Fig. 6e), indicating a potential for subsequent binding of GTP, albeit weakly, even when the two domains are separated. Moreover, the interacting network between the N-terminal part of Gαi1 and the C-terminal part of Gαi1 in Gαi1 Gβ1 Gγ2 is broken in the β1-AR–Gi complex (Fig. 2c). In the Gi trimer, the side chain of Asp341 in the α5-helix forms an ionic interaction with the side chain of Lys192 in the β2-β3 loop (Fig. 2c). In the complex of β1-AR-Gi, the rotation and translation of the α5-helix move Asp341 away and break this interaction (Fig. 2c). Furthermore, the side chain of Gln52 in the α1-helix forms a hydrogen bond with the backbone carbonyl of Ala326 in the β6-α5 loop (the TCAT motif), and interacts with the side chain of Thr329 in the α5-helix in the Gi trimer (Fig. 2c). In the complex of β1-AR–Gi, this contacting network is broken, leading to the movements of the α1-helix, the P-loop and the TCAT motif (Fig. 2c). Additionally, in the Gαi1 Gβγ trimer structure, Lys46 on the P-loop points towards, and is involved in the interaction with, the β-phosphate of GDP13,19,22 (Fig. 2d). On the other hand, within the complex of β1-AR–Gi, Lys46 rotates and forms a salt bridge with Asp200 in Switch II (Fig. 2d). Together, because these regions form the GDP-binding pocket (Fig. 2 and Extended Data Fig. 6), the disruption of these interactions would lead to GDP release. Disruption of similar interactions also occurs in Gαs during its activation (Extended Data Fig. 8).
Functional studies of the interacting residues in β1-AR.
The interaction interface between β1-AR and Gi is defined by a ‘saddle’ formed from β1-AR elements TM3 (TM, transmembrane), ICL2, TM5 and TM6, which cradles the C-terminal α5-helix of the Ras-like domain of Gαi in the transducer binding pocket (Fig. 3a–c). In the β1-AR-Gi structure, the last two residues of the Gαi α5-helix, Phe354 and Leu353, interact mainly with the cytoplasmic ends of TM6 and TM5 of β1-AR (Fig. 3b,c). The next two residues of the α5-helix, Gly352 and Cys351, interact with β1-AR residue Arg139 from the conserved DRY motif of TM3, and with Thr291 of TM6 (Fig. 3b). Furthermore, the Gαi α5-helix interacts with residues from ICL2 (Pro146 and Phe147), TM3 (Ala142 and Ile143) and TM5 (Val230 and Gln237) (Fig. 3c).
The β1-AR–Gi structure reveals that, in addition to the engagement of the α5-helix of Gαi by the transducer binding pocket of β1-AR, Gi also interacts with several other elements of β1-AR, including ICL2 between TM3 and TM4. Gln150, Ser151 and Thr154 in ICL2 of β1-AR interact with Arg32, which is located in the N-terminal hinge between the αN-helix and β1-strand of Gαi (Fig. 3d). These interactions stabilize a helical conformation for ICL2, thereby positioning Pro146 and Phe147 in a hydrophobic cleft on the surface of Gαi formed by Ile343 and Phe336 in the α5-helix and the β2-β3 loop (Leu194; Fig. 3e). We used mutagenesis studies to functionally assess the role of these interactions in the activation of Gi by β1-AR. We expressed and purified recombinant Gi possessing positive (Lys), negative (Asp) and neutral (Ala) amino acid substitutions to Arg32, and used nucleotide-exchange assays to measure the effect of the mutations on β1-AR-catalyzed nucleotide turnover (Fig. 3f). The activation of Gi by β1-AR was monitored by the binding of fluorescent BODIPY-labeled GTPγS onto Gi. Relative to wild-type Gi, the activation of Arg32Glu and Arg32Ala mutants by β1-AR was impaired, while the activation of the conservative Arg32Lys mutant by β1-AR was not significantly different from wild-type Gαi (Fig. 3f). These functional studies demonstrate that interactions involving ICL2 of β1-AR and the N-terminal hinge between the αN-helix and β1-strand of Gαi are critical for Gi activation by β1-AR.
Comparative structural analysis of isoproterenol–β1-AR–Gi and isoproterenol–β1-AR–Gs.
Although β1-AR can activate both Gs and Gi, it activates Gs more selectively and efficiently than Gi (ref. 10). We next aimed to establish the basis for this selectivity through a comparison of the structures of β1-AR–Gi and β1-AR–Gs11 (Fig. 4). Although β1-AR adopts an identical active-state conformation when bound to either Gs or Gi, the interactions between the receptor and the G proteins are different (Fig. 4a). When the structures of β1-AR in β1-AR–Gi and β1-AR–Gs are superimposed, Gi displays a rotation of ~12° clockwise relative to Gs and away from the receptor, creating different interaction modes between β1-AR and Gs or Gi (Fig. 4b). The alternate interaction mode for Gi coupling results in a smaller interaction surface between β1-AR and Gi of 923 Å2, all of which is mediated by the Gαi subunit. In contrast, β1-AR interacts more thoroughly with both Gαs (1,104 Å2) and Gβ (157 Å2) in the β1-AR–Gs complex, yielding an overall larger interaction surface area (1,260 Å2).
Fig. 4. Comparative structural analysis of the complexes of isoproterenol–β1-AR–Gi and isoproterenol–β1-AR–Gs.
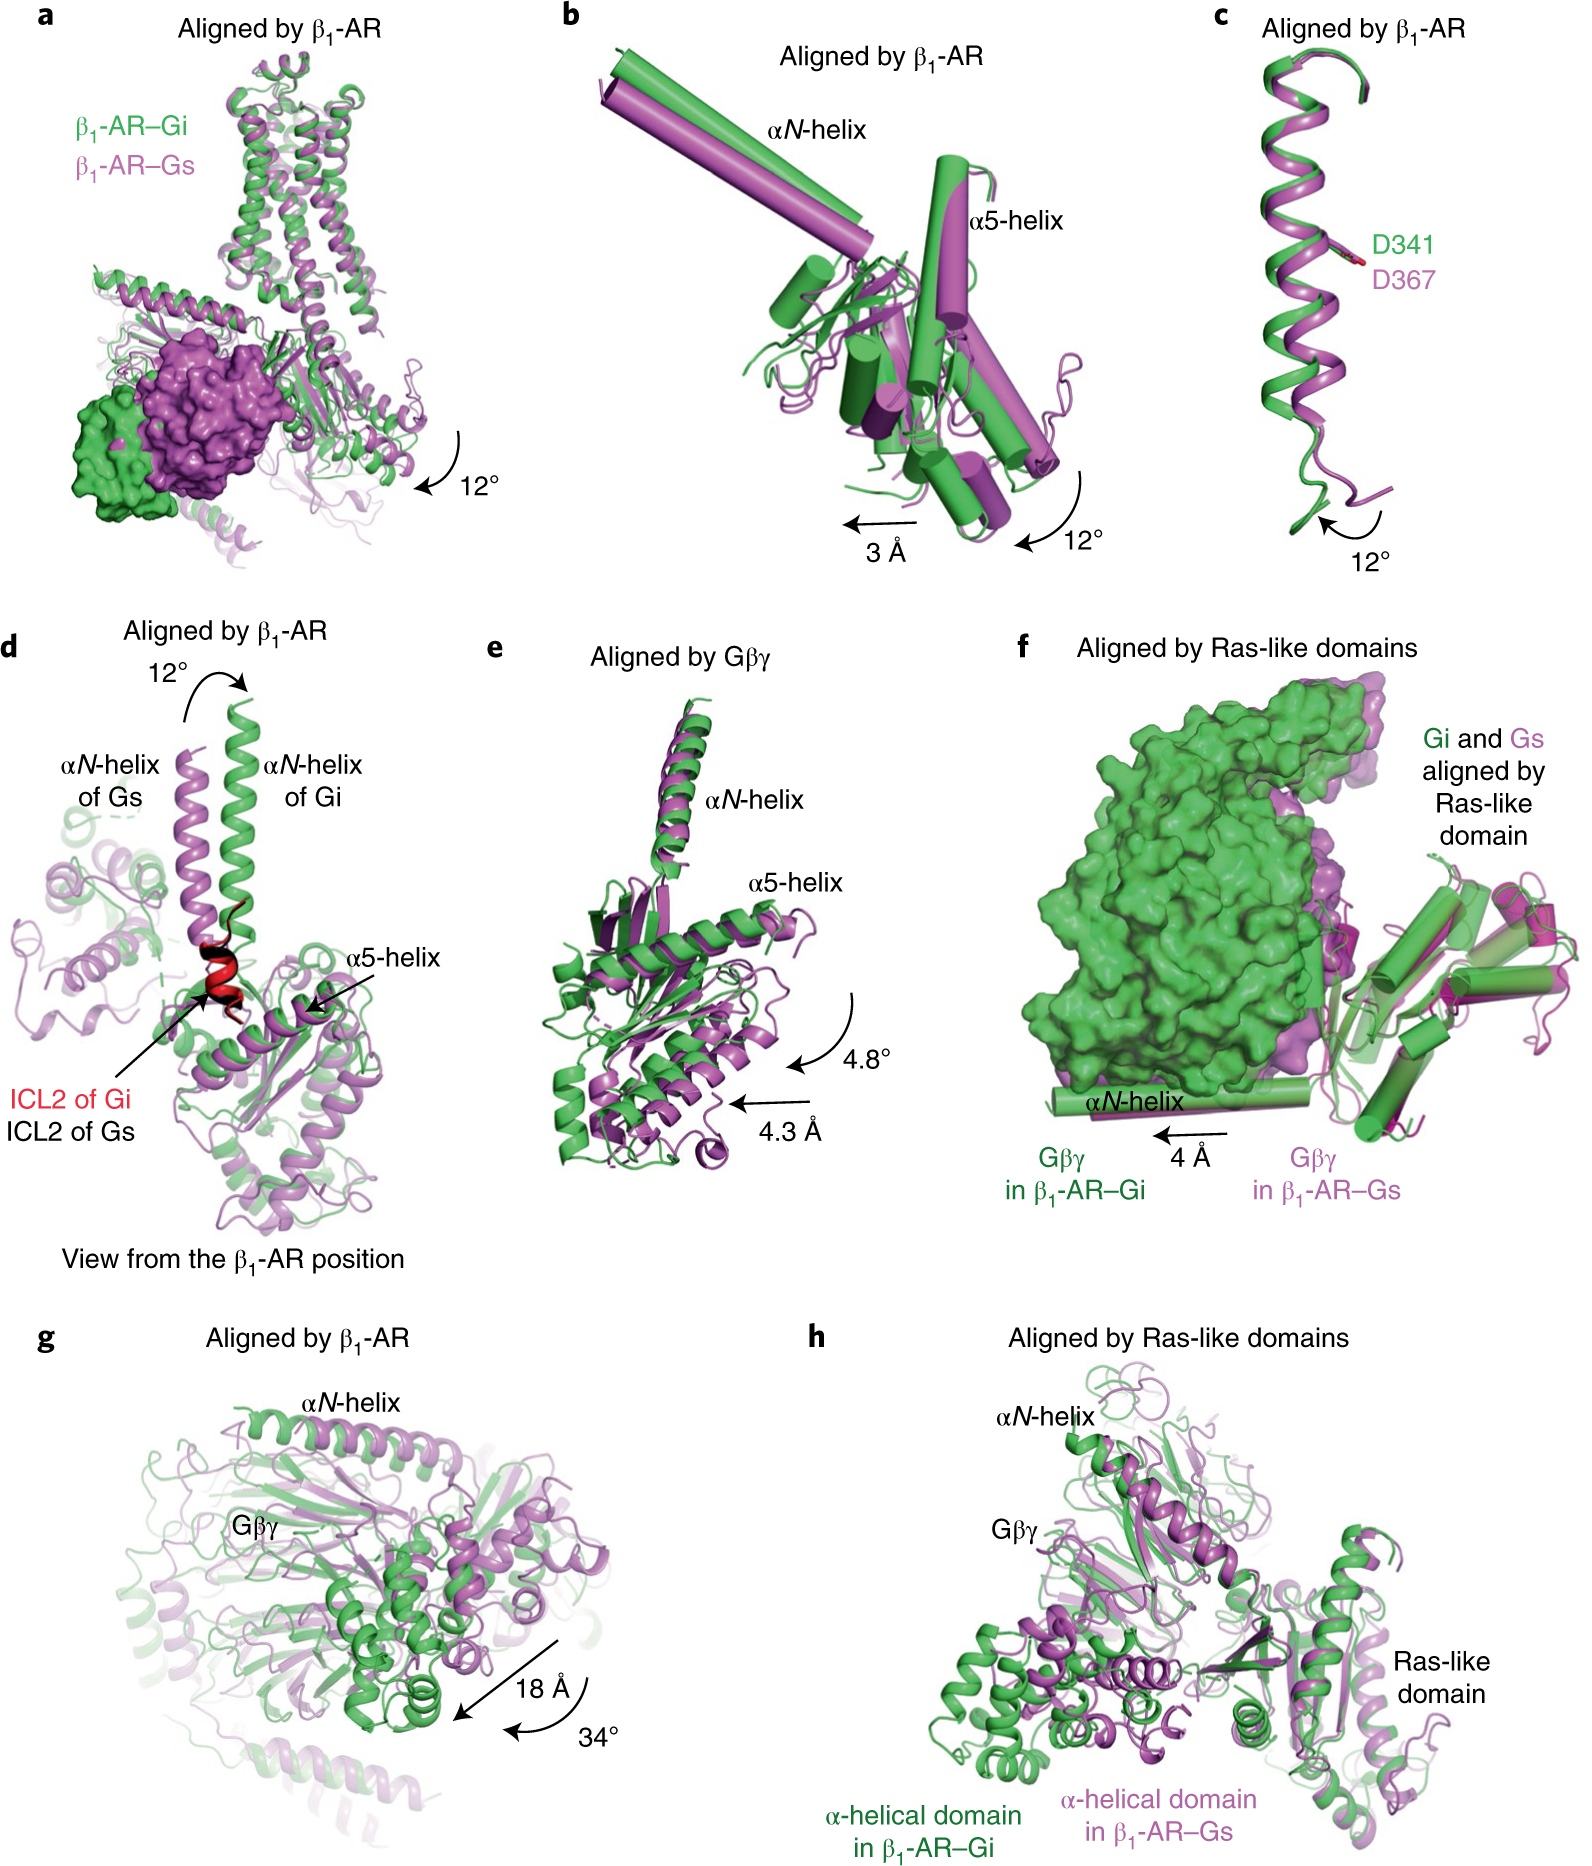
a–e, Comparisons of the β1-AR–Gi complex (green) and the β1-AR–Gs complex (violet), aligned by the β1-ARs (a), the Ras-like domains in the β1-AR–Gi complex (green) and the β1-AR–Gs complex (violet), aligned by the β1-ARs (b), the α5-helices in the β1-AR–Gi complex (green) and the β1-AR–Gs complex (violet), aligned by the β1-ARs (c), the αN-helices in the β1-AR–Gi complex (green) and the β1-AR–Gs complex (violet), aligned by the β1-ARs (d) and the Ras-like domains in the β1-AR–Gi complex (green) and the β1-AR–Gs complex (violet), aligned by the Gβγ subunits (e). f, Comparison of the distance between the Ras-like domain and Gβγ in the β1-AR–Gi complex (green) and the β1-AR–Gs complex (violet), aligned by the Ras-like domains. g, Relative locations of the α-helical domains in the β1-AR–Gi complex (green) and the β1-AR–Gs complex (violet) when the receptors are superimposed. h, Relative locations of the α-helical domains in the β1-AR–Gi complex (green) and in the β1-AR–Gs complex (violet) when the Ras-like domains are superimposed.
Both Gi and Gs couple to β1-AR via the α5-helix. However, although the last three turns of the α5-helices of Gi and Gs are positioned in an identical fashion with respect to β1-AR, comparison reveals that they diverge from each other beginning at Asp367 in Gs (Asp341 in Gi), resulting in an overall separation of ~12° (Fig. 4b,c). The divergence results in an ~12° rotation and ~3-Å displacement of the Ras-like domain of Gi relative to Gs, thereby altering the entire interaction interface between β1-AR and the G proteins (Fig. 4b). For example, the αN-helix in Gi is displaced by ~12° compared to its position in Gs, which leads to distinct interactions with ICL2 of β1-AR (Fig. 4d). Together, these structural features demonstrate that β1-AR interacts differently with Gs and Gi.
In addition to the differences in the interactions between the G proteins and β1-AR, differences also exist in the interactions between Gβγ and Gα in the β1-AR–Gs and β1-AR–Gi structures. When superimposed on Gβγ subunits, the Ras-like domain in Gi rotates by ~4.8° and translates by ~4 Å orthogonal to the rotation plane, relative to the Ras-like domain in Gs (Fig. 4e). The distance between the mass centers of Gβγ and the Ras-like domain is ~4 Å further apart in Gi than in Gs, resulting in a greater separation between Gβγ and the Ras-like domain (Fig. 4f). The greater separation is reflected in the smaller interface area between Gαi and Gβγ (1,195 Å2; excluding the α-helical domains) than between Gαs and Gβγ (1,469 Å2). We note that the Gαi1 (G203A) mutant was used in our cryo-EM structural study. This G203A mutation decreases the release of Gα from Gβγ, but does not change the Gαβγ trimer structure19,23. Additionally, the α-helical domains from Gi and Gs occupy different positions, differing from each other by ~18 Å and by a ~34° rotation along the Gβ propeller (Fig. 4g). These different locations of the α-helical domains of Gαi and Gαs are not simply due to the different positions of their Ras-like domains. When the two Ras-like domains are superimposed, the α-helical domain of Gαs still rotates farther along the edge of the Gβ propeller, towards the receptor; the rotation angle is ~96° and the displacement distance of the mass centers is ~37 Å (Fig. 4h).
To understand the activation efficacy and the coupling specificity of β1-AR for Gs and Gi, we took advantage of our structural data as the first example of the same Class A GPCR (β1-AR) in complex with two different G proteins (Gs and Gi) and compared all of the interacting residues (Fig. 5 and Supplementary Fig. 2). There are three types of interaction between β1-AR and Gs or Gi. The first are the interactions common between the β1-AR–Gs and β1-AR–Gi structures (Fig. 5 and Supplementary Fig. 2). Ile143 on TM3 of β1-AR interacts with Leu348 of Gαi and the corresponding Leu374 of Gαs on the α5-helix (Fig. 5). Phe147 on ICL2 of β1-AR contacts Ile343 of Gαi and the corresponding Ile369 of Gαs on the α5-helix (Fig. 5). Val230 on TM5, with Ala288 and Leu292 on TM6 of β1-AR, all interact with Leu353 of Gαi and the corresponding Leu379 of Gαs on the α5-helix (Fig. 5). These shared interactions are all hydrophobic and might be part of a common motif for recognition of G proteins by β1-AR. The second set of interactions are those unique to either Gs or Gi (Fig. 5). Ser151 and Thr154 on ICL2 of β1-AR only interact with Gi, but not Gs (Fig. 5). Phe146 on ICL2 of β1-AR interacts with two residues of Gs (Arg366 and Ile369), but only Ile344 of Gi (Fig. 5). Glu233 and Ile241 on TM5 of β1-AR interact with Gs, but not Gi (Fig. 5). Arg284 on TM6 and Ser346 on ICL4 (the TM7/H8 hinge) interact with Gi, but not Gs (Fig. 5). Most of these interactions are polar interactions and might contribute to the coupling specificity for Gs or Gi. The third set of interactions involve the residues on β1-AR that interact with corresponding positions on Gs and Gi but whose amino acid identity differs (Fig. 5). Phe147 on ICL2 of β1-AR interacts with Thr340 on Gi and the corresponding residue, Arg366, on Gs (Fig. 5). Gln237 on TM5 of β1-AR interacts with Ile344 on Gi and Gln370 on Gs (Fig. 5). Ile238 on TM5 of β1-AR interacts with Phe354 on Gi, but Leu380 on Gs (Fig. 5). These altered interactions may also contribute to the coupling specificity. Given that the last two types of interaction involve residues from TM3, ICL2, TM5, TM6 and ICL4 of β1-AR, it is likely that the determinants of coupling specificity on β1-AR are distributed throughout the extensive three-dimensional (3D) interfaces that it forms with G proteins.
Fig. 5. Comparison of the detailed interactions between β1-AR and Gαi and between β1-AR and Gαs.
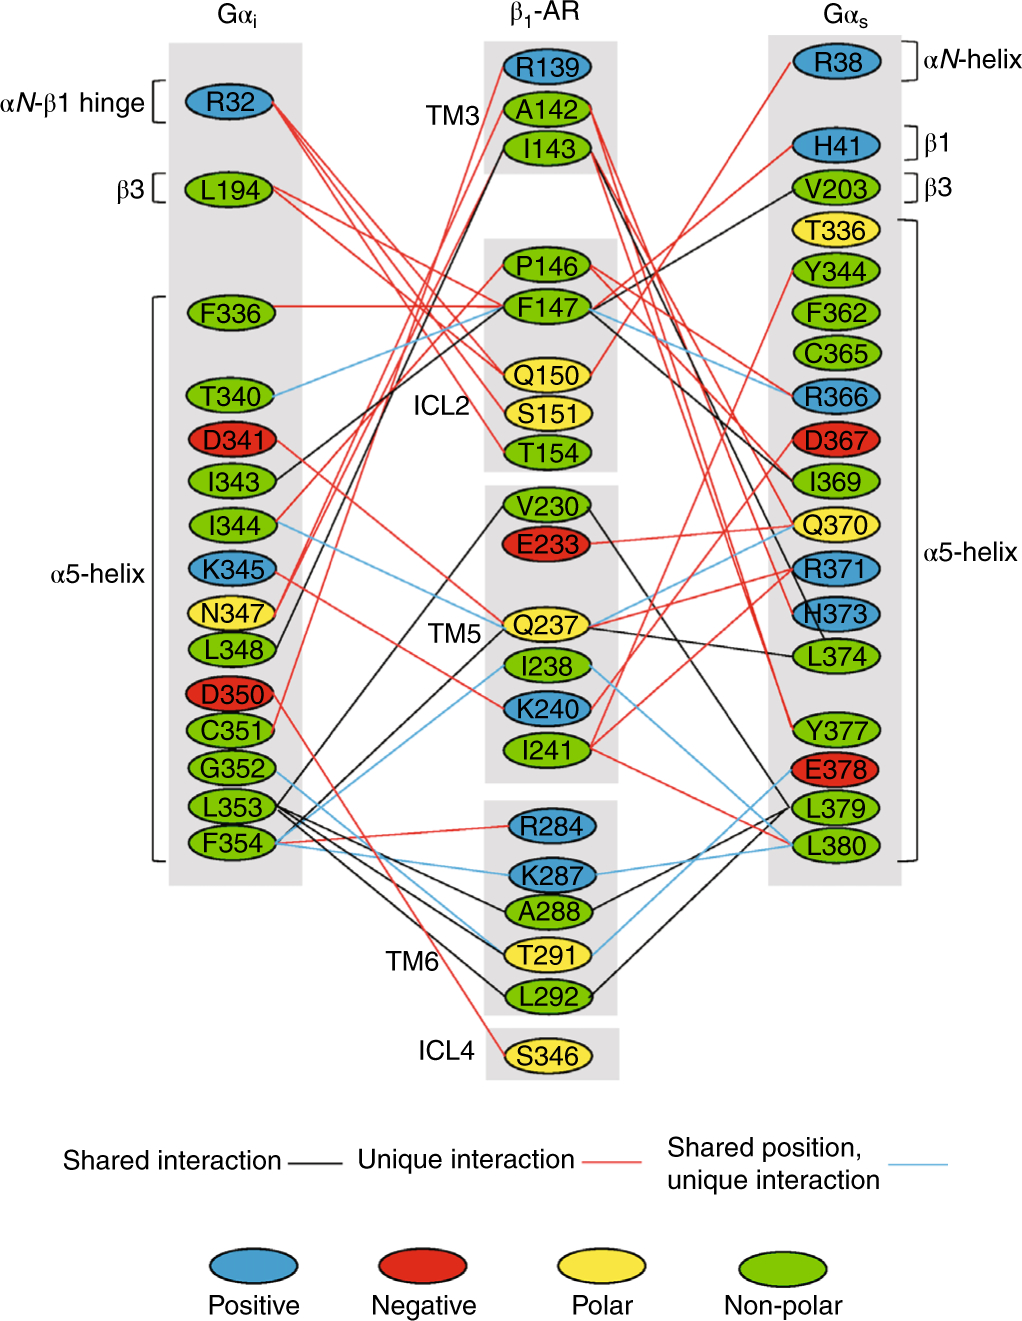
The same (shared) interactions are indicated by black lines. The different (unique) interactions are marked by red lines. The interactions with different amino acid residues but at the corresponding locations are marked by blue lines. The detailed interactions between residues are shown here. Positive charged amino acid residues are colored in blue. Negative charged amino acid residues are labeled in red. Polar amino acid residues are labeled in yellow. Non-polar residues are labeled in green.
Overall β1-AR–G-protein structure dictates interaction modes.
The main GPCR-interacting element on a G protein is the α5-helix17,18,24–27 (Figs. 1, 3 and 4). It has been suggested that the α5-helix of Gα subunits is a major determinant of GPCR–G protein coupling specificity28,29. However, we observe significantly altered modes of interaction between the two G proteins outside the α5-helix interactions. To investigate whether the α5-helix dictates the receptor interaction mode with Gi versus Gs, we replaced the last 11 amino acid residues of Gαi1 with the equivalent residues of Gαs, creating what we call the Gi/s chimera. We should note that the residues at -12 (Ile) and -14 (Asp) from the C-terminal end are the same in Gαs and Gαil, while the residues at -13 (Ile in Gαs and Val in Gαi1) are not involved in the β1-AR interaction11 (Figs. 3 and 5). Hence, this Gi/s chimera changed all residues from the α5-helix that are involved in the β1-AR interaction. We solved the cryo-EM structure of β1-AR in complex with Gi/s at a resolution of 3.9 Å, and the structure revealed a global conformation virtually identical to that of β1-AR–Gi, but different from that of β1-AR–Gs (Fig. 6a–c, Table 1 and Extended Data Fig. 9). The position of the α5-helix in β1-AR–Gi/s is more similar to that of β1-AR–Gi than β1-AR–Gs, with which it shares its amino acid sequence, when β1-ARs in the complexes are superimposed (Fig. 6d).
Fig. 6. Cryo-EM structure of the complex of isoproterenol-bound β1-AR and Gi/s.
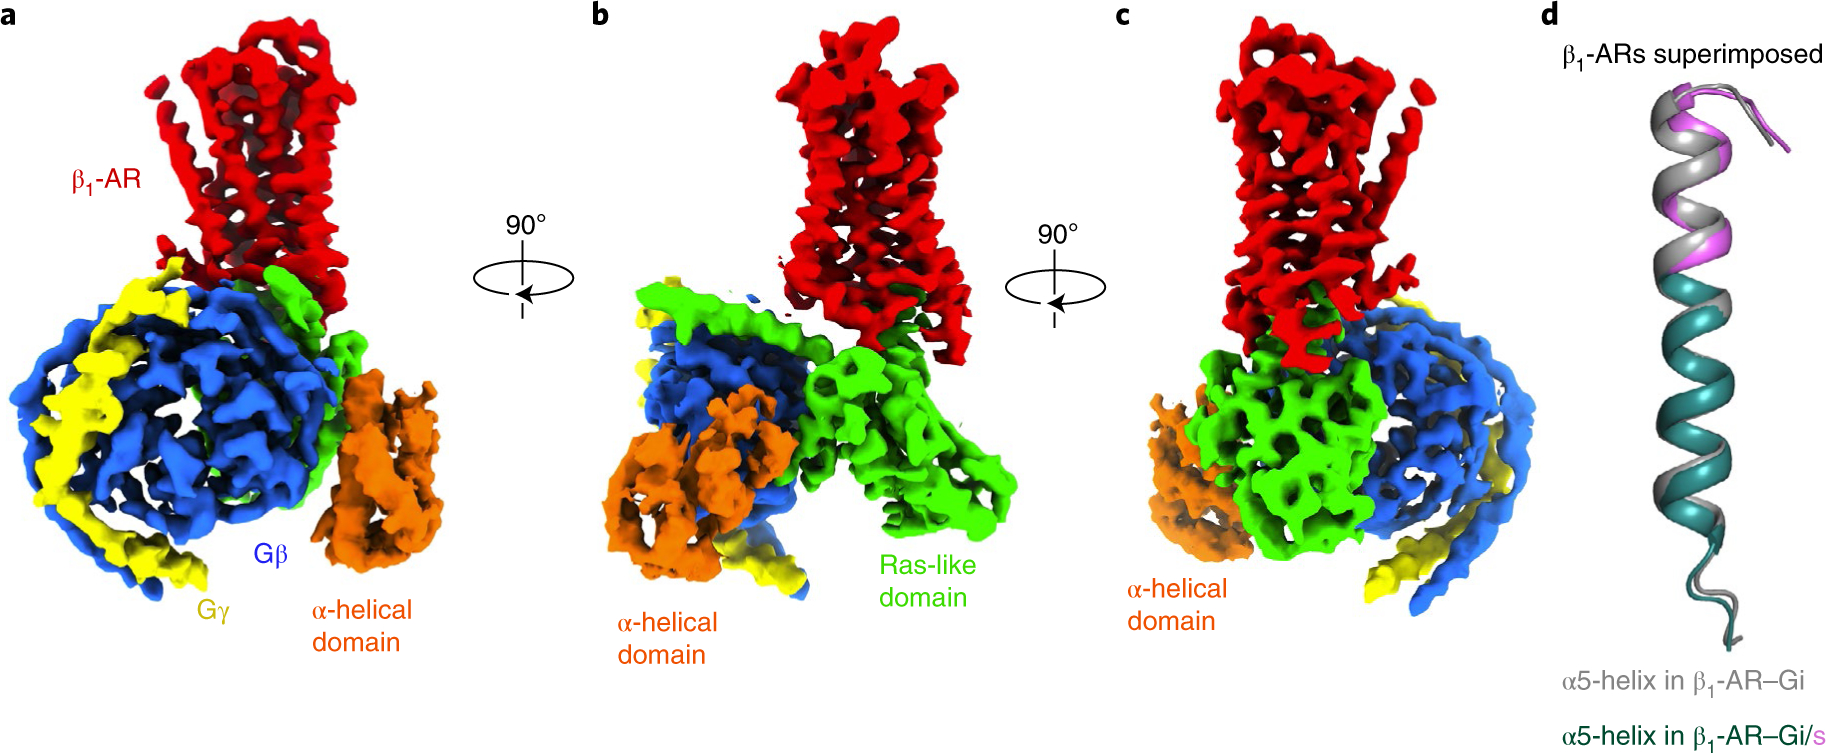
a–c, Cryo-EM density maps, in three views (a, b and c), of the β1-AR-Gi/s complex colored by subunit (β1-AR in red, Gαi/s Ras-like domain in green, Gαi/s α-helical domain in orange, Gβ in blue, Gγ in yellow). d, Comparison of the α5-helices in the β1-AR–Gi complex (gray) and the β1-AR–Gi/s complex (in dark teal with the last 11 amino acid residues from Gαsin violet) when β1-ARs are superimposed.
To probe the importance of the G-protein α5-helix in dictating the activation efficacy and coupling specificity, we employed a nucleotide-exchange assay to measure receptor-mediated activation of G proteins by comparing the initial rate of GTPγS binding10. Consistent with previous results demonstrating that β1-AR activates Gs more selectively and efficiently than Gi (ref. 10), the initial rate of GTPγS binding to Gs is higher than Gi when both are activated by β1-AR (Fig. 7a and Supplementary Fig. 3). Even in the Gi/s chimera possessing the C-terminal residues from Gαs, the activation by β1-AR is still less selective and less efficient than Gs (Fig. 7a). Taken together, our data demonstrate that the overall β1-AR–G-protein complex structure, not the α5-helix alone, dictates β1-AR–G-protein interaction modes and that the different modes of interaction between β1-AR–Gs and β1-AR–Gi contribute to the different activation selectivity and efficiency.
Fig. 7. Functional studies of the receptor regions contributing to the G-protein activating efficacy.
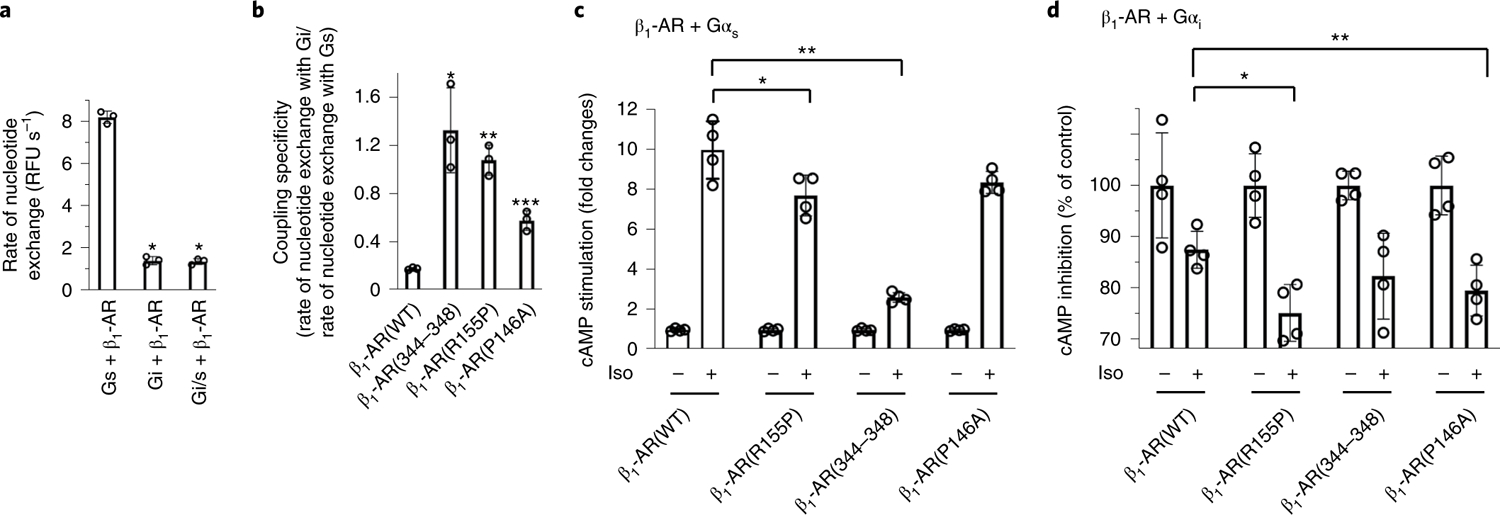
a, Activation of wild-type Gi, wild-type Gs and the chimeric mutant Gi/s by β1-AR as monitored by BODIPY-GTPγS binding. The initial rate of BODIPY-GTPγS binding catalyzed by β1-AR is shown as mean±s.d.of three independent experiments. *P = 0.0001 (Student’s t-test). RFU, relative fluorescence unit. b, The coupling specificity of mutant β1-ARs to Gs or Gi. Activation of wild-type Gi and Gs proteins by mutant β1-ARs was monitored by BODIPY-GTPγS binding. The ratio of the rate of BODIPY-GTPγS binding to Gi over the rate of BODIPY-GTPγS binding to Gs is shown. These ratios are indicative of the selective receptor coupling to Gi versus Gs. Data are shown as mean±s.d.of threeexperiments. *P = 0.005; **P = 0.0002, ***P = 0.001 (Student’s t-test).c,d, Cell-based cAMP assays. HEK cells without functional Gα genes were transfected with either Gαs (c) or Gαi (d). cAMP levels from cells expressing different β1-ARs after stimulation with or without isoproterenol (Iso) were quantified. The cAMP assays were repeated three times, and the data are presented as mean ± s.d.of the three independent experiments. In c, *P = 0.042; **P = 0.00005 (Student’s t-test). In d, *P = 0.01; **P = 0.04 (Student’s t-test). For each receptor construct, the isoproterenol-stimulated cAMP levels were divided by the cAMP levels of the same cells without isoproterenol treatment.
To further examine the contributions of interactions other than the α5-helix to G-protein activation efficacy and coupling specificity, we assayed the relative activation of Gs and Gi by β1-AR mutants as defined by the ratio of the initial rates of GTPγS binding to different G proteins10. As shown in Fig. 5, ICL2 of β1-AR is an important interacting element with G proteins that differs between Gi and Gs. Further analysis identified that ICL4 (the TM7/H8 linker) of β1-AR interacts differently with the α5-helix cap of Gi and Gs (Fig. 5). Thus, mutations were introduced to ICL2 or ICL4 to generate the following specific mutants: β1-AR(P146A), β1-AR(R155P) and β1-AR(344–348) (C344T, R345I, S346F, P347N, D348Q). To avoid potential gross conformational disruptions of the receptor by these mutations and to investigate whether we could generate mutant receptors with changed relative G-protein activation efficacy, we conservatively changed the residues to the ones used by another related GPCR, human α2A-AR, which couples to Gi. Although wild-type β1-AR preferred Gs over Gi (with an approximately five fold lower rate of BODIPY-GTPγS binding to Gi than Gs), all the receptor mutants favored Gi coupling over Gs coupling (Fig. 7b). For wild-type β1-AR, the ratio of the rate of GTPγS binding to Gi over the rate of GTPγS binding to Gs was ~0.17 (Fig. 7b). The mutant receptors had higher ratios, reflecting favored activation of Gi over Gs, when compared with wild-type β1-AR (Fig. 7b). To validate the in vitro biochemical analysis of these mutants, we also measured their activity using an orthogonal cell-based cAMP assay. We used HEK cells with all Gα genes depleted to separately study the Gs- or Gi-mediated cAMP response30. When Gαs and β1-ARs were re-expressed in these cells, β1-AR(R155P) and β1-AR(344–348) showed decreased Gs-mediated cAMP stimulation comparing with wild-type β1-AR (Fig. 7c). When Gαi1 and β1-ARs were transfected into these cells, β1-AR(R155P) and β1-AR(P146A) displayed increased Gi-mediated cAMP inhibition compared with wild-type β1-AR (Fig. 7d). Together, these functional studies support our structural interpretation, and demonstrate that multiple distinct regions of the receptor contribute to the determinants of G-protein activating efficacy31,32.
Discussion
Previous structural comparisons of different pairs of GPCR–Gs complexes and GPCR–Gi complexes suggested that the outward movement of the intracellular end of TM6 was less in the Gi complex than in the Gs complex18,33. However, in our case of the same GPCR with Gs or Gi, the outward movement of the intracellular end of TM6 is the same in both complexes (Fig. 4a). Also, when different complexes of the GPCR–Gs structures and GPCR–Gi structures were compared, it was suggested that the C-terminal end of Gs and Gi were in different positions within the complexes18,33. Again, in our case with the same GPCR, the C-terminal ends of Gs and Gi are in the same place (Fig. 4c). This highlights the essentiality of using the same GPCRs and/or G proteins for structural comparative analyses34.
Previous studies of the structures of the GPCR and G protein complexes have revealed critical conformational changes during GPCR activation. Here we have focused on the features of the conformational changes of G proteins during their activations. We report here the new observation of the separation of Gβγ and the Ras-like GTPase domain of Gαi and Gαs during their activation by GPCRs (Figs. 2a and 4e,f and Extended Data Fig. 7). Furthermore, there is an expansion of the guanine nucleotide-binding pocket due to the separation (or loosening) of segments surrounding the pocket within the Ras-like domains (Figs. 2a and 4e,f and Extended Data Fig. 7). Intriguingly, this does not change the interaction between the Ras-like domain and Gβγ. The Gβγ-interacting parts on the Ras-like domain (the αN and α2 helices) are moving with Gβγ, while the other parts of the Ras-like domain are moving in opposite directions (Fig. 2a). The expansion of the GDP-binding pocket is also seen in other GPCR–G protein complex structures (Extended Data Fig. 10b). When Gβγ subunits are aligned (Extended Data Fig. 10b), the Ras-like domains of Gi are similar in all structures. Furthermore, the distances between the mass centers of Gβγ and of the Ras-like domains of Gαi are similar in all structures (Extended Data Fig. 10b). Moreover, the conformation around the G203 of Gαi is similar in all complexes (with or without the G203A mutation), except for the rhodopsin–Gi structure (Extended Data Fig. 10e). Therefore, the described conformational changes here are probably parts of a general mechanism of G protein activation by GPCRs.
Some of the conformational changes during the heterotrimeric G protein activation process are similar to those observed during the activation of the Ras-superfamily small GTPases by their guanine-nucleotide exchange factors (GEFs)35. One major difference between the GPCR–G protein system and the GEF–Ras-family GTPase system is that GPCRs do not directly interact with the GDP-binding pocket, rather acting from a distance. On the other hand, GEFs directly contact the nucleotide-binding pocket of small GTPases35. However, these two systems share some conformational changes during the activation process. For the activation of Ras by SOS1 protein, SOS1 causes structural changes on both the Switch I and Switch II regions, including the movement of Switch I away from the GDP-binding pocket via steric hindrance and by rearrangement of the Switch II region36. In this rearrangement, a Glu residue on Switch II makes a salt bridge with Lys on the P-loop35,36. In the β1-AR–Gi complex, Switch I (Linker 2) also moves away from the GDP-binding pocket as part of the rotation of the α-helical domain (Extended Data Fig. 5). In the Gαi1 (GDP)Gβγ trimer structure, Lys46 on the P-loop points towards and is involved in the interaction with the β-phosphate of GDP13,19,22. On the other hand, within the complex of β1-AR–Gi, Lys46 rotates and forms a salt bridge with Asp200 in Switch II (Fig. 2d). Asp200 is part of a conserved sequence motif DXXG found in all regulatory GTP-binding proteins37. This conformational change might be common to all families of G proteins during their activations. Together, the movement of Switch I away from the GDP-binding pocket and the rearrangement of Switch II are shared mechanistic steps by the GPCR–G protein system and the GEF–Ras-family GTPase system.
From the structural studies of the GPCR–G-protein complexes, we propose the following general model for the activation of G proteins by GPCRs. Upon the interaction of a G protein with a GPCR, the GPCR induces a rotation and translocation of the α5-helix of the G protein (Fig. 2b). In all GPCR–G protein structures, the α5-helix is the major structural element on a G protein that interacts with a GPCR, and undergoes helix translocation, rotation and extension (Fig. 3a). The new position of the α5-helix is stabilized by new interactions with the receptor and with β6 of Gα (Fig. 3). The rotation of the α5-helix breaks the interaction between the α5-helix and the α1-helix, and the interaction between the N and C termini of Gα (Fig. 2c). This leads to the rearrangement of the adjacent P-loop and the rotational opening of the α-helical domain of the G protein (Fig. 2c). The new position of the α1-helix is partly stabilized by the new interaction between the α1-helix and β3 (part of Switch II; Fig. 2d). Given the major contribution of the β-phosphate of GDP to the nucleotide-binding affinity to G proteins, and the essential roles of the P-loop and Switch I (also named Linker 2) in coordinating the β-phosphate, these structural changes will greatly reduce the affinity of GDP to the G protein. Furthermore, the α5-helix conformational changes prompt the structural changes in the β6-α5 loop (the TCAT motif) leading to the reduced affinity for the purine ring of GDP and the eventual release of GDP (Fig. 2c). Future investigations are needed to identify and characterize the catalytic residue(s) of GPCRs in catalyzing the guanine-nucleotide exchange on G proteins.
Online content
Any methods, additional references, Nature Research reporting summaries, source data, extended data, supplementary information, acknowledgements, peer review information; details of author contributions and competing interests; and statements of data and code availability are available at https://doi.org/10.1038/s41594-021-00679-2.
Methods
Expression and purification of β1-AR, Gαi, Gβ1 and Gγ2.
The β1 -AR protein was purified as previously described11,12. The turkeyβ1-AR construct β1-AR(H12) used in this study was similar to the functional β1-AR(H0) construct described previously with some modifications, but different from the thermostabilized turkey β1-AR used in previous X-ray crystal structural studies11,12. A signal peptide, FLAG tag, PreScission protease cleavage site and T4 lysozyme were fused to the N terminus with a double-alanine linker, and another PreScission protease cleavage site and His6 tag were added to the C terminus11,12. Two point mutations, Arg68Ser and Met90Val, were introduced38. The pharmacology of turkeyβ1-AR had been well characterized and is comparable to human β1-AR38–40. β1-AR was expressed and purified from Sf9 insect cells grown in ESF 921 protein-free medium (Expression Systems). Cells were grown to two to three million cells per ml before 200 ml of baculovirus was added for infection. After 48 h, cells were collected by centrifugation, flash-frozen in liquid nitrogen and stored at −80 °C until use. For membrane preparation, cell pellets were lysed by sonication in a buffer containing 20 mM Tris, pH 8, 1 mM EDTA and protease inhibitor cocktail (Sigma) and washed once more using the same buffer. Purified membranes were resuspended in 20 mM Tris, pH 8, 0.2 mM EDTA and protease inhibitor cocktail and flash-frozen in liquid nitrogen and stored at −80 °C. For protein purification, membrane preparations were first thawed in 20 mM Tris, pH 8, 350 mM NaCl and protease inhibitor cocktail, then 1 mM isoproterenol (Sigma) was added. The mixture was stirred for 1 h at 4°C and the membranes were then solubilized in 20 mM Tris, pH 8, 350 mM NaCl, 1% n-dodecyl-β-D-maltopyranoside (DDM, Anatrace), 1 mM isoproterenol and protease inhibitor cocktail for 1 h at 4°C. (To reduce the oxidation of isoproterenol, fresh isoproterenol solutions were prepared every time, and the experiments were carried out on ice or at 4°C in solutions at pH 7.0.) The DDM concentration was then reduced to 0.5% by adding an equal volume of 20 mM Tris, pH 8, 350 mM NaCl and 1 mM isoproterenol and the mixture was stirred for another 1 h at 4 °C. The preparation was clarified by ultracentrifugation at 142,000g for 30 min at 8 °C. The supernatant was then incubated with Ni-NTA resin (Qiagen) with stirring at 4 °C with 8 mM imidazole. After 4 h, the resin was collected by centrifugation and washed three times with 20 mM Tris, pH 8, 500 mM NaCl, 0.02% DDM, 1 mM isoproterenol and 8 mM imidazole and once with 20 mM Tris, pH 8, 100 mM NaCl, 0.02% DDM, 1 mM isoproterenol and 8 mM imidazole. The β1-AR was then eluted from the resin with 20 mM Tris, pH 8, 100 mM NaCl, 0.02% DDM, 1 mM isoproterenol and 120 mM imidazole. The elution was concentrated and further purified by size-exclusion chromatography using a Superdex 200 Increase 10/300 column (GE Healthcare) pre-equilibrated with 20 mM Tris, pH 8, 100 mM NaCl, 0.02% lauryl maltose neopentyl glycol (LMNG, Anatrace) and 1 mM isoproterenol. Purified β1-AR was concentrated to 4 mg ml−1 and either used immediately for complex assembly or flash-frozen in liquid nitrogen and stored at −80 °C.
G proteins were purified as previously described11,12. The rat Gαi1 (G203A) was purified from Escherichia coli strain BL21(DE3). This Gαi1 construct had an N-terminal His6 tag that was removable through a PreScission protease cleavage site. The reason for using Gαi1 (G203A) mutant was that this mutation decreased the release of Gα from Gβγ, without changing the Gαβγ trimer structure, and increased the formation of the β1-AR–Gi complex19,23. Cells were grown in 2× YT medium at 37°C until reaching an optical density at 600 nm of 0.6. Protein expression was then induced by 75 μM IPTG and continued for 16 h at 16°C. Cells were collected by centrifugation, flash-frozen in liquid nitrogen and stored at −80 °C. For protein purification, cell pellets were thawed in a lysis buffer containing 20 mM HEPES, pH 7, 150 mM NaCl, 10% glycerol, 5 mM β-mercaptoethanol, 2 mM MgCl2, 1 mM EDTA, 10 μM GDP, 0.1 mg ml−1 lysozyme, 0.2 mM PMSF and protease inhibitor cocktail and further lysed by sonication. Cell debris was removed by centrifugation at 20,000g for 40 min at 4°C. The supernatant was then collected and incubated with Ni-NTA resin with stirring for 1 h at 4°C. The resin was then washed four times with 20 mM HEPES, pH 7, 150 mM NaCl, 10% glycerol, 5 mM β-mercaptoethanol, 2 mM MgCl2, 1 mM EDTA and 10 μM GDP. Gαi was concentrated and further purified by size-exclusion chromatography using a Superdex 200 Increase 10/300 column pre-equilibrated with 20 mM HEPES, pH 7, 150 mM NaCl, 10% glycerol, 5 mM β-mercaptoethanol, 1 mM MgCl2, 1 mM EDTA and 20 μM GDP. Purified Gαi was concentrated to 6 mg ml−1, flash-frozen in liquid nitrogen and stored at −80 °C.
Bovine Gβ1 and bovine His6-tagged soluble Gγ2 (C68S) were co-expressed and purified from Sf9 insect cells11. A 25-ml sample of each baculovirus was co-infected into Sf9 cells when the insect cell culture reached a cell density of three million cells per ml. At 48 h post infection, cells were collected by centrifugation, flash-frozen in liquid nitrogen and stored at −80 °C. The cell pellets were thawed in 25 mM HEPES pH 7, 150 mM NaCl, 10% glycerol, 2 mM β-mercaptoethanol, 5 mM MgCl2 and protease inhibitor cocktail. The cells were lysed by sonication, then the cell debris was removed by centrifugation at 142,000g for 30 min. The supernatant was collected and incubated with Ni-NTA resin with stirring for 1.5 h at 4°C. The resin was then washed three times with 25 mM HEPES pH 7, 150 mM NaCl, 10% glycerol, 2 mM β-mercaptoethanol and 25 mM imidazole, and Gβ1γ2 was eluted as a complex with 25 mM HEPES pH 7, 150 mM NaCl, 10% glycerol, 2 mM β-mercaptoethanol and 250 mM imidazole. The eluted protein was concentrated and further purified using a Superdex 200 Increase 10/300 column pre-equilibrated with 25 mM HEPES pH 7, 150 mM NaCl and 2 mM β-mercaptoethanol. Purified Gβ1γ2 protein was concentrated to 8 mg ml−1 flash-frozen in liquid nitrogen and stored at −80 °C.
Protein complex assembly and purification.
To assemble the β1-AR–Gi complex, Gαi and Gβ1γ2 were mixed at a 1:1 molar ratio in the presence of 2 mM MgCl2, similar to the method previously described for the β1-AR–Gs complex11. The mixture was incubated for 30 min at room temperature and then mixed with β1-AR in a 1.2:1 ratio. The mixture was diluted with 160 μl of buffer containing 10 mM HEPES pH 7, 100 mM NaCl, 0.1 mM tris (2-carboxyethyl) phosphine (TCEP), 0.02% LMNG, 1 mM isoproterenol and 2 mM MgCl2 to bring the volume to 600 μl. This mixture was incubated for another 30 min at room temperature before 0.4 U of apyrase (Sigma) was added. After additional overnight incubation with apyrase at 4°C, the mixture was centrifuged at 16,000g for 10 min to remove any precipitants. The supernatant was then loaded onto a Superdex 200 Increase 10/300 column pre-equilibrated with 10 mM HEPES pH 7, 100 mM NaCl, 0.1 mM TCEP, 0.02% LMNG and 40 μM isoproterenol. The elution fractions from a single peak containing pure β1-AR–Gi complex were concentrated to ~1.5 mg ml−1 and used directly for making cryo-EM grids.
To assemble the β1-AR–Gi/s complex, Gαi/s and Gβ1γ2 were mixed at a 1:1 ratio in the presence of 2 mM MgCl2. The mixture was incubated for 15 min at room temperature and then mixed with β1-AR to a final ratio of 1:1.2:1.2 receptor to G protein and diluted to a final volume of ~500 μl in a buffer containing 50 mM HEPES pH 8, 150 mM NaCl, 100 μM TCEP and 0.01% LMNG. This mixture was incubated at room temperature for an additional 15 min, at which point 0.4 U of apyrase (Sigma) was added. The final mixture was kept at 4 °C for at least 48 h at which time the reaction was spun at 13,000g for 10 min to remove any precipitants. The supernatant was loaded onto a Superdex 200 Increase 10/300 column pre-equilibrated with 50 mM HEPES pH 8, 150 mM NaCl, 100 μM TCEP, 0.01% LMNG and 40 μM isoproterenol. The elution fractions from a single peak containing pureβ1-AR–Gi/s complex were concentrated to 0.35–0.5 mg ml−1 and used directly for making cryo-EM grids.
Cryo-electron microscopy data collection.
Cryo-EM data collection was performed as previously described11. Protein complex (4 μl) was applied to glow-discharged 400-mesh gold Quantifoil R1.2/1.3 holey carbon grids (Quantifoil Micro Tools) and then vitrified using a Vitrobot Mark IV system (Thermo Fisher Scientific/FEI). Images were collected on a Titan Krios cryo-electron microscope (Thermo Fisher Scientific/FEI) operated at an accelerating voltage of 300 kV and a nominal magnification of ×105,000 using a Gatan K2 Summit direct electron detector (Gatan) with SerialEM 3.7 program. The β1-AR–Gi complex images were collected in super-resolution mode with a pixel size of 0.548 Å, while the β1-AR–Gi/s images were collected in counting mode with a pixel size of 1.0735 Å. For the β1-AR–Gi complex, 2,815 images were recorded with an accumulated dose rate of 67 e− Å−2 over 40 frames per video stack. For the β1-AR–Gi/s complex, 3,284 images were recorded with an accumulated dose rate of 71 e− Å−2 over 50 frames per movie stack41.
Image processing and 3D reconstructions.
The β1-AR–Gi complex video frames were Fourier-cropped, aligned with whole frame and local correction algorithms by Motioncor2 v1.2.1 in Relion3 v3.0, resulting in a calibrated pixel size of 1.0735. Low-quality micrographs displaying excess drift or ice contamination were removed manually, resulting in 2,680 micrographs for processing. The β1-AR–Gi/s complex videos were aligned with whole frame and local correction algorithms by Motioncor2 v1.2.1 in Relion3 v3.0. Low-quality micrographs displaying excess drift or ice contamination were removed manually, resulting in 2,499 micrographs for processing. The effects of the contrast-transfer function were estimated with CTFfind v4.1.1042. Approximately 1,000 particles from the β1-AR–Gi dataset were manually selected to generate initial templates for automatic particle picking with Relion, resulting in 1,935,000 particles43. A 2D classified subset of particles was used to generate an ab initio reconstruction in CryoSparc v2.11.0. Multiple rounds of heterogeneous refinement and non-uniform (NU) refinement in CryoSparc v2.11.0 were used to eliminate false positives or damaged particles, resulting in a final stack of 230,000 particles44,45. This final stack was subjected to one round of Bayesian polishing and CTF refinement procedures in Relion v3.0. The resulting final map generated through NU refinement in CryoSparc v2.11.0 gave a resolution of 3.0 Å using the 0.143 Fourier shell correlation (FSC) criterion. Soft masks were generated that encompassed either β1-AR or the G protein in CryoSparc v2.11.0 and used for local refinement. Local refinement of β1-AR and the G protein resulted in resolutions of 3.2 Å and 2.8 Å, respectively, using the 0.143 FSC criterion. The β1-AR and the G protein locally refined maps were then subjected to density modification in Phenix v1.17.1–366046, resulting in maps with estimated resolutions of 3.0 Å and 2.8 Å, respectively, using the FSCref criterion of 0.5. A composite map was generated from the focused refined maps using phenix. combine_focused_map in Phenix v1.17.1–366047.
Laplacian-of-Gaussian (LoG)-based picking in Relion v3.0 was used for automatic particle picking of the β1-AR–Gi/s data using a minimum and maximum LoG filter of 76 and 119 Å, resulting in 6,013,000 starting particles. A 2D classified subset of particles was used to generate an ab initio reconstruction in CryoSparc v2.11.0. Multiple rounds of heterogeneous refinement and NU refinement in CryoSparc v2.11.0 were used to eliminate false positives or damaged particles, resulting in a final stack of 144,000 particles44,45. The resulting final map generated through NU refinement in CryoSparc v2.11.0 gave a resolution of 3.86 Å using the 0.143 FSC criterion. Soft masks were generated that encompassed either β1-AR or the G protein in CryoSparc v2.11.0 and used for local refinement. Local refinement of the G protein resulted in resolutions of 3.6 Å using the 0.143 FSC criterion. The consensus map and the locally refined map were then subjected to density modification in Phenix v1.17.1–366046, resulting in maps with estimated resolutions of 3.9 Å and 3.7 Å, respectively, using the FSCref criterion of 0.5. A composite map was generated from the consensus map and a focused refined map using phenix. combine_focused_map in Phenix v1.17.1–366047.
Modeling and refinement.
The initial models of β1-AR and Gαi or Gαi/s–Gβ1γ2 were derived from the crystal structures of inactive β1-AR (PDB 4GPO) and an inactive GαiGβ1γ2 complex (PDB 1GG2), respectively. The models were manually docked into the EM density map using Chimera v1.1448. The models were manually rebuilt to fit the density in COOT v0.8.9.249. Density corresponding to the α-helical domain of Gαi was insufficient for manual building, so the α-helical domain (residues 66–176) from PDB 1GG2 was manually docked into the density and rigid-body fitted in COOT v0.8.9.2. Iterative manual building and adjustment and rigid body and real-space refinement were performed in COOT v0.8.9.249. All final models were subjected to global refinement and minimization in real space using the module phenix.real_space_refine in PHENIX v1.17.1–366047. The model statistics was validated using MolProbity50.
BODIPY-GTPγS/GDP exchange assay.
Wild-type Gαs, wild-type Gαil or mutant Gαi/s and Gβγ together with GDP in a 1:1:1 molar ratio were pre-incubated on ice for 30 min. To 100 μl of exchange buffer (10 mM HEPES, pH 7, 100 mM NaCl, 0.1 mM TCEP, 0.02% LMNG, 1 mM EDTA and 10 mM MgCl2) were added 200 nM Gαi, Gβγ and GDP, 2 μM β1-adrenergic receptor, 1 mM isoproterenol and 1 μM BODIPY fluorescent GTPγS (Invitrogen). The change in relative fluorescence units was measured every 15 s. The data were fit to exponential association curves using GraphPad Prism 851.
Expression and purification of mutant β1-AR proteins.
The recombinant baculovirus used for HEK293 cell transduction was generated by subcloning the β1-AR(H12) sequence including a C-terminal His10 tag in the pEZT-BM vector with the following mutations in the receptor sequence: β1-AR(P146A), β1-AR(R155P) and β1-AR(344–348) (C344T, R345I, S346F, P347N, D348Q)11,12. When the ICL4 amino acid sequences were aligned among all the adrenergic receptors (including β1, β2, β3, α1A, α1B, α1D, α2A, α2B and α2C), the ICL4 sequences showed distinct subfamily features. All Gs-coupled β-ARs have the sequences of Cys-Arg-Ser. All Gi-coupled α2-ARs have Thr-Ile-Phe-Asn. All Gq-coupled α1-ARs have Pro-Cys-Ser-Ser. Previous mutagenesis studies in other GPCRs have shown that amino acid residues in these positions affected the GPCR and G protein coupling. Therefore, to be conservative, we mutated these residues in β1-AR to the sequences in α2-ARs. The nucleotide sequences of all constructs were confirmed by DNA sequencing by GenScript. A working stock of BacMam with each mutant was produced by generation of P0 BacMam β1-AR(H12) stock in Sf9 cells with bacmid transfection and two subsequent BacMam β1-AR(H12) amplifications in Sf9 cells (Expression Systems). HEK293 cells were grown at 37°C with 8% CO2 until cells reached a density of 2.5 to 3 × 10⁶ cells per ml, at which point transduction of each mutant was performed. Production runs were carried out in shake flasks with working volumes of 800 ml and a final volume of amplified virus that was <10% of the working volume. In production runs, sodium butyrate was added to a final concentration of 10 mM after 24 h, at which point cells were moved to 30°C. At 72 h post infection, culture broth samples were centrifuged for 10 min to collect the cell pellets. The cell pellets were washed twice with ice-cold PBS and flash-frozen for further use. Purification of the mutant β1-AR proteins was then the same as that for β1-AR.
Co-immunoprecipitation.
Gα-depleted HEK293 cells (the genes for all Gα subunits expressed in HEK cells were mutated using the CRISPR/Cas system)30 were transfected with Gαs or Gαi1, as well as GFP-tagged wild-type β1-AR. Gα-depleted HEK293 cells lack GNAS, GNAL, GNAI1, GNAI2, GNAI3, GNAQ, GNA11, GNA12, GNA13, GNAO1, GNAZ, GNAT1 and GNAT2 (fullΔGα)30. Co-immunoprecipitation and western blots were performed as previously described52,53. Cells in 10-cm plates were washed with ice-cold PBS (pH 7) and detached from the plate by incubation with 3 ml of PBS containing 5 mM EDTA. After centrifugation, the cell pellet was resuspended in 1 ml of radioimmunoprecipitation assay (RIPA) buffer (150 mM NaCl, 50 mM Tris, pH 8.0, 1 mM EDTA, 1% Triton X-100 and protease inhibitors). The cells were sonicated and centrifuged at 16,400g for 20 min. The supernatant was transferred to a fresh tube and incubated with 15 μl of anti-GFP nanobody beads overnight at 4°C. The supernatant was removed after centrifugation. The pellet was washed four times with RIPA buffer. The proteins were eluted with SDS sample buffer and subjected to SDS–PAGE and western-blot analyses. Anti-Gαs (1:1,000 dilution), anti-FLAG (1:400 dilution) and anti-GFP (1:500 dilution) antibodies were obtained from Millipore, Sigma and Santa Cruz Biotechnology, respectively.
cAMP assay.
Gα-depleted HEK293 cells (the genes for all Gα subunits expressed in HEK cells were mutated using the CRISPR/Cas system)30 were transfected with Gαs or Gαi1, as well as wild-type or mutant β1-ARs. The cells were serum-starved overnight and then pre-incubated with culture medium buffered with 0.5 mM 3-isobutyl-1-methylxanthine (IBMX) for 30 min at 37°C (ref. 11). The cells were washed twice with Hank’s balanced salt solution containing 25 mM HEPES-NaOH (pH 7.4) and 0.1% BSA and incubated in buffer containing 0.5 mM IBMX (Sigma) for 20 min at room temperature. For the Gs-mediated cAMP stimulation assay, cells were treated with 10 nM isoproterenol for 10 min. For the Gi-mediated cAMP inhibition assay, cells were first stimulated with 20 μM forskolin for 20 min at 37°C and then 10 nM isoproterenol for 10 min. The reaction was terminated by aspiration of medium and immediately treated with 0.1 M HCl for 10 min at room temperature. The cells were collected by centrifugation and the supernatant was used to determine the cAMP concentration in triplicate with a Direct Cyclic AMP Enzyme Immunoassay kit (Enzo Life Sciences). The cAMP assays were repeated three times, and the data are represented as mean ± s.d. of three independent experiments.
Quantification and statistical analysis.
The cAMP assays were repeated three times, and the data are represented as mean ± s.d. of the three independent experiments. The statistical analysis was done using the Student’s t-test as indicated in the figure legend. Cryo-EM data collection and refinement statistics are listed in Table 1.
Reporting Summary.
Further information on research design is available in the Nature Research Reporting Summary linked to this Article.
Extended Data
Extended Data Fig. 1. Summary of cryo-EM data processing.
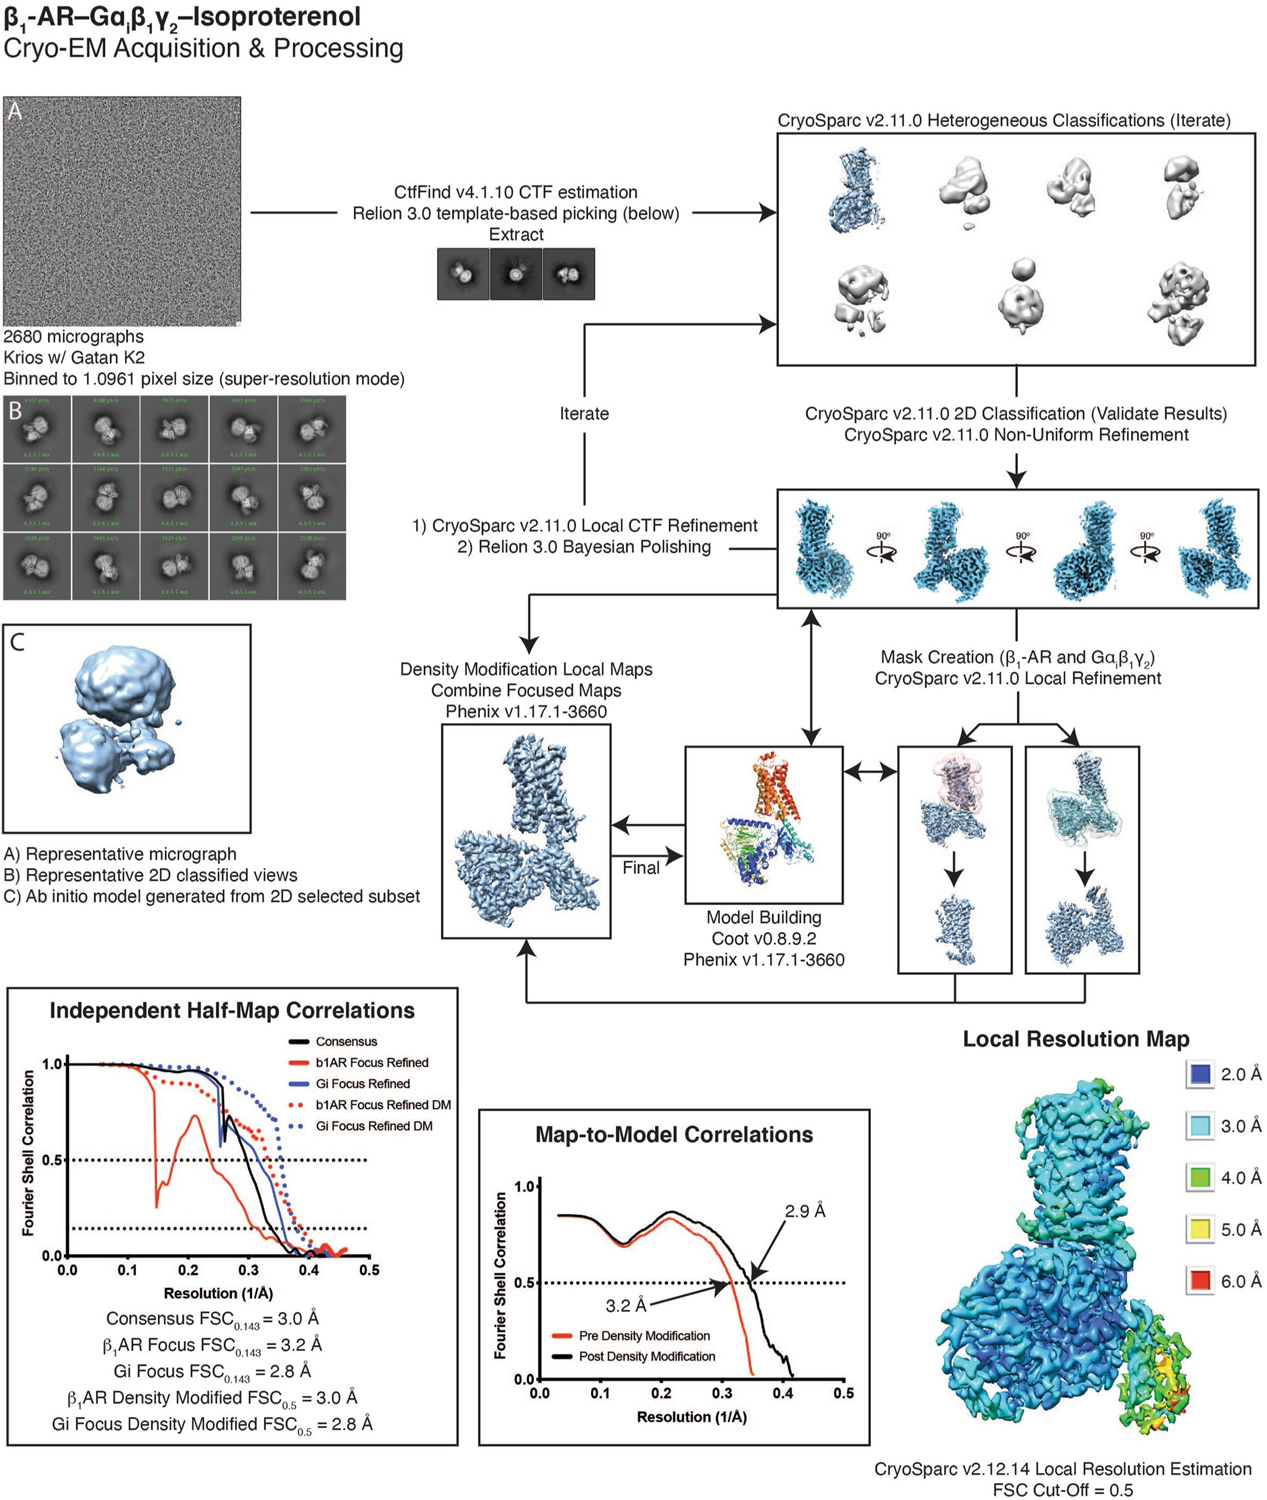
Details are found in the methods. In short, 2680 micrographs were collected on a Krios equipped with Gatan K2 direct electron detector. Heterogeneous refinement was used to remove junk, with 2D classification as a form of verification. Once an ideal particle stack was identified, subsequent rounds of heterogeneous refinement were combined with local CTF refinement and Bayesian polishing to further improve the map. Local refinements of b1-AR and Gi helped bring out features in the periphery of the structure. The model was built into the consensus and local refinements, and then used to generate a composite map that was used for the final round of real-space refinement. Overall, even in the consensus structure, almost all of the model was well represented by density. The alpha-helical domain was less well resolved due to flexibility, but intermediate resolution rigid-body docking was possible.
Extended Data Fig. 2. Per residue model-map correlation coefficient plots.
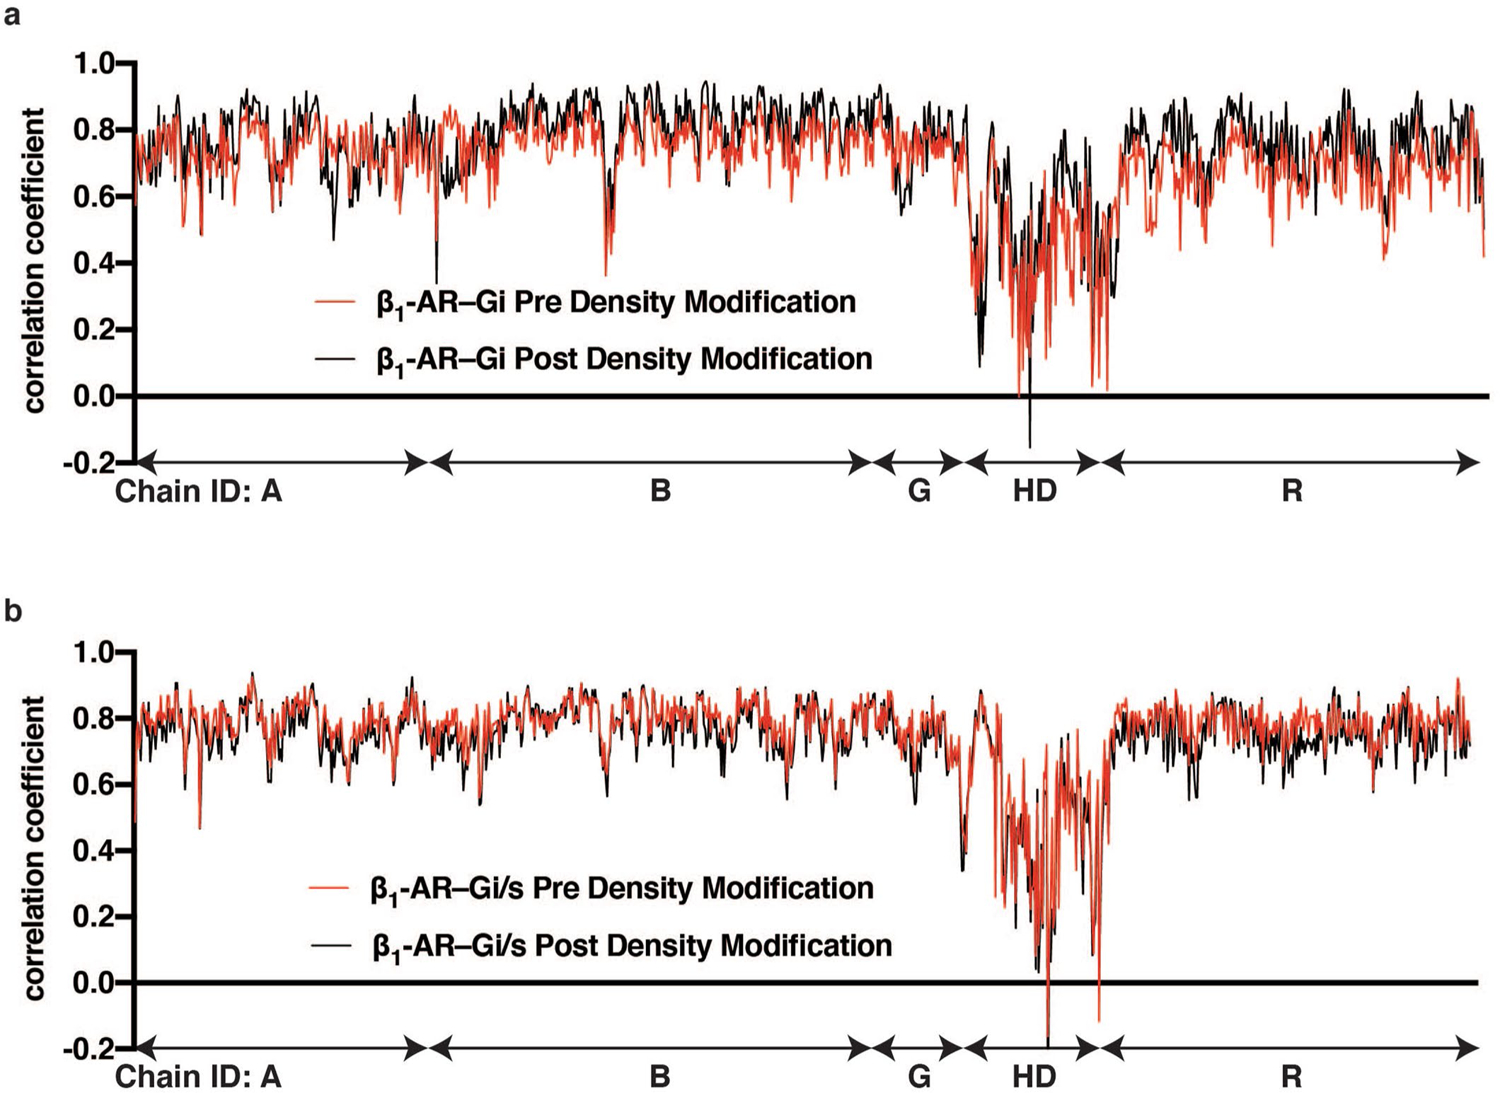
Per residue model-map correlation coefficient was calculated using phenix. real_space_refine with maps pre (red line) and post (black line) density modification. In both β1-AR–Gi complex and β1-AR–Gi/s complex models, chain A is the Ras-like domain of Gα, Chain B is Gβ1, Chain G is Gγ2, Chain HD is the helical domain of Gα, and Chain R is β1-AR. Comparing model-map correction coefficient pre and post density modification, especially for β1-AR–Gi complex, density modification shows a clear improvement across all chains.
Extended Data Fig. 3. Comparison of the inactive β1-AR receptor with the activated β1-AR in complex with Gi.
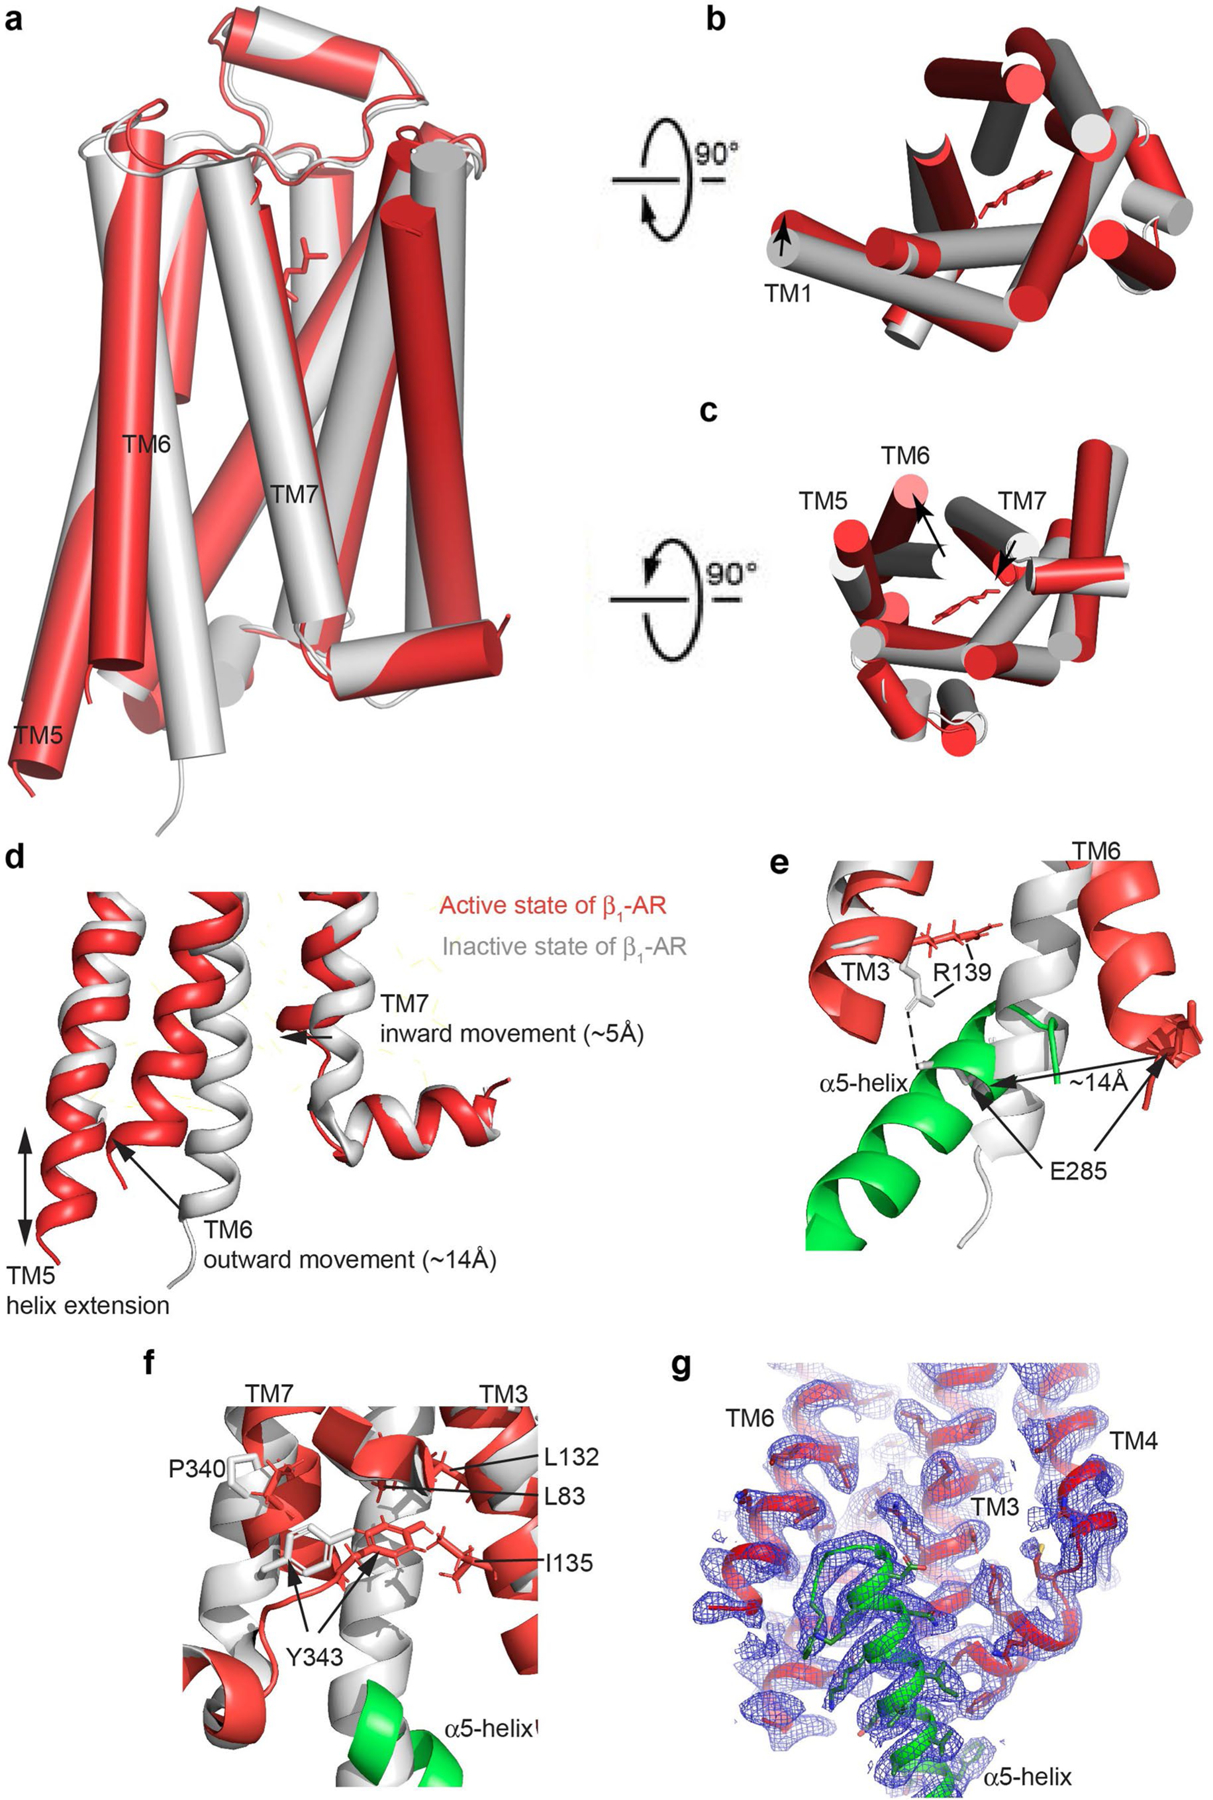
(a-c) Side (left), extracellular (top right) and cytoplasmic (bottom right) views of the inactive β1-AR (grey)(PDB code 4GPO) compared to the activated β1-AR in complex with Gi. (d) Structural comparison of the Gi α5-helix binding region to show the major conformational changes of β1-AR. (e) The ionic lock between Arg139 and Glu285 is broken in the active state. (f) Tyr343 packs against Leu132 and Ile135 in the active state. (g) Cryo-EM density map of the Gi α5-helix binding region (contoured at 1.2 σ level).
Extended Data Fig. 4. Isoproterenol occupancy in orthosteric binding pocket of β1-AR.
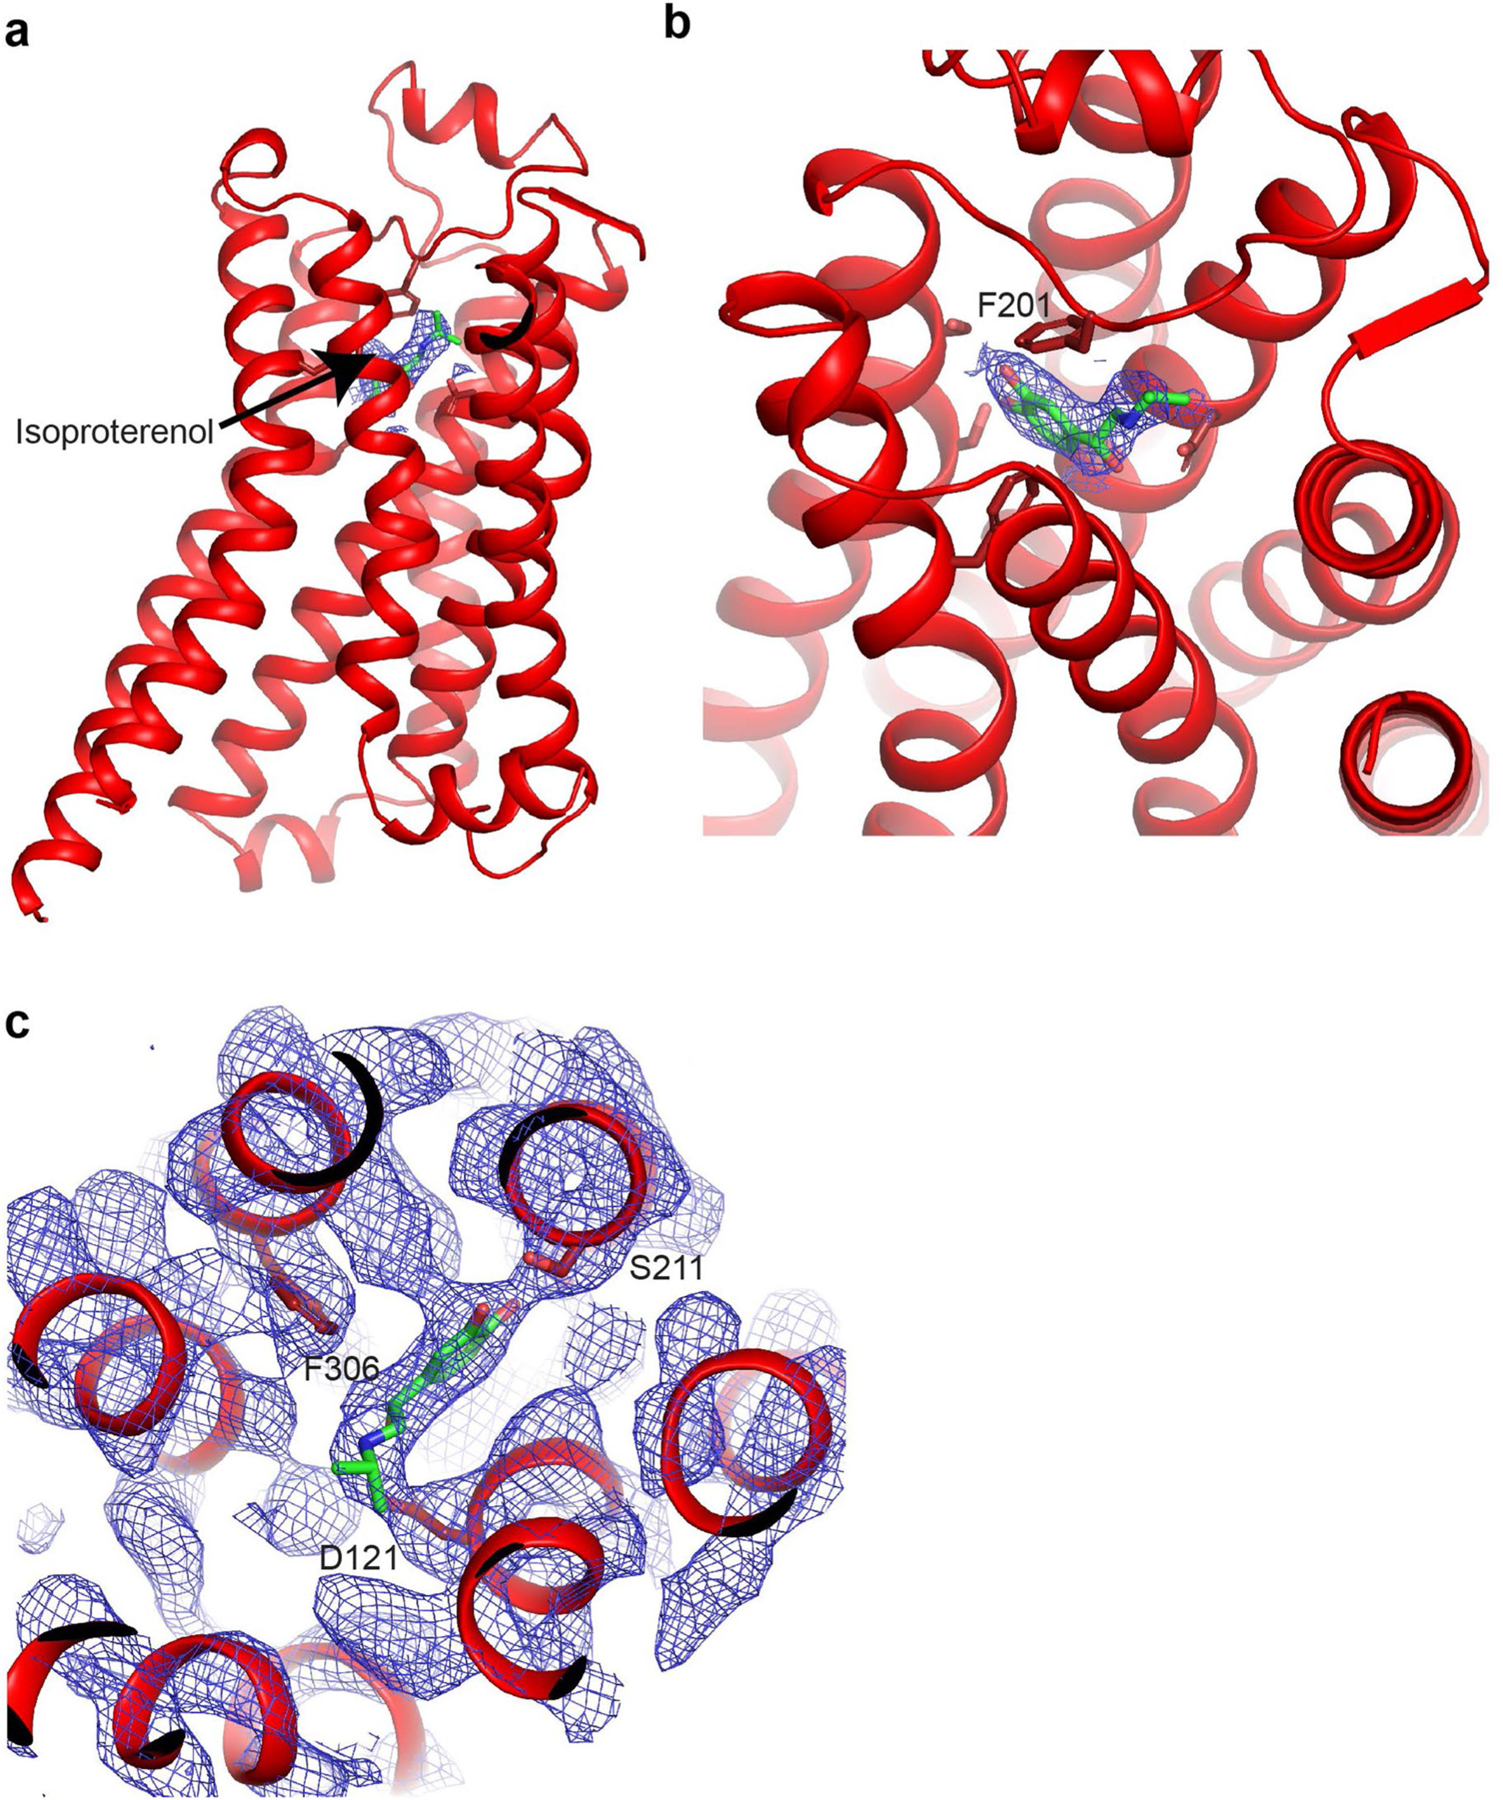
(a,b) Side view (a) and oblique view (b) of activated β1-AR to highlight the location of the agonist isoproterenol bound in the orthosteric binding pocket at the extracellular side of the receptor. β1-AR is shown in cartoon in red and isoproterenol is shown in green. Experimental density carved around ligand shown at 13σ, supporting complete occupancy. (c) Close-up view of the orthosteric binding pocket with model docked into 8σ experimental density to highlight agonist coordination. Isoproterenol is colored in green and residues lining the binding pocket are in red.
Extended Data Fig. 5. Rotational opening of the α-helical domain during G-protein activation by GPCRs.
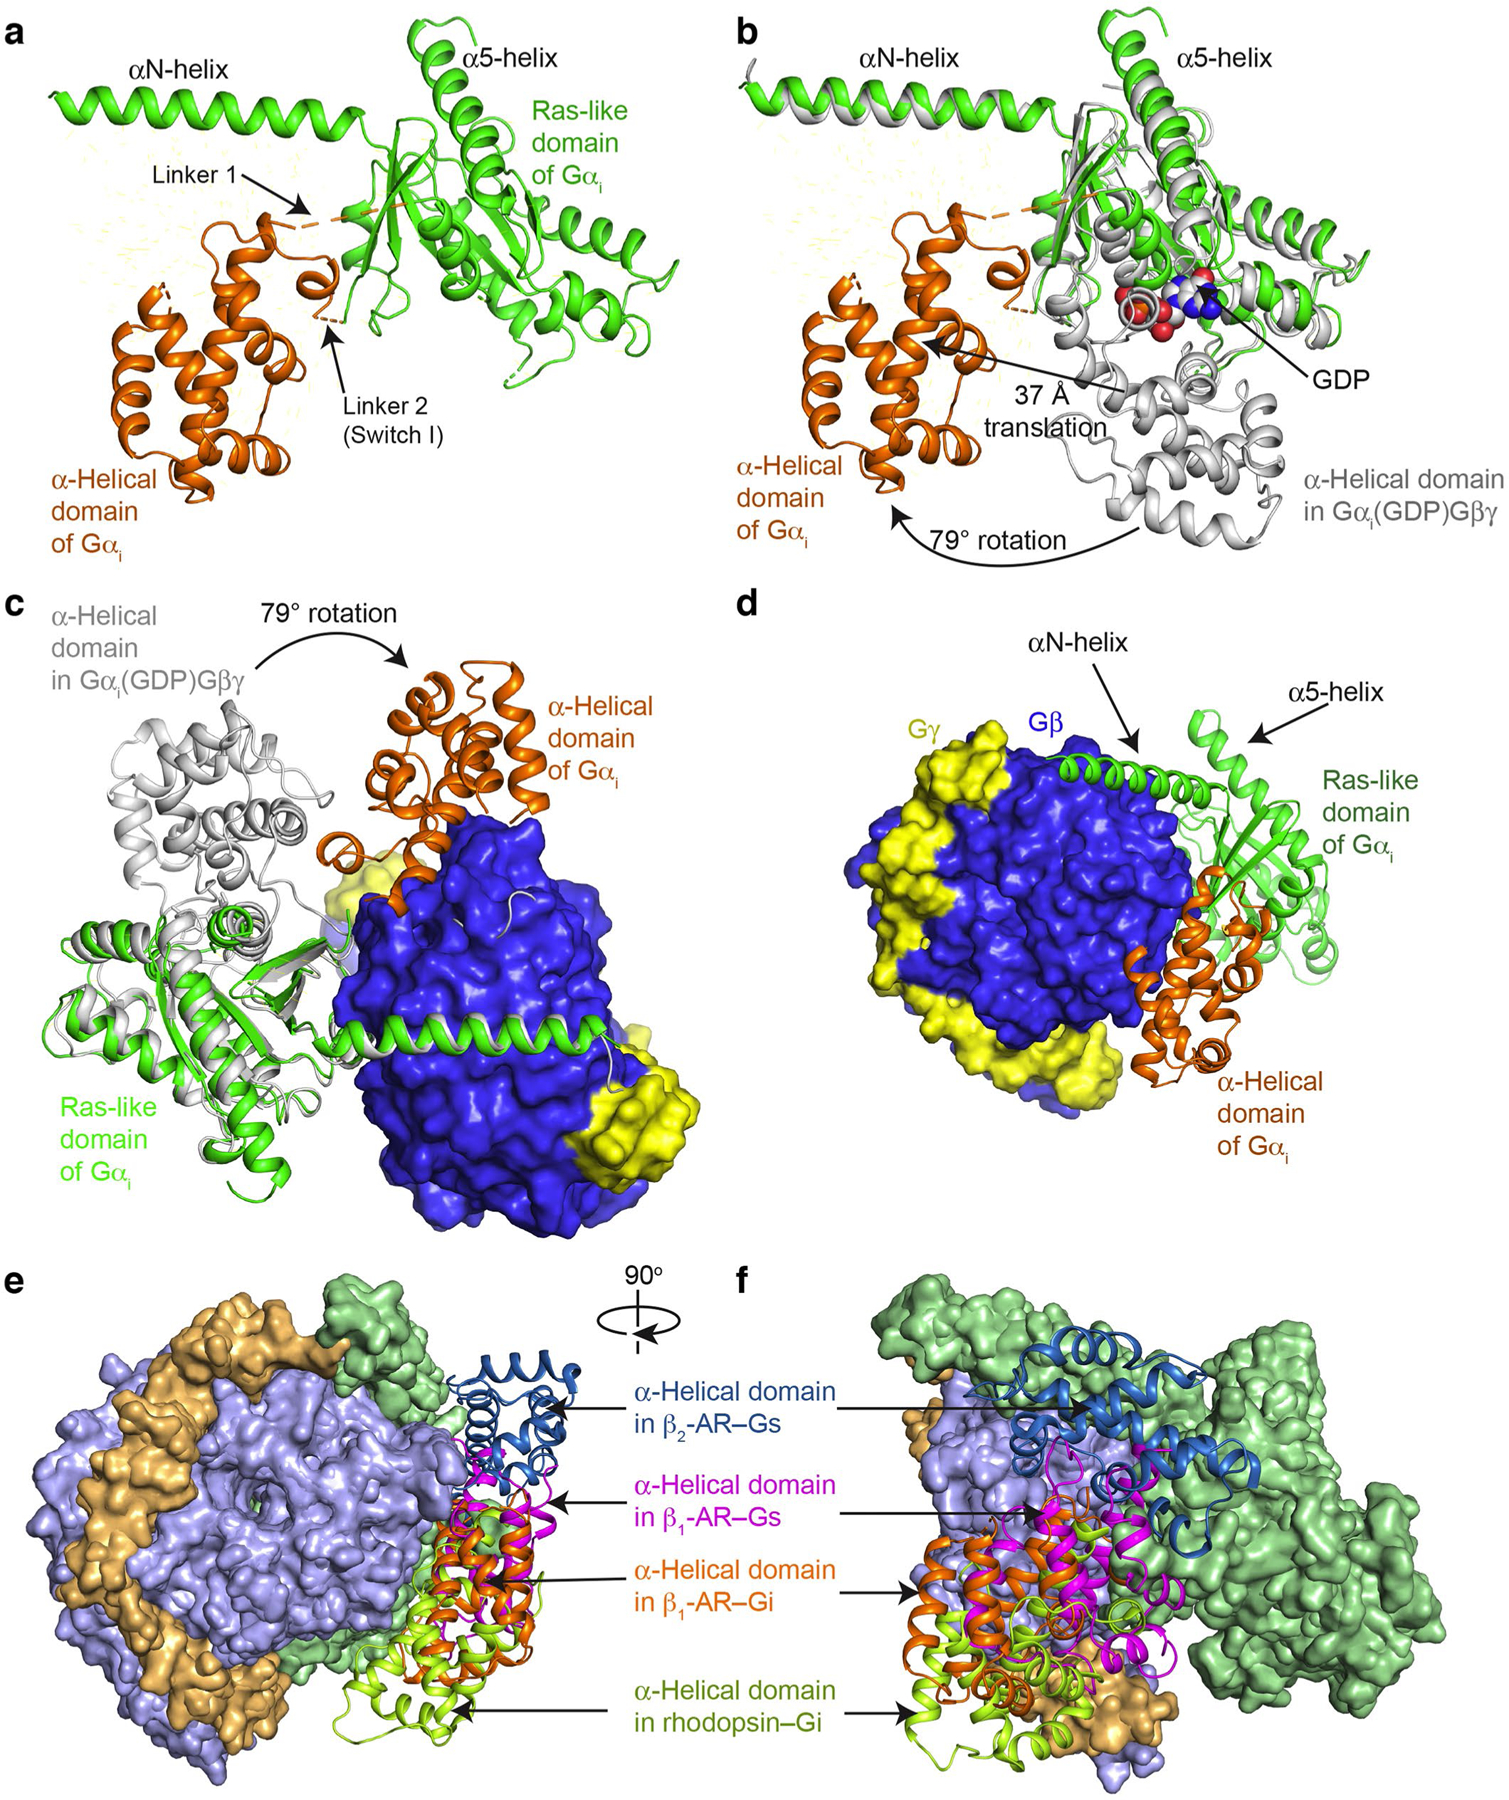
(a) Structure of Gαi in the complex of β1-AR–Gi shows the rotational opening of the α-helical domain away from the Ras-like domain. (b) Comparison of the structures of Gαi in the complex of β1-AR–Gi (in green and orange) and in the inactive GDP-bound Gi crystal structure (in gray; PDB: 1GG2). (c) View from the receptor towards the cytoplasmic end shows the rotation of the α-helical domain from the position in inactive Gi (in gray) to the location in the β1-AR–Gi complex (in orange). (d) View from Gβγ towards the Ras-like domain shows the position of the α-helical domain relative to Gβ. (e and f) Comparisons of the locations of the α-helical domains in the complexes of β2-AR–Gs (PDB: 3SN6), β1-AR–Gs (PDB: 7JJO), rhodopsin–Gi (PDB: 6CMO), and β1-AR–Gi (this paper).
Extended Data Fig. 6. Conformational changes of the GDP/GTP-binding pocket of Gαi after β1-AR interaction.
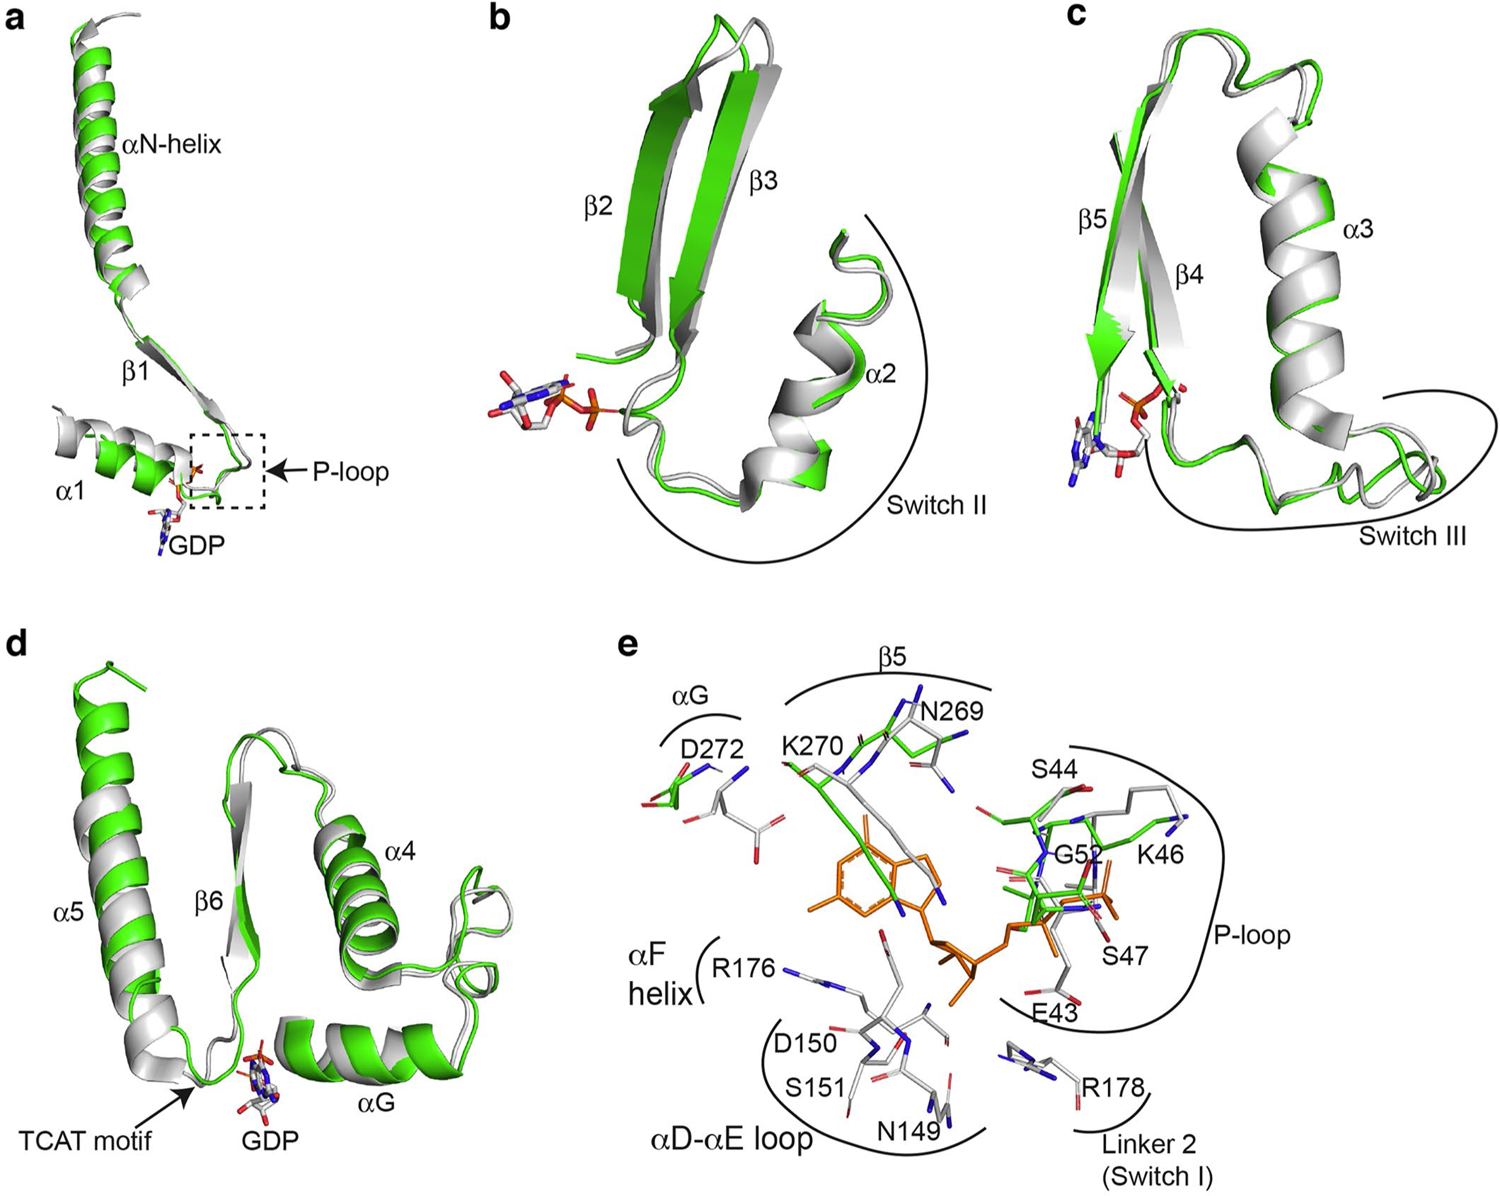
(a) Comparison of the β1 strand, α1-helix and the β1-α1 loop of the Ras-like domains from β1-AR-Gi (in green) and from GαilGβ1Gγ2 (PDB: 1GG2; in gray) when the Ras-like domains are superimposed. (b) Comparison of Switch II region from β1-AR-Gi and from Gαi1Gβ1Gγ2. (c) Comparison of Switch III region from β1-AR-Gi and from Gαi1Gβ1Gγ2. (d) Comparison of the regions from αG to α5-helix from β1-AR-Gi and from Gαi1Gβ1Gγ2. (E) Comparison of all GDP-interacting residues of the Ras-like domains from β1-AR-Gi and from Gαi1Gβ1Gγ2.
Extended Data Fig. 7. Structural changes of G-proteins during the activation.
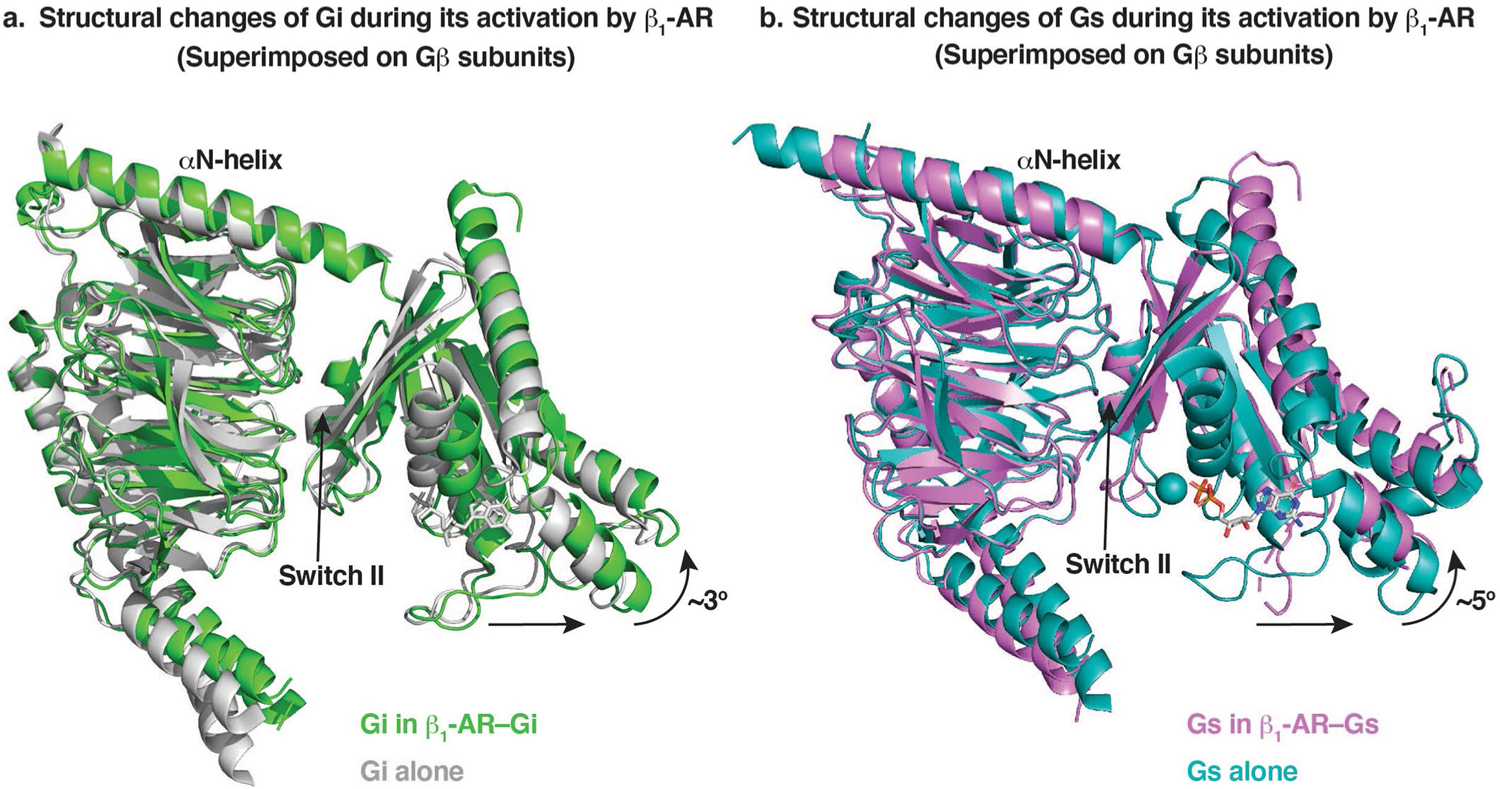
Separation of the Ras-like domains of Gi (a) and Gs (b) from Gβγ subunits in the complex of β1-AR–Gi (a) and β1-AR–Gs (b). Gβγ subunits are superimposed.
Extended Data Fig. 8. Conformational changes of the GDP-binding pocket of Gαs after β1-AR interaction.
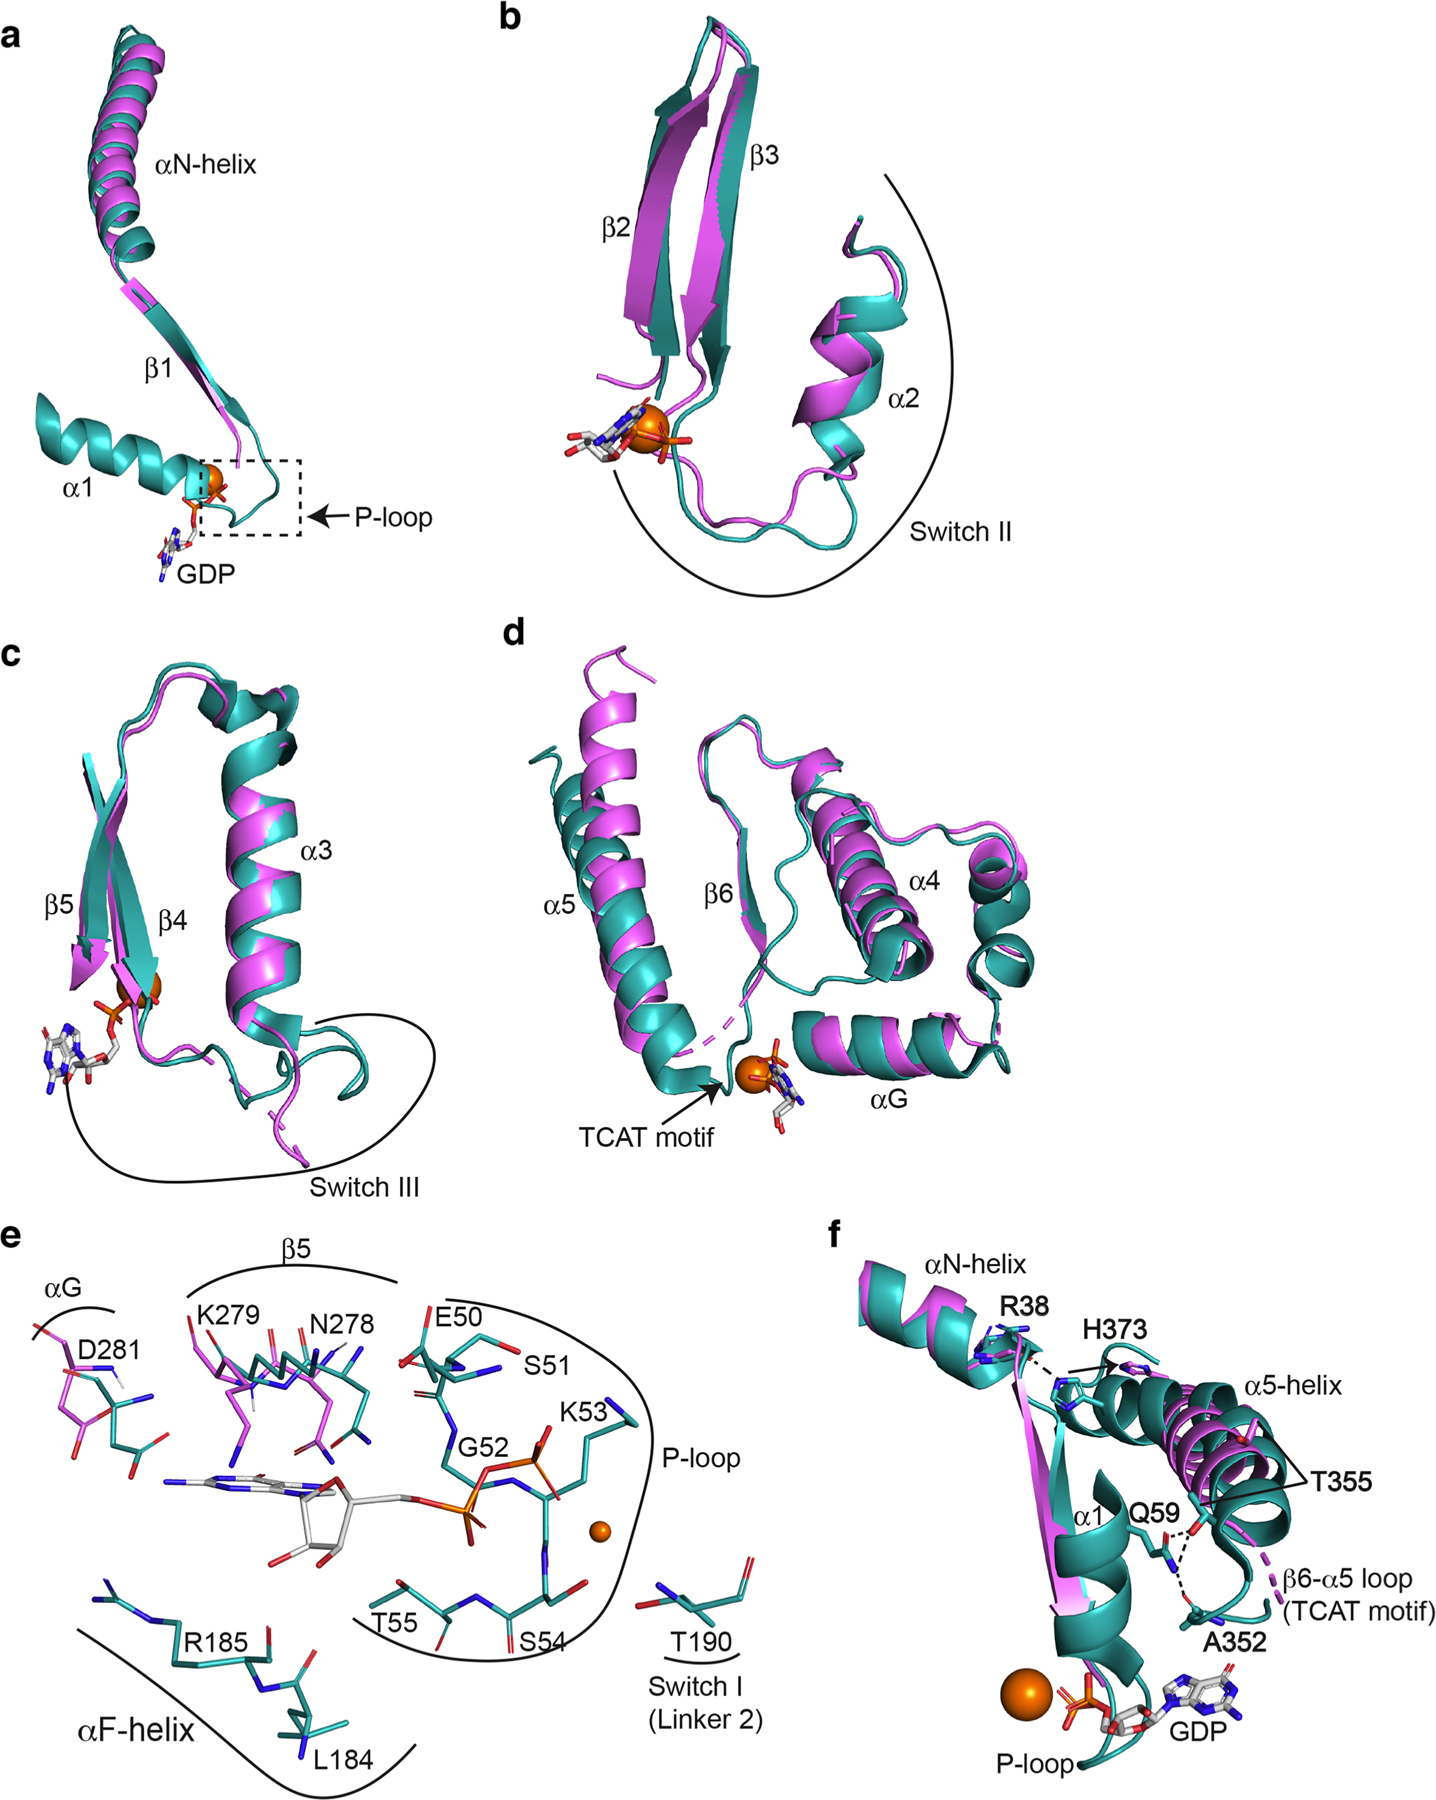
(a) Comparison of the β1 strand, α1-helix and the β1-α1 loop of the Ras-like domains from β1-AR-Gs (in violet) and from GαsGβ1Gγ2 (PDB: 6EG8; in teal) when the Ras-like domains are superimposed. (b) Comparison of Switch II region from β1-AR-Gs and from GαsGβ1Gγ2. (c) Comparison of Switch III region from β1-AR-Gs and from GαsGβ1Gγ2(d) Comparison of the regions from αG to α5-helix from β-1AR-Gs and from GαsGβ1Gγ2. (e) Comparison of all GDP-interacting residues of the Ras-like domains from β1-AR-Gs and from GαsGβ1Gγ2.(f) Disruptions of intra-molecular interactions of Gαs during Gs activation by β1-AR. An interaction between the sidechain of His373 in the α5-helix and the backbone of Arg38 in the αN-helix is broken. An interacting network involving the sidechain of Gln59 in the αl-helix, the backbone carbonyl of Ala352 in the β6-α5 loop, and the sidechain of Thr355 in the α5-helix is disrupted.
Extended Data Fig. 9. Summary of cryo-EM data processing.
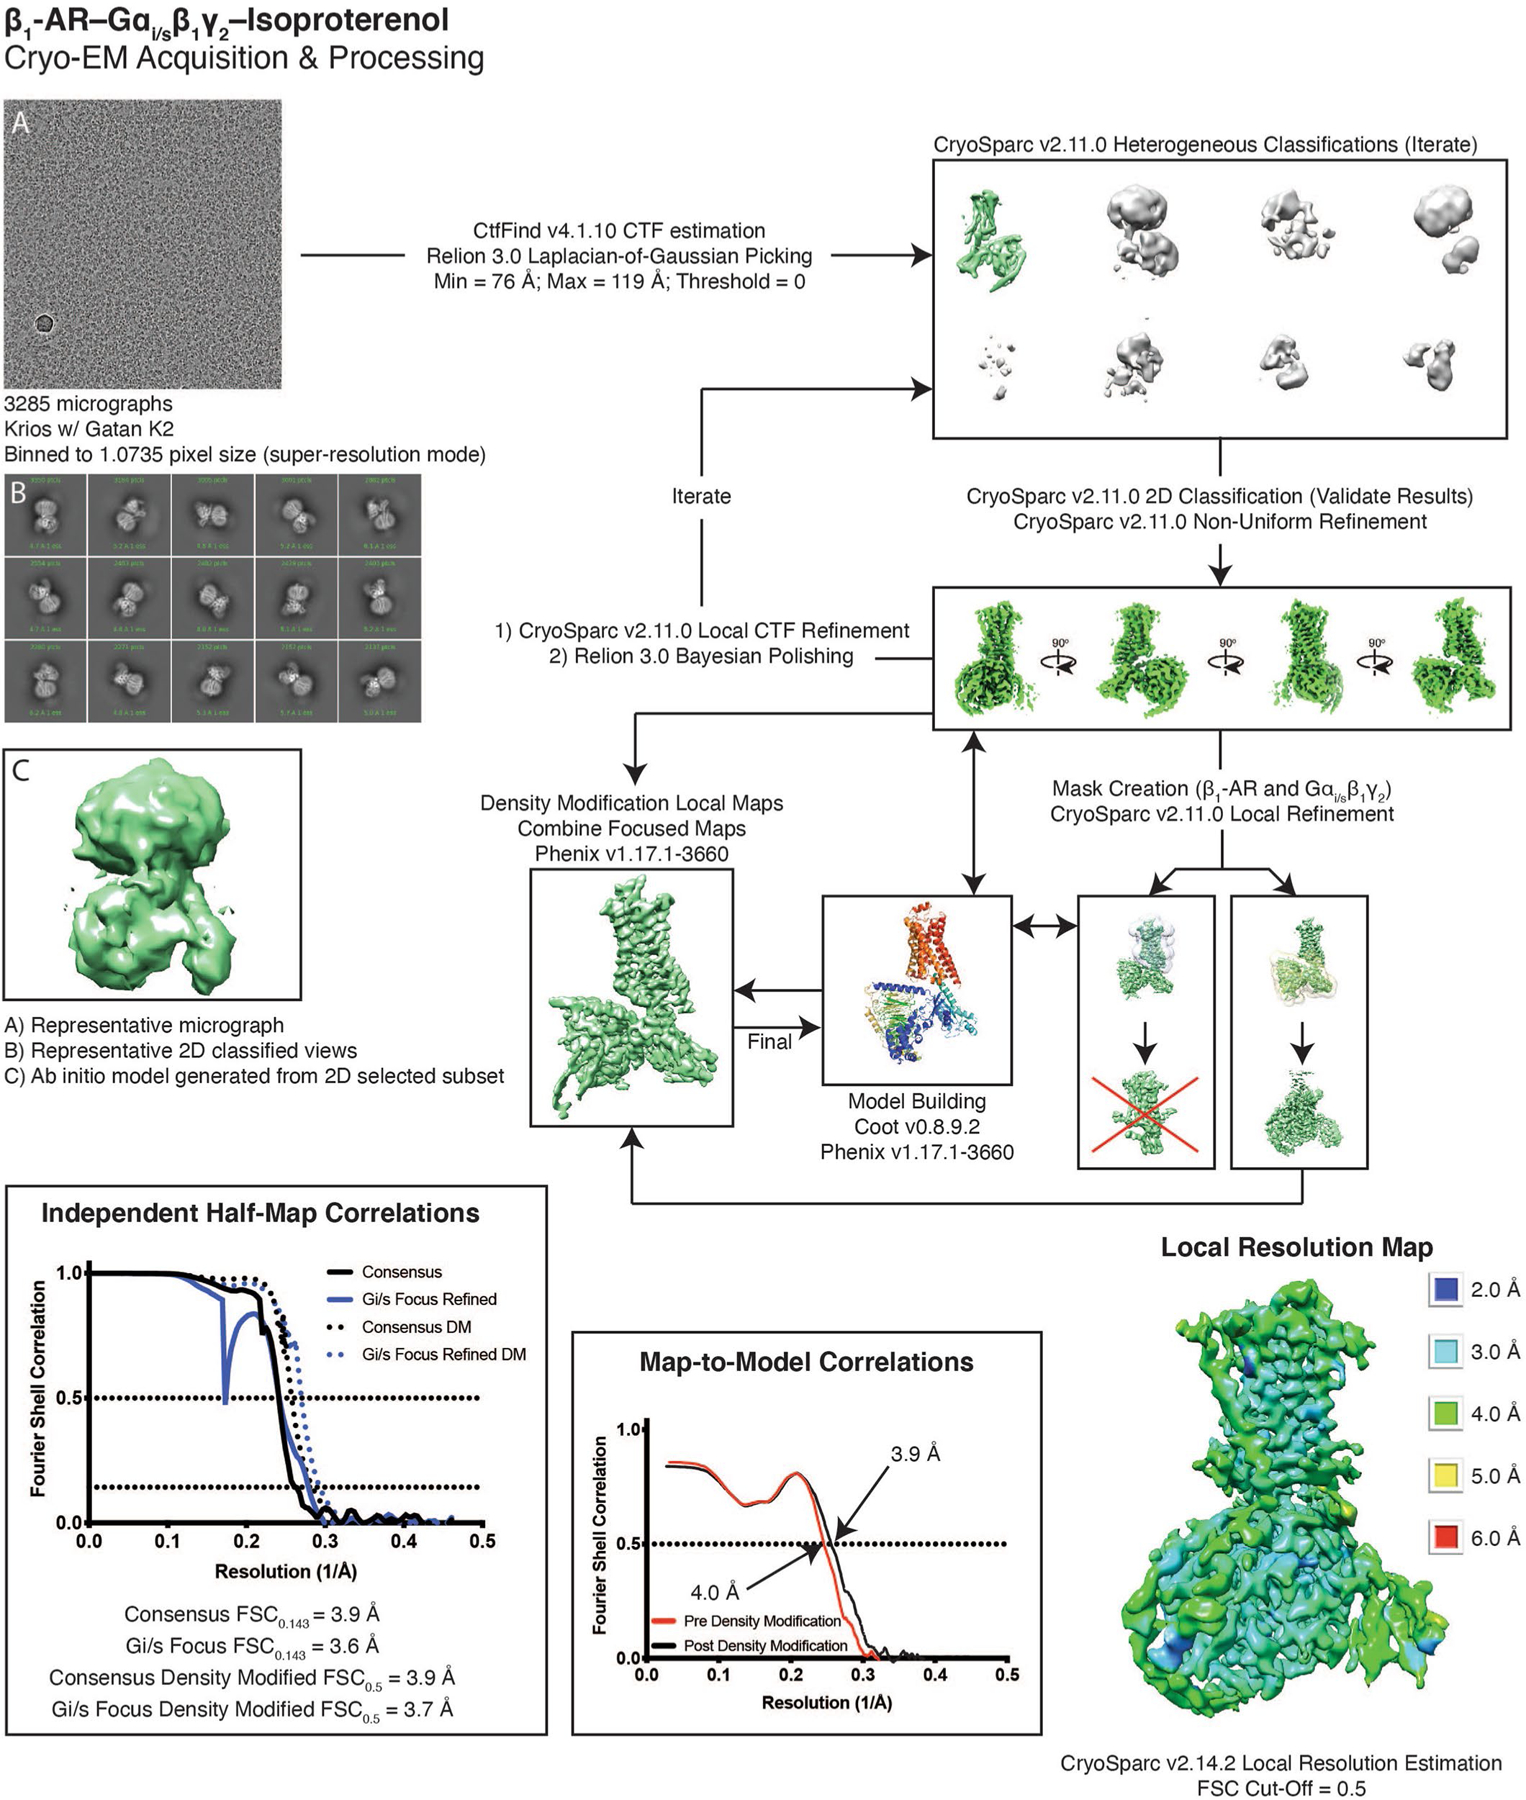
Details are found in the methods. In short, 3,285 micrographs were collected on a Krios equipped with Gatan K2 direct electron detector. Heterogeneous refinement was used to remove junk, with 2D classification as a form of verification. Once an ideal particle stack was identified, subsequent rounds of heterogeneous refinement were combined with local CTF refinement and Bayesian polishing to further improve the map. Local refinement of Gi/s helped bring out features in the periphery of the structure. The model was built into the consensus and local refinements, and then used to generate a composite map that was used for the final round of real-space refinement.
Extended Data Fig. 10. Structural comparisons of the β1-AR–Gi complex with other GPCR–Gi complexes.
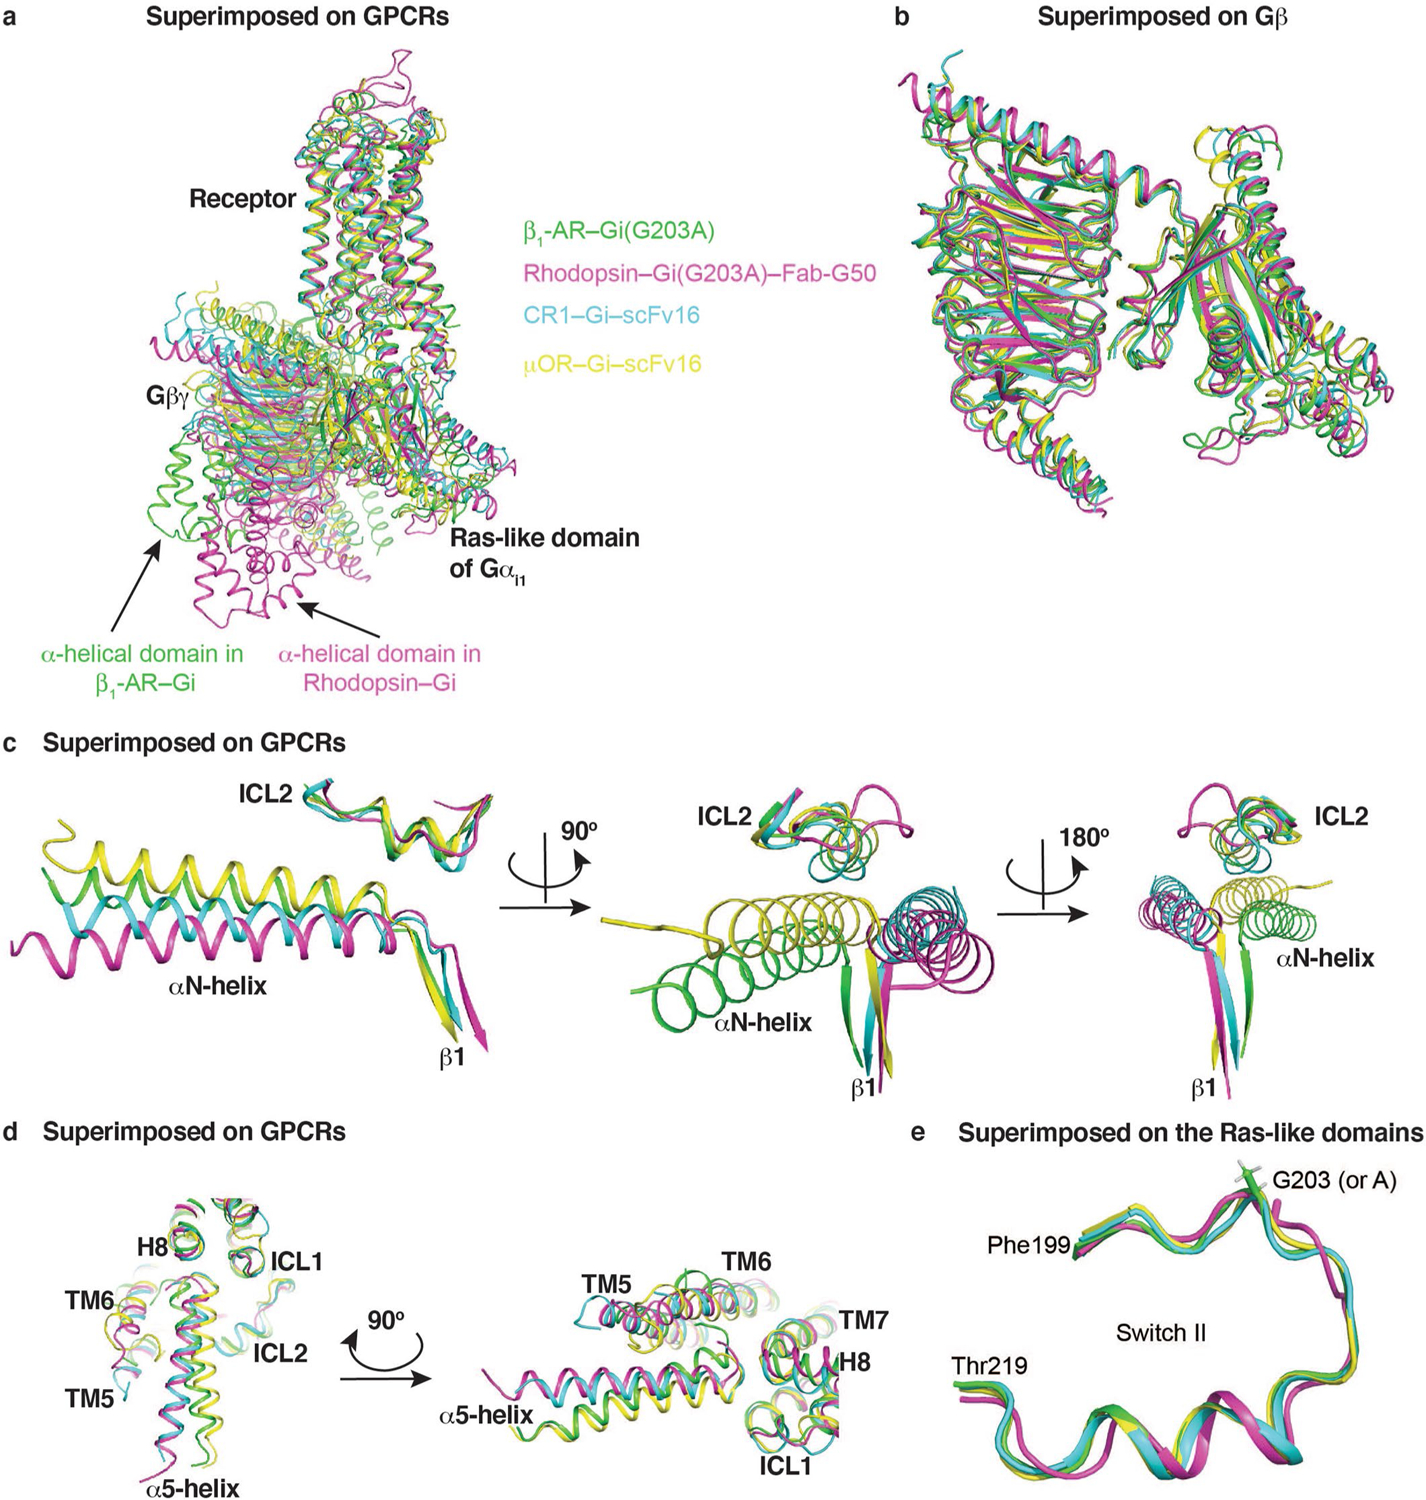
(a) The structure of β1-AR–Gi1 (in green) is superimposed with rhodopsin–Gi1 (PDB 6CMO, in magenta), cannabinoid receptor 1–Gi1 (PDB 6N4B, in cyan), and mu-opioid receptor–Gi1 (PDB 6DDE, in yellow). (b) Comparisons of the Gαi1 Gβγ trimer structures in the four complexes (superimposed by Gβ subunits). (c) Comparisons of the interactions between ICL2s of the receptors and the αN-helices of Gαi1. (d) Comparisons of the interactions between the α5-helices of Gαi1 and the receptors. (e) Structural comparison of the regions around G203 of Gαi1 in the four structures.
Supplementary Material
Acknowledgements
We thank members of our research groups for helpful discussions and comments on the manuscript. We thank A. Inoue (Tohoku University, Japan) for the Gα-depleted HEK293 cells. This work was supported by NIH grant no. GM138676 (X.-Y.H.), the Josie Robertson Investigators Program (R.K.H.) and the Searle Scholars Program (R.K.H.). The Simons Electron Microscopy Center and the National Resource for Automated Molecular Microscopy located at the New York Structural Biology Center are supported by grants from the NIH National Institute of General Medical Sciences (GM103310), NYSTAR and the Simons Foundation (SF349247). The funders had no role in study design, data collection and analysis, decision to publish or preparation of the manuscript.
Footnotes
Competing interests
The authors declare no competing interests.
Additional information
Extended data is available for this paper at https://doi.org/10.1038/s41594-021-00679-2.
Supplementary information The online version contains supplementary material available at https://doi.org/10.1038/s41594-021-00679-2.
Peer review information Nature Structural & Molecular Biology thanks Qing Fan and the other, anonymous, reviewer(s) for their contribution to the peer review of this work. Peer reviewer reports are available. Florian Ullrich was the primary editor on this article and managed its editorial process and peer review in collaboration with the rest of the editorial team.
Reprints and permissions information is available at www.nature.com/reprints.
Data availability
The cryo-EM reconstructions of the β1-AR–Gi–isoproterenol complex and the β1-AR–Gi/s–isoproterenol complex have been deposited in the Election Microscopy Data Bank (EMDB) under ID codes EMD-24789 and EMD-24790, respectively. The corresponding atomic models have been deposited in the Protein Data Bank (PDB) under ID codes 7S0F and 7S0G, respectively. Source data are provided with this paper.
References
- 1.Benovic JL Novel β2-adrenergic receptor signaling pathways. J. Allergy Clin. Immunol. 110, S229–S235 (2002). [DOI] [PubMed] [Google Scholar]
- 2.Post SR, Hammond HK & Insel PA Beta-adrenergic receptors and receptor signaling in heart failure. Annu. Rev. Pharmacol. Toxicol. 39, 343–360 (1999). [DOI] [PubMed] [Google Scholar]
- 3.Lohse MJ, Engelhardt S & Eschenhagen T What is the role of β-adrenergic signaling in heart failure? Circ. Res. 93, 896–906 (2003). [DOI] [PubMed] [Google Scholar]
- 4.Hilger D, Masureel M & Kobilka BK Structure and dynamics of GPCR signaling complexes. Nat. Struct. Mol. Biol. 25, 4–12 (2018). [DOI] [PMC free article] [PubMed] [Google Scholar]
- 5.Asano T, Katada T, Gilman AG & Ross EM Activation of the inhibitory GTP-binding protein of adenylate cyclase, G, by β-adrenergic receptors in reconstituted phospholipid vesicles. J. Biol. Chem. 259, 9351–9354 (1984). [PubMed] [Google Scholar]
- 6.Kompa AR, Gu XH, Evans BA & Summers RJ Desensitization of cardiac β-adrenoceptor signaling with heart failure produced by myocardial infarction in the rat. Evidence for the role of Gi but not Gs or phosphorylating proteins. J. Mol. Cell. Cardiol. 31, 1185–1201 (1999). [DOI] [PubMed] [Google Scholar]
- 7.Wang J et al. Gαi is required for carvedilol-induced β1 adrenergic receptor β-arrestin biased signaling. Nat. Commun. 8, 1706 (2017). [DOI] [PMC free article] [PubMed] [Google Scholar]
- 8.Dwivedi H, Baidya M & Shukla AK GPCR signaling: the interplay of Gαi and β-arrestin. Curr. Biol. 28, R324–R327 (2018). [DOI] [PubMed] [Google Scholar]
- 9.Lukasheva V et al. Signal profiling of the β1 AR reveals coupling to novel signalling pathways and distinct phenotypic responses mediated by β1 AR and β2AR. Sci.Rep. 10, 8779(2020). [DOI] [PMC free article] [PubMed] [Google Scholar]
- 10.Rubenstein RC, Linder ME & Ross EM Selectivity of the β-adrenergic receptor among Gs, Gi’s, and Go: assay using recombinant a subunits in reconstituted phospholipid vesicles. Biochemistry 30, 10769–10777 (1991). [DOI] [PubMed] [Google Scholar]
- 11.Su M et al. Structural basis of the activation of heterotrimeric Gs-protein by isoproterenol-bound β1-adrenergic receptor. Mol. Cell 80, 59–71 (2020). [DOI] [PMC free article] [PubMed] [Google Scholar]
- 12.Huang J, Chen S, Zhang JJ & Huang XY Crystal structure of oligomeric β1-adrenergic G protein-coupled receptors in ligand-free basal state. Nat. Struct. Mol. Biol. 20, 419–425 (2013). [DOI] [PMC free article] [PubMed] [Google Scholar]
- 13.Wall MA et al. The structure of the G protein heterotrimer Giα1β1γ2. Cell 83, 1047–1058 (1995). [DOI] [PubMed] [Google Scholar]
- 14.Sprang SR, Chen Z & Du X Structural basis of effector regulation and signal termination in heterotrimeric Gα proteins. Adv. Protein Chem. 74, 1–65 (2007). [DOI] [PubMed] [Google Scholar]
- 15.Noel JP, Hamm HE & Sigler PB The 2.2-Å crystal structure of transducin-α complexed with GTPγS. Nature 366, 654–663 (1993). [DOI] [PubMed] [Google Scholar]
- 16.Coleman DE et al. Structures of active conformations of Giα1 and the mechanism of GTP hydrolysis. Science 265, 1405–1412 (1994). [DOI] [PubMed] [Google Scholar]
- 17.Rasmussen SG et al. Crystal structure of the β2 adrenergic receptor–Gs protein complex. Nature 477, 549–555 (2011). [DOI] [PMC free article] [PubMed] [Google Scholar]
- 18.Kang Y et al. Cryo-EM structure of human rhodopsin bound to an inhibitory G protein. Nature 558, 553–558 (2018). [DOI] [PMC free article] [PubMed] [Google Scholar]
- 19.Wall MA, Posner BA & Sprang SR Structural basis of activity and subunit recognition in G protein heterotrimers. Structure 6, 1169–1183 (1998). [DOI] [PubMed] [Google Scholar]
- 20.Aurora R, Srinivasan R & Rose GD Rules for α-helix termination by glycine. Science 264, 1126–1130 (1994). [DOI] [PubMed] [Google Scholar]
- 21.Liu X et al. Structural insights into the process of GPCR-G protein complex formation. Cell 177, 1243–1251 (2019). [DOI] [PMC free article] [PubMed] [Google Scholar]
- 22.Sprang SR G protein mechanisms: insights from structural analysis. Annu. Rev. Biochem. 66, 639–678 (1997). [DOI] [PubMed] [Google Scholar]
- 23.Lee E, Taussig R & Gilman AG The G226A mutant of Gsα highlights the requirement for dissociation of G protein subunits. J. Biol. Chem. 267, 1212–1218 (1992). [PubMed] [Google Scholar]
- 24.Liang YL et al. Phase-plate cryo-EM structure of a class B GPCR–G-protein complex. Nature 546, 118–123 (2017). [DOI] [PMC free article] [PubMed] [Google Scholar]
- 25.Zhang Y et al. Cryo-EM structure of the activated GLP-1 receptor in complex with a G protein. Nature 546, 248–253 (2017). [DOI] [PMC free article] [PubMed] [Google Scholar]
- 26.Koehl A et al. Structure of the μ-opioid receptor–Gi protein complex. Nature 558, 547–552 (2018). [DOI] [PMC free article] [PubMed] [Google Scholar]
- 27.Krishna Kumar K et al. Structure of a signaling cannabinoid receptor 1-G protein complex. Cell 176, 448–458 e412 (2019). [DOI] [PMC free article] [PubMed] [Google Scholar]
- 28.Conklin BR, Farfel Z, Lustig KD, Julius D & Bourne HR Substitution of three amino acids switches receptor specificity of Gqα to that of Giα. Nature 363, 274–276 (1993). [DOI] [PubMed] [Google Scholar]
- 29.Conklin BR & Bourne HR Structural elements of Gα subunits that interact with Gβγ, receptors, and effectors. Cell 73, 631–641 (1993). [DOI] [PubMed] [Google Scholar]
- 30.Hisano Y et al. Lysolipid receptor cross-talk regulates lymphatic endothelial junctions in lymph nodes. J. Exp. Med. 216, 1582–1598 (2019). [DOI] [PMC free article] [PubMed] [Google Scholar]
- 31.Jelinek V, Mosslein N & Bunemann M Structures in G proteins important for subtype selective receptor binding and subsequent activation. Commun. Biol. 4, 635 (2021). [DOI] [PMC free article] [PubMed] [Google Scholar]
- 32.Okashah N et al. Variable G protein determinants of GPCR coupling selectivity. Proc. Natl Acad. Sci. USA 116, 12054–12059 (2019). [DOI] [PMC free article] [PubMed] [Google Scholar]
- 33.Draper-Joyce CJ et al. Structure of the adenosine-bound human adenosine A1 receptor–Gi complex. Nature 558, 559–563 (2018). [DOI] [PubMed] [Google Scholar]
- 34.Ma X et al. Analysis of β2 AR-Gs and β2 AR-Gi complex formation by NMR spectroscopy. Proc. Natl Acad. Sci. USA 117, 23096–23105 (2020). [DOI] [PMC free article] [PubMed] [Google Scholar]
- 35.Bos JL, Rehmann H & Wittinghofer A GEFs and GAPs: critical elements in the control of small G proteins. Cell 129, 865–877 (2007). [DOI] [PubMed] [Google Scholar]
- 36.Boriack-Sjodin PA, Margarit SM, Bar-Sagi D & Kuriyan J The structural basis of the activation of Ras by Sos. Nature 394, 337–343 (1998). [DOI] [PubMed] [Google Scholar]
- 37.Bourne HR, Sanders DA & McCormick F The GTPase superfamily: conserved structure and molecular mechanism. Nature 349, 117–127 (1991). [DOI] [PubMed] [Google Scholar]
References
- 38.Warne T et al. Structure of a β1-adrenergic G-protein-coupled receptor. Nature 454, 486–491 (2008). [DOI] [PMC free article] [PubMed] [Google Scholar]
- 39.Baker JG A full pharmacological analysis of the three turkey β-adrenoceptors and comparison with the human β-adrenoceptors. PLoS ONE 5, e15487 (2010). [DOI] [PMC free article] [PubMed] [Google Scholar]
- 40.Baker JG, Proudman RG & Tate CG The pharmacological effects of the thermostabilising (m23) mutations and intra and extracellular (β36) deletions essential for crystallisation of the turkey β-adrenoceptor. Naunyn Schmiedebergs Arch. Pharm. 384, 71–91 (2011). [DOI] [PMC free article] [PubMed] [Google Scholar]
- 41.Carragher B et al. Leginon: an automated system for acquisition of images from vitreous ice specimens. J. Struct. Biol. 132, 33–45 (2000). [DOI] [PubMed] [Google Scholar]
- 42.Rohou A & Grigorieff N CTFFIND4: fast and accurate defocus estimation from electron micrographs. J. Struct. Biol. 192, 216–221 (2015). [DOI] [PMC free article] [PubMed] [Google Scholar]
- 43.Scheres SH Processing of structurally heterogeneous cryo-EM data in RELION. Methods Enzymol. 579, 125–157 (2016). [DOI] [PubMed] [Google Scholar]
- 44.Punjani A, Rubinstein JL, Fleet DJ & Brubaker MA cryoSPARC: algorithms for rapid unsupervised cryo-EM structure determination. Nat. Methods 14, 290–296 (2017). [DOI] [PubMed] [Google Scholar]
- 45.Punjani A, Zhang H & Fleet DJ Non-uniform refinement: adaptive regularization improves single particle cryo-EM reconstruction. Nat. Methods 17, 1214–1221 (2020). [DOI] [PubMed] [Google Scholar]
- 46.Terwilliger TC, Ludtke SJ, Read RJ, Adams PD & Afonine PV Improvement of cryo-EM maps by density modification. Nat. Methods 17, 923–927 (2020). [DOI] [PMC free article] [PubMed] [Google Scholar]
- 47.Adams PD et al. PHENIX: a comprehensive Python-based system for macromolecular structure solution. Acta Crystallogr. D Biol. Crystallogr. 66, 213–221 (2010). [DOI] [PMC free article] [PubMed] [Google Scholar]
- 48.Pettersen EF et al. UCSF Chimera—a visualization system for exploratory research and analysis. J. Comput. Chem. 25, 1605–1612 (2004). [DOI] [PubMed] [Google Scholar]
- 49.Emsley P & Cowtan K Coot: model-building tools for molecular graphics. Acta Crystallogr. D Biol. Crystallogr. 60, 2126–2132 (2004). [DOI] [PubMed] [Google Scholar]
- 50.Chen VB et al. MolProbity: all-atom structure validation for macromolecular crystallography. Acta Crystallogr. D Biol. Crystallogr. 66, 12–21 (2010). [DOI] [PMC free article] [PubMed] [Google Scholar]
- 51.McEwen DP, Gee KR, Kang HC & Neubig RR Fluorescent BODIPY-GTP analogs: real-time measurement of nucleotide binding to G proteins. Anal. Biochem. 291, 109–117 (2001). [DOI] [PubMed] [Google Scholar]
- 52.Wan Y, Kurosaki T & Huang XY Tyrosine kinases in activation of the MAP kinase cascade by G-protein-coupled receptors. Nature 380, 541–544 (1996). [DOI] [PubMed] [Google Scholar]
- 53.Ma YC & Huang XY Identification of the binding site for Gqα on its effector Bruton’s tyrosine kinase. Proc. Natl Acad. Sci. USA 95, 12197–12201 (1998). [DOI] [PMC free article] [PubMed] [Google Scholar]
Associated Data
This section collects any data citations, data availability statements, or supplementary materials included in this article.
Supplementary Materials
Data Availability Statement
The cryo-EM reconstructions of the β1-AR–Gi–isoproterenol complex and the β1-AR–Gi/s–isoproterenol complex have been deposited in the Election Microscopy Data Bank (EMDB) under ID codes EMD-24789 and EMD-24790, respectively. The corresponding atomic models have been deposited in the Protein Data Bank (PDB) under ID codes 7S0F and 7S0G, respectively. Source data are provided with this paper.


