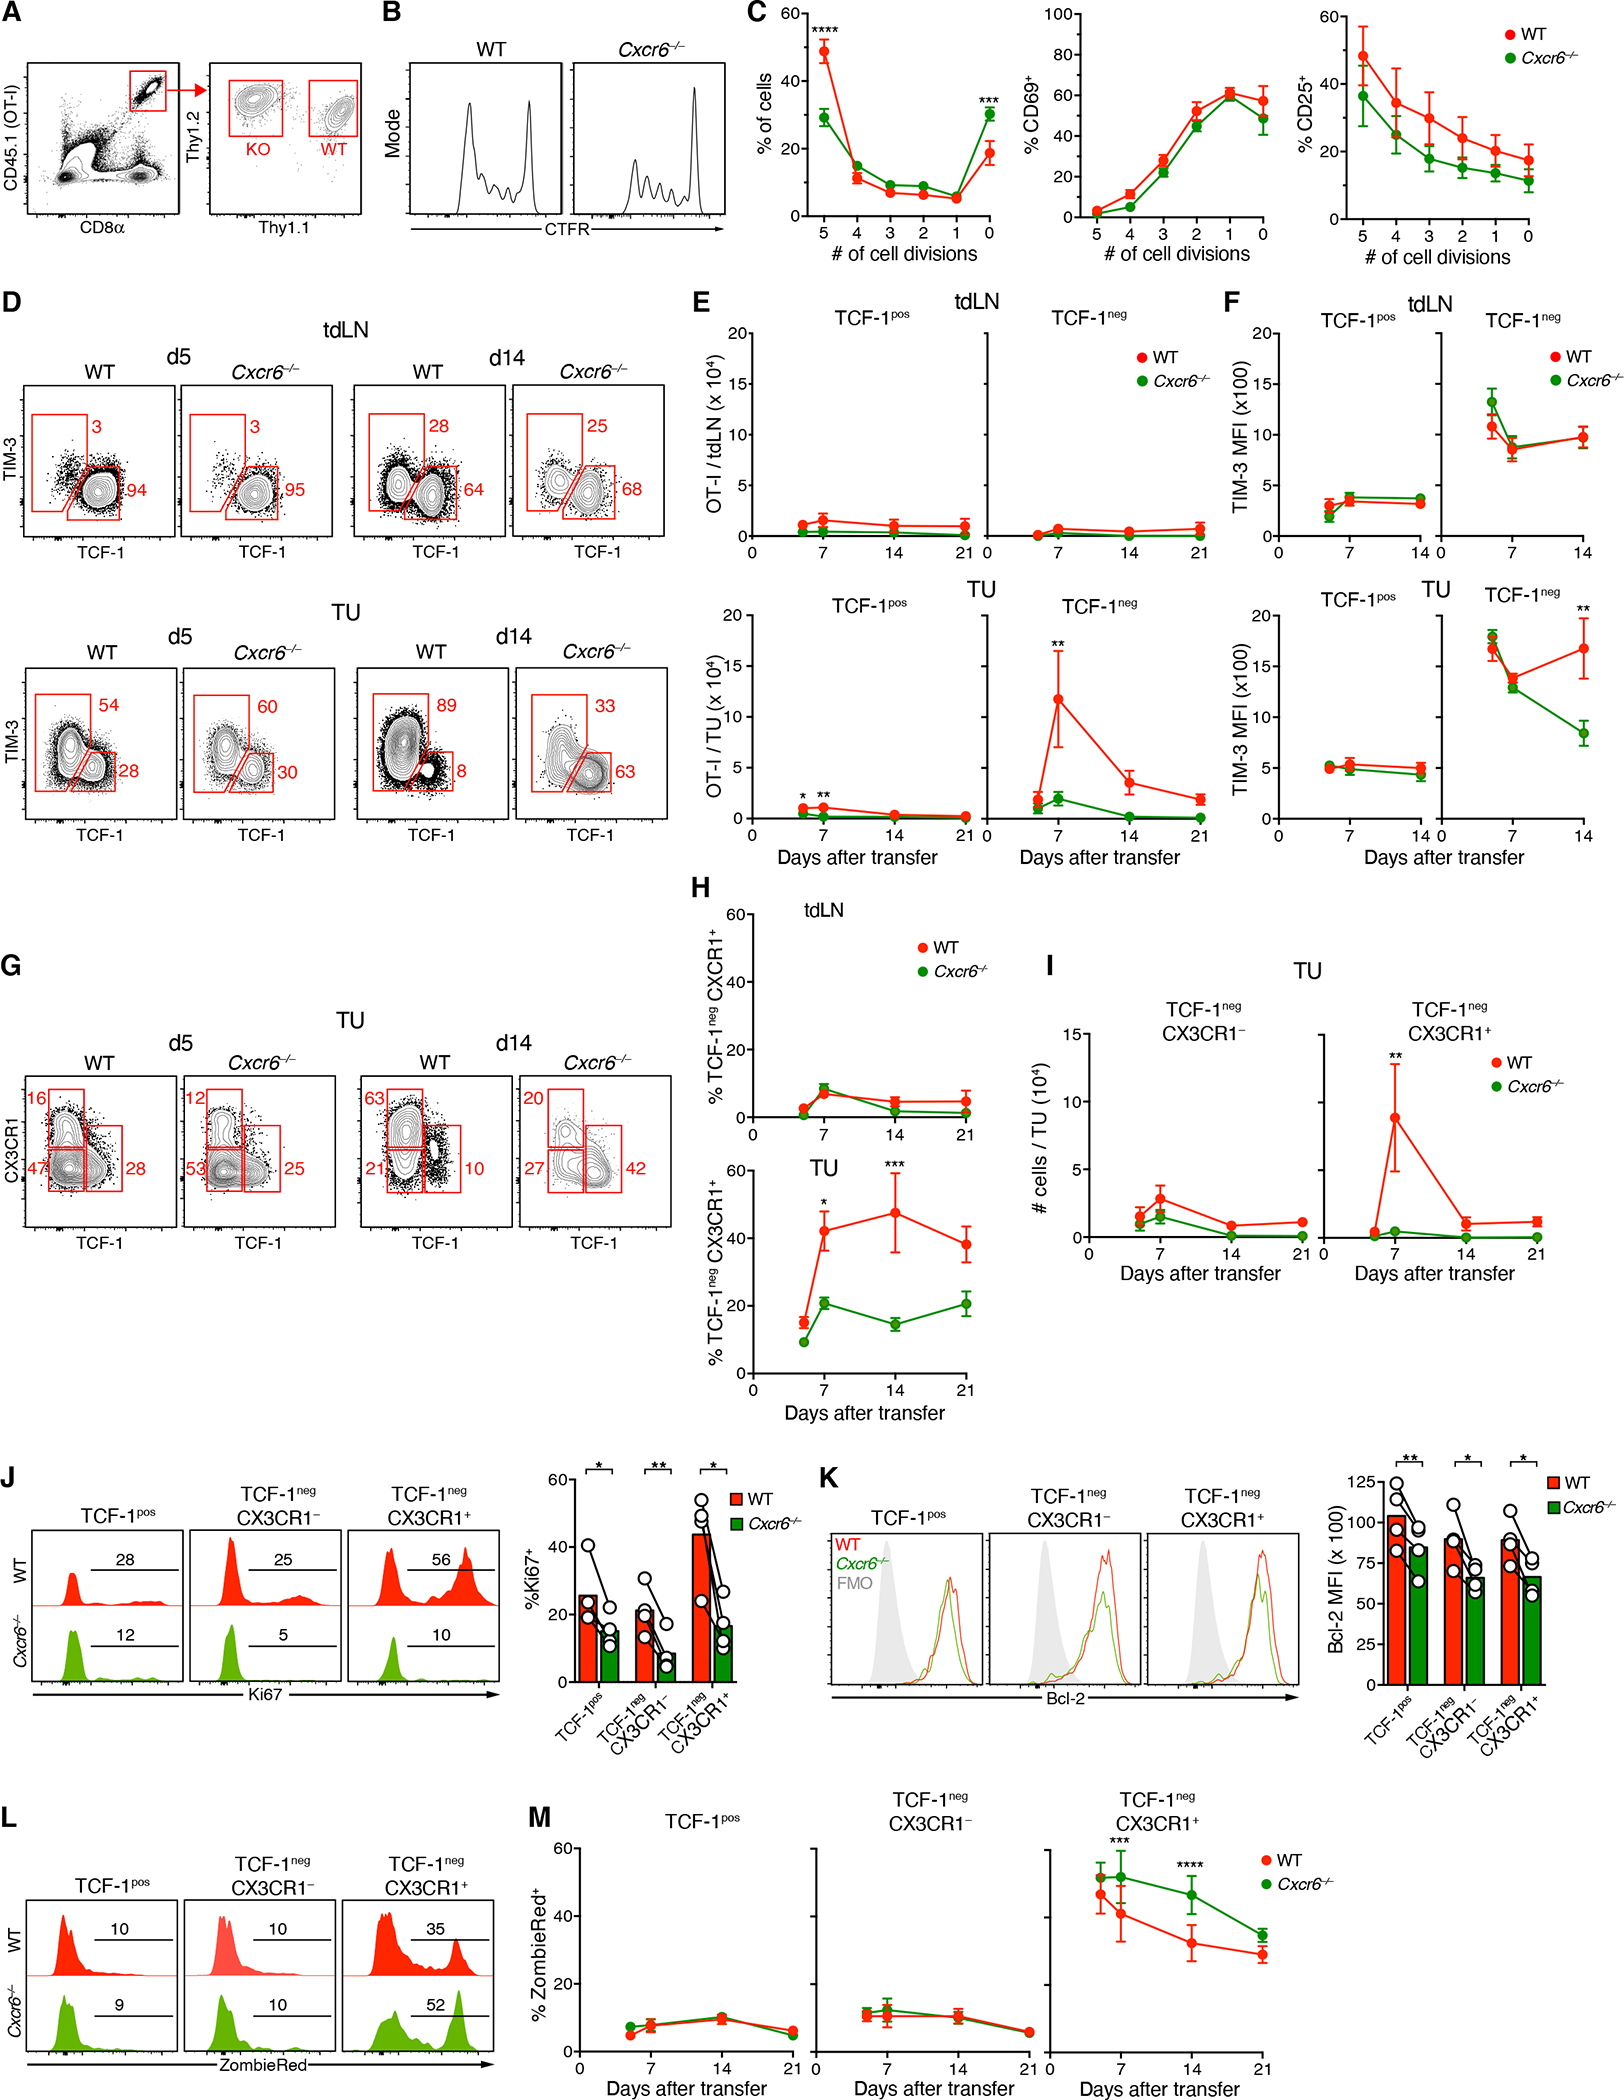
Figure 2: Expansion of highly proliferative effector-like CTL in the TME requires CXCR6.

(A-C) Celltrace Far Red (CTFR)-labeled naive Thy1.1+ CD45.1+ WT OT-I and Thy1.2+ CD45.1+ Cxcr6−/− OT-I (2 × 10⁶ cells of each) were i.v. injected into CD45.2 hosts with 14 days-old D4M.3A-pOVA tumors. Proliferation (B, C), CD69 and CD25 expression (C) of OT-I cells in tdLNs after 48 h.
(D-F) Frequencies (D), numbers (E), and TIM-3 expression (F) of TCF-1pos and TCF-1neg OT-I in tdLNs (top) and tumors (bottom) 5 to 21 days following co-injection of 105 naive WT and Cxcr6−/− OT-I cells
(G-I) Frequencies (G, H) and numbers (I) of indicated subsets of WT and Cxcr6−/− OT-I CTL in tdLNs or tumors.
(J, K) Expression of Ki67 (J) and Bcl-2 (K) in subsets defined in (G) on day 21.
(L, M) Ex vivo uptake of viability dye ZombieRed by subsets defined in (G).
Data in (D-M) represent at least two independent replicates with similar results. Graphs show means and either individual replicates or ±SEM. */**/***/**** = p<0.05/0.01/0.001/0.0001.
