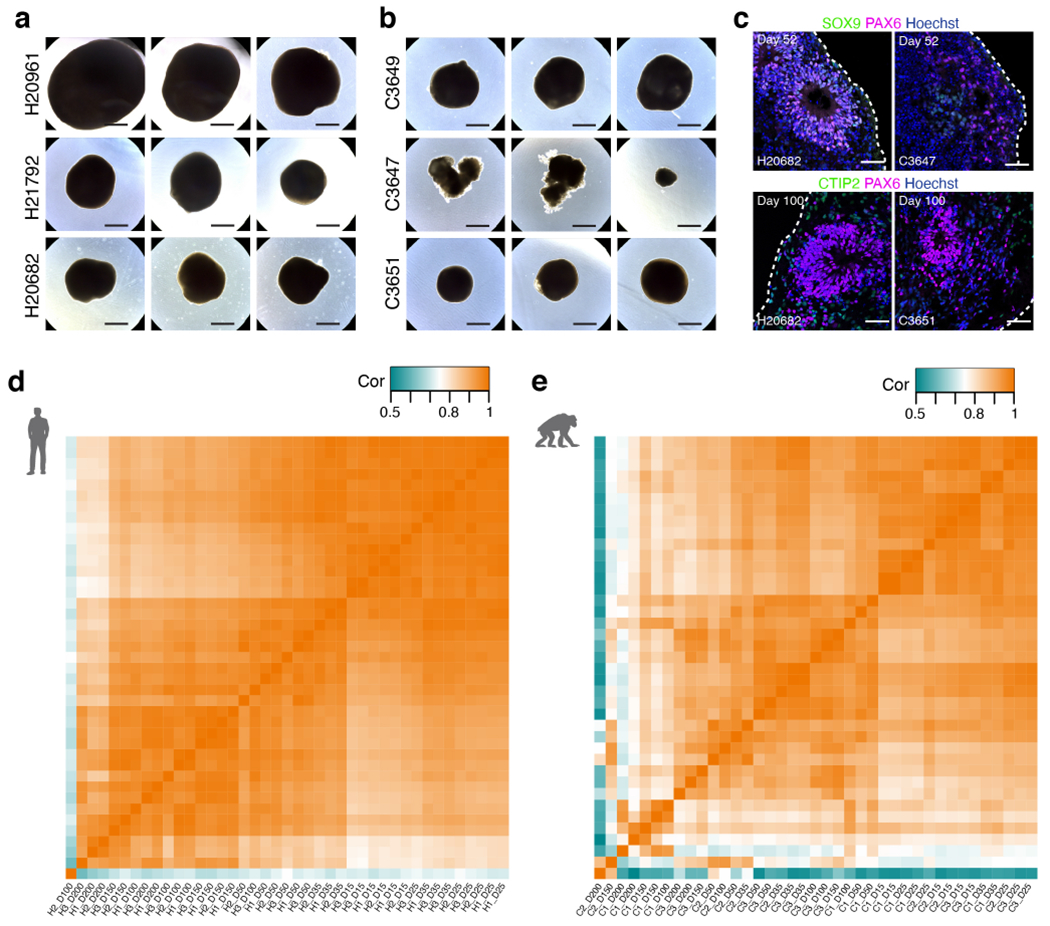
Extended Data Figure 6 |. Generation of hCS and cCS and RNA-sequencing.

a-b, Representative bright field images of three CS per line for three human (a) and three chimpanzee (b) cell lines at day 166. c, Immunostaining of hCS and cCS for SOX9, PAX6 and CTIP2; at each time point, a maximum of 2 spheroids were fixed for immunostaining across 3 hiPS and 3 ciPS cell lines with 4 independent differentiation experiments per cell line. d-e, Heatmap of correlations (Pearson’s) between bulk RNA-seq samples for hCS (d) and cCS (e). Scale bars, 1 mm (a-b), 50 μm (c).
