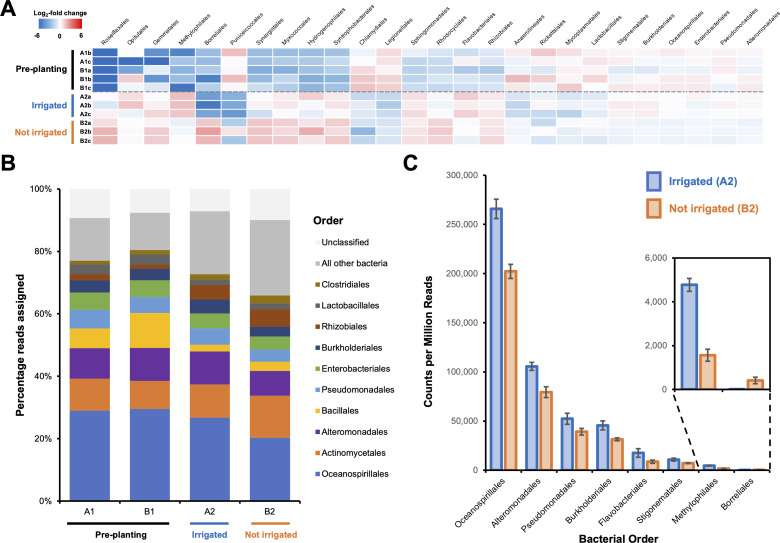
Figure 1. Effect of irrigation on the microbial population of a potato field.
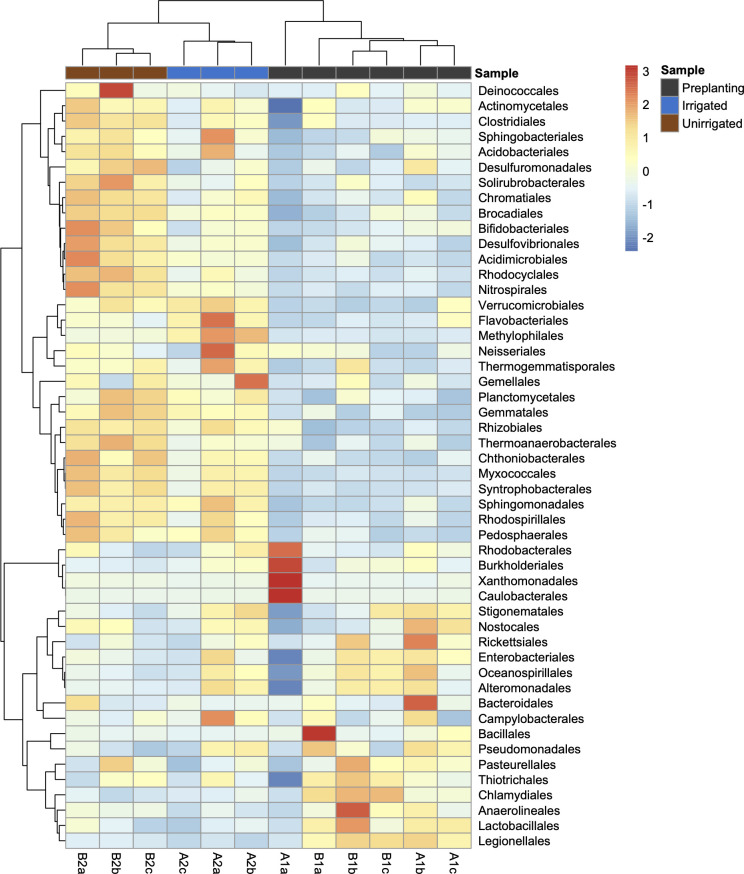
(A) The 26 bacterial orders whose populations were determined to significantly differ across one or more sampling sites using voom with a false discovery rate of 0.05. Data are shown as a heatmap of the log2-fold change with respect to the overall average counts per million for a given order. Sample A1a was omitted from the analysis due to possible contamination leading to an atypical bacterial population (Figure 1—figure supplement 1). (B) Overall average population of each sample site showing the 10 most abundant bacterial orders across all sites. (C) The eight bacterial orders whose populations were determined to significantly differ between irrigated and nonirrigated sites, represented as counts per million reads. Error bars represent the standard deviation of triplicate data.


