Abstract
Gynostemma plants are important Chinese medicinal material and economic crops. Codon usage analysis is a good way to understand organism evolution and phylogeny. There is no report yet about analysis of codon usage bias of chloroplast genomes in Gynostemma species. In this study, the chloroplast genomes in nine Gynostemma species were analyzed systematically to explore the factors affecting the formation of codon usage bias. The codon usage indicators were analyzed. Multivariate statistical analysis including analysis of neutrality plot, effective number of codons plot, parity rule 2 plot and correspondence were performed. Composition analysis of codons showed that the frequency of GC in chloroplast genes of all nine Gynostemma species was less than 50%, and the protein-coding sequences of chloroplast genes preferred to end with A/T at the third codon position. The chloroplast genes had an overall weak codon usage bias. A total of 29 high frequency codons and 12 optimal codons were identified. These could provide useful information in optimizing and modifying codons thus improving the gene expression of Gynostemma species. The results of multivariate analysis showed that the codon usage patterns were not only affected by single one factor but multiple factors. Mutation pressure, natural selection and base composition might have an influence on the codon usage patterns while natural selection might be the main determinant. The study could provide a reference for organism evolution and phylogeny of Gynostemma species and help to understand the patterns of codons in chloroplast genomes in other plant species.
Supplementary Information
The online version contains supplementary material available at 10.1007/s12298-021-01105-z.
Keywords: Codon usage bias, Chloroplast genomes, Optimal codon, Gynostemma species
Introduction
Chloroplasts are essential organelles and unique energy converters, which regulate photosynthesis to provide the required energy for higher plants and some algae (Zhang et al. 2012). The chloroplast genome has a simple and relatively conservative molecular structure, which is favorable for the study of plant barcoding (Galtier and Lobry 1997). Because of the advantages of easy sequence acquisition, high expression efficiency of exogenous genes, effectively control of the spread of transformed genes, and hereditary stability, chloroplast genome is widely used in the research of phylogeny, molecular evolution, and genetic expression (Kwak et al. 2019; Ruf et al. 2019).
Codons are the sequence units for the transmission of genetic information in organisms. Amino acids can be encoded by one to six codons, which is called codon degeneracy (Mcclellan 2000). The codons encoding the same amino acid are synonymous codons (Prabha et al. 2012). Synonymous codons in most organisms are not used uniformly, but some specific ones are preferentially used, which is called codon usage bias (Jia and Xue 2009). Researches on codon usage bias showed the profound impact of diverse factors, such as selection pressure, mutation pressure, the phylogenetic relationship of certain species, and several other genomic attributes (Das et al. 2006; Yadav and Swati 2012; Zhao et al. 2016). Studies on codon usage patterns can determine the optimal codons, which helps design gene expression vectors to increase the expression of the target gene (Qi et al. 2015). Furthermore, it can be used to judge the expression of unknown genes or to predict some unknown functional genes based on their association with a certain function degree (Tang et al. 2000). It can help to study the molecular mechanism of organisms adapting to the external environment to explore the evolutionary relationship between species (Singh et al. 2005). Moreover, it also has important value in the improvement of varieties.
The genus Gynostemma (family Cucurbitaceae) contains about 17 species, mainly distributed in tropical Asia to East Asia, from the Himalayas to Japan, Malaysia, and New Guinea. In China, there are 14 species, while nine of them are endemic (Flora of China 2011). Gynostemma plants are important Chinese medicinal material and economic crops, which are called "Southern Ginseng". Researchers have found that it had a variety of pharmacological activities in Gynostemma plants, such as reducing the levels of blood glucose and blood lipid (Lu et al. 2018; Huang et al. 2013), anti-tumor (Xing et al. 2019), protection of liver and blood vessels (Li et al. 2017), anti-oxidation (Du et al. 2018). In addition, Gynostemma plants have been developed into tea and health products, which have produced considerable economic benefits. However, the taste of most Gynostemma plants is bitter, and many scientists have worked to improve the taste of Gynostemma plants so that Gynostemma products can be more popular. It has been reported that the chloroplast genomes of nine Gynostemma species have been sequenced (Zhang et al, 2017; Wang et al. 2020a), but the codon usage bias has not been analyzed in detail. In the present study, we systematically analyzed the codon usage patterns of chloroplast genomes in nine Gynostemma species and evaluated the influence factors on codon usage. This study provided information on factors that influenced the codon usage patterns of chloroplast genomes in Gynostemma species during evolution and it could provide a reference for organism evolution and phylogeny of Gynostemma species.
Materials and methods
Genomes and coding sequences
The chloroplast genomes of nine Gynostemma species (G. longipes, G. pubescens, G. burmanicum, G. cardiospermum, G. laxiflorum, G. caulopterum, G. pentagynum, G. yixingense) were downloaded from the National Center for Biotechnology Information (NCBI) database (https://www.ncbi.nlm.nih.gov). The accession numbers of nine Gynostemma species were shown in Table 1. All protein-coding sequences (CDS) of the chloroplast genomes were filtered following the rules (Sharp and Cowe 1991; Wang et al. 2020b): (1) each CDS begins with exact initiation codon (ATG) and termination codons (TAG, TGA and TAA); (2) the number of bases is multiple of three; (3) the length of sequences should be longer than 300 bp; (4) sequences with an intermediate stop codon are excluded. The CDSs were processed by BioEdit v 7.0.9.0 software.
Table 1.
Species of nine Gynostemma plants and their accession numbers
| No | Species | Accession numbers |
|---|---|---|
| 1 | Gynostemma pentaphyllum | KX852298.1 |
| 2 | Gynostemma longipes | MF152730.1 |
| 3 | Gynostemma pubescens | MF152732.1 |
| 4 | Gynostemma burmanicum | MF152731.1 |
| 5 | Gynostemma cardiospermum | KX852299.1 |
| 6 | Gynostemma laxiflorum | MF136486.1 |
| 7 | Gynostemma caulopterum | MF136487 |
| 8 | Gynostemma pentagynum | KY670737.1 |
| 9 | Gynostemma yixingense | MT028489.1 |
Indices of codon usage
The codon usage indicators are listed below, including: (1) relative synonymous codon usage (RSCU); (2) effective number of codons (ENC); (3) GC content including the overall GC content (GC), the GC content at the first (GC1), second (GC2) and third codon position (GC3), the GC content at the third position of the synonymous codons (GC3s); (4) the overall nucleotide composition (A, T, G, C) and its composition at third codon position (A3, T3, G3, C3); (5) codon adaptation index (CAI); (6) the total number of amino acids (L_aa). MEGA-X software was used for the analysis of GC content (GC, GC1, GC2, GC3) and nucleotide composition (A, T, G, C, A3, T3, G3, C3). The other parameters were analyzed by Codon W 1.4.2 software (http://codonw.sourceforge.net/).
High frequency and optimal codons
RSCU is the ratio of observed frequency to the expected frequency of a certain codon when it is used without bias. It is an important indicator of codon usage of chloroplast genomes (Sharp and Li 1986). If the RSCU value is greater than one, strong positive codon usage bias can be observed (Sharp and Li 1987). The codon with RSCU value greater than one was defined as high frequency codon (Liu et al. 2020b). The 10% of all the filtered chloroplast genes with the highest and lowest ENC values were selected and considered as the high and low expression genes datasets, respectively. The RSCU values of the codons in two datasets were calculated and compared by ΔRSCU. The codons with ΔRSCU > 0.08 and RSCU > 1 were determined as the optimal codons (Liu et al. 2020a).
Neutrality plot analysis
In neutrality plot analysis, we used GC12 and GC3 to make a scatter plot to study the correlation among bases at three codon positions, thus analyzing the effect of mutation pressure and natural selection (Sueoka 1988). GC12 is the average of GC1 and GC2. If it is significantly correlative between GC12 and GC3, namely, the regression coefficient is almost near or equal to one, it indicates that mutation pressure is the determinant in codon usage patterns. Contrastingly, if the correlation is not significant, then the regression coefficient is close to zero, it indicates that the codon preference is dominated by natural selection (Sueoka 1988, 1999b).
ENC-plot analysis
ENC value reflects the degree of deviation of codons from random selection, and it is an important indicator reflecting the degree of imbalanced usage of synonymous codons (Wright 1990). The value of ENC ranges from 20 to 61. The larger the ENC value, the lower the codon usage bias, and vice versa (Wu et al. 2018). Usually, 35 is used as the threshold for judging the strength of the codon preference (Wright 1990; Jiang et al. 2008). GC3s is the GC content at the third position of the synonymous codons. We calculated the value of GC3s excluding methionine (Met) and tryptophan (Trp), because the codons encoding Met and Trp have no synonymous codon. ENC-plot was compiled on the value of ENC against GC3s, which was mainly to reveal the influence of base composition and to further determine whether there were other factors on codon usage bias. The standard curve was calculated according to the following formula: ENC = 2 + GC3s + (Wright 1990). The points distributing along or around the standard curve reveal that mutation pressure plays an important role in the codon usage. While the points distribute far below the standard curve, natural selection and other factors may be the major influence factor. The ENC radio was calculated according to the formula below: , which showed the difference between actual and expected ENC values (Kawabe and Miyashita 2003; Zhang et al. 2008).
Parity rule 2 (PR2) plot analysis
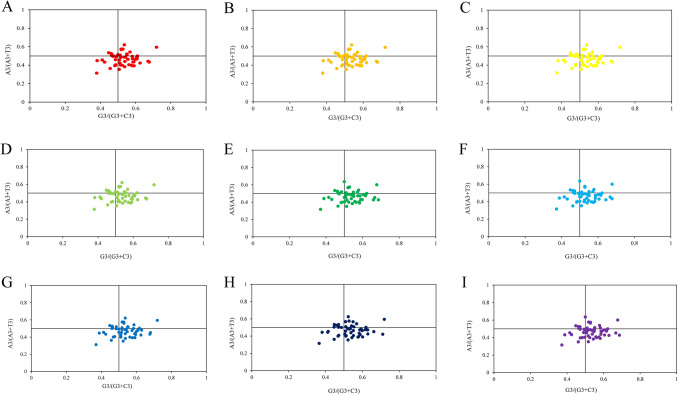
Researchers have shown that the composition of four bases at the third position of the codon is closely related to the formation of codon usage patterns (Wan et al. 2004). PR2-plot was analyzed with A3/(A3 + T3) as ordinate and G3/(G3 + C3) as abscissa in a graph (Sueoka 1999a). In theory, when single mutation pressure influences on codons of the chloroplast genes, the proportion of A/T and C/G is balanced, that is, the center points of both coordinates are equal to 0.5 (A = T and G = C). Otherwise, codon usage may be affected by natural selection and other factors (Xiang et al. 2015).
Correspondence analysis (COA)
COA is a multivariate statistical analysis method (James and McCulloch 1990), which is widely used for the analysis of codon usage patterns (Sharp and Devine 1989; Shields and Sharp 1987). COA was performed based on RSCU values of codons using Codon W 1.4.2 software. In this study, each CDS was distributed in a 59-dimensional (59 synonymous codons devoid of the codons encoding Met, Trp and the three stop codons) vector space, where each point represented a synonymous codon. The first axis (axis 1) was the one that captured most of the variation in codon usage followed by each subsequent axis explaining a diminishing amount of the variance (Zhou et al. 2008b). Correlation analysis between axis1 and GC3s, ENC, CAI and L_aa were performed using the statistical software SPSS v22.0.
Results
Codon usage patterns
Composition analysis of codon
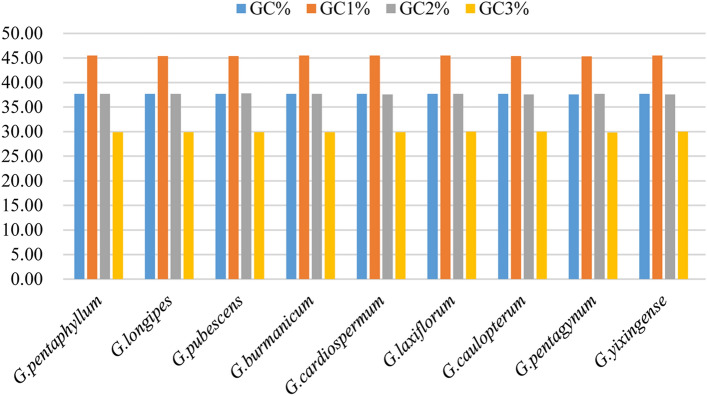
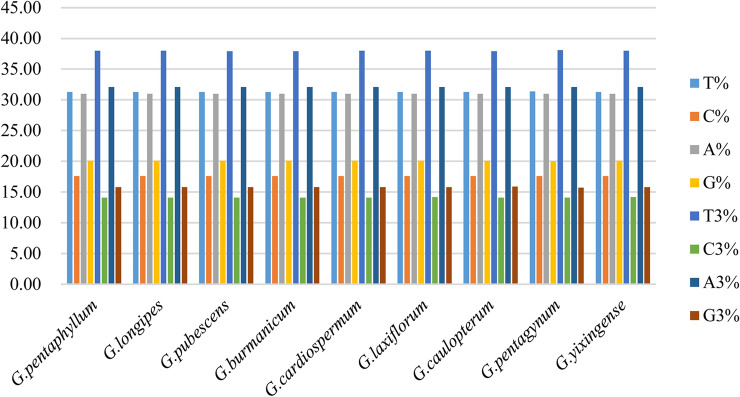
In order to analyze the codon preference accurately, indicators of codon usage were calculated and analyzed. The frequency of GC of chloroplast genes in all the nine Gynostemma species was less than 50% (Fig. 1). The content of GC1 was higher than the content of GC2 and GC3, and the content of GC3 was the lowest in nine Gynostemma species. The nucleotide composition analysis indicated that nucleotides A, T, G, and C were distributed unequally, while nucleotide T showed the highest usage percentage followed by A, G, and C in nine Gynostemma species (Fig. 2).
Fig. 1.
Distribution of overall GC content, GC1, GC2, and GC3 of chloroplast genes in nine Gynostemma species
Fig. 2.
Distribution of nucleotides for chloroplast genes in nine Gynostemma species
High frequency codons and optimal codons
The results of frequency analysis of synonymous codons for the CDSs of chloroplast genes showed that nine Gynostemma species had a high similar preference for codon usage (Table S1). There were 29 high frequency codons with RSCU > 1 while 28 codons of them ended with A/T accounting for 96.55%. The number of codons with RSCU < 1 was 30 with 28 codons ending with C/G that accounted for 93.33%. This indicated that high frequency codons (RSCU > 1) tended to be A/T ending while the codons with negative bias (RSCU < 1) were prone to end with G/C. The nine Gynostemma species possessed 29 identical high frequency codons of chloroplast genes including GCT, GCA, TGT, GAT, GAA, TTT, GGA, GGT, CAT, ATT, AAA, TTA, CTT, TTG, AAT, CCT, CCA, CAA, AGA, CGA, CGT, TCT, TCA, AGT, ACT, ACA, GTA, GTT and TAT.
The ENC values of chloroplast genes were calculated in nine Gynostemma species. The results showed that a majority of chloroplast genes had ENC values greater than 35, except rps8 in G. pentaphyllum and G. longipes, indicating an overall weak codon usage bias. Based on the ENC values and the ΔRSCU method (Liu et al. 2020a), the optimal codons were determined (Table S1). The results showed that nine Gynostemma species contained eight identical optimal codons including TCA, ACA, TAT, CAT, AAT, GAT, AGA, GGA. However, there were one more optimal codon (TTG) in G. cardiospermum and four more optimal codons (TTG, CTT, GCA, CGA) in G. pentagynum than the other seven Gynostemma species respectively. In a total of 12 optimal codons, 11 codons ended with T (5/12) or A (6/12), while only one codon ended with G (1/12). The results above indicated that the high frequency and optimal codons of chloroplast genes in Gynostemma species preferred A/T ending.
Multivariate statistical analysis
Neutrality plot analysis
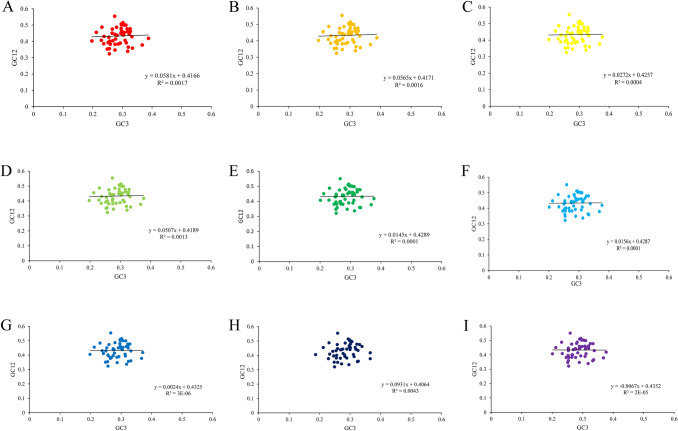
The neutrality plots were performed for the chloroplast genes in nine Gynostemma species (Fig. 3). There was no significant correlation between GC12 and GC3 (r1 = 0.0414, r2 = 0.0403, r3 = 0.0192, r4 = 0.0358, r5 = 0.0100, r6 = 0.0109, r7 = 0.0165, r8 = 0.0654, r9 = − 0.0048). The slope of regression line was 0.0581, 0.0565, 0.0272, 0.0507, 0.0145, 0.0156, 0.0024, 0.0931, 0.0067, respectively, indicating mutation pressure effect accounted only 0.24–5.81%. Those above indicated that codon usage bias was affected slightly by the mutation pressure, but the natural selection and other factors seemed to make more contributions.
Fig. 3.
Neutrality plot of chloroplast genomes of nine Gynostemma species. (A) G. pentaphyllum, (B) G. longipes (C), G. pubescens (D), G. burmanicum, (E) G. cardiospermum, (F) G. laxiflorum, (G) G. caulopterum, (H) G.pentagynum, (I) G. yixingense
ENC-plot analysis
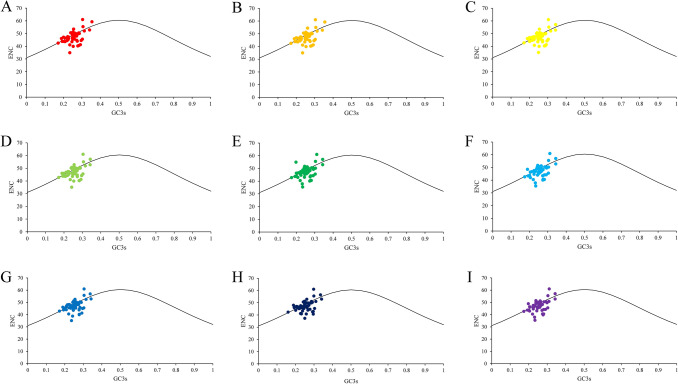
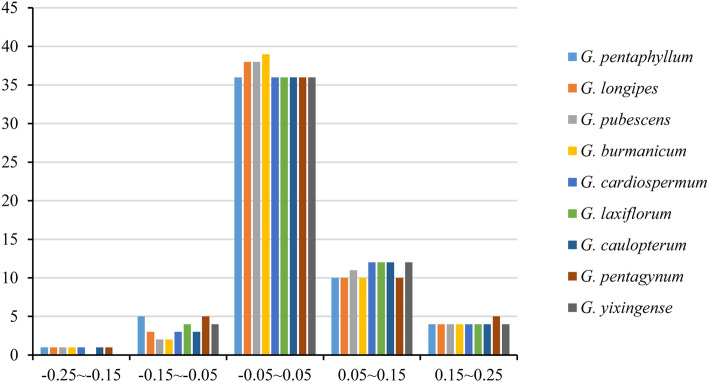
In the ENC-plot, we observed that the distributions of ENC and GC3s of nine Gynostemma species were similar (Fig. 4). As shown in Fig. 4, only a few points approached the standard curve, which revealed that GC3s was not the main factor affecting the codon bias. And for most of the points distributed in a discrete distribution, it implied that there might exist other factors influencing the codon usage patterns. In order to further reflect the difference, we analyzed the ENC frequency distribution of chloroplast genes in nine Gynostemma species (Fig. 5). The ENC ratio was between − 0.25 and 0.25. Of these, 36–39 (63.16–68.42%) chloroplast genes distributed in the range of − 0.05–0.05.
Fig. 4.
ENC-plot of chloroplast genomes of nine Gynostemma species. (A) G. pentaphyllum, (B) G. longipes, (C) G. pubescens, (D) G. burmanicum, (E) G. cardiospermum, (F) G. laxiflorum, (G) G. caulopterum, (H) G.pentagynum, (I) G. yixingense
Fig. 5.
Distribution of ENC frequency of chloroplast genomes in nine Gynostemma species
PR2-plot analysis
The PR2-plot analysis reflected the degree of deviation of four bases of chloroplast genes. We observed that the genes were unevenly distributed in four areas of the PR2-plane (Fig. 6). Most of the points are distributed at the bottom right of the plane, and a few points are distributed close to the center. The AT-bias is 0.470, 0.470, 0.470, 0.470, 0.470, 0.470, 0.470, 0.469, 0.470, while the GC-bias is 0.529, 0.529, 0.528, 0.528, 0.529, 0.528, 0.530, 0.529 and 0.527 respectively. It showed that the usage frequency of T at the third position of codons in chloroplast genes was higher than A, so as G was higher than C, which indicated the A/T preference in codon usage. Unbalanced usage of bases suggested that not only mutation pressure but also natural selection might have an influence on the codon usage patterns in Gynostemma species.
Fig. 6.
PR2-plot of chloroplast genomes of nine Gynostemma species. (A) G. pentaphyllum, (B) G. longipes, (C) G. pubescens, (D) G. burmanicum, (E) G. cardiospermum, (F) G. laxiflorum, (G) G. caulopterum, (H) G.pentagynum, (I) G. yixingense
Correspondence analysis (COA)
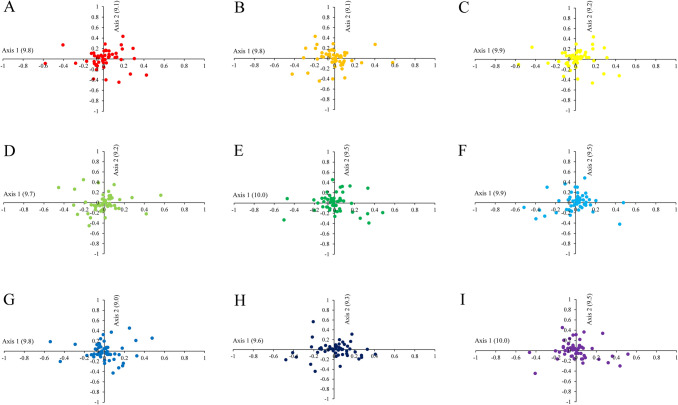
COA based on RSCU values of synonymous codons was performed to understand the relationship of chloroplast genes thus revealing the possible factors that affect the codon usage bias. The first four axes accounted for 34.41%, 34.40%, 34.50%, 34.43%, 34.80%, 35.00%, 34.67%, 34.21% and 34.90% of the total variation in nine Gynostemma species, respectively. The first axis, which being responsible for about 10% of the total variation, was the main factor of variation, while each subsequent axis explained a decreasing amount of variation. The first two axes of the COA were shown in Fig. 7. It could be observed that most of the genes were distributed around zero, while some genes had a high degree of dispersion, indicating that codon usage might be affected by different factors. Although the nine Gynostemma species had similar overall codon usage patterns, genes in different species still had their special evolutionary characteristics in codon usage.
Fig. 7.
Correspondence analysis of chloroplast genomes of nine Gynostemma species. (A) G. pentaphyllum, (B) G. longipes, (C) G. pubescens, (D) G. burmanicum, (E) G. cardiospermum, (F) G. laxiflorum, (G) G. caulopterum, (H) G.pentagynum, (I) G. yixingense
Furthermore, we calculated Karl Pearson’s correlation coefficients between axis 1 and different indices of codon usage including GC3s, ENC, CAI, and L_aa (Table 2). It was found that axis 1 had a significant correlation with GC3s (p ≤ 0.01) in G. pubescens, while G. pentaphyllum, G. longipes, G. burmanicum, G. cardiospermum and G. caulopterum had a correlation with GC3s (p ≤ 0.05). These results indicated that base composition might play a role in shaping codon usage bias.
Table 2.
Correlation coefficients between axis 1 and indices of codon usage of chloroplast genomes in nine Gynostemma species
| G. pentaphyllum | G. longipes | G. pubescens | G. burmanicum | G. cardiospermum | G. laxiflorum | G. caulopterum | G. pentagynum | G. yixingense | |
|---|---|---|---|---|---|---|---|---|---|
| GC3s | − 0.305* | 0.311* | − 0.339** | 0.314* | − 0.261* | 0.253 | − 0.316* | 0.034 | − 0.256 |
| ENC | − 0.013 | 0.016 | − 0.006 | 0.047 | − 0.082 | 0.113 | − 0.062 | 0.232 | − 0.157 |
| CAI | 0.172 | − 0.172 | 0.201 | − 0.210 | 0.108 | − 0.113 | 0.187 | 0.007 | 0.116 |
| L_aa | − 0.040 | 0.043 | − 0.035 | 0.057 | − 0.072 | 0.080 | − 0.056 | 0.072 | − 0.092 |
*Significant at p ≤ 0.05 level (two-tailed)
**Significant at p ≤ 0.01level (two-tailed)
Discussion
Codon usage bias is a widespread phenomenon in many organisms from prokaryotes to eukaryotes (Sharp et al. 1988; Nie et al. 2014). Extensive researches revealed that codon usage bias was affected by many biological factors, such as mutation bias in nucleotide composition and GC composition (Li et al. 2002; Sueoka and Kawanishi 2000), natural selection at the level of gene expression (Blake et al. 2003), gene length (Duret and Mouchiroud 1999), tRNA abundance (Duret and Mouchiroud 1999; Rao et al. 2011), secondary structure in mRNA (Gu et al. 2003). However, directional mutation pressure and natural selection are known as the major factors (Sharp et al. 2010; Sueoka 1999b).
Researches on codon usage bias have been carried out in many species, such as Oryza species (Chakraborty et al. 2020), Euphorbiaceae plants (Wang et al. 2020b), Hemiptelea davidii (Liu et al. 2020a). However, this is the first research on the systematic analysis of the codon usage of Gynostemma species. In the present study, we analyzed the chloroplast genomes of nine Gynostemma species to explore codon usage patterns and evolutionary forces which influenced the codon usage bias. There existed the same pattern in Gynostemma species, that was, the overall percentage of GC was less than 50%, and the content of GC1, GC2, and GC3 decreased in turn. The results of base composition analysis were consistent with PR2 analysis, which revealed that codons of chloroplast genomes in Gynostemma species tended to end with A and T, especially with T being the most preferred nucleotide. Some scholars had shown that codon nucleotide composition was highly conserved, while the third nucleotide position of codons was AT-rich in the eudicot genomes, but GC-rich in the monocot genomes (Wang and Roossinck 2006). It was reported that codons of chloroplast genomes preferred to end with A or T at the third position in Populus alba (Zhou et al. 2008a), Poaceae family (Zhang et al. 2012), and Oryza species (Chakraborty et al. 2020), which was in line with the present work.
The nine Gynostemma species contained 29 identical high frequency codons and eight identical optimal codons, but one more optimal codon in G. cardiospermum and four more optimal codons in G. pentagynum. Most of the high frequency codons (28/29) and optimal codons (11/12) ended with A or T, which was consistent with previous studies in Hemiptelea davidii (Liu et al. 2020a) and Porphyra umbilicalis (Li et al. 2019). It helps improve the gene expression of Gynostemma species through codon optimization.
It was suggested that synonymous codons usage bias was caused because of the preference for GC or AT at the third codon position. If a mutation occured on the third codon position neutrally, a synonymous codon would be chosen randomly (Zhang et al. 2008). The unequal usage of nucleotides revealed that not only mutation pressure but also other factors such as natural selection had an influence on the codon usage. Similar studies have also been reported for the codon usage of chloroplast genomes of Asteraceae (Nie et al. 2014) and Euphorbiaceae species (Wang et al. 2020b).
The neutral theory of molecular evolution holds that the effect of base mutation and natural selection on the third position of codons is neutral or close to neutral (Sharp et al. 1993). In the present study, there was no significant correlation between GC12 and GC3, and the slope of the regression line was close to zero. Combined with analysis of neutrality plot and ENC-plot, it revealed that mutation pressure made few contributions in framing the codon usage bias of chloroplast genomes in Gynostemma species, while natural selection might be the main determinant. Our study supported the previous work on chloroplast genes of Pisum species (Bhattacharyya et al. 2019) and Oryza species (Chakraborty et al. 2020). Tang and his team reported that chloroplast genes might be affected by natural selection and mutation pressure (Tang et al. 2021). Previous researches showed that natural selection played a significant role in the codon usage of chloroplast genes, but the strength of the effect was different among different populations (Morton 1998).
Analysis of COA showed that base composition made a contribution to a certain extent in the shaping codon usage bias, which was consistent with the report of researcher Wang in chloroplast genes of six Euphorbiaceae species (Wang et al. 2020b). Some scientists had shown that the influence factors of chloroplast codon usage bias were more complex (Morton 2003). The other factors which were related to codon usage bias, such as gene expression length, RNA structure needed to be further explored.
Conclusions
In general, the codon usage patterns of chloroplast genomes were similar but not the same among Gynostemma species. Furthermore, genes in different species had their special evolutionary characteristics in codon usage. The codon usage bias was low, and the CDSs of chloroplast genes preferred to end with A/T. A total of 29 high frequency codons (GCT, GCA, TGT, GAT, GAA, TTT, GGA, GGT, CAT, ATT, AAA, TTA, CTT, TTG, AAT, CCT, CCA, CAA, AGA, CGA, CGT, TCT, TCA, AGT, ACT, ACA, GTA, GTT and TAT) were identified. Eight identical optimal codons (TCA, ACA, TAT, CAT, AAT, GAT, AGA, GGA) were filtered out in nine Gynostemma species, but one more optimal codon (TTG) in G. cardiospermum and four more optimal codons (TTG, CTT, GCA, CGA) in G. pentagynum than other seven Gynostemma species respectively. These results could provide useful information in optimizing and modifying codons thus improving the gene expression of Gynostemma species. The results of multivariate analysis showed that the formation of codon usage bias might be affected by multiple factors but mainly mutation pressure and natural selection, while natural selection played a major role and mutation pressure played a minor role. Correspondence analysis revealed that base composition partly contributed in shaping codon usage bias. But the degree of influences on chloroplast genomes varied in different Gynostemma species. The study could provide a reference for organism evolution and phylogeny of Gynostemma species and help to understand the patterns of codons in chloroplast genomes in other plant species.
Supplementary Information
Below is the link to the electronic supplementary material.
Acknowledgements
This work was supported by the National Key R&D Program of China (2019YFC1711000), National Natural Science Foundation of China (Grant no. 81973414) and Natural Science Foundation of Jiangsu Province (Grant no. BK20191319).
Author contributions
Peipei Zhang collected, processed and analyzed data, produced charts and figures, authored and reviewed the draft manuscript, approved the final manuscript; Wenbo Xu analyzed and processed data, reviewed the manuscript, approved the final manuscript; Xu Lu conceived the project, reviewed the draft manuscript, approved the final manuscript; Long Wang conceived and designed the experiment, provided materials and analysis tools, guided the writing of the manuscript, reviewed the draft manuscript, approved the final manuscript.
Declarations
Conflict of interest
The authors declare no conflict of interest, financial or other aspects.
Ethical approval
Not applicable.
Footnotes
Publisher's Note
Springer Nature remains neutral with regard to jurisdictional claims in published maps and institutional affiliations.
Contributor Information
Xu Lu, Email: luxu666@163.com.
Long Wang, Email: wl80686093@126.com.
References
- Bhattacharyya D, Uddin A, Das S, Chakraborty S. Mutation pressure and natural selection on codon usage in chloroplast genes of two species in Pisum L (Fabaceae: Faboideae) Mitochondr DNA A. 2019;30:664–673. doi: 10.1080/24701394.2019.1616701. [DOI] [PubMed] [Google Scholar]
- Blake WJ, Kaern M, Cantor CR, Collins JJ. Noise in eukaryotic gene expression. Nature. 2003;422:633–637. doi: 10.1038/nature01546. [DOI] [PubMed] [Google Scholar]
- Chakraborty S, Yengkhom S, Uddin A. Analysis of codon usage bias of chloroplast genes in Oryza species: Codon usage of chloroplast genes in Oryza species. Planta. 2020;252:67. doi: 10.1007/s00425-020-03470-7. [DOI] [PubMed] [Google Scholar]
- Das S, Paul S, Dutta C. Synonymous codon usage in adenoviruses: influence of mutation, selection and protein hydropathy. Virus Res. 2006;117:227–236. doi: 10.1016/j.virusres.2005.10.007. [DOI] [PubMed] [Google Scholar]
- Du N, Wang L, Bai G, Zhang MX, Xiao YP, Zhang K, Wang P, Wang XB, Liu QH. Food safety toxicology evaluation and anti-aging analysis of Gynostemma pentaphyllum seed oil. J Northwest A F Univ (nat Sci Ed) 2018;46:131–140. [Google Scholar]
- Duret L, Mouchiroud D. Expression pattern and surprisingly, gene length shape codon usage in Caenorhabditis, Drosophila, and Arabidopsis. Proc Natl Acad Sci USA. 1999;96:4482–4487. doi: 10.1073/pnas.96.8.4482. [DOI] [PMC free article] [PubMed] [Google Scholar]
- Editorial Committee of the Chinese Academy of Sciences Flora of China. Science Press, Beijing. 2011;19:11–15. [Google Scholar]
- Galtier N, Lobry JR. Relationships between genomic G+C content, RNA secondary structures, and optimal growth temperature in prokaryotes. J Mol Evol. 1997;44:632–636. doi: 10.1007/PL00006186. [DOI] [PubMed] [Google Scholar]
- Gu WJ, Zhou T, Ma JM, Sun X, Lu ZH. Folding type specific secondary structure propensities of synonymous codons. IEEE T Nanobiosci. 2003;2:150–157. doi: 10.1109/TNB.2003.817024. [DOI] [PubMed] [Google Scholar]
- Huang XF, Song Y, Song CW, Wang MY, Liu HX, Yu SG, Fang NB. Study on the hypoglycemic activity of different components of Gynostemma pentaphyllum. Hubei J Trad Chinese Med. 2013;35:67–69. [Google Scholar]
- James FC, McCulloch CE. Multivariate analysis in ecology and systematics: panacea or Pandora’s box? Annu Rev Ecol Syst. 1990;21:129–166. doi: 10.1146/annurev.es.21.110190.001021. [DOI] [Google Scholar]
- Jia J, Xue Q. Codon usage biases of transposable elements and host nuclear genes in Arabidopsis thaliana and Oryza sativa. Genom Proteom Bioinf. 2009;7:175–184. doi: 10.1016/S1672-0229(08)60047-9. [DOI] [PMC free article] [PubMed] [Google Scholar]
- Jiang Y, Deng F, Wang HL, Hu ZH. An extensive analysis on the global codon usage pattern of baculoviruses. Arch Virol. 2008;153:2273–2282. doi: 10.1007/s00705-008-0260-1. [DOI] [PubMed] [Google Scholar]
- Kawabe A, Miyashita NT. Patterns of codon usage bias in three dicot and four monocot plant species. Genes Genet Syst. 2003;78:343–352. doi: 10.1266/ggs.78.343. [DOI] [PubMed] [Google Scholar]
- Kwak SY, Lew TTS, Sweeney CJ, Koman VB, Wong MH, Bohmert-Tatarev K, Snell KD, Seo JS, Chua NH, Strano MS. Chloroplast-selective gene delivery and expression in planta using chitosan-complexed single-walled carbon nanotube carriers. Nat Nanotechnol. 2019;14:447–455. doi: 10.1038/s41565-019-0375-4. [DOI] [PubMed] [Google Scholar]
- Li GL, Pan ZL, Gao SC, He YY, Xia QY, Jin Y, Yao HP. Analysis of synonymous codon usage of chloroplast genome in Porphyra umbilicalis. Genes Genom. 2019;41:1173–1181. doi: 10.1007/s13258-019-00847-1. [DOI] [PubMed] [Google Scholar]
- Li HS, Ying H, Hu AR, Hu YR, Li DZ. Therapeutic effect of gypenosides on nonalcoholic steatohepatitis via regulating hepatic lipogenesis and fatty acid oxidation. Bio Pharm Bull. 2017;40:650–657. doi: 10.1248/bpb.b16-00942. [DOI] [PubMed] [Google Scholar]
- Li YC, Korol AB, Fahima T, Beiles A, Nevo E. Microsatellites: genomic distribution, putative functions and mutational mechanisms: a review. Mol Ecol. 2002;11:2453–2465. doi: 10.1046/j.1365-294X.2002.01643.x. [DOI] [PubMed] [Google Scholar]
- Liu HB, Lu YZ, Lan BL, Xu JC. Codon usage by chloroplast gene is bias in Hemiptelea davidii. J Genet. 2020;99:8. doi: 10.1007/s12041-019-1167-1. [DOI] [PubMed] [Google Scholar]
- Liu XY, Li Y, Ji KK, Zhu J, Ling P, Zhou T, Fan LY, Xie SQ. Genome-wide codon usage pattern analysis reveals the correlation between codon usage bias and gene expression in Cuscuta australis. Genomics. 2020;112:2695–2702. doi: 10.1016/j.ygeno.2020.03.002. [DOI] [PubMed] [Google Scholar]
- Lu YL, Du YM, Qin L, Ma FF, Ling L, Wu D, Zhou XM, He YQ. Hypolipemic mechanism of saponins from Gynostemma pentaphylla based on analysis of bile acids. Nat Prod Res Dev. 2018;30:1143–1148. [Google Scholar]
- Mcclellan DA. The codon-degeneracy model of molecular evolution. J Mol Evol. 2000;50:131–140. doi: 10.1007/s002399910015. [DOI] [PubMed] [Google Scholar]
- Morton BR. Selection on the codon bias of chloroplast and cyanelle genes in different plant and algal lineages. J Mol Evol. 1998;46:449–459. doi: 10.1007/PL00006325. [DOI] [PubMed] [Google Scholar]
- Morton BR. The role of context-dependent mutations in generating compositional and codon usage bias in grass chloroplast DNA. J Mol Evol. 2003;56:616–629. doi: 10.1007/s00239-002-2430-1. [DOI] [PubMed] [Google Scholar]
- Nie XJ, Deng PC, Feng KW, Liu PX, Du XH, You FM, Song WM. Comparative analysis of codon usage patterns in chloroplast genomes of the Asteraceae family. Plant Mol Biol Rep. 2014;32:828–840. doi: 10.1007/s11105-013-0691-z. [DOI] [Google Scholar]
- Prabha R, Singh DP, Gupta SK, Farooqi S, Rai A. Synonymous codon usage in Thermosynechococcus elongatus (cyanobacteria) identifies the factors shaping codon usage variation. Bioinformation. 2012;8:622–628. doi: 10.6026/97320630008622. [DOI] [PMC free article] [PubMed] [Google Scholar]
- Qi YY, Xu WJ, Xing T, Zhao MM, Li NN, Yan L, Xia GM, Wang MC. Synonymous codon usage bias in the plastid genome is unrelated to Gene structure and shows evolutionary heterogeneity. Evol Bioinform. 2015;2015:65–77. doi: 10.4137/EBO.S22566. [DOI] [PMC free article] [PubMed] [Google Scholar]
- Rao YS, Wu GZ, Wang ZF, Chai XW, Nie QH, Zhang XQ. Mutation bias is the driving force of codon usage in the Gallus gallus genome. DNA Res. 2011;18:499–512. doi: 10.1093/dnares/dsr035. [DOI] [PMC free article] [PubMed] [Google Scholar]
- Ruf S, Forner J, Hasse C, Kroop X, Seeger S, Schollbach L, Schadach A, Bock R. High-efficiency generation of fertile transplastomic Arabidopsis plants. Nat Plants. 2019;5:282–289. doi: 10.1038/s41477-019-0359-2. [DOI] [PMC free article] [PubMed] [Google Scholar]
- Sharp PM, Cowe E. Synonymous codon usage in Saccharomyces cerevisiae. Yeast. 1991;7:657–678. doi: 10.1002/yea.320070702. [DOI] [PubMed] [Google Scholar]
- Sharp PM, Cowe E, Higgins DG, Shields DC, Wolfe KH, Wright F. Codon usage patterns in Escherichia coli, Bacillus subtilis, Saccharomyces cerevisiae, Schizosaccharomyces pombe, Drosophila melanogaster and Homo sapiens; a review of the considerable within-species diversity. Nucleic Acids Res. 1988;16:8207–8711. doi: 10.1093/nar/16.17.8207. [DOI] [PMC free article] [PubMed] [Google Scholar]
- Sharp PM, Devine KM. Codon usage and gene expression level in Dictyostelium discoideum highly expressed genes do ‘prefer’ optimal codons. Nucleic Acids Res. 1989;17:5029–5039. doi: 10.1093/nar/17.13.5029. [DOI] [PMC free article] [PubMed] [Google Scholar]
- Sharp PM, Emery LR, Zeng K. Forces that influence the evolution of codon bias. Philos Trans R Soc B. 2010;365:1203–1212. doi: 10.1098/rstb.2009.0305. [DOI] [PMC free article] [PubMed] [Google Scholar]
- Sharp PM, Li WH. An evolutionary perspective on synonymous codon usage in unicellular organisms. J Mol Evol. 1986;24:28–38. doi: 10.1007/BF02099948. [DOI] [PubMed] [Google Scholar]
- Sharp PM, Li WH. The codon adaptation index - a measure of directional synonymous codon usage bias, and its potential applications. Nucleic Acids Res. 1987;15:1281–1295. doi: 10.1093/nar/15.3.1281. [DOI] [PMC free article] [PubMed] [Google Scholar]
- Sharp PM, Stenico M, Peden JF, Lloyd AT. Codon usage: mutational bias, translational selection, or both? Biochem Soc Trans. 1993;21:835–841. doi: 10.1042/bst0210835. [DOI] [PubMed] [Google Scholar]
- Shields DC, Sharp PM. Synonymous codon usage in Bacillus subtil and reflects both translational selection and multational biases. Nucleic Acids Res. 1987;15:8023–8040. doi: 10.1093/nar/15.19.8023. [DOI] [PMC free article] [PubMed] [Google Scholar]
- Singh ND, Davis JC, Petrov DA. X-linked genes evolve higher codon bias in Drosophila and Caenorhabditis. Genetics. 2005;171:145–155. doi: 10.1534/genetics.105.043497. [DOI] [PMC free article] [PubMed] [Google Scholar]
- Sueoka N. Directional mutation pressure and neutral molecular evolution. Proc Natl Acad Sci USA. 1988;85:2653–2657. doi: 10.1073/pnas.85.8.2653. [DOI] [PMC free article] [PubMed] [Google Scholar]
- Sueoka N. Translation-coupled violation of Parity Rule 2 in human genes is not the cause of heterogeneity of the DNA G+C content of third codon position. Gene. 1999;238:53–58. doi: 10.1016/S0378-1119(99)00320-0. [DOI] [PubMed] [Google Scholar]
- Sueoka N. Two aspects of DNA base composition: G+ C content and translation-coupled deviation from intra-strand rule of A=T and G=C. J Mol Evol. 1999;49:49–62. doi: 10.1007/PL00006534. [DOI] [PubMed] [Google Scholar]
- Sueoka N, Kawanishi Y. DNA G+C content of the third codon position and codon usage biases of human genes. Gene. 2000;261:53–62. doi: 10.1016/S0378-1119(00)00480-7. [DOI] [PubMed] [Google Scholar]
- Tang DF, Wei F, Cai ZQ, Wei YY, Khan A, Miao JH, Wei KH. Analysis of codon usage bias and evolution in the chloroplast genome of Mesona chinensis Benth. Dev Genes Evol. 2021;231:1–9. doi: 10.1007/s00427-020-00670-9. [DOI] [PubMed] [Google Scholar]
- Tang L, Shah S, Chung L, Carney J, Katz L, Khosla C, Julien B. Cloning and heterologous expression of the epothilone gene cluster. Science. 2000;287:640–642. doi: 10.1126/science.287.5453.640. [DOI] [PubMed] [Google Scholar]
- Wan XF, Xu D, Leinhofs A, Zhou JZ, Quantitative relationship between synonymous codon usage bias and GC composition across unicellular genomes. BMC Evol Biol. 2004;4:19. doi: 10.1186/1471-2148-4-19. [DOI] [PMC free article] [PubMed] [Google Scholar]
- Wang L, Lu GY, Liu H, Huang LJ, Jiang WM, Li P, Lu X. The complete chloroplast genome sequence of Gynostemma yixingense and comparative analysis with congeneric species. Genet Mol Biol. 2020;43:e20200092. doi: 10.1590/1678-4685-GMB-2020-0092. [DOI] [PMC free article] [PubMed] [Google Scholar]
- Wang LJ, Roossinck MJ. Comparative analysis of expressed sequences reveals a conserved pattern of optimal codon usage in plants. Plant Mol Biol. 2006;61:699–710. doi: 10.1007/s11103-006-0041-8. [DOI] [PubMed] [Google Scholar]
- Wang ZJ, Xu BB, Li B, Zhou QQ, Wang GY, Jiang XZ, Wang CC, Xu ZD. Comparative analysis of codon usage patterns in chloroplast genomes of six Euphorbiaceae species. Peer J. 2020;8:e8251. doi: 10.7717/peerj.8251. [DOI] [PMC free article] [PubMed] [Google Scholar]
- Wright F. The ‘effective number of codons’ used in a gene. Gene. 1990;87:23–29. doi: 10.1016/0378-1119(90)90491-9. [DOI] [PubMed] [Google Scholar]
- Wu YQ, Li ZY, Zhao DQ, Tao J. Comparative analysis of flower-meristem-identity gene APETALA2 (AP2) codon in different plant species. J Integr Agr. 2018;17:867–877. doi: 10.1016/S2095-3119(17)61732-5. [DOI] [Google Scholar]
- Xiang H, Zhang RZ, Butler RR, Liu T, Zhang L, Pombert JF, Zhou ZY. Comparative analysis of codon usage bias patterns in Microsporidian genomes. PLoS ONE. 2015;10:e0129223. doi: 10.1371/journal.pone.0129223. [DOI] [PMC free article] [PubMed] [Google Scholar]
- Xing SF, Liu LH, Zu ML, Lin M, Zhai XF, Piao XL. Inhibitory effect of damulin B from Gynostemma pentaphyllum on human lung cancer cells. Planta Med. 2019;85:394–405. doi: 10.1055/a-0810-7738. [DOI] [PubMed] [Google Scholar]
- Yadav MK, Swati D. Comparative genome analysis of six malarial parasites using codon usage biasbased tools. Bioinformation. 2012;8:1230–1239. doi: 10.6026/97320630081230. [DOI] [PMC free article] [PubMed] [Google Scholar]
- Zhang WJ, Zhou J, Li ZF, Wang L, Gu X, Zhong Y. Comparative analysis of codon usage patterns among mitochondrion, chloroplast and nuclear genes in Triticum aestivum L. J Integr Plant Biol. 2008;49:246–254. doi: 10.1111/j.1744-7909.2007.00404.x. [DOI] [Google Scholar]
- Zhang X, Zhou T, Kanwal N, Zhao YM, Bai GQ, Zhao GF. Completion of Eight Gynostemma BL. (Cucurbitaceae) chloroplast genomes: characterization, comparative analysis, and phylogenetic relationships. Front Plant Sci. 2017;8:1–13. doi: 10.3389/fpls.2017.01583. [DOI] [PMC free article] [PubMed] [Google Scholar]
- Zhang YR, Nie XJ, Jia XO, Zhao CZ, Biradar SS, Wang L, Du XH, Song WM. Analysis of codon usage patterns of the chloroplast genomes in the Poaceae family. Aust J Bot. 2012;60:461–470. doi: 10.1071/BT12073. [DOI] [Google Scholar]
- Zhao YC, Zheng H, Xu AX, Yan DH, Jiang ZJ, Qi Q, Sun JC. Analysis of codon usage bias of envelope glycoprotein genes in nuclear polyhedrosis virus (NPV) and its relation to evolution. BMC Genomics. 2016;17:677–677. doi: 10.1186/s12864-016-3021-7. [DOI] [PMC free article] [PubMed] [Google Scholar]
- Zhou M, Long W, Li X. Analysis of synonymous codon usage in chloroplast genome of Populus alba. J for Res. 2008;19:293–297. doi: 10.1007/s11676-008-0052-1. [DOI] [Google Scholar]
- Zhou M, Long W, Li X. Patterns of synonymous codon usage bias in chloroplast genomes of seed plants. For Stud China. 2008;10:235–242. doi: 10.1007/s11632-008-0047-1. [DOI] [Google Scholar]
Associated Data
This section collects any data citations, data availability statements, or supplementary materials included in this article.


