Abstract
Roots are the prime organ for nutrient and water uptake and are therefore fundamental to the growth and development of plants. However, physical challenges of a heterogeneous environment and diverse edaphic stresses affect root growth in soil. Compacted soil is a serious global problem, causing inhibition of root elongation, which reduces surface area and impacts resource foraging. Visualisation and quantification of roots in soil is difficult due to this growth substrate’s opaque nature; however, non-destructive imaging technologies are now becoming more widely available to plant and soil scientists working to address this challenge. We have recently developed an integrated approach, combining X-ray Computed Tomography (X-ray CT) and confocal microscopy to image roots grown in compacted soil conditions from a plant to a cellular scale. The method is suited to visualize cellular responses of root tips grown in both non-compacted and compacted soils. This protocol presents a fully integrated workflow, including soil column preparation, creation of compaction conditions, plant growth, imaging, and quantification of root adaptive responses at a cellular scale.
Keywords: Soil, Root, Computed tomography, Soil compaction, Rice
Background
Soil compaction is an increasingly challenging problem for modern farming, as it deforms the physical, chemical, and biological properties of agricultural soil. Modern agriculture practices rely on the use of large and heavy machinery such as tractors and harvesters. These modern practices compress both top- and sub-soil ( Keller et al., 2019 ). Hard (compacted) soils represent a major challenge facing modern agriculture that can reduce crop yields by over 50% through reducing root growth, causing significant losses annually. Soil compaction triggers a reduction in root penetration and uptake of water and nutrients. Despite its clear importance for agriculture and global food security, the mechanism underpinning root compaction responses has been unclear until now. Imaging root adaptive responses in natural soil conditions can provide invaluable and critical responses of rhizosphere biology. Previously, most soil compaction studies did not adopt an integrated approach to image the growing roots from cellular to plant organ scales. More generally, this integrated imaging approach can be applied to other root-soil related stress responses. This protocol is applicable to image the root tip responses of several crop species, including both monocot and dicotyledonous plants in mechanical impedance stress or other edaphic stresses. So far, we have tested this protocol on the roots of rice, wheat, barley, brachypodium, pearl millet, foxtail millet, maize, and tomato plants growing in soil.
Materials and Reagents
-
Soil column preparation
3D-printed plastic column/polyvinyl chloride (PVC) or high-density polyethylene (HDPE) drainage pipe
Double-sided adhesive tape (Radabar Double-Sided membrane tape 4000GA, 10 × 50 mm)
Cloth-backed adhesive tape (Gaffa tape, Kitepackaging, UK)
20 l plastic storage box
Air-dried and sieved (<2 mm) field soil (sandy loam and clay loam)
Spatula (A2Z SciLab, 32 mm × 8 mm), 7-inch tapered end spatula
Rice, Arabidopsis seeds
-
Root anatomy imaging
Slides (BS70011/2, 1.0-1.2 mm, Thermo Scientific) and coverslip (22 × 50 mm, No.1, SLS Ltd. UK)
Calcofluor white (M2R, fluorescent brightener 28) (Polysciences, catalog number: 4359)
4% paraformaldehyde (Merck, CAS number: 30525-89-4)
PFA power (Sigma-Aldrich, catalog number: P6148-1Kg)
Agarose (Sigma-Aldrich, catalog number: A9539)
Xylitol (Sigma-Aldrich, catalog number: W507930-1Kg)
Sodium deoxycholate (Sigma-Aldrich, catalog number: SRE0046-500g)
Urea (Sigma-Aldrich, catalog number: U5128-1Kg)
4% PFA (see Recipes)
ClearSee (root clearing solution) (see Recipes)
Equipment
Hand saw or pipe cutter (RS Pro 150 mm hacksaw, UK)
Fine mesh (nylon dress net fabric, Fabric Land, UK)
Stainless steel scissors (115 mm) (Spring Iris Scissors, SS, N828/01, SAMCO)
Digital balance (HF4000, A&D Company limited)
Microwave oven
Fine paint brush
Tweezers (FisherbrandTM Dumont #5 Fine Tip Tweezers, Z3) and forceps (BochemTM Stainless Steel Sharp Tip Forceps, 1133)
GE Phoenix v|tome|x M 240 kV X-ray tomography system (GE Inspection Technologies, Wunstorf, Germany)
Confocal microscope (Leica SP5/SP8)
Leica vibratome (Leica Microsystems, model: VT1000s)
RS PRO hot plate (700W) (RS Components, Corby, UK. RS Stock No: 490-1036)
High performance workstation computer
Recommended systems requirements: Intel Core i7 with 2.9 GHz and 32-64 GB of RAM (or higher)
Software
Volume Graphics VGStudioMax 2.2 (Volume Graphics GmbH, Germany)
Datos|REC software (GE Inspection Technologies, Wunstorf, Germany)
Polyline tracing (VGStudioMAX V2.2 (Volume graphics GmbH, Germany)
Leica LASX (Leica Microsystems)
Fiji/ImageJ (NIH) ( Schneider et al., 2012 ; Rueden et al., 2017 ), Version 1.53c
Procedure
-
Soil column preparation
-
Depending on the plant species, and for how long you want to grow the plant, different column dimensions may be required. For our experiments, rice was grown in column dimensions of 10 cm height × 3 cm diameter for 10 days with a minimum of four replicates per treatment.
Note: As the roots of the plant grow, they will eventually reach the boundary of the column. This will have implications for the measurement of root angle and depth. In the case of root angle, a sharp downwards trajectory is common, so we suggest only measuring the angle at the point of contact with the column wall. Measurements of primary root length should be made before the primary root reaches the bottom of the column. A preliminary assessment of the growth rate of the roots of the plant species you are working with is recommended.
To facilitate easy removal of the plant from the soil following X-ray CT scanning, a column was designed which could be easily split longitudinally and opened into two equal halves. The column also features a tapered base plate and separate holding jig, to facilitate identical placement inside the X-ray CT scanner for each scan. Both the columns and holding jig were manufactured using a fused deposition modelling 3D printer in Polylactic Acid (PLA) (Figure 1). Source files for the 3D models and suggested print settings are available at https://github.com/UoNMakerSpace/.
-
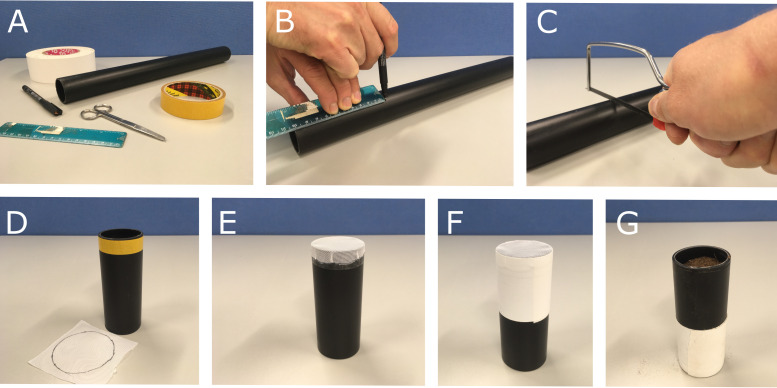
If a 3D printer is not available, cut a 10 cm length of 3 cm diameter plastic drainpipe (Figure 2C), then remove any burr from the ends using a coarse grade (80 grit) sandpaper.
Note: It is important to cut the drainpipe at a 90° angle to ensure the column sits vertically upright. This helps to minimize the size of the reconstructed data volume following the CT scan, as columns that are not straight (i.e., tilted) require a larger volumetric field of view to capture the full column in the scan.
Using a black marker pen, draw a circle of 2.5 cm radius on the nylon fabric mesh (white) and then cut it out using scissors following the circular mark.
Cut a 0.5 cm wide × 8 cm long strip of double-sided sticky tape and fix it around the plastic column, so the edge of the tape is flush to the bottom edge of the column (Figure 2D). Stretch the nylon fabric mesh across the bottom of the column (Figure 2E), allowing the sticky tape to hold the material in place with even tension. Wrap a 10 cm length of cloth-backed adhesive tape around the edges of the material to securely fix the column (Figure 2F).
Calculate the volume of the column to a soil filling height of 9 cm. The volume of the 3 cm diameter column we used was 63.62 cm3. Measure the radius, height, and weight of the empty column to calculate the bulk density.
-
To achieve a soil bulk density (BD) of 1.1 g/cm3 and 1.6 g/cm3, add 69.98 g and 101.78 g of sieved (<2 mm) air dried soil to the column, respectively.
Notes:
To make the non-compacted soil treatment (1.1 g/cm3), weigh 69.98 g of soil, add to the column then gently tap the base of the column (2-3 times during filling the soil) to settle the soil to reach 9 cm height of the column.
To make the compacted soil treatment (1.6 g/cm3), weigh 50.89 g of soil, press it until it occupies 4.5 cm height of the column, and then add the remaining 50.89 g of soil, compressing it to reach 9 cm height of the column.
-
For both bulk density treatments, add 7.77 g of soil to create a non-compacted zone with a final soil filled height of 10 cm.
Note: This helps establishment of the pregerminated seeds on the top of the column, otherwise most seeds will fail to grow in the compacted soil.
Place the column in a tray containing sterilized water to a depth of 3 cm. Leave overnight at room temperature to saturate the soil from the bottom of the column upwards.
After 8-12 h, ensure the surface of the soil is fully saturated, remove the columns from the tray of water, and allow them to drain freely for 48 h, then record their mass. The mass of the column is equivalent to the notional field capacity moisture of the soil.
-
Place a pregerminated rice seed into the surface of the soil and cover gently with soil to place the radicle into top non-compacted soil. Be careful not to damage the emerging radicle.
Note: Briefly, de-husked rice seeds were sterilized with 10% bleach solution for 5 min and thereafter washed with sterilized reverse osmosis (RO) water 5 times. The sterilized seeds were placed on a wet Whatman paper in the dark for two days, and the pregerminated seeds were then gently placed in the top 1.1 BD soil of both columns.
-
Grow the rice seedlings in suitable growth rooms (at 30°C, 12-hour photoperiod and 300 μmol·m-2·s-1 light with 70% relative humidity) for 4 days. Maintain the moisture content at field capacity for each column, by checking its weight and adding water to the top surface of the soil if needed. The weight of the columns should be checked daily (Figure 3).
Note: For our soils, the volumetric water content was 18% and 14%, respectively, for the 1.1 g/cm3 and 1.6 g/cm3 BD treatments. The soil moisture content is dependent on soil texture and organic matter status, so it is important to calculate this for your own specific experimental conditions.
Note: For the compaction study, root tips were used which were growing through soil, not on the soil surface.
-
Do not add water on the day before X-ray CT scanning, as high soil water content can reduce the efficiency of root segmentation.
Note: We leave the columns to be scanned on tissue paper for 12hrs before scanning to reduce soil moisture content (approx. 80% Field Capacity).
-
-
X-ray Computed Tomography
After turning on the CT scanner, first optimize the CT scanner by conditioning and centering the X-ray tube following the manufacturer’s guidelines. Collect offset (black) and gain (white) detector calibration images for the chosen X-ray energy and detector settings. This process typically takes 20-30 min.
The scan parameters provided in Table 1 are suitable for imaging soil column diameters 30-60 mm using a GE Phoenix v|tome|x m 240 kV CT scanner. Enter each parameter into the GE Datos acq software (GE Sensing and Inspection Technologies GmbH, Wunstorf, Germany).
Place the soil column with the plant on the rotation stage and ensure it is stable. Close the scanner door, turn on the X-rays, and select the ‘live’ image on the monitor screen.
Make a new project in the software for the scan to save the images. Check the parameters are all correct and then press ‘start’.
When the scan is complete, use the GE Datos rec software to reconstruct the data.
Open the scan in Datos rec and use the scan optimizer tool to calculate the geometric center calibration, and counteract any sample movement which may have occurred during the scan.
Apply a Beam Hardening Correction (BHC) value of 8 and then use the AutoROI function to set the region of interest for reconstruction, to remove the very top and bottom of the scan volume which often contain cone-beam artifacts. Reconstruction is made in a 16-bit depth image format.
The reconstructed data is now ready for polyline tracing of the root in non-compacted and compacted soils.
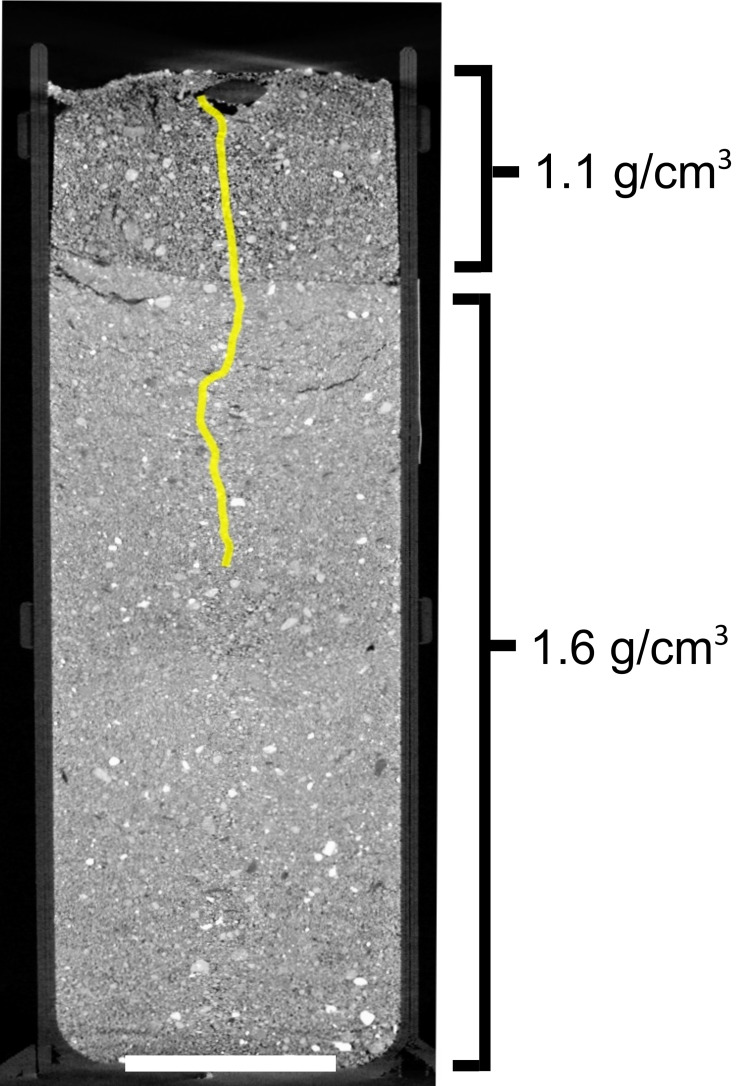
Open the data in VGStudioMAX software, and use the polyline measurement tool to trace the trajectory of the roots from the seed down into the soil profile. Record the length of each root (Figure 4).
-
Root anatomical imaging (longitudinal)
Carefully open the 3D printed column.
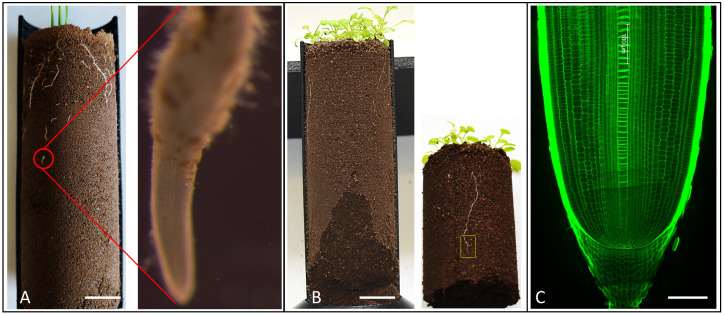
Remove (cut) the soil from the column leaving the root tip zone (2 cm) intact (see Figure 3B).
Place the 2 cm soil block containing the root tip in sterilized water for 5 min.
Wash the soil with a gentle flow of water 3-5 times to remove the soil from the root tip.
Finally, remove the remaining soil particles from the root tip using a fine paint brush. Do not press the brush too hard as the root tip can break very easily.
Fix (preserve) the washed root tips in freshly-prepared 4% (w/v) paraformaldehyde solution (PFA) in a vacuum chamber for 1 h (Figure 5A).
Wash the rice root tips with 1× PBS buffer three times for two minutes each.
-
Store and clear the root tips using ClearSee solution for 15 days (Figure 5B). Using a confocal microscope, check if the root tips are cleared using Calcoflour staining (Figure 5C); if necessary, extend the clearing stage for longer (20-25 days).
Note: Compacted soil grown root tips require longer times (20-25 days) to clear than non-compacted soil root tips, as they have larger diameters.
Stain the root tips with either Yellow direct 96 (Diphenyl Brilliant Flavine 7GFF Sigma) or Calcofluor dye (Calcofluor White Stain, Sigma) at a final concentration of 100 µg/ml for 2 h in a vacuum chamber. Alternatively, staining can be done on the benchtop for 3-5 days if a vacuum chamber is not available.
Wash with ClearSee to remove the stain for 2 min.
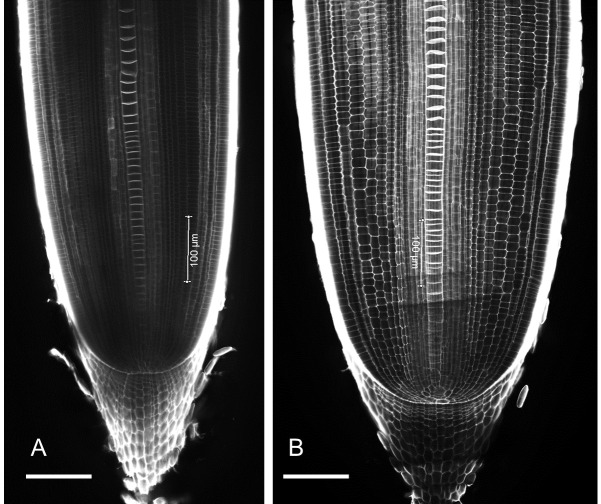
Image the root tips through confocal microscopy, using an argon laser at 405-nm excitation and detecting at 425-475 nm (Figure 6).
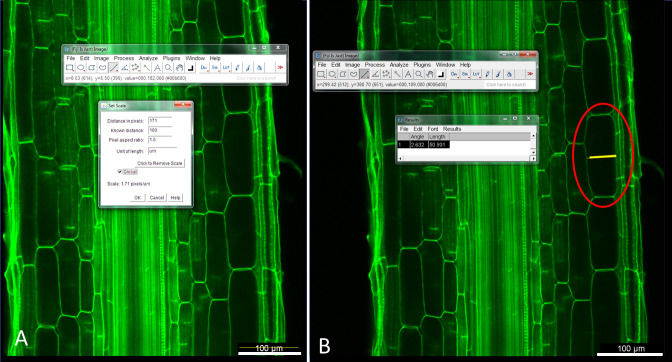
Open the images in ImageJ software and set the scale.
Calculate the epidermal root length manually, by selecting each epidermal cell using longitudinal images.
-
Root anatomical imaging (radial)
-
Place the washed root tips in sterilized water for 10 min, while preparing a 3.5% agarose gel solution using a microwave oven.
Note: Use a ‘pulsed’ operation of the microwave by intermittently switching off and on every 5-10 s to avoid boiling the agarose (boiling agarose solution may explode).
Allow the agarose solution to cool at room temperature for 20 min.
-
Place the root tips in a 3D-printed embedding mold.
Note: You can obtain the 3D print file using the Nottingham Maker Space GitHub site ( https://github.com/UoNMakerSpace/ ).
-
Slowly pour the melted agarose solution into the 3D-printed embedding molds over the root tips.
Note: During the pouring process, the orientation of root tips can change. To mitigate this movement, first completely fill the mold with agarose solution then reorient the root tips using a pair of forceps before the agarose solidifies.
Keep at room temperature for 30 min until fully solidified.
-
Use a vibratome to cut transverse sections of the root tips.
Note: Please follow the detailed vibratome protocol as described in Atkinson and Wells (2017).
Stain the sections on a glass slide with 1% Calcofluor white dye for 5 min.
Place a coverslip on the root section and image with a confocal microscope as described above (Figure 7).
Open the images in ImageJ software.
Quantify the root cortical cell diameter in image by measuring the diameter of the cortical cells using radial images generated in confocal microscope.
-
Figure 1. Example of the 3D printed column used for CT imaging.
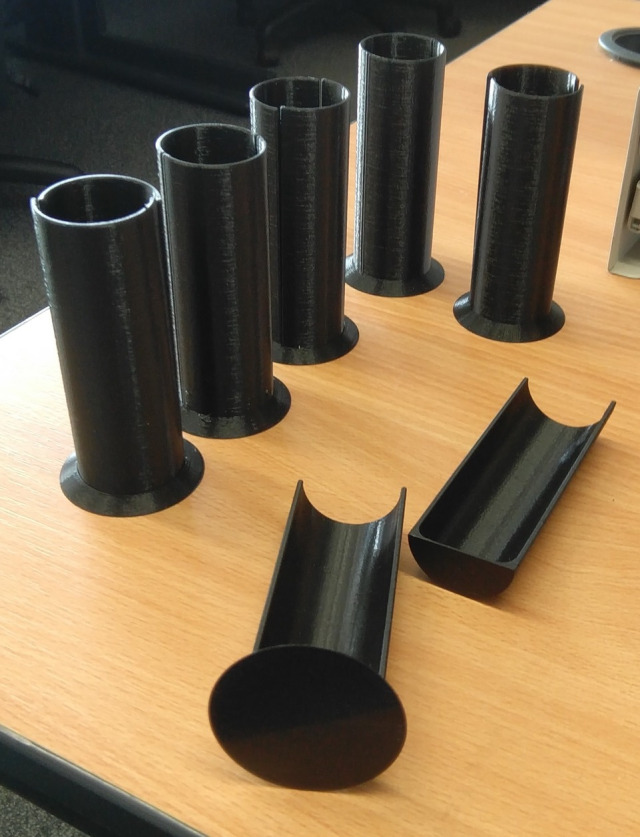
Figure 2. Example method to prepare columns for growing plants in soil for CT imaging.
(A) Starting materials, (B) Marking 10 cm drain pipe length, (C) Cutting drain pipe with a hand saw (D) Double sided tape attached to column (upside down) and nylon mesh circle (5 cm diameter), (E) Nylon mesh fixed to column after removing double side tape backing, (F) Cloth backed adhesive tape added to securely attach mesh to column, (G) Finished column filled with soil (right way up).
Figure 3. Identification and selection of roots for anatomical scale imaging.
Rice (A) and Arabidopsis root (B) grown in 3D printed (half open) column growing in compacted soil. The red circle and yellow rectangle show the root tip zone of rice and Arabidopsis roots, respectively. (C) Longitudinal image of rice root tip grown in non-compacted soil.
Table 1. X-ray CT scan parameters suitable for imaging a 30-60 mm diameter soil core.
The scan was conducted in ‘FAST’ Scan mode (continuous rotation of sample with no image averaging).
|
X-ray Energy (kV) |
X-ray Current (µA) |
Projection Images |
Detector timing (ms) | Image averaging | Image skip |
Resolution (µm) |
Multiscan |
Scan time (min) |
| 140 | 200 | 2520 | 131 | 0 | 1 | 45 | x1 | 5 |
Figure 4. CT image showing rice root growth in compacted soil with BD of 1.6 g/cm3.
The upper 1 cm is non-compacted soil (1.1 g/cm3) to allow the initial establishment of the root; the root then grows into the compacted (1.6 g/cm3) soil in the lower part of the column. Scale bar 20 mm.
Figure 5. Schematic images showing rice root tip fixation in 4% PFA (A), clearing in ClearSee solution (B) and staining with calcofluor dye (C).
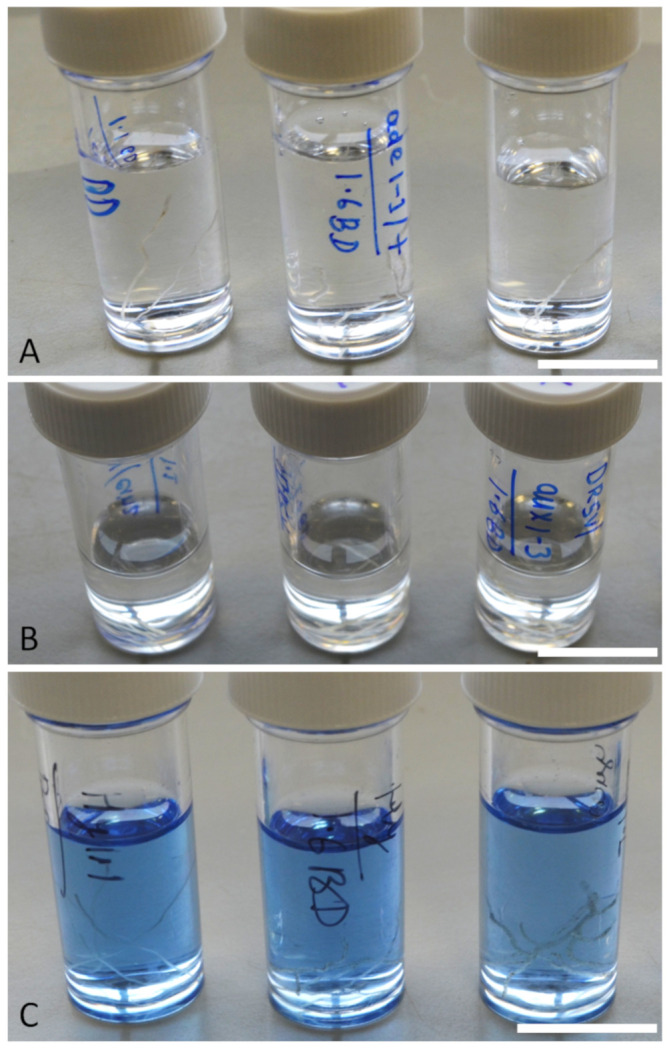
Scale bar 15 mm.
Figure 6. Example longitudinal images of rice root tips grown under (A) non-compacted (1.1g/cm3) and (B) compacted (1.6g/cm3) soil conditions for 10 days.
Rice roots in compacted soil have a larger root diameter. Scale Bar 100 µm.
Figure 7. Radial confocal images of rice root grown in non-compacted soil (1.1g/cm3).
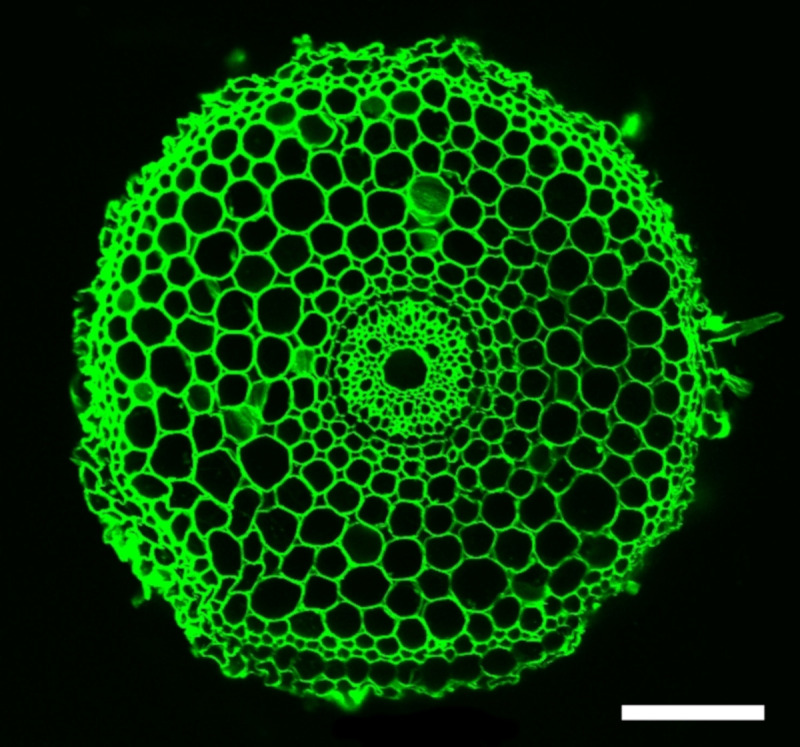
Scale bar: 100 μm.
Data analysis
-
Root length measurement analysis
Open the VGStudioMAX software and use the polyline measurement tool to trace the root length across all (2520) the CT image slices. See Video 1.
Start from the radicle emergence from the seed and trace until the end of the root tips.
The polyline tool will give the length of the root.
These root length data from non-compacted and compacted soil-grown genotypes will be further used to calculate mean % root length inhibition using either excel or GraphPad prism software.
Use t-test or ANOVA to calculate the level of significance.
Repeat the experiments independently at least 3 times with 12 replicates.
-
Cortical cell diameter and epidermal cell length measurement
Open the radial cross section confocal images (.tif files) in FIJI software ( Schindelin et al., 2012 ) (Figure 8).
Select the scale bar length in the Analyze section and set the scale as given in the image (for example 100 µm). To measure the length of the scale bar, use the ‘straight line’ tool (Figure 8A).
Zoom in the radial confocal images to better see the boundaries of cortical cells.
Draw a line over each cortical cell covering its entire diameter and measure the diameter of each cortical cell in the images (Figure 8B).
Repeat this process for all radial confocal images.
Analyze the change in diameter of cortical cells using excel and GraphPad prism software.
-
Use t-test or ANOVA to calculate the level significance between control and mutant roots.
Note: Similar analysis will be done in longitudinal images for calculating the epidermal cell sizes of roots grown in non-compacted and compacted soils.
Video 1. Demonstration of how to use the polyline tool in VGStudoMAX software to measure root length.
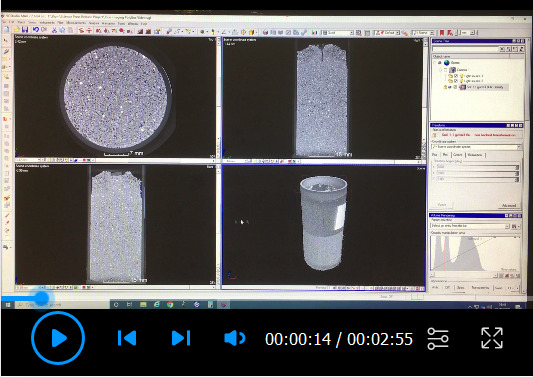
Figure 8. Illustration of how to (A) set the image scale and (B) quantifiy root cortical cell diameter using Fiji software.
(A) Use the ‘line tool’ to measure the scale bar and then ‘set scale’ to 100 microns. (B) Use the line tool to measure the cortical cell diameter (red circle).
Recipes
-
4% PFA (adapted from Ursache et al., 2018 )
PFA powder, phosphate-buffered saline (PBS), 1 M KOH, and 1 M HCl
-
Mix 4 g of PFA powder with 100 ml of 1× PBS. To dissolve it completely, heat the solution to 65°C on a hot plate using a magnetic stirrer.
Note: Do not boil the solution. PFA is carcinogenic material and very harmful! You must read the SOP before using this chemical.
Add 1 M KOH drop by drop until it is completely dissolved.
Slightly add a few drops of 1 M HCl to lower the pH to 7 (ideally 6.9), when the solution becomes completely transparent.
Note: If possible, always use freshly prepared 4% PFA. Remaining 4% PFA can be stored at -20°C or 4°C for short term use.
-
-
ClearSee (adopted from Ursache et al., 2018 )
Xylitol (final 10% w/v)
Sodium deoxycholate (final 15% w/v)
Urea (final 25% w/v)
Sterilized water
Mix all the three components in water and on a magnetic stirrer until completely dissolved! It takes a bit longer time (~60 min).
Acknowledgments
B.K.P acknowledges BBSRC Discovery fellowship (BB/V00557X/1), Challenge Grant–Royal Society (CHG\R1\170040). B.K.P. and J.A.A received funding from The University of Nottingham Future Food Beacon of Excellence. The authors thank Malcolm Bennett and Darren Wells for their useful comments in the preparation of this manuscript. This protocol was adapted with minor modification from a previous study published by Pandey and Huang (2021; DOI: 10.1126/science.abf3013).
Competing interests
The authors declare no competing or financial interests.
Ethics
No Ethics Committee approval was required for the root soil compaction study.
Citation
Readers should cite both the Bio-protocol article and the original research article where this protocol was used.
Q&A
Post your question about this protocol in Q&A and get help from the authors of the protocol and some of its users.
References
- 1. Atkinson J. A. and Wells D. M.(2017). An Updated Protocol for High Throughput Plant Tissue Sectioning. Front Plant Sci 8: 1721. [DOI] [PMC free article] [PubMed] [Google Scholar]
- 2. Keller T., Sandin M., Colombi T., Horn R. and Or D.(2019). Historical increase in agricultural machinery weights enhanced soil stress levels and adversely affected soil functioning. Soil Tillage Res 194: 104293. [Google Scholar]
- 3. Pandey B. K. and Huang G.(2021). Plant roots sense soil compaction through restricted ethylene diffusion. Science 371(6526): 276-280. [DOI] [PubMed] [Google Scholar]
- 4. Schindelin J., Arganda-Carreras I., Frise E., Kaynig V., Longair M., Pietzsch T., Cardona A.(2012). Fiji: an open-source platform for biological-image analysis. Nat Methods 9(7): 67-682. [DOI] [PMC free article] [PubMed] [Google Scholar]
- 5. Ursache R., Andersen T. G., Marhavy P. and Geldner N.(2018). A protocol for combining fluorescent proteins with histological stains for diverse cell wall components. Plant J 93(2): 399-412. [DOI] [PubMed] [Google Scholar]


