

Abstract
Purpose:
Water needs increase during pregnancy, and proper hydration is critical for maternal and fetal health. This study characterized weekly hydration status changes throughout pregnancy and examined change in response to a randomized, behavioral intervention. An exploratory analysis tested how underhydration during pregnancy was associated with birth outcomes.
Methods:
The Healthy Mom Zone Study is a longitudinal, randomized-control trial intervention aiming to regulate gestational weight gain (GWG) in pregnant women with overweight/obesity (n=27). Fourteen women received standard of care; 13 women additionally received weekly guidance on nutrition, physical activity, water intake, and health-promoting behaviors. Hydration status was measured weekly via overnight urine osmolality (Uosm) from ~8–36 weeks gestation; underhydration was dichotomized (Uosm≥500 mOsm/kg). Gestational age- and sex-standardized birth weight and length z scores and percentiles were calculated. We used mixed-effect and linear regression models to test covariate-adjusted relationships.
Results:
No differences existed in Uosm or other characteristics between control and intervention women at baseline. Significant interactions (p=0.01) between intervention and week of pregnancy on Uosm indicated intervention women maintained lower Uosm, whereas control women had a significant quadratic (inverse-U) relationship and greater Uosm in the second and early third trimesters. Results were consistent across robustness and sensitivity checks. Exploratory analyses suggest underhydration was associated with birth weight, but not length, in opposite ways in the second vs. third trimester.
Conclusion:
A multi-component behavioral intervention helped women with overweight/obesity maintain better hydration throughout pregnancy. Future studies should confirm birth outcome results as they have important implications for early life nutrition.
Trial Registration ClinicalTrials.gov Identifier: NCT03945266; registered May 10, 2019 retrospectively
Keywords: Hydration, Water intake, pregnancy, Urine osmolality, birth outcomes, DOHaD
Introduction
Water needs increase during pregnancy, and proper hydration is critical to physiological functioning of both the mother and fetus [1]. Increases in total body water account for a substantial portion of maternal weight gain [2], and there also appears to be a rise in water turnover as pregnancy progresses [3]. Hence, pregnant women are advised to consume 300 ml more water per day than non-pregnant, non-lactating women [1]. However, water recommendations do not specify differential water needs or hydration status recommendation by pregnancy month or trimester, nor do they take into account body composition [4,1]. Yet, in 2017-2018, 42% of US women had obesity while the majority of women had body mass index (BMIs) greater than 25 kg/m2 [5], which increases probability of being underhydrated [6].
While longitudinal assessments of total body water have been examined during pregnancy [3,7,8,2,9,10], few studies have examined how hydration status changes over the course of pregnancy. Evidence shows that total body water increased progressively from the first through the third trimesters of pregnancy, but gains in total body water do not necessarily indicate adequate hydration status [7,2]. While prenatal urinary hydration biomarkers are associated with total fluid intake [8], no known studies have explored the degree to which urine concentration changes from week-to-week over the course of pregnancy.
The hydration for health hypothesis posits that maintaining urine osmolality (Uosm) under 500 milliosmoles per kilogram (mOsm/kg), an indicator of adequate hydration, reduces negative health outcomes such as kidney stones, urinary tract infections, and kidney disfunction [11]. Research with humans has not yet tested the relationship between hydration status and maternal-fetal health outcomes with birth weight, specifically. The developmental origins of health and disease (DOHaD) framework provides one way to understand how hydration status in utero may affect birth outcomes [12–14]. Animal models have demonstrated that intra-utero dehydration via water restriction, particularly during the second half of pregnancy, results in lower fecundity and giving birth to smaller offspring with both shorter length and lower body weight [15–18]. Population level data has indicated that drought during pregnancy is likewise associated with lower birth weight, though individual hydration status was not measured in these studies [19,20]. Previous studies have also found that total body water relates to birth weight [21–23,10]; however, to our knowledge, no longitudinal studies have examined how weekly variation in hydration status throughout pregnancy affect birth weight and length among human offspring.
Thus, this study aimed to fill these gaps by using data from a longitudinal, randomized-control intervention trial among pregnant women with overweight or obesity. First, we examined how Uosm changed on a weekly basis during pregnancy. Second, we tested whether this relationship was modified by a behavioral intervention aimed to regulate gestational weight gain (GWG) with recommendations to boost water intake and eat water-dense foods. We hypothesized that Uosm would increase in the second and third trimesters given increased water demands and total body water [7] but that the intervention would reduce urine concentration. As exploratory analyses due to the overall small sample size of birth outcomes, we tested how underhydration frequency during pregnancy affected birth weight and length. We hypothesized that a higher percentage of underhydrated weekly urine samples in the second and third trimesters would be associated with lower birth weight and length [17,24f].
Subjects and Methods
Two secondary outcomes (maternal hydration and fetal birth records) were analyzed from the Healthy Mom Zone Study (ClinicalTrials.gov Identifier: NCT03945266), a randomized-control, adaptive intervention feasibility trial with a primary outcome of regulating GWG in pregnant women with overweight/obesity (n=27). The Healthy Mom Zone Study protocol is described in detail elsewhere [25,26]. All participants but one (Asian) were non-Hispanic white. Overnight hydration, weight, and physical activity were measured weekly from ~8- to 36-weeks gestation.
Eligibility criteria for enrollment were: aged 18-40 years, pre-pregnancy BMI 25-45 kg/m2, singleton pregnancy between 8-12 weeks gestation, doctor’s consent for participation, and English speaking. Exclusion criteria were: multiple gestation, diabetes at screening, BMI not in the overweight/obese range, severe allergies or dietary restrictions, contraindications to prenatal physical activity, and not residing in/around Centre County, PA. We used the CONSORT reporting guidelines and the Consort Flow Chart is shown in Supplemental Figure 1. The trial had a target sample size of 12 women per group as power [27] was computed to detect an effect of the primary outcome (GWG), though not secondary outcomes.
Ethics
This project was completed in accordance with the Declaration of Helsinki. Written informed consent was obtained for each participant prior to randomization or completion of any study measures. Physician consent was also obtained for each participant. This study received ethical approval through Pennsylvania State University’s and the Clinical Research Center’s Institutional Review Board.
Experimental protocol
Fourteen women in the control group received standard of care, which means they did not receive additional education as part of the study other than what was provided from their healthcare provider which included prenatal education (e.g., restricting substances such as alcohol, genetic screening, postpartum pain management) and regular check-up appointments throughout pregnancy. Thirteen women received standard of care plus the Healthy Mom Zone intervention, which included weekly one-on-one meetings with a trained dietician to provide evidence-based education and counseling on GWG, physical activity, healthy eating, and related health behaviors, such as sleep, mental health care, and water intake [25].
The longitudinal and randomized study design ensured the number of participants was balanced across the two study arms as it used a 1:1 allocation with participants entering the study consecutively, generated by a biostatistician and implemented by the project coordinator, who did not have prior knowledge of randomization or assignment of participants [25]. The study biostatisticians developed a randomization scheme with variable size, random permuted blocks to ensure the number of participants in each group was balanced after each set of B randomized participants, with B as block size, and stratifying based on pre-pregnancy BMI [26]. Women were enrolled and randomized to the intervention or control group at the end of the baseline week. The first nighttime urine sample was collected on day 6 of the baseline week. Intervention women received their first “treatment” via education counseling session on day 7.
Women also received individualized calorie and physical activity goals. Intervention dosages were adapted over time for women that needed more intensive intervention (e.g., hands-on activities, such as healthy eating demonstrations and physical activity sessions) to regulate their weight gain within the Institute of Medicine guidelines (i.e., 15-25 lb for women with overweight; 11-20 lb for women with obesity) [28]. Every 3-4 weeks, GWG was evaluated against IOM recommendations.
When an intervention participant’s weight gain trajectory exceeded recommendations, they received an intervention adaptation or ‘step up’ consisting of more intensive hands-on healthy eating active learning sessions (e.g., cooking demonstration, grocery store tour) and onsite physical activity sessions with a fitness instructor. Intervention messaging related to hydration was embedded in the healthy eating and physical activity curricula and included recommendations for daily water intake and facts about the role of hydration during pregnancy (e.g. supporting blood volume expansion and preventing cramps and constipation). Participants were also educated on how to improve their hydration behaviors by aiming for 64 oz of plain water each day, substituting water for sugar-sweetened beverages, choosing foods with high water content (e.g. fruits, vegetables, soups) to decrease dietary energy density, and hydrating before, during, and after exercise. 100% fruit juice was encouraged during the intervention but no specific goals were set about other beverages. While personal goals of consuming 64 oz of plain water each day were set, no specific monitoring was done on whether they accomplished this. Women were also not explicitly told to examine their urine for feedback. All water intake was ad libitum and women did not receive guidance to limit their water intake before bed.
Hydration status: urine osmolality and underhydration
Overnight urine samples were collected one time per week at the same time of day each week. Women were instructed to collect all urine voids from the time they went to bed (including the last urine sample of the evening/night) through first morning void, adding each sample to a larger container. The number of overnight urine voids was summed. Because prevalence and frequency of nighttime urination increases across gestation, capturing all nighttime urine instead of only first morning void or an afternoon urine sample (which is more susceptible to influence from recent fluid intake) provided reliable and consistent estimates of weekly changes in hydration status for each woman. This method was the least invasive as this study took place over 6+ months for women living in their homes rather than collecting 24 hour voids, which is more disruptive to daily activities, but more reliable than spot samples. Following collection of the overnight urine, the samples were immediately frozen in a −20ºC freezer and then transferred to −80ºC freezer.
To measure Uosm, the samples were brought to room temperature. Freezing point depression osmometry, calculated as mOsm/kg, was used to measure Uosm in 20 µL of sample, with duplicates analyzed and the average used, with the Osmo1 Single sample micro-osmometer (Advanced Instruments, Norwood, MA) in the Water, Health, and Nutrition Lab at Penn State University. Prior to running the samples, a series of three calibration solutions at 50 mOsm/kg, 800 mOsm/kg, and 2000 mOsm/kg were analyzed to ensure the osmometer was properly calibrated. Urine samples were briefly vortexed and analyzed. We defined underhydration as Uosm of ≥500 mOsm/kg, as that cut-off in both spot and 24-hour urine samples has consistently corresponded with underhydration among pregnant women and other populations [29,8,11,30].
To estimate underhydration frequency, we summed the number of urine samples with Uosm≥500 mOsm/kg in each trimester and divided that sum by the total number of urine samples each woman provided in each trimester to generate the percent of time she was underhydrated.
Birth Outcomes
Birth weight and birth length, which were measured by medical staff, infant sex, and gestational age were all abstracted from medical records. Sex-specific birth weight-for-gestational age and length-for-gestational age z scores and percentiles were calculated using the INTERGROWTH 21st standards [31]. Birth weight was available for all 27 women. One missing birth length record (in a baby born at 36.4 weeks with −1.82 z score for birth weight) resulted in 26 women in the birth length analyses.
Covariates
Women’s age at the time of their pregnancy was recorded in years. Pre-pregnancy maternal body mass index (BMI, kg/m2) was calculated from self-reported weight by the participant. Weight was measured weekly using a FitBit Aria Wi-Fi scale women were given, which uploaded weight directly from their home. All scales were new and women were instructed on how to calibrate the scale prior to first use and how to re-calibrate if measurements seemed implausible. Weekly weight gain was calculated as the difference in weight between subsequent weeks. Total pre-post intervention GWG was calculated by subtracting each woman’s pre-intervention week weight from her final weekly recorded weight prior to delivery. One woman (treatment group) was missing weekly weight gain and pre-post intervention GWG data because of compliance issues and missing post-delivery weight (due to early emergency delivery) and many other weekly weight checks.
To measure physical activity, all women wore the Jawbone UP3 (San Francisco, CA), a wrist-worn activity monitor that has been validated as an acceptable activity monitoring device [32,33]. The number of steps was recorded for the 24 hours leading up to the urine sample. Percent of time each woman was “somewhat active” during pregnancy was estimated by summing each occasion a woman took 7500 steps [34] in a day and dividing that number by the total number of 24-hour activity recordings.
The individualized calorie intake goals came from estimated energy intake (See supplemental materials for equation and calculation details) [35] based on the women’s measured weight, physical activity data, and resting metabolic rate (RMR) as described previously [26]. We adjusted for the total energy intake (TEI) for the 24 hours leading up to the overnight urine sample as a proxy of changing energy intake and solute intake across pregnancy.
Statistical analysis
All results were analyzed in Stata Version 15.1 (StataCorp, College Station, TX). Two-tailed t-tests were used to compare differences across the intervention and control groups in descriptive characteristics before, during, and at the end of the intervention period. The alpha-value was set at 0.05.
To address our first aim, we describe changes in Uosm over pregnancy first showing variation in how each individual woman in the control and intervention groups. Second, we use a bivariate functional polynomial fit first showing change over pregnancy for all women combined, and then stratified by intervention group.
Next, we used multilevel linear mixed-effects regression models with random intercepts for individuals and intervention group to estimate how Uosm changed over the course of pregnancy and in response to the intervention. This modeling technique takes into account the longitudinal design and that the first urine sample is from the baseline week and adjusts for gestational age allowing for an examination of the effect despite women entering at slightly different times in their pregnancy. Model 1.1 regressed Uosm on week of pregnancy and intervention, testing for a quadratic relationship with week of pregnancy and an interaction between intervention status and week of pregnancy and between intervention status and week of pregnancy squared controlling for the main effects of maternal age and pre-pregnancy BMI. Model 1.2, further adjusted for the number of steps recorded on the activity monitor in the preceding day, average weekly weight gain over the course of pregnancy, and estimated TEI. This model had a reduced number of observations due to missing data among those variables in some weeks and a reduced sample size of 25 due to two women missing both weight and steps data. Since there were significant interactions, we then stratified Model 1.2 by intervention status and used a 2-level model to examine how the trends in Uosm differed over the course of pregnancy for control women (Model 1.3) and for intervention women (Model 1.4). As a robustness analysis, we re-estimated these models in two ways using the same sequence of analyses described above. First, we replaced week of pregnancy and week of pregnancy squared by trimester and included a trimester by intervention interaction along with the same covariates (Models 1.1B and 1.2B); we then stratified by intervention status (Models 1.3B and 1.4B). Second, we used multi-level mixed effects logistic regression models to examine the odds of underhydration across pregnancy by trimester among the entire sample (Models 1.1C and 1.2C) and stratified by intervention status (Models 1.3C and 1.4C).
Finally, we conducted a sensitivity analysis among a subsample (n=24 women) who had sufficient records of number of nightly urine voids. We further adjusted the primary models for number of nightly urine voids and re-estimated the full model (Models 1.2D) and stratified by intervention status (Models 1.3D and 1.4D). We also examined whether the intervention results were driven by women with higher BMIs, thus we restricted the sample to women with pre-pregnancy BMI≥29.5 (n=12) stratified by intervention status (Models 1.3E and 1.4E).
As exploratory analysis, we used linear regression models with robust standard errors to estimate how the percent of urine samples that were underhydrated in the second and third trimesters, respectively, were associated with the outcomes of birth weight z score (Model 2.1) and percentile (Model 2.2) and birth length z score (Model 2.3) and percentile (Model 2.4). In addition to the terms for percent of underhydrated urine samples in the second and in the third trimesters, all models adjusted for maternal age, pre-pregnancy BMI, GWG, and percent of weeks with 7500 or more steps. We used these models to generate the predicted birth weight and length z scores using marginal standardization adjusted for the range of covariates. As a sensitivity analysis (Models 2.1B-2.4B), we re-estimated the birth outcome analyses excluding two women who gave birth prior to 37 weeks gestation (one vaginal delivery at 35.4 with no hydration-etiology and one with a Caesarean delivery at 36.4 weeks due to hypertension, respectively).
Results
The trial ran from March 2016 to May 2018 when the desired sample size was achieved. There was high adherence to the treatment as women randomized to the intervention group completed >90% of the education/counseling sessions[26]. Twenty-seven women provided 653 overnight urine samples with an average of 24.5 weekly samples (range 16-28) per woman with high compliance of collecting overnight urine samples in both groups (94.7%). All women were nulliparous or single parity. Women were on average 30.5 years old with a BMI of 31.4 kg/m2 and did not differ by intervention group assignment in age, parity, pre-pregnancy BMI, baseline week pre-intervention Uosm, urine voids, or TEI (all p>0.05) (Table 1). All women in the intervention group started out with the same initial ‘package’ of intervention and then the intensity was ‘stepped up’ only when women exceeded their GWG goals, with the exception that each woman received individualized energy intake goals. The breakdown of number of samples and Uosm by trimester and intervention assignment is shown in Supplemental Table 1. Overall, 43.9% of all weekly overnight urine samples were underhydrated, with higher rates among women in the control group (49.1% vs 38.3%, t=2.78, p=0.006). Control women on average had higher Uosm than intervention women in the second (C=528 vs I=475 mOsm/kg; t=2.25, p=0.026) and third (568 vs 502 mOsm/kg; t=2.83, p=0.005) trimesters, but not the first, respectively (Table 1). None of the women developed hyperemesis.
Table 1:
Descriptive characteristics and birth outcomes by GWG intervention status in the Healthy Mom Zone Study, 2016-2019
| Control (n=14) | Intervention (n=13) | |
|---|---|---|
|
|
||
| Variables | Mean (Range) | |
| Pre-intervention | ||
| Age (years) | 30.9 (27, 37) | 30.3 (24, 35) |
| Pre-pregnancy BMI (kg/m2) | 32.4 (24.5, 42.8) | 30.7 (24.1, 48.9) |
| Parity: 0 (%) | 78.6% | 53.9% |
| Parity: 1 (%) | 21.4% | 46.2% |
| Baseline week | ||
| Urine osmolality (mOsm/kg) | 492 (291, 802) | 517 (233, 943) |
| Overnight urine voids | 3e (2, 4) | 2.8f (2, 3) |
| Total energy intake (TEI) | 2509g (871, 3610) | 2418 (1207, 3759) |
| During intervention | ||
| Steps per day | 4787 (1, 17,794) | 6223 (137, 18,056) |
| % of weeks active (7500 steps/day) | 14.5 (0, 57.1) | 32.4 (0, 70.8) |
| Total energy intake (TEI) | 2973 (1386, 5876) | 2804 (576, 5527) |
| Weekly samples provided | 23.5 (19, 27) | 23.5 (15, 27) |
| Urine compliance (%) a | 94.7% | 94.7% |
| Overnight urine voids | 3.0e (2, 7) | 2.8 (2, 5) |
| Urine osmolality (mOsm/kg) | 546 (201, 1317) | 489 (223, 1366) |
| 1st trimester | 479 (258, 854) | 487 (226, 966) |
| 2nd trimester | 567 (248, 1317) | 500 (223, 1366) |
| 3rd trimester | 528 (201, 961) | 475 (227, 1110) |
| Percent of samples underhydrated (Urine osmolality≥500): | ||
| 1st trimester | 28.3 (0, 75) | 43.8 (0, 100) |
| 2nd trimester | 51.0 (7.7, 100) | 37.5 (0, 100) |
| 3rd trimester | 51.3 (0, 100) | 37.3 (0, 90) |
| Post-intervention | ||
| Post intervention-GWG (lbs) | 17.4 (1.4, 37.24) c | 17.1 (−7.8, 33.0) |
| Birth weight (g) | 3383 (2183, 4570) | 3379 (2050, 4494) |
| Birth weight z score b | 0.38 (−1.87, 2.52) | 0.20 (−1.87, 2.52) |
| Birth weight percentile b | 59.5 (3.1, 99.4) | 56.2 (3.0, 99.4) |
| Birth length (cm) | 51.6 (46.4, 57.1) | 52.3 (48.3, 55.9) d |
| Birth length z score b | 1.41 (−1.59, 3.56) | 1.61 (−0.59, 3.08) d |
| Birth length percentile b | 75.1 (5.6, 99.9) | 86.4 (27.7, 99.9) d |
GWG, gestational weight gain
Urine compliance: percent of weekly samples provided divided by total number of weeks in study
Sex and gestational-age standardized calculated using INTERGROWTH-21st standards
1 woman missing GWG
missing one birth length record
Missing 1 woman’s number of nightly voids
Missing 3 women’s number of nightly voids
Missing 3 women’s estimated TEI
Hydration status during pregnancy
There was substantial individual variation in Uosm by gestational week among women in both the control and intervention groups (Figures 1a, 1b). When data for women in both groups were pooled, an inverse-U shape relation is observed with Uosm lower in the weeks of the late first trimester, rising in the second trimester, and falling in the weeks of the third trimester (Figure 2a). However, we found diverging trends by intervention status; women in the control group experienced a greater increase, on average, in Uosm in the weeks of the second trimester compared to women in the intervention group as the 95% confidence intervals do not overlap, indicating significant differences (Figure 2b). Though the average Uosm of women in the control group remained higher at the beginning of the third trimester, Uosm for both groups was declining and not different by intervention assignment in the weeks toward the end of pregnancy.
Figure 1: Individual variation in urine osmolality by intervention status across the gestational cycle (a) among control women and (b) among intervention women.

Note: n=27 women, 653 urine samples, each line represents once-weekly measurements for one woman in panels a and b. First sample for each woman was during the baseline week; second sample represents first sample post-intervention among intervention group.
Figure 2: Functional polynomial fit in urine osmolality during pregnancy for (a) all women combined and (b) by intervention status.
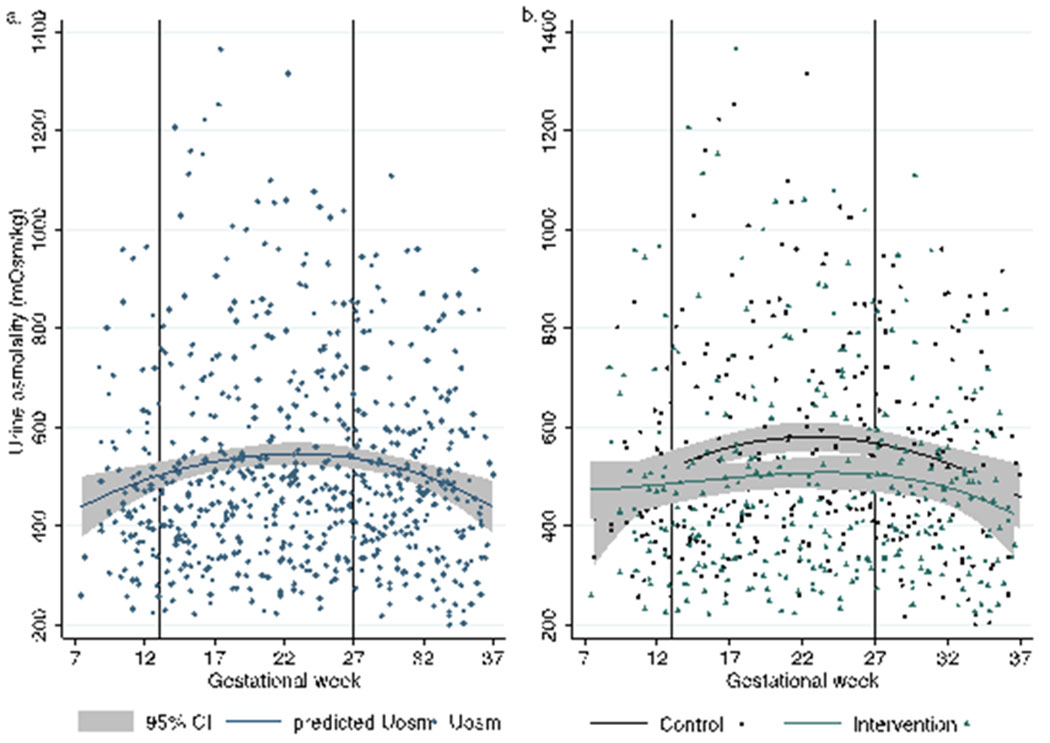
Note: First sample for each woman was during the baseline week; second sample represents first sample post-intervention among intervention group.
The multi-level mixed-effects linear regressions provided support for the different shape in the relationship between week of pregnancy and Uosm by intervention group (Table 2). We found significant associations between Uosm and week of pregnancy, week of pregnancy squared, and week of pregnancy by intervention interactions in Model 1.1 and the fully-adjusted Model 1.2. When stratified by intervention status, a clear difference in shape emerged as control women exhibited an inverse-U shape as there was an increase in Uosm by week that peaked around 24 weeks and began to decline thereafter (Model 1.3). Among the control group, each week of pregnancy was associated with an average increase of 39.2 mOsm/kg (SE=9.4, p<0.0001), while week of pregnancy squared was associated with a decrease in Uosm (B=−0.9, SE=0.2, p<0.0001). In contrast, among the intervention group, week of pregnancy was not associated with Uosm (B=−1.4, SE=7.9, p=0.86, and there was no evidence of a curvilinear relationship across time (B for quadratic term=−0.1, SE=0.2, p=0.40, Model 1.4). For women in the intervention group, but not the control group, pre-pregnancy BMI and weekly weight change were both associated with higher Uosm, while age, number of steps, and TEI were not associated with Uosm in any model.
Table 2:
Linear mixed-effects regression models examining urine osmolality by week of pregnancy for the full sample and stratified by intervention status
| Full Sample | Full Sample | Control Group | Intervention Group | |
|---|---|---|---|---|
|
|
||||
| Independent variables | Model 1.1 Urine osmolality (mOsm/kg) (SE) | Model 1.2a Urine osmolality (mOsm/kg) (SE) | Model 1.3 Urine osmolality (mOsm/kg) (SE) | Model 1.4 Urine osmolality (mOsm/kg) (SE) |
| Week of pregnancy | 28.7*** (6.7) | 39.8*** (8.5) | 39.2*** (9.4) | −1.4 (7.9) |
| (Week of pregnancy)2 | −0.6*** (0.1) | −1.0*** (0.2) | −0.9*** (0.2) | −0.1 (0.2) |
| Intervention x week of pregnancy interaction | −22.5** (9.7) | −41.3***(12.3) | -- | -- |
| Intervention x (week of pregnancy)2 interaction | 0.5** (0.2) | 1.0*** (0.3) | -- | -- |
| Intervention | 206.1* (116.7) | 384.0*** (142.3) | -- | -- |
| Pre-pregnancy BMI (kg/m2) | 5.2 (3.9) | 7.3* (4.4) | −2.3 (5.4) | 18.9*** (5.9) |
| Maternal age (years) | −2.9 (9.3) | 2.6 (9.4) | 2.5 (10.8) | −2.6 (12.6) |
| Steps per day (per 1000) | -- | −2.8 (2.5) | −4.4 (3.9) | −1.0 (3.2) |
| Average weekly weight change from pre-pregnancy weight (lb) | -- | 2.3 | −2.2 | 9.3*** |
| Total energy intake (100 kcal) | -- | −0.3 (1.5) | −0.5 (2.3) | 0.7 (1.9) |
| Observations b | 653 | 413 | 199 | 214 |
| Number of participants | 27 | 25 | 13 | 12 |
p<0.01
p<0.05
p<0.1
Note: 3-level mixed-effects model, with random effects (intercepts) for each woman nested within a random effect for intervention status, and within participants. 2-level mixed-effects model for Models 1.3 (control group) and 1.4 (intervention group) since model is stratified by intervention status. Results for Models 1.1 and 1.2 indicate the average change in Uosm in relation to week of pregnancy and in relation to the intervention, testing for an interaction between week of pregnancy and intervention group, allowing for quadratic relationships with week of pregnancy, and controlling for the covariates listed. Models 1.3 and 1.4 indicate the average change in Uosm within the control and intervention groups, respectively, in relation to each additional week of pregnancy, allowing for quadratic relationships with week of pregnancy, and controlling for the covariates listed.
Missing 2 women that did not have both weight and steps data on any sampled weeks.
Changes in number of observations across models due to missing weekly steps and weight data.
Our first robustness analysis examined change in Uosm by trimester rather than week of pregnancy, finding consistent results (Supplemental Table 2). Again, there was a significant trimester by intervention interaction (joint significance of interaction p=0.011, chi2=8.96) (Model 1.1B). This interaction indicated that Uosm changed differently for women dependent on trimester and intervention status in both the parsimonious model (Model 1.1B) and fully-adjusted model (Model 1.2B). When stratified, women in the control group had significantly higher Uosm (B=111.1 mOsm/kg, SE=35.0, p=0.001; Model 1.3B) in the second trimester compared to the first trimester, but there was no significant difference in Uosm between the third and first trimesters. Women in the intervention group, however, had marginally lower Uosm in the second trimester (B=−54.7 mOsm/kg, SE=32.3, p=0.09) and significantly lower Uosm in the third trimester (B=−118.9 mOsm/kg, SE=39.7, p=0.003; Model 4) relative to the first.
Our second robustness analysis, examining the odds of underhydration, found consistent results (Supplemental Table 3). There was a significant intervention by trimester interaction on odds of underhydration (Models 1.1C & 1.2C). When stratified, control women did not have significantly higher odds of underhydration in the second or third trimesters (Model 1.3C), whereas, women in the intervention group had lower odds of underhydration in the second (OR: 0.16, 95% CI: 0.03, 1.006, p=0.051 and third trimesters (OR: 0.03, 95% CI: 0.003, 0.31, p=0.003) compared to the first trimester (Model 1.4C).
In the first sensitivity analysis, which additionally adjusts Models 1.2-1.4 for the number of nighttime urine voids, we found consistent results (Supplemental Table 4). Overall, each additional nighttime urine voids was associated with 55.6 mOsom/kg lower Uosm (SE=12.4; p<0.001), with similar relations for both control and intervention women (Models 1.3D and 1.4D). In the second sensitivity analysis, restricting the sample to women with pre-pregnancy BMI≥29.5, we found mostly consistent results by intervention status to the main model with a slightly attenuated but significant quadratic relation for control women (Model 1.3E) and no quadratic effect for intervention women (Model 1.4E) (Supplemental Table 5).
Exploratory analysis of underhydration status on birth outcomes
The mean (SD) z scores were 0.29 (1.24) for birth weight and 1.50 (1.42) for birth length for all babies. Percentiles were 57.9 (32.5) and 80.3 (29.8) for birth weight and length, respectively. Values by intervention group are shown in Table 1.
Results testing whether a higher percentage of underhydrated overnight weekly urine samples in the second and third trimesters would be associated with lower birth weight and length are shown in Table 3. Each 10 percentage point increase in time a woman was underhydrated in the second trimester was significantly associated with lower birth weight z score (B=−0.32 z score, SE=0.13; p=0.024) and percentile (−9.3%, SE=3.3, p=0.012) (Table 3, Models 2.1 & 2.2; Figure 3a–3b). In contrast, each 10 percentage point increase in time a woman was underhydrated in the third trimester was positively associated with birth weight percentile (B=7.45%, SE=3.3, p=0.038). Percent of time spent underhydrated was not associated with birth length z score or percentile, but the coefficients for the second and third trimesters were all in the same direction as in the models for birth weight z score and percentile (Table 3, Models 2.3&2.4; Figure 3c–3d).
Table 3:
Exploratory multiple linear regression models examining birth weight and length z score and percentile in relation to the percent of underhydrated urine samples in the second and third trimesters among the full sample
| Independent variables | Model 2.1a Birth weight z score (SE) | Model 2.2a Birth weight percentile (SE) | Model 2.3a,b Birth length z score (SE) | Model 2.4a,b Birth length percentile (SE) |
|---|---|---|---|---|
| Percent of underhydrated urine samples in the 2nd trimester (per 10% point difference) c | −0.32** (0.13) | −9.31** (3.33) | −0.21 (0.16) | −3.33 (3.39) |
| Percent of underhydrated urine samples in the 3rd trimester (per 10% point difference) c | 0.27* (0.14) | 7.45** (3.33) | 0.27* (0.14) | 2.71 (2.69) |
| Intervention (control = reference) | −0.41 (0.52) | −10.26 (12.61) | 0.04 (0.60) | 4.57 (12.12) |
| Age (years) | 0.03 (0.08) | 0.03 (2.20) | 0.02 (0.14) | −1.29 (3.03) |
| GWG (lbs) | 0.07** (0.03) | 1.65** (0.62) | 0.03 (0.03) | 1.38* (0.75) |
| Pre-pregnancy BMI | 0.001 (0.05) | 0.05 (104) | −0.04 (0.05) | 0.01 (0.85) |
| Percent active time (%weeks with >7500 steps) | 0.01 (0.01) | 0.18 (0.35) | 0.00 (0.02) | 0.20 (0.30) |
| Observations | 26 | 26 | 25 | 25 |
| R-squared | 0.34 | 0.37 | 0.22 | 0.28 |
p<0.01
p<0.05
p<0.1
Note: Results from multiple linear regression analyses with robust standard errors that included all listed predictors and covariates simultaneously. Coefficients for the percent of underhydrated urine samples represent the estimated difference in birth outcomes in relation to a 10-percentage-point difference in the percent of urine samples that had a Uosm≥500 mOsm/kg while controlling for other covariates.
1 woman missing gestational weight gain (GWG);
1 woman missing birth length record
Underhydrated defined as urine osmolality≥500 mOsm/kg
Figure 3: Exploratory predicted birth weight z score and birth length z score by maternal percent of underhydrated overnight urine samples in second and third trimesters.

Note: Underhydrated defined as urine osmolality≥500 mOsm/kg. Figure generated using marginal standardization from linear regression models presented in Table 3 to present the predicted birth weight z-score (Model 2.1) in relation to percent of underhydrated urine samples in second trimester (Panel a) and third trimester (Panel b) and the predicted birth length z-score (Model 2.3) in relation to percent of underhydrated urine samples in second trimester (Panel c) and third trimester (Panel d). Models include percent of underhydrated urine samples in each trimester simultaneously and further adjust intervention status, maternal age, GWG, pre-pregnancy BMI, and percent active time (weeks with >7500 steps per day).
Of the covariates, total pre-post intervention GWG was associated with birth weight, but not length. Each pound of maternal weight gain during pregnancy was positively associated with birth weight z score (B=0.07; SE=0.03, p=0.032) and birth weight percentile (B=1.65%; SE=0.62, p=0.016) (Table 3).
In the sensitivity analyses restricting the sample to the 25 women who delivered at 37 weeks or later, we found consistent results with the primary analysis (Supplemental Table 6).
Discussion
This study’s primary aim was to examine variation in weekly hydration changes among women with overweight/obesity during pregnancy, and to examine change in response to an intervention that included recommendations to boost water intake, stay well hydrated during exercise, and eat water-dense foods. We expected to see progressive increases in Uosm from the first to the second and third trimesters given increased water demands and well-documented increases in total body water during pregnancy, thereby requiring more attention to fluid intake to meet water needs [7,36,21,37,9]. In contrast, we observed a significant quadratic relationship overall, which was driven by women in the control group who did not receive advice to increase water intake, as Uosm peaked during the second trimester around 24 weeks and then began to decrease. We hypothesized that the Healthy Mom Zone intervention to regulate GWG and maintain proper hydration would result in lower Uosm compared to control women. Women in the intervention group did not exhibit the same quadratic relationship and did not experience the same rise in Uosm as control women in the second trimester, indicating that the intervention helped women maintain a more consistent hydration and lower odds of underhydration throughout pregnancy.
As we had longitudinal data on variation in hydration status among this small group of women throughout pregnancy, we conducted an exploratory analysis examining how hydration status during pregnancy related to gestational-age- and sex-standardized birth weight and length (z score and percentile). Based on the literature, we hypothesized that a higher percentage of weekly urine samples that were inadequately hydrated in the second and third trimesters would be associated with lower birth weight and length [17,24,14]. We found partial, though somewhat contradictory findings in support of our hypothesis. Specifically, a higher percentage of urine samples inadequately hydrated in the second trimester was associated with lower birth weight but there was not a significant difference in birth length. The babies in this sample were relatively long, with mean length in the 80th percentile. Further, clinical measures of birth length often lack precision [38], which may have increased the noise in the data to detect an effect. Moreover, in contrast with our hypothesis, a greater proportion of inadequately hydrated samples in the third trimester was positively associated with birth weight percentile.
Our results are significant in light of increased water needs during pregnancy and research suggesting that large proportions of pregnant women in different parts of the world fail to meet recommendations on adequate water intake [39–41]. While water intake also appears to peak in the second trimester and then decreases in the third trimester [41,42], the second trimester is often also when nausea and morning sickness subsides, eliminating that specific barrier to physical activity. If women remain active in the second trimester, they may deal with increased water output, which, if not adequately replaced by fluid intake, could contribute to greater risk of underhydration. This could help explain the inverse-U shape relationship we found among control women, among whom we observed the highest odds of underhydration during the second trimester, when water needs begin to increase. More research is needed to understand the main barriers for women with overweight and obesity to maintain proper hydration in pregnancy (i.e., whether it is due to the hassle of frequent urination or the added feeling of fullness that water can bring during pregnancy). Moreover, future research should examine whether women with normal weight have the same risk of underhydration in the second and third trimesters.
While no known controlled studies have examined the relationship between hydration status across pregnancy and birth outcomes in humans, some longitudinal research has demonstrated positive associations between neonatal birth weight and total body water in the third trimester [21] or overall gestational gains in total body water [43]. While this exploratory analysis should be viewed with caution due to the small sample size, our results expand on these prior findings since our study population was among women with overweight and obesity and demonstrate that advice to increase water intake may help maintain adequate hydration throughout the pregnancy and thereby improve birth outcomes.
Maternal nutrition is critical to offspring health. Maternal exposure to drought during gestation is associated with lower birth weight, shorter gestation, and higher infant mortality at a population level in many low- and middle-income countries [19,24,20]. Moreover, maternal nutrition both prior to conception and in utero impact the long-term physiology and health of offspring [12]. This research supports the need for more widespread interventions such as the one delivered in this study. Such interventions would ideally begin prior to conception and continue through pregnancy. Importantly, because water needs increase even further during lactation, interventions aimed at increasing water intake during pregnancy may be important for instilling healthy water drinking habits that persist postpartum.
Given that this clinical trial targeted women with overweight and obesity, it is important to acknowledge that a higher weight status in itself is associated with higher Uosm in non-pregnant adults, even when adjusting for self-reported water intake [6]. Further, solute intake in itself can increase urine osmolality [44], which would be expected to increase with higher total energy intake. With the progression of pregnancy as TEI increases, we would also expect metabolic water to increase slightly as it is produced from the oxidation of calories. Metabolic water normally accounts for 300-400 ml of water/day [45]. While control women had ~169 kcal/day higher TEI during the intervention, this amount would likely not result in meaningful differences in metabolic water production to explain the intervention effects on Uosm. Further, total body water gains during pregnancy have not been shown to differ significantly across women in different BMI categories [43,37]. Likewise, there do not appear to be significant differences in total body water gains within different classes of obesity [46]. For women in the intervention group, pre-pregnancy BMI and GWG were predictive of Uosm; however while TEI was higher for control women, TEI was not associated with Uosm for any of the women. It is well noted that increased body water, which may range from 4 to 8 L [47,9,2,21,37,48–50,36] during gestation, accounts for a large proportion of GWG [47]. What remains to be examined, however, is whether the nondifferential gains in total body water during pregnancy in relation to fat mass may potentially put pregnant women with overweight and obesity at higher risk for worse hydration.
This study is subject to limitations. First, while the analysis of progression of hydration status over the course of pregnancy was substantiated by an intensive longitudinal design, our sample size was small for birth outcomes and likely underpowered, thus these exploratory results should be viewed with caution. Second, we cannot generalize these findings to women in normal weight categories; however, as the intervention content was developed from behavior change theory [25,51], we would expect that the intervention is scalable to women of normal weight and they would respond similarly to the educational intervention as did the women in our study. Our study was predominantly among white women, therefore, future studies should also examine whether this intervention is effective among Black and Hispanic populations in the US that have been shown to have higher odds of concentrated urine [52].
While we hypothesized that the hydration education on drinking water and eating water rich, nutrient-dense foods with low energy-density, would be the primary drivers for hydration etiology among intervention women, this study was not designed to distinguish which components of the behavioral intervention caused the difference in Uosm. In any study, there is a possibility that participation in data collection on its own can influence behavior, i.e., collecting urine overnight in this study could have encouraged hydration among the control group. However, results by intervention group demonstrated higher Uosm among control women. Thus, the intervention effects may be larger if compared to free-living women. Water needs and hydration status may also be influenced by seasonal changes over the course of pregnancy. To minimize any effects related to seasonal variation, women in the intervention and control arms were enrolled with a balanced 1:1 allocation to ensure matching for environmental and seasonal conditions. Future research could further examine seasonality in relation to the effectiveness of the intervention on hydration and birth outcomes.
Third, we did not collect data on water intake, therefore we are unable to adjust for amount of water consumed or if they were meeting their personal water goals, though previous research has demonstrated that water intake and Uosm during pregnancy were strongly related [8]. Further, results were consistent in sensitivity analyses which adjusted for number of nightly urine voids. Finally, this study froze urine samples for logistical purposes. Prior work has indicated that freezing urine samples may decrease Uosm [53] while other work [54,55] has demonstrated that Uosm is highly stable when frozen for greater than two weeks and may increase slightly over time due to evaporation. For example, Sureda-Vives [55] found that Uosm was stable and 103% of the original measurement 12 years later. Since samples for women in both groups were treated the same, we do not anticipate an effect of freezing the samples on the results or interpretation. This study examined urine osmolality from the point of view of the hydration process. While this aspect of hydration is important, future studies could also examine changes and measures of total body water deficits to understand the effect of optimal hydration.
Our study had several strengths. The enrollment of women in the first trimester allowed us to take advantage of the high resolution longitudinal, balanced RCT design with an average of 25 weekly overnight urine samples per woman to examine how hydration status changed throughout pregnancy and in relation to the intervention, including examining several sensitivity and robustness checks. The participants were highly compliant as 94.7% of all expected urine samples were provided. This is the first study to our knowledge that examined weekly progression in hydration status throughout pregnancy.
In conclusion, these findings suggest that a multi-component behavioral intervention involving weekly education on nutrition, physical activity, and water intake and healthy GWG helps women with overweight and obesity maintain proper hydration throughout pregnancy. Among women not receiving the additional water intervention, Uosm increased in the second trimester relative to the first but declined in the third trimester, whereas Uosm did not increase across trimesters in the intervention group. Our findings also provide preliminary evidence that a higher proportion of time underhydrated in the second trimester may be associated with lower birth weight. While recommendations state women should increase their water intake by 300 ml during pregnancy [1,4], we recommend consideration of a 500 mOsm/kg Uosm for optimal fetal growth. Future longitudinal research with larger sample sizes is needed to replicate findings on the relationships between hydration status and birth outcomes, which may have important implications for long-term and intergenerational health of offspring in relation to maternal hydration status.
Supplementary Material
Acknowledgements
We thank the participants in this study, the Clinical Research Center, and Biomarker Core Laboratory. We also thank the Water, Nutrition, and Health Lab research assistant Sara Caldana, the Healthy Mom Zone Study team, Dr. Daniel Rivera, Dr. Theodore Hovick, and the Mount Nittany Physician Group OBGYN providers. The authors have no conflicts of interest to disclose.
Declarations:
This work was funded by NIH NHLBI 1R01H119245; NIH 1R56HL126799-01 and supported by Penn State College of Health and Human Development start-up funds, the Ann Atherton Hertzler Early Career Professorship funds, and Penn State’s Population Research Institute (NICHD P2CHD041025). The funders had no role in the research or interpretation of results. The authors report no conflicts of interest.
Footnotes
ClinicalTrials.gov Identifier: NCT03945266
Conflict of interest
The authors declare that they have no conflict of interest.
Data share statement: Data described in the manuscript, code book, and analytic code will be made available upon request pending application and IRB approval
References:
- 1.Food and Nutrition Board, Institute of Medicine (2004) Dietary Reference Intakes for Water, Potassium, Sodium, Chloride, and Sulfate [Google Scholar]
- 2.Valensise H, Andreoli A, Lello S, Magnani F, Romanini C, De Lorenzo A (2000) Multifrequency bioelectrical impedance analysis in women with a normal and hypertensive pregnancy. The American Journal of Clinical Nutrition 72 (3):780–783. doi: 10.1093/ajcn/72.3.780 [DOI] [PubMed] [Google Scholar]
- 3.Hutchinson DL, Plentl AA, Taylor HC (1954) The total body water and the water turnover in pregnancy studied with deuterium oxide as isotopic tracer. The Journal of Clinical Investigation 33 (2):235–241 [DOI] [PMC free article] [PubMed] [Google Scholar]
- 4.Association EFS (2010) EFSA Panel on Dietetic Products, Nutrition, and Allergies (NDA); Scientific Opinion on Dietary reference values for water. EFSA Journal 8 (3):1459 [Google Scholar]
- 5.Ogden CL, Fryar CD, Martin CB, Freedman DS, Carroll MD, Gu Q, Hales CM (2020) Trends in Obesity Prevalence by Race and Hispanic Origin—1999-2000 to 2017-2018. JAMA 324 (12):1208–1210. doi: 10.1001/jama.2020.14590 [DOI] [PMC free article] [PubMed] [Google Scholar]
- 6.Rosinger AY, Lawman HG, Akinbami LJ, Ogden CL (2016) The role of obesity in the relation between total water intake and urine osmolality in US adults, 2009–2012. The American Journal of Clinical Nutrition 104 (6):1554–1561. doi: 10.3945/ajcn.116.137414 [DOI] [PMC free article] [PubMed] [Google Scholar]
- 7.Lukaski HC, Hall CB, Siders WA (2007) Assessment of change in hydration in women during pregnancy and postpartum with bioelectrical impedance vectors. Nutrition 23 (7):543–550. doi: 10.1016/j.nut.2007.05.001 [DOI] [PubMed] [Google Scholar]
- 8.McKenzie AL, Perrier ET, Guelinckx I, Kavouras SA, Aerni G, Lee EC, Volek JS, Maresh CM, Armstrong LE (2017) Relationships between hydration biomarkers and total fluid intake in pregnant and lactating women. European Journal of Nutrition 56 (6):2161–2170. doi: 10.1007/s00394-016-1256-3 [DOI] [PMC free article] [PubMed] [Google Scholar]
- 9.Bosaeus M, Andersson-Hall U, Andersson L, Karlsson T, Ellegård L, Holmäng A (2020) Body Composition During Pregnancy: Longitudinal Changes and Method Comparisons. Reproductive Sciences 27 (7):1477–1489. doi: 10.1007/s43032-020-00141-6 [DOI] [PMC free article] [PubMed] [Google Scholar]
- 10.Ghezzi F, Franchi M, Balestreri D, Lischetti B, Mele MC, Alberico S, Bolis P (2001) Bioelectrical impedance analysis during pregnancy and neonatal birth weight. European Journal of Obstetrics and Gynecology and Reproductive Biology 98 (2):171–176. doi: 10.1016/S0301-2115(01)00330-X [DOI] [PubMed] [Google Scholar]
- 11.Perrier ET, Armstrong LE, Bottin JH, Clark WF, Dolci A, Guelinckx I, Iroz A, Kavouras SA, Lang F, Lieberman HR (2020) Hydration for health hypothesis: a narrative review of supporting evidence. European Journal of Nutrition:1–14 [DOI] [PMC free article] [PubMed] [Google Scholar]
- 12.Thayer ZM, Rutherford J, Kuzawa CW (2020) The Maternal Nutritional Buffering Model: an evolutionary framework for pregnancy nutritional intervention. Evolution, Medicine, and Public Health 2020 (1):14–27. doi: 10.1093/emph/eoz037 [DOI] [PMC free article] [PubMed] [Google Scholar]
- 13.Kuzawa CW (2005) Fetal origins of developmental plasticity: Are fetal cues reliable predictors of future nutritional environments? American Journal of Human Biology 17 (1):5–21. doi: 10.1002/ajhb.20091 [DOI] [PubMed] [Google Scholar]
- 14.Rosinger AY (2020) Biobehavioral variation in human water needs: How adaptations, early life environments, and the life course affect body water homeostasis. American Journal of Human Biology 32 (1):e23338. doi: 10.1002/ajhb.23338 [DOI] [PubMed] [Google Scholar]
- 15.Kett MM, Bertram JF (2004) Nephron endowment and blood pressure: What do we really know? Current Hypertension Reports 6 (2):133–139. doi: 10.1007/s11906-004-0089-2 [DOI] [PubMed] [Google Scholar]
- 16.Lourdais O, Lorioux S, Dupoué A, Wright C, DeNardo DF (2015) Embryonic water uptake during pregnancy is stage- and fecundity-dependent in the snake Vipera aspis. Comparative Biochemistry and Physiology Part A: Molecular & Integrative Physiology 189:102–106. doi: 10.1016/j.cbpa.2015.07.019 [DOI] [PubMed] [Google Scholar]
- 17.Ross MG, Desai M (2005) Gestational programming: population survival effects of drought and famine during pregnancy. American Journal of Physiology-Regulatory, Integrative and Comparative Physiology 288 (1):R25–R33. doi: 10.1152/ajpregu.00418.2004 [DOI] [PubMed] [Google Scholar]
- 18.Desai M, Guerra C, Wang S, Ross MG (2005) Protective effect of prenatal water restriction on offspring cardiovascular homeostasis in response to hemorrhage. American Journal of Physiology-Heart and Circulatory Physiology 288 (6):H2659–H2665. doi: 10.1152/ajpheart.00875.2004 [DOI] [PubMed] [Google Scholar]
- 19.Hyland M, Russ J (2019) Water as destiny – The long-term impacts of drought in sub-Saharan Africa. World Development 115:30–45. doi: 10.1016/j.worlddev.2018.11.002 [DOI] [Google Scholar]
- 20.Cooper MW, Brown ME, Hochrainer-Stigler S, Pflug G, McCallum I, Fritz S, Silva J, Zvoleff A (2019) Mapping the effects of drought on child stunting. Proceedings of the National Academy of Sciences 116 (35):17219–17224. doi: 10.1073/pnas.1905228116 [DOI] [PMC free article] [PubMed] [Google Scholar]
- 21.Lederman SA, Paxton A, Heymsfield SB, Wang J, Thornton J, Pierson RN (1999) Maternal body fat and water during pregnancy: Do they raise infant birth weight? American Journal of Obstetrics and Gynecology 180 (1):235–240. doi: 10.1016/S0002-9378(99)70181-X [DOI] [PubMed] [Google Scholar]
- 22.Duffus GM, MacGillivray I, Dennis KJ (1971) the relationship between baby weight and changes in maternal weight, total body water, plasma volume, electrolytes and proteins and urinary oestriol excretion. BJOG: An International Journal of Obstetrics & Gynaecology 78 (2):97–104. doi: 10.1111/j.1471-0528.1971.tb00240.x [DOI] [Google Scholar]
- 23.Sanin Aguirre LH, Reza-López S, Levario-Carrillo M (2004) Relation between Maternal Body Composition and Birth Weight. Neonatology 86 (1):55–62. doi: 10.1159/000077586 [DOI] [PubMed] [Google Scholar]
- 24.Rocha R, Soares RR (2015) Water scarcity and birth outcomes in the Brazilian semiarid. Journal of Development Economics 112:72–91. doi: 10.1016/j.jdeveco.2014.10.003 [DOI] [Google Scholar]
- 25.Downs DS, Savage JS, Rivera DE, Smyth JM, Rolls BJ, Hohman EE, McNitt KM, Kunselman AR, Stetter C, Pauley AM (2018) Individually tailored, adaptive intervention to manage gestational weight gain: protocol for a randomized controlled trial in women with overweight and obesity. JMIR research protocols 7 (6):e150. [DOI] [PMC free article] [PubMed] [Google Scholar]
- 26.Downs DS, Savage JS, Rivera DE, Pauley AM, Leonard KS, Hohman EE, Guo P, McNitt KM, Stetter C, Kunselman A (2021) Adaptive, behavioral intervention impact on weight gain, physical activity, energy intake, and motivational determinants: results of a feasibility trial in pregnant women with overweight/obesity. Journal of Behavioral Medicine. doi: 10.1007/s10865-021-00227-9 [DOI] [PMC free article] [PubMed] [Google Scholar]
- 27.Julious SA (2005) Sample size of 12 per group rule of thumb for a pilot study. Pharmaceutical Statistics: The Journal of Applied Statistics in the Pharmaceutical Industry 4 (4):287–291 [Google Scholar]
- 28.National Research Council (2010) Weight gain during pregnancy: reexamining the guidelines. National Academies Press, [PubMed] [Google Scholar]
- 29.McKenzie AL, Muñoz CX, Ellis LA, Perrier ET, Guelinckx I, Klein A, Kavouras SA, Armstrong LE (2017) Urine color as an indicator of urine concentration in pregnant and lactating women. European Journal of Nutrition 56 (1):355–362. doi: 10.1007/s00394-015-1085-9 [DOI] [PMC free article] [PubMed] [Google Scholar]
- 30.Stookey JD (2019) Analysis of 2009–2012 Nutrition Health and Examination Survey (NHANES) Data to Estimate the Median Water Intake Associated with Meeting Hydration Criteria for Individuals Aged 12–80 Years in the US Population. Nutrients 11 (3):657. [DOI] [PMC free article] [PubMed] [Google Scholar]
- 31.Villar J, Ismail LC, Victora CG, Ohuma EO, Bertino E, Altman DG, Lambert A, Papageorghiou AT, Carvalho M, Jaffer YA (2014) International standards for newborn weight, length, and head circumference by gestational age and sex: the Newborn Cross-Sectional Study of the INTERGROWTH-21st Project. The Lancet 384 (9946):857–868 [DOI] [PubMed] [Google Scholar]
- 32.Ferguson T, Rowlands AV, Olds T, Maher C (2015) The validity of consumer-level, activity monitors in healthy adults worn in free-living conditions: a cross-sectional study. International Journal of Behavioral Nutrition and Physical Activity 12 (1):42. [DOI] [PMC free article] [PubMed] [Google Scholar]
- 33.Downs DS, Savage J, Rivera D, Pauley A, Hess L, Guo P Preliminary findings of an individually-tailored” just-in-time” adaptive intervention to manage prenatal weight gain. In: Annals of Behavioral Medicine, 2016. Oxford Univ Press Inc Journals Dept, 2001 Evans Rd, Cary, NC 27513 USA, pp S162–S162 [Google Scholar]
- 34.Downs DS, LeMasurier GC, DiNallo JM (2009) Baby steps: pedometer-determined and self-reported leisure-time exercise behaviors of pregnant women. Journal of Physical Activity and Health 6 (1):63–72 [DOI] [PubMed] [Google Scholar]
- 35.Vesco KK, Karanja N, King JC, Gillman MW, Perrin N, McEvoy C, Eckhardt C, Smith KS, Stevens VJ (2012) Healthy Moms, a randomized trial to promote and evaluate weight maintenance among obese pregnant women: study design and rationale. Contemporary clinical trials 33 (4):777–785 [DOI] [PMC free article] [PubMed] [Google Scholar]
- 36.Pipe NGJ, Smith T, Halliday D, Edmonds CJ, Williams C, Coltart TM (1979) Changes in fat, fat-free mass and body water in human normal pregnancy. BJOG: An International Journal of Obstetrics & Gynaecology 86 (12):929–940. doi: 10.1111/j.1471-0528.1979.tb11240.x [DOI] [PubMed] [Google Scholar]
- 37.Lederman SA, Paxton A, Heymsfield SB, Wang J, Thornton J, Pierson RN (1997) Body fat and water changes during pregnancy in women with different body weight and weight gain. Obstetrics & Gynecology 90 (4, Part 1):483–488. doi: 10.1016/S0029-7844(97)00355-4 [DOI] [PubMed] [Google Scholar]
- 38.Wood AJ, Raynes-Greenow CH, Carberry AE, Jeffery HE (2013) Neonatal length inaccuracies in clinical practice and related percentile discrepancies detected by a simple length-board. Journal of paediatrics and child health 49 (3):199–203 [DOI] [PubMed] [Google Scholar]
- 39.Zhou Y, Zhu X, Qin Y, Li Y, Zhang M, Liu W, Huang H, Xu Y (2019) Association between total water intake and dietary intake of pregnant and breastfeeding women in China: a cross-sectional survey. BMC Pregnancy and Childbirth 19 (1):172. doi: 10.1186/s12884-019-2301-z [DOI] [PMC free article] [PubMed] [Google Scholar]
- 40.Bardosono S, Prasmusinto D, Hadiati DR, Purwaka BT, Morin C, Pohan R, Sunardi D, Chandra DN, Guelinckx I (2016) Fluid Intake of Pregnant and Breastfeeding Women in Indonesia: A Cross-Sectional Survey with a Seven-Day Fluid Specific Record. Nutrients 8 (11):651. [DOI] [PMC free article] [PubMed] [Google Scholar]
- 41.Martinez H (2014) Fluid Consumption by Mexican Women during Pregnancy and First Semester of Lactation. BioMed Research International 2014:603282. doi: 10.1155/2014/603282 [DOI] [PMC free article] [PubMed] [Google Scholar]
- 42.Malisova O, Protopappas A, Nyktari A, Bountziouka V, Antsaklis A, Zampelas A, Kapsokefalou M (2014) Estimations of water balance after validating and administering the water balance questionnaire in pregnant women. International Journal of Food Sciences and Nutrition 65 (3):280–285. doi: 10.3109/09637486.2013.860585 [DOI] [PubMed] [Google Scholar]
- 43.Butte NF, Ellis KJ, Wong WW, Hopkinson JM, Smith EOB (2003) Composition of gestational weight gain impacts maternal fat retention and infant birth weight. American Journal of Obstetrics & Gynecology 189 (5):1423–1432. doi: 10.1067/S0002-9378(03)00596-9 [DOI] [PubMed] [Google Scholar]
- 44.Yeh H-C, Lin Y-S, Kuo C-C, Weidemann D, Weaver V, Fadrowski J, Neu A, Navas-Acien A (2015) Urine osmolality in the US population: Implications for environmental biomonitoring. Environ Res 136:482–490. doi: 10.1016/j.envres.2014.09.009 [DOI] [PMC free article] [PubMed] [Google Scholar]
- 45.Manz F, Johner SA, Wentz A, Boeing H, Remer T (2012) Water balance throughout the adult life span in a German population. Br J Nutr 107 (11):1673–1681. doi:doi: 10.1017/S0007114511004776 [DOI] [PubMed] [Google Scholar]
- 46.Most J, Altazan AD, Hsia DS, Beyl RA, Redman LM (2020) Body Composition During Pregnancy Differs by Obesity Class. Obesity 28 (2):268–276. doi: 10.1002/oby.22699 [DOI] [PMC free article] [PubMed] [Google Scholar]
- 47.Widen EM, Factor-Litvak PR, Gallagher D, Paxton A, Pierson RN, Heymsfield SB, Lederman SA (2015) The Pattern of Gestational Weight Gain is Associated with Changes in Maternal Body Composition and Neonatal Size. Maternal and Child Health Journal 19 (10):2286–2294. doi: 10.1007/s10995-015-1747-5 [DOI] [PMC free article] [PubMed] [Google Scholar]
- 48.Van Loan MD, LE Kopp, JC King, WW Wong, PL Mayclin (1995) Fluid changes during pregnancy: use of bioimpedance spectroscopy. Journal of Applied Physiology 78 (3):1037–1042. doi: 10.1152/jappl.1995.78.3.1037 [DOI] [PubMed] [Google Scholar]
- 49.Kopp-Hoolihan LE MD Van Loan, Wong WW, King JC (1999) Fat mass deposition during pregnancy using a four-component model. Journal of Applied Physiology 87 (1):196–202. doi: 10.1152/jappl.1999.87.1.196 [DOI] [PubMed] [Google Scholar]
- 50.Larciprete G, Valensise H, Vasapollo B, Altomare F, Sorge R, Casalino B, De Lorenzo A, Arduini D (2003) Body composition during normalpregnancy: reference ranges. Acta Diabetologica 40 (1):s225–s232. doi: 10.1007/s00592-003-0072-4 [DOI] [PubMed] [Google Scholar]
- 51.Symons Downs D, DiNallo JM, Birch LL, Paul IM, Ulbrecht JS (2017) Randomized Face-to-face vs. Home exercise interventions in pregnant women with gestational diabetes. Psychology of Sport and Exercise 30:73–81. doi: 10.1016/j.psychsport.2017.02.003 [DOI] [PMC free article] [PubMed] [Google Scholar]
- 52.Brooks CJ, Gortmaker SL, Long MW, Cradock AL, Kenney EL (2017) Racial/ethnic and socioeconomic disparities in hydration status among US adults and the role of tap water and other beverage intake. American journal of public health 107 (9):1387–1394 [DOI] [PMC free article] [PubMed] [Google Scholar]
- 53.Adams JD, Kavouras SA, Johnson EC, Jansen LT, Capitan-Jimenez C, Robillard JI, Mauromoustakos A (2017) The Effect of Storing Temperature and Duration on Urinary Hydration Markers. International Journal of Sport Nutrition and Exercise Metabolism 27 (1):18. doi: 10.1123/ijsnem.2016-0098 [DOI] [PubMed] [Google Scholar]
- 54.Remer T, Montenegro-Bethancourt G, Shi L (2014) Long-term urine biobanking: storage stability of clinical chemical parameters under moderate freezing conditions without use of preservatives. Clinical biochemistry 47 (18):307–311 [DOI] [PubMed] [Google Scholar]
- 55.Sureda-Vives M, Morell-Garcia D, Rubio-Alaejos A, Valiña L, Robles J, Bauça JM (2017) Stability of serum, plasma and urine osmolality in different storage conditions: relevance of temperature and centrifugation. Clinical biochemistry 50 (13-14):772–776 [DOI] [PubMed] [Google Scholar]
Associated Data
This section collects any data citations, data availability statements, or supplementary materials included in this article.