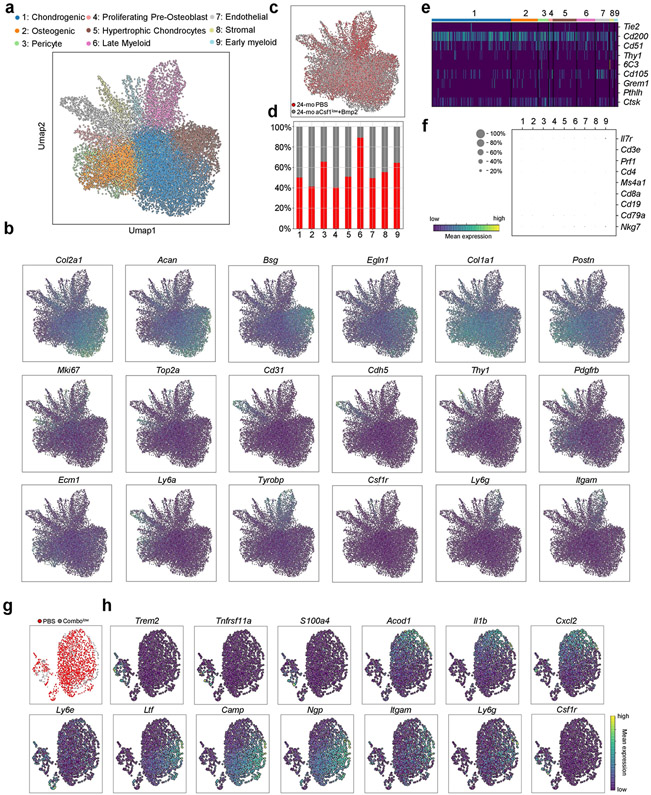
Extended Data Fig. 10 ∣. Compositional and transcriptomic changes in fracture calluses of aged mice after rescue treatment.
a, Leiden clustering of 10X scRNA-seq experiment of 17,230 fracture callus cells from 24-month-old mice treated with PBS and from 24-month-old mice treated with aCSF1low + BMP2 (Combolow). b, UMAP plot showing expression of selected marker genes for Leiden clusters. c, UMAP plot showing distribution of cells from each treatment group. Red, 24-mo PBS; grey, 24-mo Combolow. d, Percentual fraction of treatment group cells per Leiden cluster. e, Heat map showing positive and negative markers used to identify SSCs. f, Dot plot showing the absence of lymphoid gene expression in 10X datasets. g, UMAP plot with cells labelled by treatment group in 10X dataset subset for cells enriched for haematopoietic gene expression. h, Same UMAP plot showing expression of selected marker genes.

