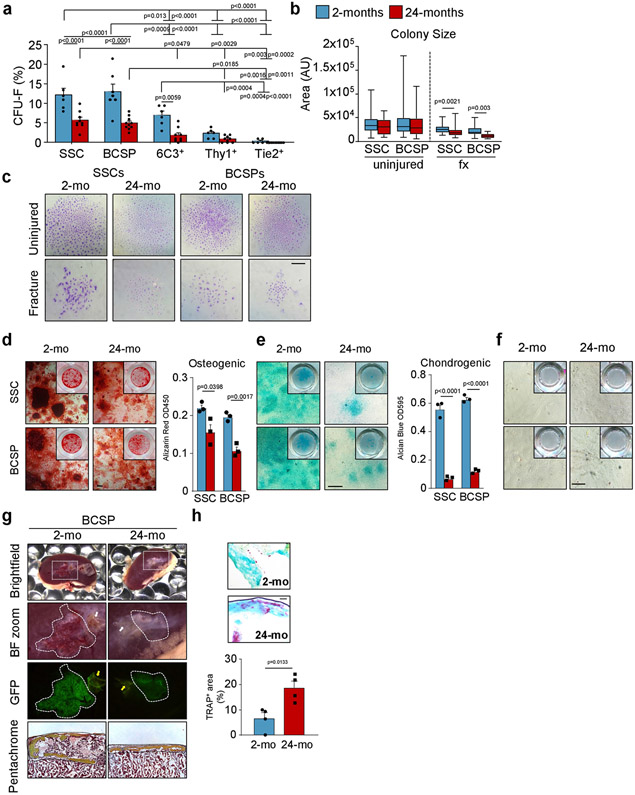
Extended Data Fig. 3 ∣. SSCs and BCSPs show reduced functionality in vitro and in vivo.
a, Fibroblast colony forming unit (CFU-F) ability of 2-month-old and 24-month-old SSC-derived cell populations of long bones (2-mo, n = 5-6; 24-mo, n = 9-10). Two-way ANOVA with Bonferroni’s post-hoc test. b, SSC- and BCSP-derived colony size of cells derived from uninjured and day-10-fractured bones (n = 7–120). Statistical testing between age groups by unpaired Student’s t-test or Mann–Whitney test for non-normality. c, Representative images of colonies stained by Crystal Violet (representative of CFU-F from three independent experiments). d, In vitro osteogenic capacity of SSCs and BCSPs from 2-month-old and 24-month-old mice as determined by Alizarin Red S staining. Representative staining (left) and quantification of osteogenesis (right) (n = 3 per age). e, In vitro chondrogenic capacity of SSCs and BCSPs from 2-month-old and 24-month-old mice as determined by Alican Blue staining. Representative staining (left) and quantification of chondrogenesis (right) (n = 3 per age). f, In vitro adipogenic capacity of SSCs and BCSPs from 2-month-old and 24-month-old mice as determined by Oil Red O staining. g, Renal capsule transplantation results of grafts excised 4 weeks after transplantation of GFP-labelled BCSPs derived from long bones of 2-month-old and 24-month-old mice. Representative gross images of kidneys and magnified graft as bright-field images and with GFP signal shown, for cells derived from 2-month-old (left) and 24-month-old (right) mice. Sectioned grafts stained by Movat’s pentachrome are displayed at the bottom. White and yellow arrows point at auto-fluorescent collagen sponge, which is not part of the graft (representative of 4 independent mice or experiments per age group). h, TRAP-staining images (top) and quantification (bottom) for osteoclast surfaces in sections derived from SSC-derived renal grafts (n = 4 per age group). Statistical testing by two-sided Student’s t-test adjusted for non-normality (Mann–Whitney test) or unequal variances (Welch’s test) where appropriate. Data are mean + s.e.m. For exact P values, see Source Data. Scale bars, 50 μm.

