

Introduction
In clinical practice, most PET imaging is performed at a single timepoint after tracer injection – i.e., “static” PET imaging. In practice, static [18F]-fluorodeoxyglucose (FDG) PET scans are most commonly quantified using a standardized uptake value (SUV), which is simple and robust when done under consistent acquisition protocols and can guide cancer diagnosis and characterization and to determine optimal treatments [1]. While static PET images quantified with SUVs are valuable for interpreting and diagnosing disease, dynamic information about the rate of uptake of FDG over time and the delivery of tracer can offer complementary insights for clinical decision making. For example, dynamic FDG data of breast cancer patients has been shown to improve the ability to measure cancer response to treatment compared to static imaging at 60 min post-injection, especially for low uptake tumors [2]. Dynamic PET imaging also plays a key role in developing new radiotracers to measure their dynamic biodistribution after injection. Dynamically imaging of such radiotracers is necessary to understand the biochemistry of new tracers, which in turn informs which kinetic parameters are likely to be of clinical significance. This information can then be used to design static imaging protocols that are more practical for routine clinical implementation.
Parameters of interest can be determined either via compartmental models or graphical methods. A few review articles that go into more detail can be found [3, 4], but a brief overview of relevant material is included here. Compartmental models represent the biochemistry of the radiotracer as a series of key transport or biochemical reaction steps, simplified into one or more tissue compartments fed by a measured tracer time activity curve. Kinetic parameters typically reflect the flux of tracer into and out of these compartments, often related to the enzymatic conversion of the tracers. For example, FDG is modeled using an irreversible two-tissue-compartment model, where tracer flows reversibly from the blood into the first tissue compartment (tissue FDG) and then is converted by hexokinase into FDG-6-phosphate (FDG-6P) and trapped in the second tissue compartment [5]. The flux (Ki) through hexokinase is a valuable kinetic parameter that provides information similar to SUV, but more specifically reflects use of the key enzyme, hexokinase, which is the rate limiting step for glycolysis. Kinetic parameters of interest for other tracers, especially those with reversible binding or transport, include delivery of tracer from the blood to the tissue (K1), the tissue volume of distribution of the tracer, or the binding potential of radiotracers designed to be ligands that bind to receptors. Compartmental models are very powerful to tease out information about the underlying processes in tracer uptake. The disadvantage of compartmental models, however, is that they estimate many parameters simultaneously and require non-linear optimization, which may limit precision and accuracy. Graphical methods transform dynamic data such that a linear fit can be performed and the slope of the fit equals a clinically relevant kinetic parameter. For example, the Patlak graphical analysis can be applied to tracers with irreversible trapping such as FDG, and the slope of the fit equals the flux of the tracer through the key enzymatic step [6]. The slope of the standard Logan graphical analysis method equals the volume of distribution for a reversibly transported or bound tracer [7]. This method also enables the use of a reference tissue instead of the blood clearance function, where the slope from the so-called Logan reference region graphical analysis equals one plus the binding potential [8].
Because dynamic imaging data are acquired continuously, standard AFOV scanners limit the axial extent, and thus the number of lesions or organs that can be imaged in a single session. Total-body PET scanners allow for simultaneous dynamic imaging of multiple organs or lesions in the body, opening the door for applications such as regular dynamic clinical FDG PET imaging, rigorous analysis of new radiotracers, probing new systems of biology, and developing complex new modeling methods that can leverage dynamic whole-body, 4D data (TB 4D PET). In this review, we explore some of the capabilities, applications and approaches relevant to TB 4D PET, including region-specific blood input functions, tracer kinetics late after injection, low-dose dynamic imaging, novel approaches to 4D image analysis and parametric image generation, and dual tracer injections.
Blood sampling from multiple locations
Standard kinetic modeling for PET relies on measuring the blood input function, the time-course of radiotracer available in the blood, to properly fit data to compartmental models and estimate important kinetic parameters. The gold standard for measuring the blood input function is arterial sampling, which is invasive and uncomfortable for patients. Instead, an image derived input function (IDIF) can be measured by placing a volume of interest (VOI) on a nearby arterial blood pool. An IDIF has the advantage of being non-invasive and inherently scaled similarly to the tissue or lesion TAC, since both are measured from the reconstructed images; however, because dynamic imaging on standard AFOV scanners is typically done in a single bed position, the IDIF is sometimes measured from small arteries, such as the carotid artery for neuro tracers or the iliac arteries for prostate tracers. These IDIFs suffer from partial volume effects which underestimate activity levels in smaller structures and can lead to mixing of data form adjacent structures – for example neighboring arteries and veins. These can lead to problematic artifacts, for example blunting the peak of the blood clearance (model input) function when the more time-dispersed venous peak blends with the arterial peak of the blood clearance function. On a total-body PET scanner, the IDIF can be measured from a number of different blood pools (Figure 1) and the most relevant large vessel IDIF can be used for kinetic modeling. Thus far dynamic FDG data of normal human subjects has been acquired on both the PennPET Explorer and the United Imaging (UI) uEXPLORER and time-activity curves (TACs) from various blood vessels and organs are shown in Figure 1.
Figure 1.
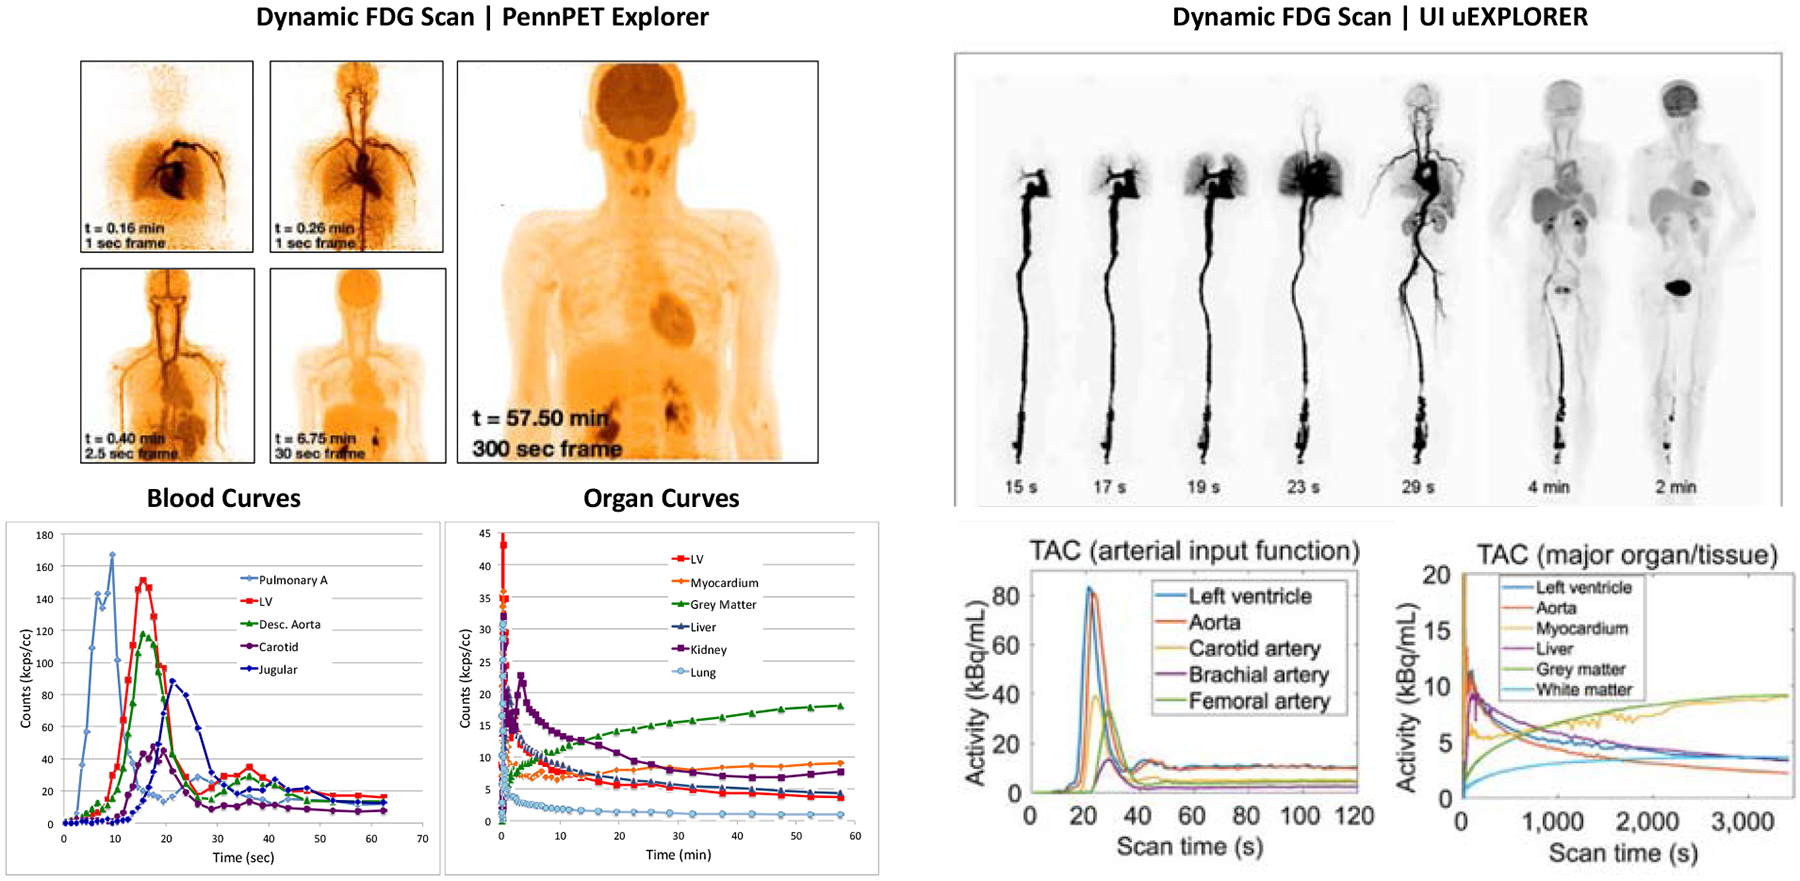
Dynamic studies from both the PennPET Explorer (left) and UI uExplorer (right) showing blood TACs from many sources and organ TACs from organs in the FOV
From R. D. Badawi, H. Shi, P. Hu, S. Chen, T. Xu, P. M. Price et al., “First human imaging studies with the EXPLORER total-body PET scanner,” J Nucl Med, vol. 60, no. 3, pp. 299–303, 2019 and A. R. Pantel, V. Viswanath, M. E. Daube-Witherspoon, J. G. Dubroff, G. Muehllehner, M. J. Parma et al., “PennPET Explorer: Human imaging on a whole-body imager,” J Nucl Med, vol. 61, no. 1, pp. 144–151, 2019 and X. Zhang, Z. Xie, E. Berg, M. S. Judenhofer, W. Liu, T. Xu et al., “Total-body dynamic reconstruction and parametric imaging on the uEXPLORER,” Journal of Nuclear Medicine, vol. 61, no. 2, pp. 285–291, 2020.
Another important factor is temporal sampling to capture the full dynamics of the blood clearance function, but sampling is often limited by low count statistics. Dynamic datasets on standard AFOV scanners typically sample early frames at 5–10 s, with the goal of sampling finely enough to capture the peak of the IDIF without limiting the number of counts per frame and therefore increasing the image noise. The high sensitivity of total-body PET has enabled faster temporal sampling of the early portion of the dynamic data. The earliest time frames of the raw TACs in Figure 1 are sampled at 1 s and show little to no noise in the curves, implying that finer sampling could be possible. Although a 2–3x sensitivity gain is expected from the larger solid angle of acceptance of coincident gammas due to increasing the axial length of the scanner, this sensitivity advantage extends over a large axial range as the axial field-of-view increases; therefore, 1 s temporal sampling is feasible for regular use on 4DTB datasets for radiotracer distributed over multiple organs. In fact, using a specialized algorithm [9] to minimize image noise, 100-ms frames were reconstructed and resultant TACs from the left ventricle, aorta, and myocardium, clearly showed the cardiac cycle (Figure 2).
Figure 2.
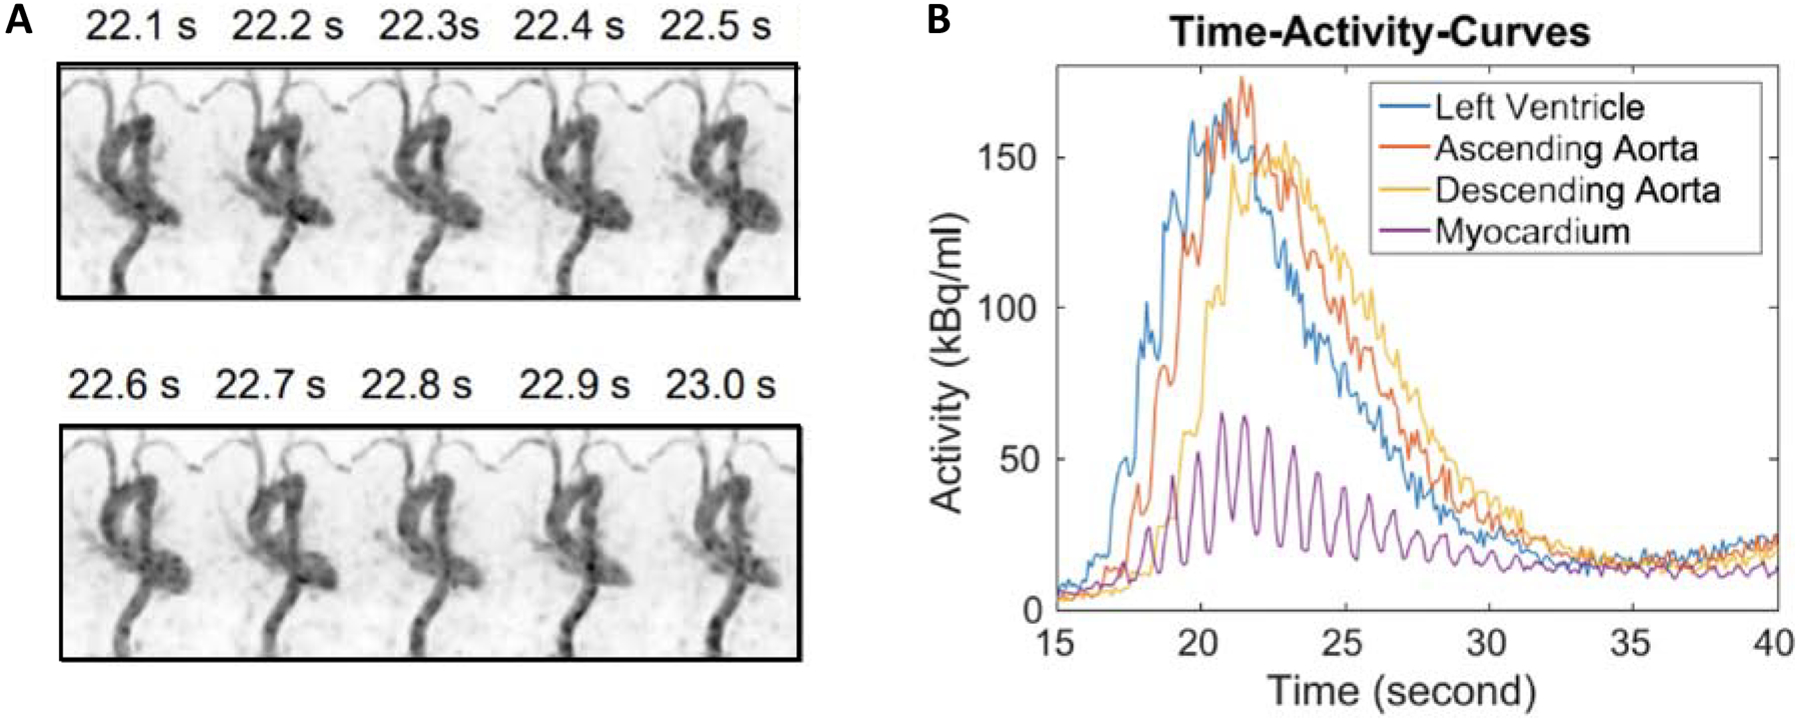
(A) Reconstruction dynamic PET images (maximum intensity projection) of 10 consecutive 100-ms frames from 22 s post-injection. (B) Dynamic TACs from 100-ms frames
From X. Zhang, S. R. Cherry, Z. Xie, H. Shi, R. D. Badawi, J. Qi, “Subsecond total-body imaging using ultrasensitive positron emission tomography,” Proceedings of the National Academy of Sciences, 2020; with permission.
Measuring kinetics over a prolonged time period after injection
In addition to leveraging the high sensitivity of total-body PET to reconstruct short (0.1–1 s) images, the sensitivity can also be used to image as late as 10 half-lives (< 0.1 % of the dose) and acquire quantitatively accurate images [11]. This may be particularly helpful to characterize tracers with slow washout kinetics, as is the case for FDG in organs with significant phosphatase activity. Phosphatase converts FDG-6P back to FDG and can impact the visualization of tumor sites and the interpretation of static uptake measures such as SUV [14]. For cancer imaging, where few tumors have phosphatase activity, delayed imaging times may be helpful to separate tumors from FDG-avid normal tissues such as the brain. Spence, et al., have previously shown the ability to visualize FDG in brain tumors and measure the TACs of FDG in the normal brain and brain tumors at 3–5 hours post-injection [15], demonstrating this concept. Whole-body PET can capture data much later. Data acquired out to 18–24 hours (9.8–13.1 half-lives) on the PennPET Explorer show similar behavior in the brain while also noting that myocardial uptake does not drastically decrease, even at the last time points (Figure 3) [16], highlighting differences in normal tissue phosphatase activity and FDG washout that are tough to measure on standard PET devices. These data can be fit by a reversible two-tissue compartment kinetic model quantify k4 in the brain, heart, and other organs for a more thorough understanding of the behavior of FDG. In addition, it is well known that the contrast of many tumors increases over time due to trapping in the lesions and washout of FDG in background tissues [17]. The high sensitivity of total-body PET will make imaging at a later time point clinically feasible without loss of image quality. In addition, factors such as late efflux of tracers from certain tissues can be studied and could be considered when making decisions on the approach to acquiring and interpreting the static images most commonly used in the clinic.
Figure 3.
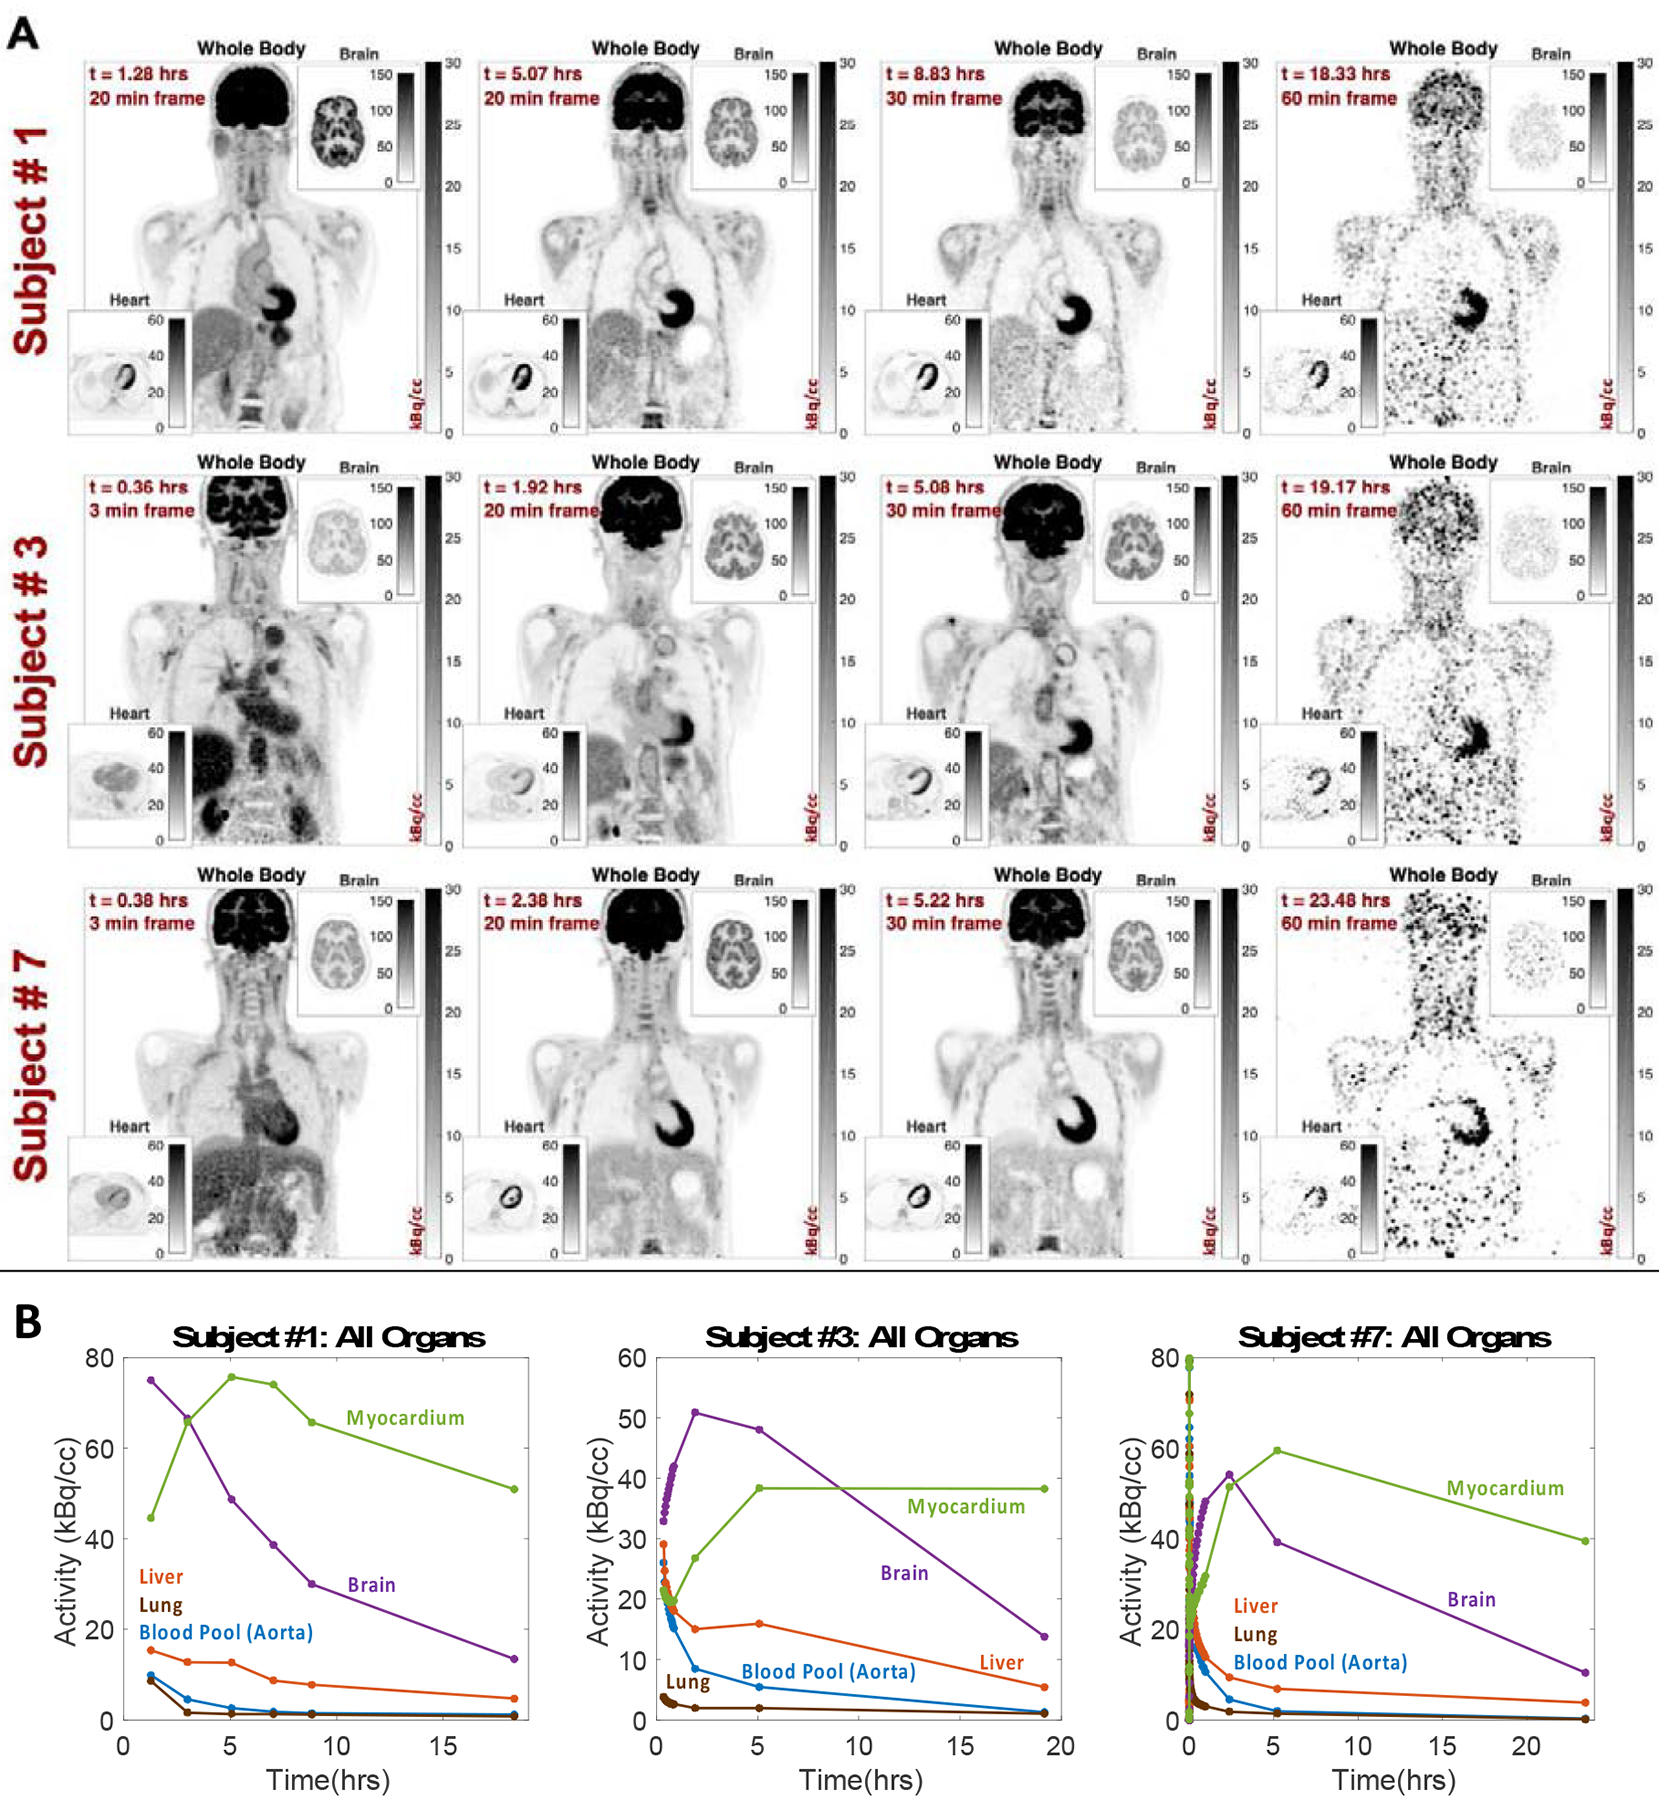
(A) Images and (B) TACs of FDG human subjects imaged out to 24 hours
V. Viswanath, “Studying the Clinical and Research Applications of the PennPET Explorer, a Long Axial Field-Of-View PET Scanner,” Bioengineering, University of Pennsylvania, 2020.
The ability to image at low activity levels and still recover quantitatively accurate information will be valuable for studies of tracers using isotopes with longer half-lives, many of which have mixed emission schemes, and where radiation considerations limit the injected activity dose. For example, antibodies labeled with 89Zr, a long-lived isotope with a 20% β+ fraction, are used for applications, such as cell tracking, that require imaging times on the order of days or even weeks [19, 20]. For theranostic applications, activity late after injection is important for radiation dosimetry studies, but due to limitations of current scanners, uptake after 2–3 half-lives is typically extrapolated and not measured [21]. Accurate delineation of the “tail” of radiotracer clearance could have a significant impact on estimates of dosimetry, especially important in applications of theranostic dosing. The increased sensitivity may also enable previously challenging clinical tasks. The estimation of radiation dose of 90Y spheres for liver-directed therapy is currently challenging to image due to the low β+ fraction of 90Y (0.0034 %) [22]. Total-body PET may be able to image and reconstruct quantitatively accurate images after 90Y radioembolization to ensure delivery of therapy to the tumor site.
Low-dose dynamic imaging
The increased sensitivity of total-body PET scanners can also be leveraged for low-dose dynamic imaging. This is especially valuable when testing new radiotracers which can have radiotracer production limitations or organ dose limits, and simultaneously limits the dose to the patient. Viswanath et al. conducted a study where dynamic lesions were embedded into a dynamic dataset of a normal human subject injected with 15 mCi of FDG and imaged from 0–60 min on the PennPET Explorer [23]. Dynamic lesion embedding is a method where separately acquired sphere data in the location of the desired lesion are combined frame-by-frame with normal human subject dynamic data to create a synthetic dynamic dataset with lesions which have the desired dynamic time course. Lesions were embedded with known kinetic parameters and data were subsampled to assess how low the injected dose could be decreased while still recovering the kinetic parameters. Results showed that estimation of the FDG flux constant (KFDG) when using the Patlak graphical analysis [6], could be accurate estimated at an emulated dose of 0.5 mCi for high flux spheres and 5 mCi for low flux spheres (Figure 4A). Compartmental analysis, which provides additional insight into tracer delivery and distribution, may also be facilitated by the improved count statistics of TB PET. Estimation of KFDG using a two-tissue-compartment model, assuming irreversible trapping (k4=0) showed a systematic positive bias, but KFDG could be estimated at emulated doses of 0.5–1 mCi with 10 % precision. The FDG blood-to-tissue delivery parameter, K1, as estimated from an irreversible two-tissue compartment model (k4=0), showed a systematic negative bias for low and medium flux spheres across all emulated activities. High flux spheres had little bias and less than 10% precision, even at an emulated dose of 0.5 mCi. This work shows imaging with 0.5–1 mCi on total-body PET scanners will allow for accurate quantitation of KFDG, or flux of other 18F labeled tracers; however, the large bias of K1 for low and medium flux spheres implies that the early time frames (1 s duration) introduced too much noise into the image, and thus the TAC, so a dual-binning reconstruction approach may be best for total-body PET. Short (1 s) time bins would be reconstructed early on to accurately capture the blood peaks, which as shown in Figure 1 had little noise, and longer (5 s) time bins would be reconstructed to measure the tissue or lesion TACs. Although this has not been tested, dynamic GATE simulations of FLT in a phantom on a model of the PennPET Explorer were used to do a similar analysis, but with 5 s frames early on, and results showed much less bias in K1 estimation that decreased for higher doses [24]. Further analysis can help define optimal approaches for demanding tasks of dynamic image analysis such as low-dose imaging and parametric image generation.
Figure 4.

Bias and precision of KFDG, as estimated using both Patlak (top) and a two-tissue-compartment (middle), and K1 (bottom) for both low and high flux spheres
From V. Viswanath, A. R. Pantel, M. E. Daube-Witherspoon, R. Doot, M. Muzi, D. A. Mankoff et al., “Quantifying bias and precision of kinetic parameter estimation on the PennPET Explorer, a long axial field-of-view scanner,” IEEE TRPMS, 2020
Parametric image reconstruction
The combination of increased sensitivity of total-body PET and the ability to dynamically image the whole body at once offers the opportunity to reconstruction parametric images of flux, delivery, volume of distribution, and other kinetic parameters of interest. There are a number of different approaches that have been tested, including voxel-based dynamic image analysis as well as approaches that inherently consider the 4D nature of the dataset [4]. For voxel-based applications for dynamic FDG data, parametric flux image generation has been most successful using the Patlak graphical analysis to calculate flux (Patlak slope) and distribution volume (Patlak intercept). This has been implemented on dynamic PET data by Zhang et al. using their kernel method to minimize noise in resultant parametric images [9, 12, 25]. Additionally, a novel approach to embedding the graphical analysis in the reconstruction process has shown good preliminary results from Li et al. using a nested Patlak fit within iterations of a DIRECT reconstruction [26, 27] (Figure 5). Such images may be especially useful for detection of small or low-uptake lesions, especially in the liver where high parenchymal uptake result in difficulty detecting lesions; however, images show that the liver has a low Ki, so liver lesions, which have been shown to have a Ki of 0.08 ± 0.04 [28, 29], should be much easier to detect on parametric flux images. The higher contrast of lesions on parametric KFDG images from the uEXPLORER has been shown by Wang et al. in chest, kidney, and thigh lesions [30]. They report a 3x increase in lesion contrast on flux images, estimated using a two-tissue-compartment model, compared to SUV images.
Figure 5.
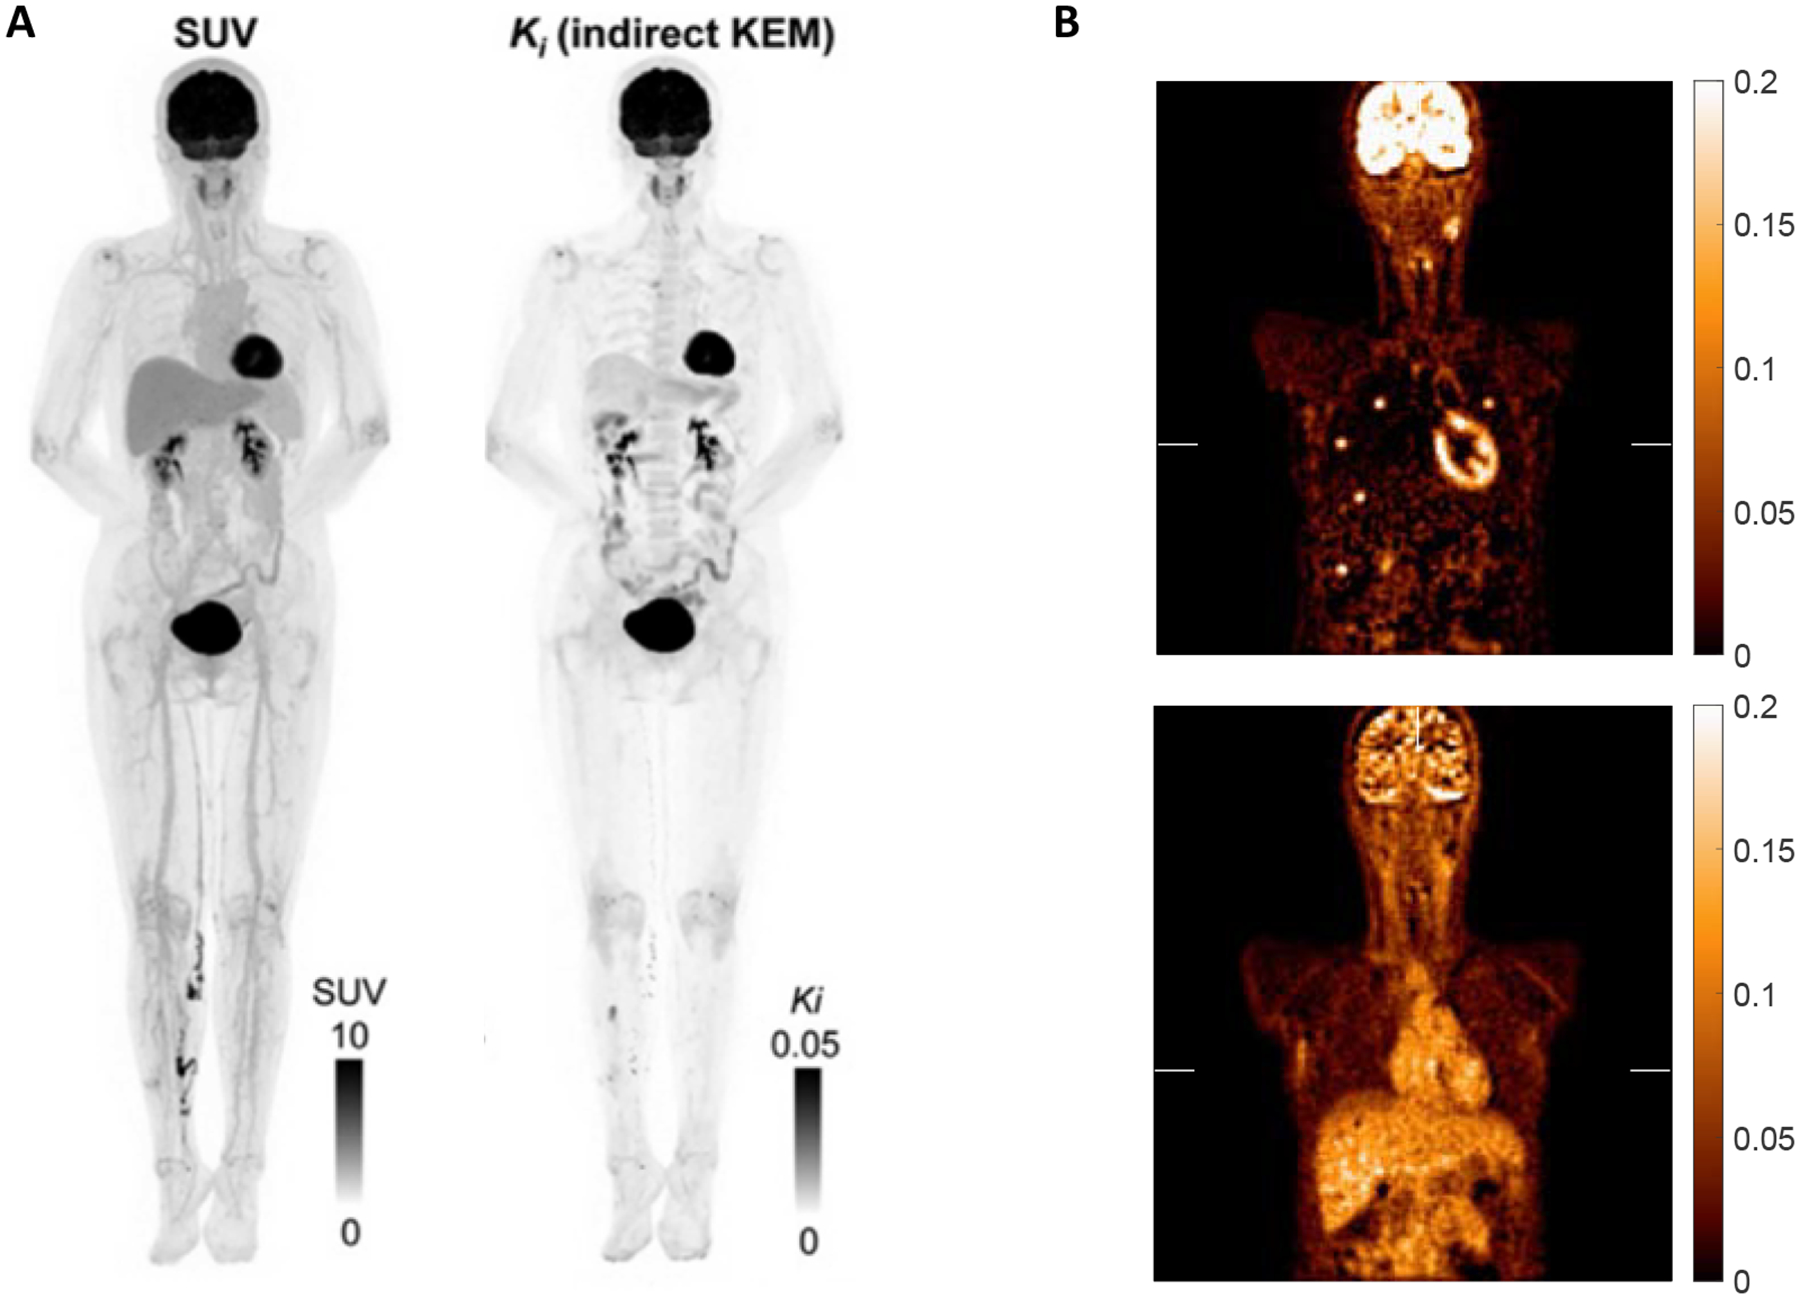
(A) Parametric flux image from the uEXPLORER using Patlak (Reprinted with permission from paper [12]). (B) Parametric image reconstruction using Patlak of dynamic FDG data from the PennPET Explorer with dynamically embedded lesions showing maps of flux from the Patlak slope (top) and distribution volume from the Patlak intercept (bottom). Images Courtesy of S. Matej and Y. Li, University of Pennsylvania.
As an alternative to voxel-based, 2D (uptake, time) analytic approaches, methods which use the full 4D data set may provide improvements in both efficiency and precision by using the extensive kinetic information and robust counting statistics available in 4D data sets. These methods may be useful for 4D data sets acquired on TB PET scanners. These approaches segment 4D images to generate at set of 1D dynamic (uptake, time) basis functions which can then be kinetically analyzed by compartmental analysis or other parameter estimation techniques. Parametric images are then generated by re-combining the kinetic estimates derived from the basis functions using the segmentation kernel. Well-tested approaches include mixture analysis [31], factor analysis [32], and other novel methods [33]. Prior studies have supported the ability to combine these methods with compartmental analysis [34]; however, alternative approaches may have advantages that include speed, efficiency, and more robust linear estimation approaches. In addition to graphical methods such as previously described Patlak analysis, alternative model-free approaches to describe and analyze dynamic data include spectral analysis [35, 36] and wavelet analysis [33]. Another approach uses the residue formulation developed for non-imaging studies [37] to estimate tracer delivery retention (flux or volume of distribution), and has the advantage – in addition to being efficient and robust – of generating linear parameter estimates, facilitating use with parametric imaging methods such as mixture analysis [38, 39]. This approach can be combined with methods to estimate the IDIF for a complete package that is broadly applicable to 4D PET, including WB PET [40].
4D lesion heterogeneity
In addition to using dynamic information to characterize a tumor, machine learning-based algorithms can be employed to leverage 4D information to quantify tumor heterogeneity. Dynamic imaging simulations of the PET proliferation tracer, [18F]flurotymidine (FLT) [41], by GATE simulations of a modified IQ phantom imaged on the 70-cm PennPET Explorer were used to design a 4D segmentation algorithm, that used both spatial and temporal components of voxel behavior to identify sub-regions with discrete 4-D behavior within lesions (Figure 6). An initial version of this approach was applied to dynamic FDG data of 50 breast cancer patients of whom 17 women had events of cancer recurrence. Identifying sub-regions within breast lesions allowed for the development of a novel imaging signature of 4D functional tumor heterogeneity (FTH) by quantifying the degree of separation between identified functionally discrete sub-regions. Compared to a baseline Cox regression model of known prognostic factors such as age, hormone receptor status, baseline tumor size, and kinetic PET markers including SUV, K1, and Ki, the addition of the FTH imaging signature demonstrated higher discriminatory capacity when predicting disease free survival [42]. In addition, dichotomizing patients into low- and high-risk groups based on the FTH imaging signature and baseline prognostic factors demonstrated significant separation (p<0.05) of Kaplan Meier survival curves [43].
Figure 6.

A 4D segmentation algorithm to identify sub-regions within solid tumors. (A) The primary lesion is segmented from a set of dynamic scans using time activity curves within a bounding region identified by radiologist. (B) Functional principal component analysis is used to reduce the dimensionality of the tumor time activity curves. (C) A Markov Random Field based segmentation approach is used to identify sub-regions within the tumor from which an FTH imaging signature is extracted.
Characterizing 4D functional tumor heterogeneity based on spatial and temporal information has the potential to be expanded beyond dynamic FDG imaging of disease, which will be much easier to implement on total-body PET scanners due to the decreased noise in individual image frames and resultant voxel TACs. As this work is independent of the compartmental model used in current dynamic PET analyses, it can be applied to analyze kinetics in studies using tracers in development as well as additional clinical radiotracers like DOTATATE or PSMA. In addition, such machine learning-based approaches can be applied to semi-dynamic datasets where data is acquired from 40 to 60 min post-injection, parsed into one-minute frames, and analyzed for heterogeneity.
Dual tracer imaging
Because the high sensitivity of total-body PET enables low-dose dynamic imaging, this advantage can then be parlayed into dual- or even multi-tracer dynamic imaging in a single imaging session, where tracers can be injected at successively higher doses to effectively swamp any residual radiation from prior injections. All data would be collected dynamically, but for abbreviated scan durations (e.g. 0–30 min instead of 0–60 min) to minimize the overall time the patient had to lie on the bed. Dual tracer imaging would allow for characterization of tumors using tracers that reveal complementary information about tumor markers and potential treatments. This is depicted in Figure 7 where, based on prior work, a low-dose (3 mCi) of [18F]fluoroglutamine (FGln), a tracer that measures the delivery and pool size of glutamine to tumors [44], could be injected followed by a higher dose (15 mCi) injection of FDG. This pairing of tracers is especially valuable when imaging triple negative breast cancer (TNBC) which may utilize glutamine as an energy source, in addition to glucose, resulting in a small FGln pool size, and thus low uptake on imaging. The efficacy of subsequent treatment with a glutaminase inhibitor can be seen on FGln imaging with an increase in pool size, and thus uptake, that would not be evident on FDG only imaging [44–46].
Figure 7.
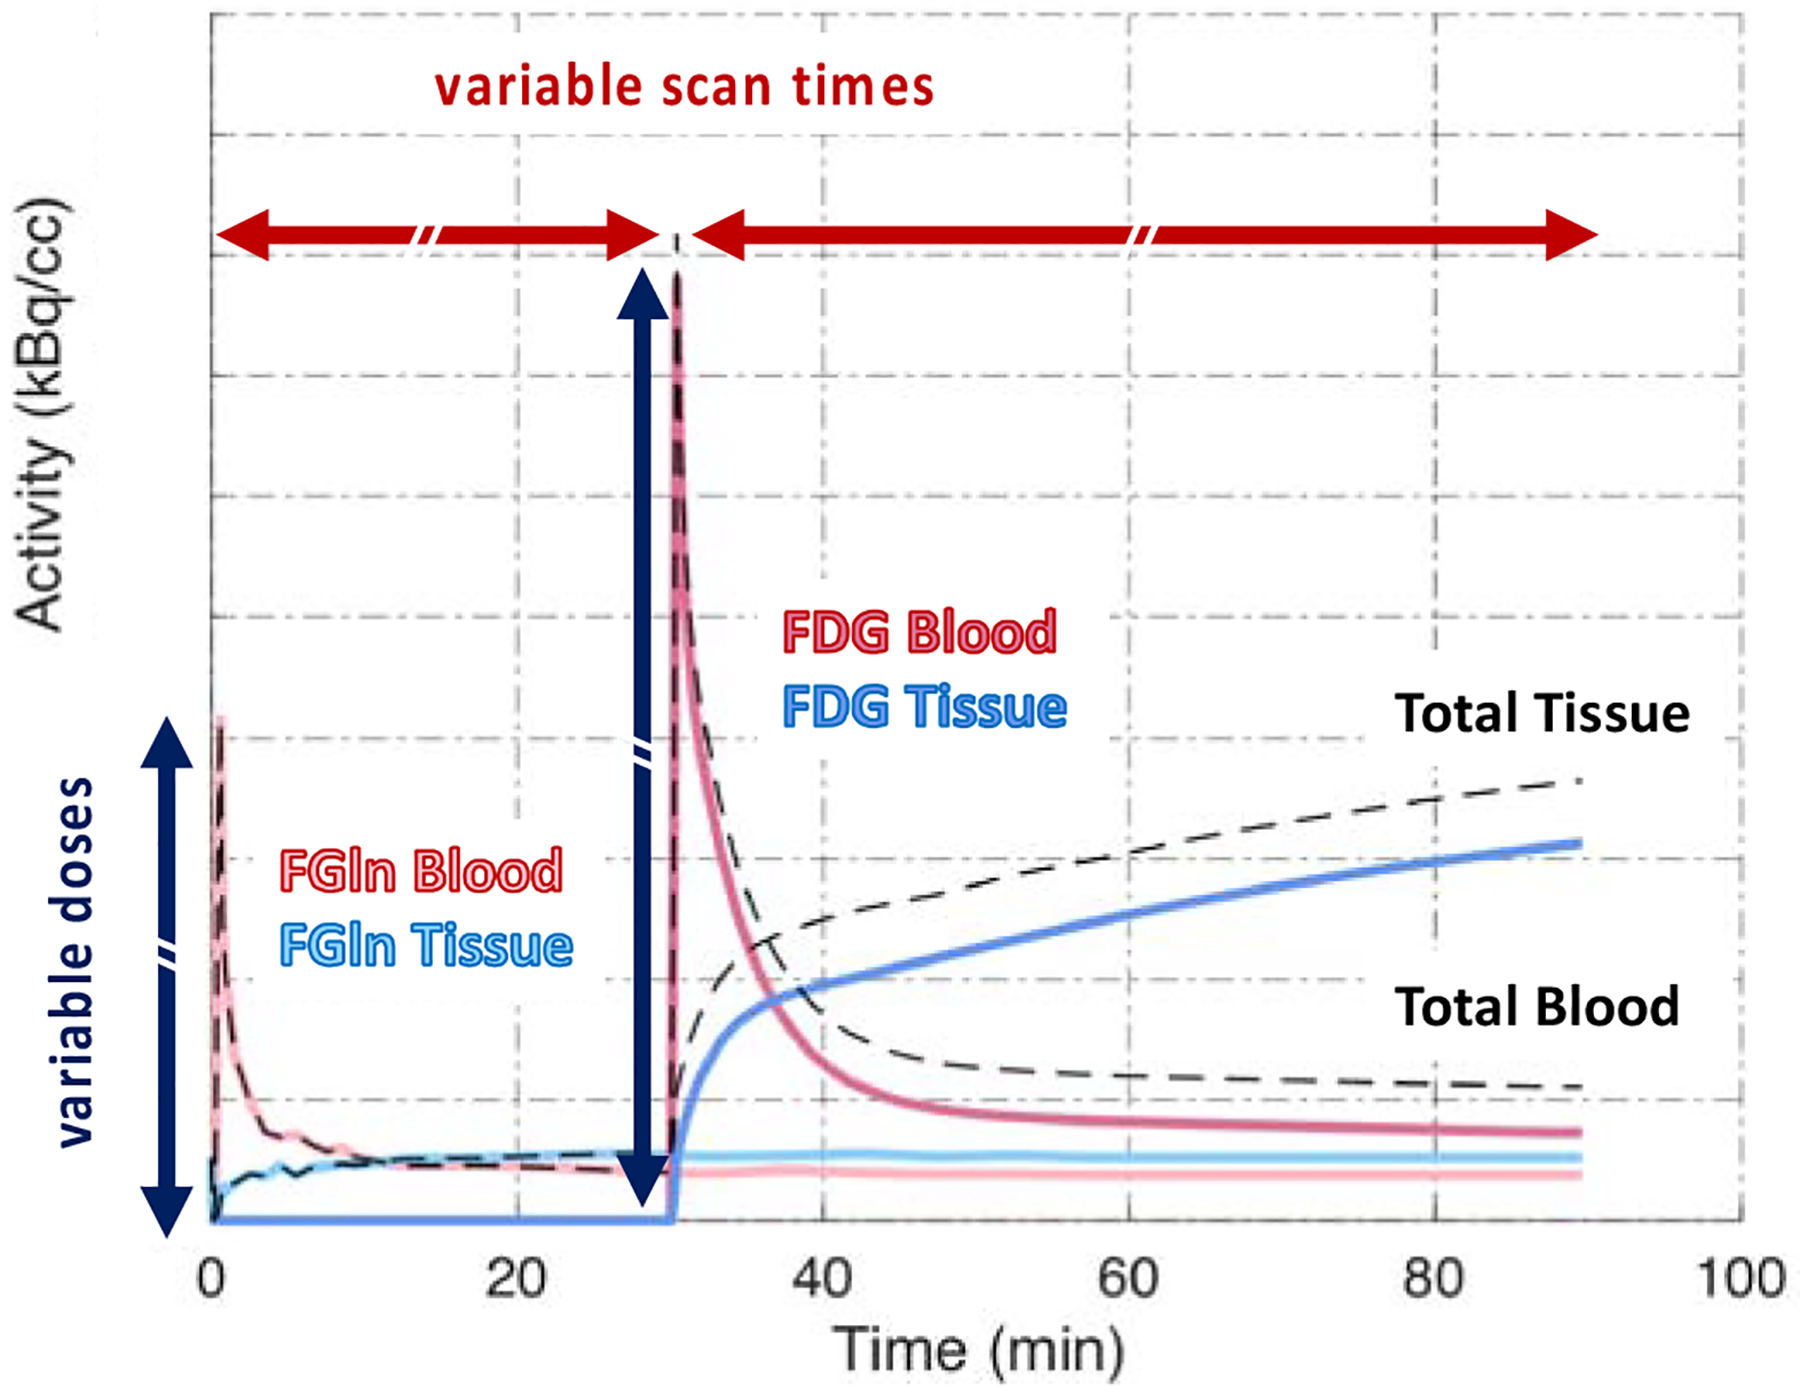
Example of a dual tracer study (Reprinted with permission from paper
From D. A. Mankoff, A. R. Pantel, V. Viswanath, J. S. Karp, “Advances in PET Diagnostics for Guiding Targeted Cancer Therapy and Studying In Vivo Cancer Biology,” Current Pathobiology Reports, vol. 7, no. 3, pp. 97–108, 2019; with permission.
Conclusions
Both the high sensitivity and extended axial length of total-body PET imaging enables total-body 4D PET data acquisition. The high sensitivity can be leveraged for low dose imaging, abbreviated dynamic acquisitions, finely sampled dynamic data, collecting kinetic data from 10+ half-lives, and dual tracer imaging, while total-body coverage enables the measurement of IDIFs from various locations and the reconstruction of total-body parametric images. Total-body PET will be a key resource for implementing dynamic or semi-dynamic acquisitions in routine clinical practice and enable rigorous testing of new radiotracers to expand the clinical utility of PET.
Synopsis:
The high sensitivity and total-body coverage of total-body PET scanners will be valuable for a number of clinical and research applications outlined in this chapter.
Acknowledgements:
We would like to thank the following funding sources: NIH R01-CA206187, R33-CA225310, R01-CA113941, and KL2TR001879
Footnotes
Publisher's Disclaimer: This is a PDF file of an unedited manuscript that has been accepted for publication. As a service to our customers we are providing this early version of the manuscript. The manuscript will undergo copyediting, typesetting, and review of the resulting proof before it is published in its final form. Please note that during the production process errors may be discovered which could affect the content, and all legal disclaimers that apply to the journal pertain.
The authors have nothing to disclose
Contributor Information
Varsha Viswanath, Department of Radiology, University of Pennsylvania, John Morgan Building, 3620 Hamilton Walk, Rm 150 Philadelphia, PA 19103.
Rhea Chitalia, Department of Radiology, University of Pennsylvania, Richards Building, 3700 Hamilton Walk, Rm D700, Philadelphia, PA 19103.
Austin R. Pantel, Department of Radiology, University of Pennsylvania, 1 Donner Building, Hospital of the University of Pennsylvania, 3400 Spruce Street, Philadelphia, PA 19104-4283.
Joel S. Karp, Department of Radiology, University of Pennsylvania, John Morgan Building, 3620 Hamilton Walk, Rm 150 Philadelphia, PA 19103.
David A. Mankoff, Gerd Muehllehner Professor of Radiology, Vice-Chair for Research, Department of Radiology, Associate Director of Education and Training, Abramson Cancer Center, Department of Radiology, University of Pennsylvania, 1 Donner Building, Hospital of the University of Pennsylvania, 3400 Spruce Street, Philadelphia, PA 19104-4283
References
- [1].Farwell MD, Pryma DA, Mankoff DA, “PET/CT imaging in cancer: current applications and future directions,” Cancer, vol. 120, no. 22, pp. 3433–3445, 2014. [DOI] [PubMed] [Google Scholar]
- [2].Doot RK, “Getting the most out of 18F-FDG PET scans: The predictive value of 18F-FDG PET–derived blood flow estimates for breast cancer,” J Nucl Med, vol. 57, no. 11, pp. 1667–1668, 2016. [DOI] [PMC free article] [PubMed] [Google Scholar]
- [3].Dimitrakopoulou-Strauss A, Pan L, Sachpekidis C, “Kinetic modeling and parametric imaging with dynamic PET for oncological applications: General considerations, current clinical applications, and future perspectives,” Eur. J. Nucl. Med. Mol. Imaging, 2020. [DOI] [PMC free article] [PubMed] [Google Scholar]
- [4].Muzi M, O’Sullivan F, Mankoff DA, Doot RK, Pierce LA, Kurland BF et al. , “Quantitative assessment of dynamic PET imaging data in cancer imaging,” Magnetic resonance imaging, vol. 30, no. 9, pp. 1203–1215, 2012. [DOI] [PMC free article] [PubMed] [Google Scholar]
- [5].Phelps M, Huang S, Hoffman E, Selin C, Sokoloff L, Kuhl D, “Tomographic measurement of local cerebral glucose metabolic rate in humans with (F-18) 2-fluoro-2-deoxy-Dglucose: validation of method,” Annals of Neurology: Official Journal of the American Neurological Association and the Child Neurology Society, vol. 6, no. 5, pp. 371–388, 1979. [DOI] [PubMed] [Google Scholar]
- [6].Patlak CS, Blasberg RG, “Graphical evaluation of blood-to-brain transfer constants from multiple-time uptake data. Generalizations,” J Cereb Blood Flow Metab, vol. 5, no. 4, pp. 584–590, 1985. [DOI] [PubMed] [Google Scholar]
- [7].Logan J, Fowler JS, Volkow ND, Wolf AP, Dewey SL, Schlyer DJ et al. , “Graphical analysis of reversible radioligand binding from time—activity measurements applied to [N-11C-methyl]-(−)-cocaine PET studies in human subjects,” Journal of Cerebral Blood Flow & Metabolism, vol. 10, no. 5, pp. 740–747, 1990. [DOI] [PubMed] [Google Scholar]
- [8].Logan J, Fowler JS, Volkow ND, Wang G-J, Ding Y-S, Alexoff DL, “Distribution volume ratios without blood sampling from graphical analysis of PET data,” Journal of Cerebral Blood Flow & Metabolism, vol. 16, no. 5, pp. 834–840, 1996. [DOI] [PubMed] [Google Scholar]
- [9].Zhang X, Zhou J, Cherry SR, Badawi RD, Qi J, “Quantitative image reconstruction for total-body PET imaging using the 2-meter long EXPLORER scanner,” Physics in Medicine & Biology, vol. 62, no. 6, p. 2465, 2017. [DOI] [PMC free article] [PubMed] [Google Scholar]
- [10].Badawi RD, Shi H, Hu P, Chen S, Xu T, Price PM et al. , “First human imaging studies with the EXPLORER total-body PET scanner,” J Nucl Med, vol. 60, no. 3, pp. 299–303, 2019. [DOI] [PMC free article] [PubMed] [Google Scholar]
- [11].Pantel AR, Viswanath V, Daube-Witherspoon ME, Dubroff JG, Muehllehner G, Parma MJ et al. , “PennPET Explorer: Human imaging on a whole-body imager,” J Nucl Med, vol. 61, no. 1, pp. 144–151, 2019. [DOI] [PMC free article] [PubMed] [Google Scholar]
- [12].Zhang X, Xie Z, Berg E, Judenhofer MS, Liu W, Xu T et al. , “Total-body dynamic reconstruction and parametric imaging on the uEXPLORER,” Journal of Nuclear Medicine, vol. 61, no. 2, pp. 285–291, 2020. [DOI] [PMC free article] [PubMed] [Google Scholar]
- [13].Zhang X, Cherry SR, Xie Z, Shi H, Badawi RD, Qi J, “Subsecond total-body imaging using ultrasensitive positron emission tomography,” Proceedings of the National Academy of Sciences, 2020. [DOI] [PMC free article] [PubMed] [Google Scholar]
- [14].Mankoff DA, Muzi M, Krohn KA, “Quantitative positron emission tomography imaging to measure tumor response to therapy: what is the best method?,” Molecular Imaging and Biology, vol. 5, no. 5, pp. 281–285, 2003. [DOI] [PubMed] [Google Scholar]
- [15].Spence AM, Muzi M, Mankoff DA, O’Sullivan SF, Link JM, Lewellen TK et al. , “18F-FDG PET of gliomas at delayed intervals: improved distinction between tumor and normal gray matter,” J Nucl Med, vol. 45, no. 10, pp. 1653–1659, 2004. [PubMed] [Google Scholar]
- [16].Viswanath V, Pantel AR, Daube-Witherspoon ME, Mankoff DA, Karp JS, “Quantifying the k4 of Fluorodeoxyglucose in Normal Organs Using the PennPET Explorer, a Long Axial Field of View PET Scanner,” in Biomedical Engineering Society Conference, Philadelphia, PA, 2019. [Google Scholar]
- [17].Dirisamer A, Halpern BS, Schima W, Heinisch M, Wolf F, Beheshti M et al. , “Dual-time-point FDG-PET/CT for the detection of hepatic metastases,” Molecular imaging and biology, vol. 10, no. 6, pp. 335–340, 2008. [DOI] [PubMed] [Google Scholar]
- [18].Viswanath V, “Studying the Clinical and Research Applications of the PennPET Explorer, a Long Axial Field-Of-View PET Scanner,” Bioengineering, University of Pennsylvania, 2020. [Google Scholar]
- [19].Sellmyer MA, Richman SA, Lohith K, Hou C, Weng C-C, Mach RH et al. , “Imaging CAR T cell trafficking with eDHFR as a PET reporter gene,” Molecular Therapy, vol. 28, no. 1, pp. 42–51, 2020. [DOI] [PMC free article] [PubMed] [Google Scholar]
- [20].Pandit-Taskar N, Postow MA, Hellmann MD, Harding JJ, Barker CA, O’Donoghue JA et al. , “First-in-Humans Imaging with 89Zr-Df-IAB22M2C Anti-CD8 Minibody in Patients with Solid Malignancies: Preliminary Pharmacokinetics, Biodistribution, and Lesion Targeting,” Journal of Nuclear Medicine, vol. 61, no. 4, pp. 512–519, 2020. [DOI] [PMC free article] [PubMed] [Google Scholar]
- [21].Li T, Ao EC, Lambert B, Brans B, Vandenberghe S, Mok GS, “Quantitative imaging for targeted radionuclide therapy dosimetry-technical review,” Theranostics, vol. 7, no. 18, p. 4551, 2017. [DOI] [PMC free article] [PubMed] [Google Scholar]
- [22].Taebi A, Roudsari B, Vu C, Cherry S, Roncali E, “Hepatic arterial tree segmentation: Towards patient-specific dosimetry for liver cancer radioembolization,” J Nucl Med, vol. 60, no. supplement 1, pp. 122–122, 2019.29976695 [Google Scholar]
- [23].Viswanath V, Pantel AR, Daube-Witherspoon ME, Doot R, Muzi M, Mankoff DA et al. , “Quantifying bias and precision of kinetic parameter estimation on the PennPET Explorer, a long axial field-of-view scanner,” IEEE TRPMS, 2020. (Accepted). [DOI] [PMC free article] [PubMed] [Google Scholar]
- [24].Viswanath V, Pantel AR, Daube-Witherspoon ME, Mankoff DA, Karp JS, “Dynamic imaging on the 70-cm PennPET Explorer using GATE simulations.,” in 2018 Total Body PET Conference, Ghent, Belgium, 2018, vol. 5(Suppl 1), no. 19 (Abstract A21): EJNMMI Physics. [Google Scholar]
- [25].Zhang X, Xie Z, Berg E, Judenhofer M, Liu W, Lv Y et al. , “Total-Body Parametric Imaging using Kernel and Direct Reconstruction on the uEXPLORER,” J Nucl Med, vol. 60, no. supplement 1, pp. 456–456, 2019. [Google Scholar]
- [26].Matej S, Surti S, Jayanthi S, Daube-Witherspoon ME, Lewitt RM, Karp JS, “Efficient 3-D TOF PET reconstruction using view-grouped histo-images: DIRECT—Direct image reconstruction for TOF,” IEEE Trans Med Img, vol. 28, no. 5, pp. 739–751, 2009. [DOI] [PMC free article] [PubMed] [Google Scholar]
- [27].Li Y, Viswanath V, Daube-Witherspoon ME, Karp JS, Matej S, “Nested Parametric Image Reconstruction using Time-of-Flight PET Histoimages,” in IEEE NSS/MIC, Boston, MA, 2020. [Google Scholar]
- [28].Graham M, Peterson L, Hayward R, “Comparison of simplified quantitative analyses of FDG uptake,” Nucl Med and Biol, vol. 27, no. 7, pp. 647–655, 2000. [DOI] [PubMed] [Google Scholar]
- [29].Dimitrakopoulou-Strauss A, Strauss LG, Burger C, Rühl A, Irngartinger G, Stremmel W et al. , “Prognostic aspects of 18F-FDG PET kinetics in patients with metastatic colorectal carcinoma receiving FOLFOX chemotherapy,” J Nucl Med, vol. 45, no. 9, pp. 1480–1487, 2004. [PubMed] [Google Scholar]
- [30].Wang G, Parikh M, Nardo L, Zuo Y, Abdelhafez Y, Qi J et al. , “Total-Body Dynamic PET of Metastatic Cancer: First Patient Results,” Journal of Nuclear Medicine, vol. 61, no. supplement 1, pp. 208–208, 2020. [Google Scholar]
- [31].O’Sullivan F, “Imaging radiotracer model parameters in PET: a mixture analysis approach,” IEEE transactions on medical imaging, vol. 12, no. 3, pp. 399–412, 1993. [DOI] [PubMed] [Google Scholar]
- [32].Wu H-M, Hoh CK, Buxton DB, Kuhle WG, Schelbert HR, Choi Y et al. , “Quantification of Myocardial Blood Flow Using Dynamic Nitrogen-13-. Ammonia PET Studies,” J Nucl Med, vol. 36, pp. 2087–2093, 1995. [PubMed] [Google Scholar]
- [33].Alpert NM, Reilhac A, Chio TC, Selesnick I, “Optimization of dynamic measurement of receptor kinetics by wavelet denoising,” Neuroimage, vol. 30, no. 2, pp. 444–451, 2006. [DOI] [PubMed] [Google Scholar]
- [34].Eary JF, Mankoff DA, Spence AM, Berger MS, Olshen A, Link JM et al. , “2-[C-11] thymidine imaging of malignant brain tumors,” Cancer research, vol. 59, no. 3, pp. 615–621, 1999. [PubMed] [Google Scholar]
- [35].Cunningham VJ, Jones T, “Spectral analysis of dynamic PET studies,” Journal of Cerebral Blood Flow & Metabolism, vol. 13, no. 1, pp. 15–23, 1993. [DOI] [PubMed] [Google Scholar]
- [36].Veronese M, Rizzo G, Bertoldo A, Turkheimer FE, “Spectral analysis of dynamic PET studies: a review of 20 years of method developments and applications,” Computational and mathematical methods in medicine, vol. 2016, 2016. [DOI] [PMC free article] [PubMed] [Google Scholar]
- [37].Meier P, Zierler KL, “On the theory of the indicator-dilution method for measurement of blood flow and volume,” Journal of applied physiology, vol. 6, no. 12, pp. 731–744, 1954. [DOI] [PubMed] [Google Scholar]
- [38].O’sullivan F, Muzi M, Spence AM, Mankoff DM, O’sullivan JN, Fitzgerald N et al. , “Nonparametric residue analysis of dynamic PET data with application to cerebral FDG studies in normals,” Journal of the American Statistical Association, vol. 104, no. 486, pp. 556–571, 2009. [DOI] [PMC free article] [PubMed] [Google Scholar]
- [39].O’Sullivan F, Muzi M, Mankoff DA, Eary JF, Spence AM, Krohn KA, “Voxel-level mapping of tracer kinetics in PET studies: a statistical approach emphasizing tissue life tables,” The annals of applied statistics, vol. 8, no. 2, p. 1065, 2014. [DOI] [PMC free article] [PubMed] [Google Scholar]
- [40].Huang J, O’Sullivan F, “An analysis of whole body tracer kinetics in dynamic PET studies with application to image-based blood input function extraction,” IEEE transactions on medical imaging, vol. 33, no. 5, pp. 1093–1108, 2014. [DOI] [PMC free article] [PubMed] [Google Scholar]
- [41].Bading JR, Shields AF, “Imaging of cell proliferation: status and prospects,” Journal of Nuclear Medicine, vol. 49, no. 2, p. 64S, 2008. [DOI] [PubMed] [Google Scholar]
- [42].Chitalia R, Viswanath V, Pantel AR, Peterson L, Cohen E, Muzi M et al. , “4D radiomic biomarker of functional tumor heterogeneity to predict breast cancer recurrence in pretreatment dynamic FDG-PET,” ed: American Society of Clinical Oncology, 2020. [Google Scholar]
- [43].Chitalia R, Viswanath V, Pantel AR, Peterson L, Cohen E, Muzi M et al. , “Functional 4-D clustering for characterizing intra tumor heterogeneity: evaluation in dynamic FDG-PET as a prognostic biomarker for breast cancer,” 2020. (in preparation).
- [44].Zhou R, Pantel AR, Li S, Lieberman BP, Ploessl K, Choi H et al. , “[18F](2S, 4R) 4-fluoroglutamine PET detects glutamine pool size changes in triple-negative breast cancer in response to glutaminase inhibition,” Cancer research, vol. 77, no. 6, pp. 1476–1484, 2017. [DOI] [PMC free article] [PubMed] [Google Scholar]
- [45].Viswanath V, Zhou R, Lee H, Li S, Cragin A, Doot RK et al. , “Kinetic modeling of [18F] (2S,4R)4-fluoroglutamine in mouse models of breast cancer to estimate glutamine pool size as an indicator of tumor glutamine metabolism,” J Nucl Med, 2020. (in preparation). [DOI] [PMC free article] [PubMed] [Google Scholar]
- [46].Mankoff DA, Pantel AR, Viswanath V, Karp JS, “Advances in PET Diagnostics for Guiding Targeted Cancer Therapy and Studying In Vivo Cancer Biology,” Current Pathobiology Reports, vol. 7, no. 3, pp. 97–108, 2019. [DOI] [PMC free article] [PubMed] [Google Scholar]