ABSTRACT
Objective:
To investigate the relationship between craniofacial measurements obtained from cephalometric radiographs and analogous measurements from profile photographs.
Materials and Methods:
Lateral cephalograms and standardized facial profile photographs were obtained from a sample of 123 subjects (65 girls, 58 boys; age 7–12 years). Intraclass correlation coefficients (ICCs) were calculated from repeated photographic measurements to evaluate method reliability. Analogous cephalometric and photographic measurements were compared to assess Pearson correlation coefficients. Linear regression analyses were conducted between the measurements that achieved correlation coefficients greater than r = 0.7.
Results:
The reliability of the photographic technique was satisfactory. Most measurements showed ICCs above 0.80 and highly significant correlations (P ≤ .001) with cephalometric variables. Among all measurements used, the A'N'B' angle was the most effective in explaining the variability of its analogous cephalometric, mainly for female subjects (r2 = 0.80). The FMA' angle showed the best results for vertical assessment (r2 = 0.65).
Conclusions:
The photographic method has proven to be a repeatable and reproducible tool provided that a standardized protocol is followed. Therefore, it may be considered a feasible and practical diagnostic alternative, particularly if there is a need for a low-cost and noninvasive method.
Keywords: Photography, Cephalometry, Diagnosis
INTRODUCTION
Photographs have long been used as an adjunct in anthropometric research and orthodontics clinical practice. However, with the advent of the cephalostat and standardization of the radiographic technique, facial photography became a secondary record for several years. The emphasis was on the objective assessment of cephalometric radiographs, leaving only a subjective role for lateral photographs.1–3
Several cephalometric analyses were developed, which gave orthodontics a basis to expand the concept of normal and abnormal skeletal pattern. Conversely, radioprotection concerns brought to light the possibility of performing quantitative analysis through photographs, which may increase its clinical effectiveness. Actually, such quantitative analysis may serve as a powerful method to address craniofacial disorders, establish treatment planning, evaluate surgical results and orthodontic outcomes, and study facial growth. Thus, it may be as effective in orthodontics as in several other medical fields.1,4–6
Consistent relationships between facial overlying tissues and skeletal structures have been found through lateral radiographs analysis.7–9 However, comparisons involving cephalometric and photographic measurements have seldom been performed, and conflicting results have been found.10,11
As cephalometric analysis constitutes the gold standard for diagnosing craniofacial morphology in clinical practice, the possibility of predicting cephalometric values through photographs may be relevant as a noninvasive diagnostic tool, especially for epidemiologic research. This study focused on the investigation of the relationship between craniofacial measurements obtained from cephalometric radiographs and analogous measurements from standardized facial profile photographs by means of regression prediction models.
MATERIALS AND METHODS
Study Population
Lateral cephalograms and standardized profile photographs were obtained from 123 subjects, 65 girls and 58 boys, age 7 to 12 years (mean age 8.9 years, SD 1.4). The inclusion criteria were (1) no previous orthodontic or surgical treatment, (2) all six maxillary anterior teeth present, (3) no craniofacial trauma, (4) no congenital anomalies, and (5) no neurologic disturbances. The sample comprised children admitted for the treatment of various malocclusions at Araraquara Dental School, Univ Estadual Paulista (UNESP), and private academic institutions. Thus, lateral radiographs were already required as part of the initial orthodontic records. Parents or legal guardians had been previously informed about the procedures and gave their written agreement to the investigation. The study was approved under the protocol 66/10, by the local committee of ethics.
Photographic Procedure
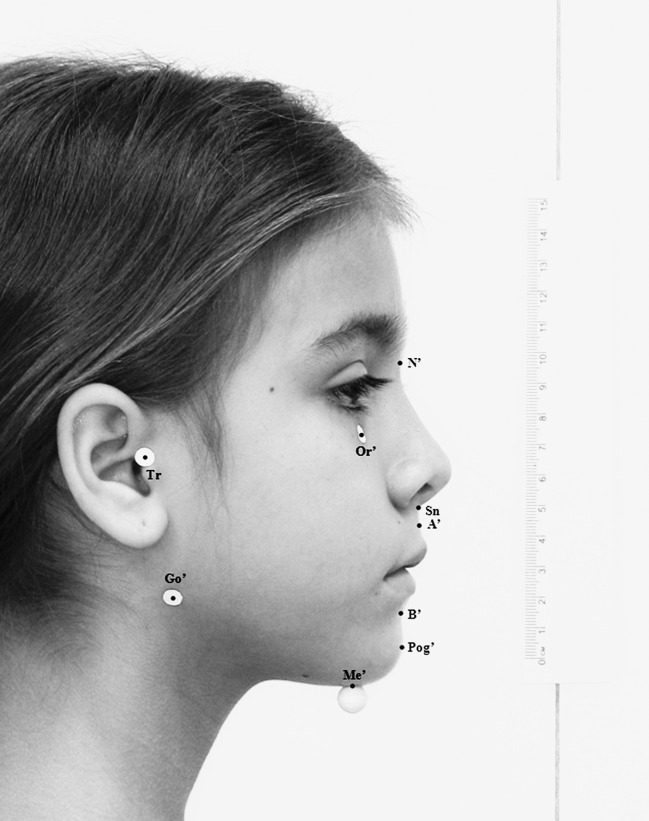
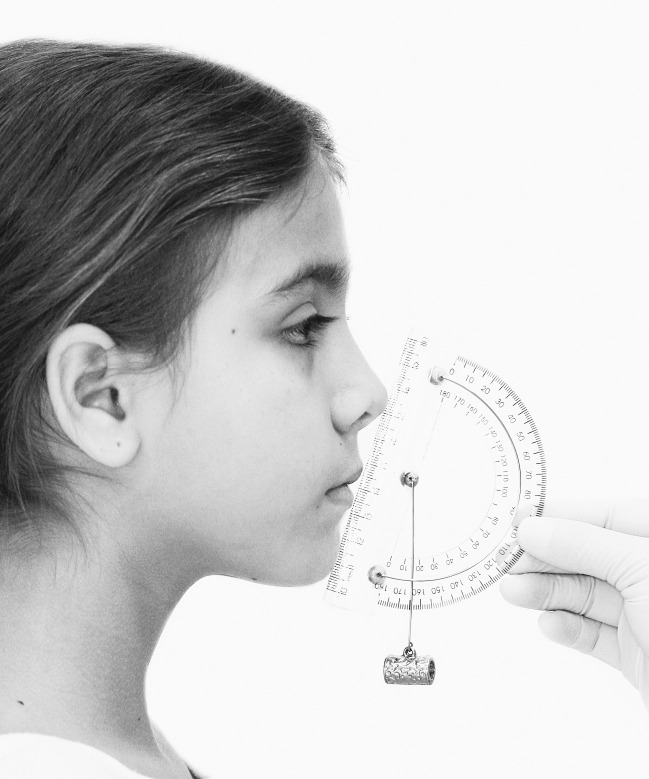
Standardized right profile photographs were taken in the natural head position (NHP), with maximum intercuspation and lips at rest. Glasses were removed and hair piled high on the head to ensure that the patient's forehead, neck, and ears were clearly visible. Adhesive dots were placed on anatomic landmarks obtained by palpation (Figure 1). The Me' point was identified with an adhesive styrofoam bead to allow better visibility by the camera. To obtain an NHP, a 75 × 30 cm mirror was hung on a tripod, which allowed vertical adjustments according to the subject's height. Patients were asked to keep feet slightly apart and arms relaxed and to stand a step behind a line drawn 120 cm from the mirror. To achieve the “orthoposition,” patients were instructed to tilt their head up and down with decreasing amplitude until they felt relaxed, take a step forward, and keep looking straight ahead into the reflection of their eyes in the mirror.12,13 A protractor was placed on the tip of the nose and the soft tissue pogonion, and a plumb line recorded the NHP angle (Figure 2).14
Figure 1.
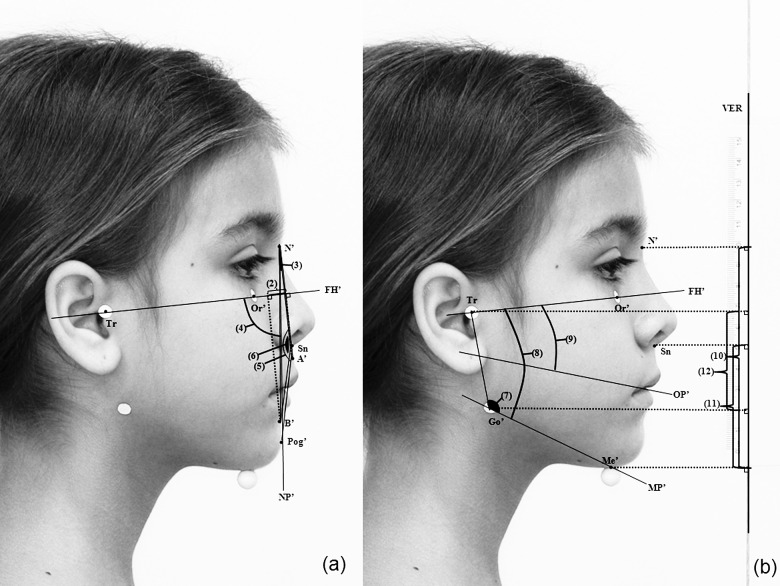
' = Photographic landmarks. N' indicates soft tissue nasion; Tr, tragion; Or', soft tissue orbitale; A', soft tissue subspinale; B', soft tissue supramentale; Go', soft tissue gonion; Pog', soft tissue pogonion; Me', soft tissue menton; Sn, subnasale. Adhesive dots were placed on Tr, Or', and Go'. The Me' point was marked with an adhesive styrofoam bead to allow better visibility by the camera.
Figure 2.
Modified protractor on the tip of the nose and the soft tissue pogonion to assess natural head position.
The same digital camera (EOS Digital Rebel XT, Canon, Tokyo, Japan) mounted with the same lens (EF 100mm f/2.8 USM Macro Lens, Canon) and flash (Macro Ring Lite MR-14EX flash, Canon) was used for all photographic records. It was secured on a tripod for stabilization and adjustment according to the subject's height. The 100-mm macro lens was chosen to avoid facial deformations and maintain natural proportions. The camera was used in its manual position to achieve maximum image quality given the local lighting condition. A 15-cm vertical scale was adapted in a plumb line, which indicated the true vertical (VER). The scale was positioned in the midsagittal plane to allow later measurements at life size (1∶1). The photography studio was designed according to Figure 3.
Figure 3.
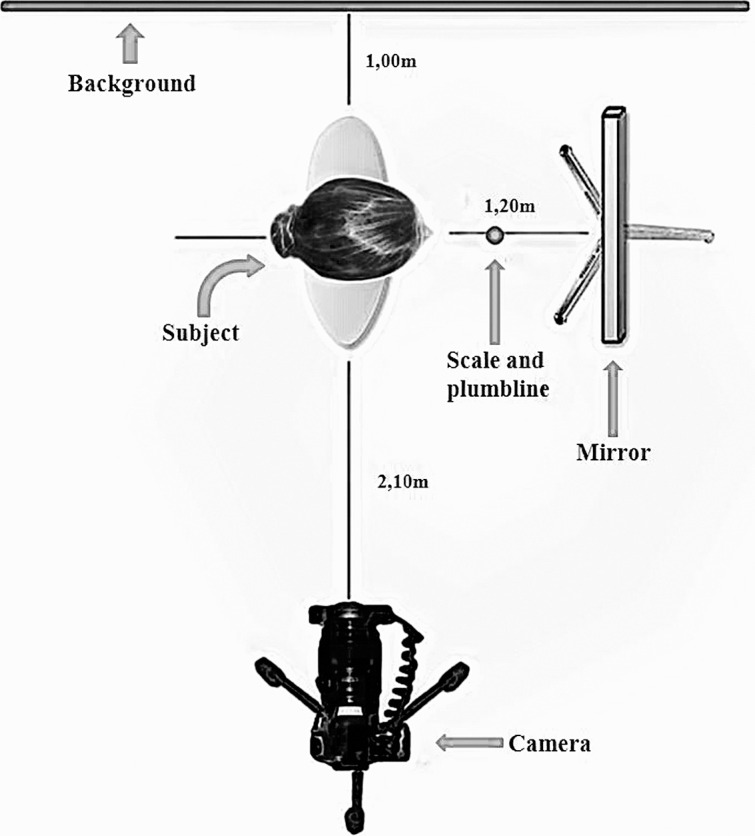
Photographic setup.
Radiographic Method
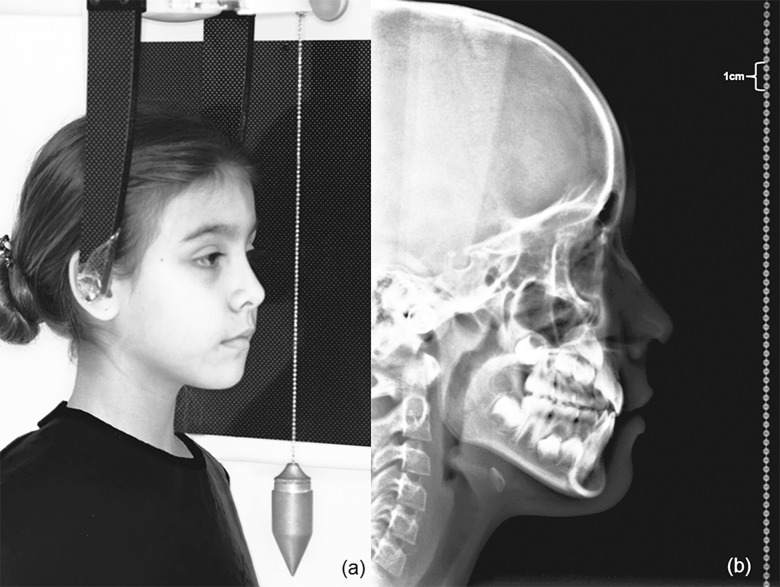
Digital lateral skull radiographs were taken with a Kodak 8000C (Kodak Dental Systems, Carestream Health, Atlanta, Ga). This radiographic system uses a charge-coupled device sensor chip as an image receptor. The exposure parameters for the digital cephalographs were 78 kV, 10 mA, and 0.6 seconds. Cephalometric radiographs were taken in an NHP (mirror position) with maximum intercuspation and lips at rest. A chain with a 200 g weight hung at its end was suspended in front of the patient, in the midsagittal plane, to register the VER. The chain was also used as a scale to allow later measurements at life size (1∶1) (Figure 4). Given the possibility of cephalostat interference while achieving an NHP, a protractor, modified with a plumb line,14 was placed on the tip of the nose and the soft-tissue pogonion to check if the same position achieved during photographic record had also been obtained during the radiographic record.
Figure 4.
(A) Subject placed in the cephalostat. (B) Digital radiographic record.
Computerized Assessment
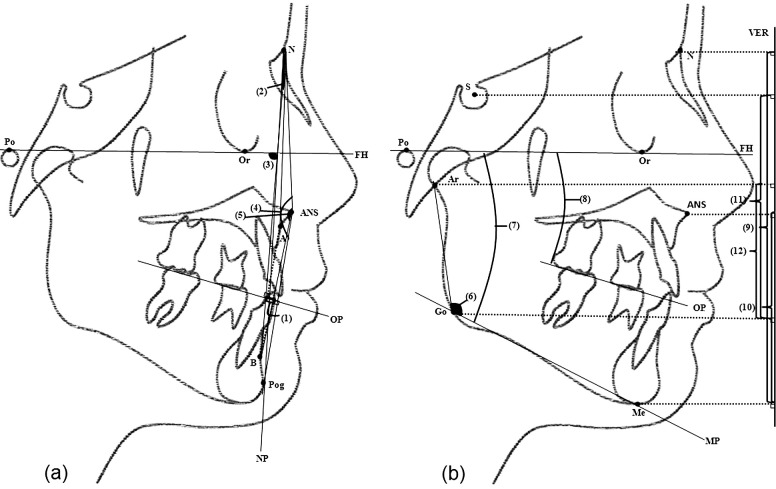
Both digital photographic and radiographic records were analyzed with Radiocef 2.0 (Radio Memory Ltda, Belo Horizonte, MG, Brazil) software for Windows. A specific analysis had been previously customized using the landmarks defined for the purpose of this study (Figure 1). Traditional cephalometric angular and linear measurements (Figure 5) and analogous photographic ones were used for sagittal and vertical assessment (Figures 6 and 7). The software automatically calculated all the measurements once the landmarks were properly identified on each record; these had previously been scaled to life size. Computerized analysis of facial morphology through radiographs and photographs were performed by the same operator in a blind design.
Figure 6.
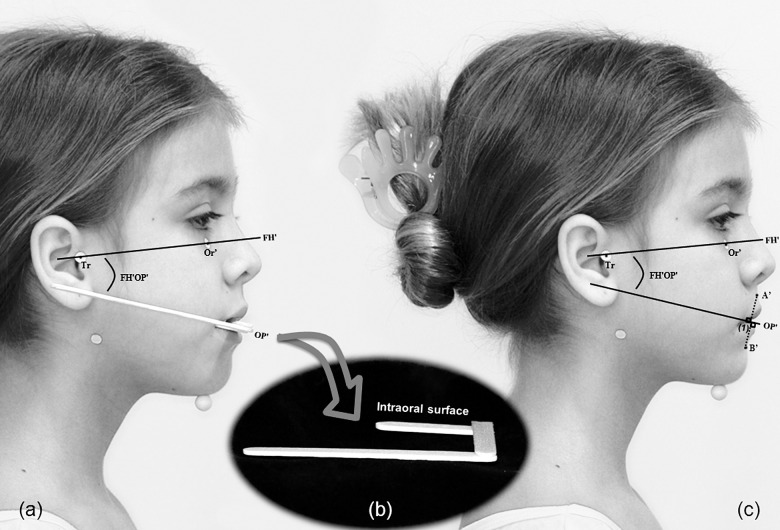
Photographic measurements. Sagittal assessment: (1) Wits', soft-tissue maxillomandibular linear discrepancy. (A) Patient occluding a wooden spatula device. (B) Schematic representation of the device. (C) Distance A'-B' obtained after the transfer of FH'OP' angle to the photograph held in maximum intercuspation.
Figure 5.
Cephalometric measurements. (A) Sagittal assessment: (1) Wits, maxillomandibular linear discrepancy; (2) ANB, maxillomandibular angular discrepancy; (3) FNP, facial angle; (4) N.ANS.Pog; and (5) N.ANS.B, angles of facial convexity. (B) Vertical assessment: (6) Ar.Go.Me, gonial angle; (7) FMA, Frankfurt to mandibular plane angle; (8) OPA, Frankfurt to occlusal plane angle; (9) AFH (N-Me), anterior facial height; (10) LAFH (ANS-Me), lower anterior facial height; (11) PFH (S-Go), posterior facial height; and (12) LPFH (Ar-Go), lower posterior facial height.
Figure 7.
Photographic measurement continuation of Figure 6. (A) Sagittal assessment: (2) A'-B' perp, soft tissue maxillomandibular linear discrepancy; (3) A'N'B', soft tissue maxillomandibular angular discrepancy; (4) FNP', soft-tissue facial angle; (5) N'.Sn.Pog'; (6) N'.Sn.B', soft tissue angles of facial convexity. (B) Vertical assessment: (7) Tr.Go'.Me', soft tissue gonial angle; (8) FMA', soft tissue Frankfurt to mandibular plane angle; (9) OPA', soft tissue Frankfurt to occlusal plane angle; (10) AFH' (N'-Me'), soft tissue anterior facial height; (11) LAFH' (Sn-Me'), soft tissue lower anterior facial height; and (12) PFH' (Tr-Go'), soft tissue posterior facial height.
Method Error
Repeatability analysis was carried out on a sample of 27 subjects (15 boys and 12 girls) randomly selected. After a 1-week interval, the same rater replaced the adhesive dots on preestablished anatomic landmarks. Then, another picture was taken. Reproducibility analysis was conducted on a sample of 20 subjects (9 boys and 11 girls) randomly selected. Hence, a second rater repeated the landmark location by palpation and replaced the adhesive dots before taking the picture.
Statistical Analysis
Data were subjected to statistical analysis using the Statistical Package for the Social Sciences, version 16.0 (SPSS Inc, Chicago, Ill). Descriptive statistics were given for each photographic and cephalometric variable. Sexual dimorphism was evaluated by independent sample t-test. Intraclass correlation coefficients (ICCs) were estimated from repeated photographic measurements to evaluate the repeatability and reproducibility of the method. Cephalometric measurements were compared with analogous photographic to assess Pearson correlation coefficients. Linear regression analyses were made between cephalometric (dependent variable to be estimated) and photographic (independent variable) measurements that achieved correlation coefficients greater than r = 0.7. Levels of P < .05 were considered statistically significant.
RESULTS
The photographic technique showed high repeatability and reproducibility regarding sagittal diagnostic variables (ICC ≥ 0.90). Considering variables used for assessing vertical diagnosis, ICCs were above 0.80.
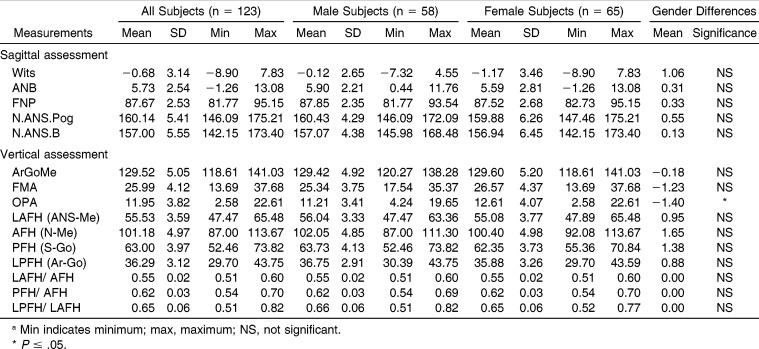
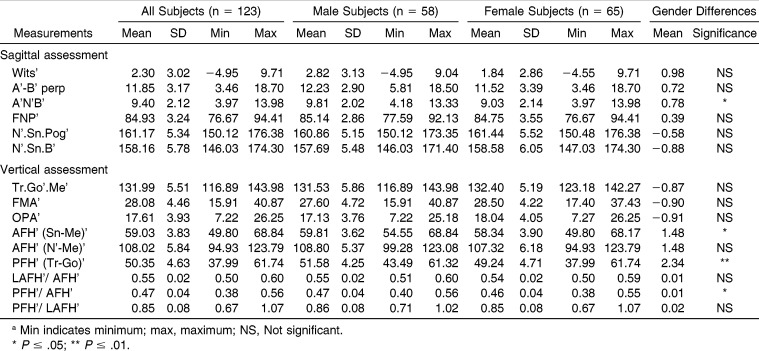
Means, standard deviations, ranges, and gender differences for all cephalometric and photographic measurements are summarized in Tables 1 and 2. In general, no significant gender differences were found for cephalometric measurements. Only the OPA was significantly greater in female subjects (P ≤ .05), which was not observed in photographic assessment. Significant differences were found for four photographic variables: A'N'B', LAFH', PFH', and PFH'/AFH' (P ≤ .05 to P ≤ .01).
Table 1.
Descriptive Statistics for Cephalometric Measurementsa
Table 2.
Descriptive Statistics for Facial Photographic Measurementsa
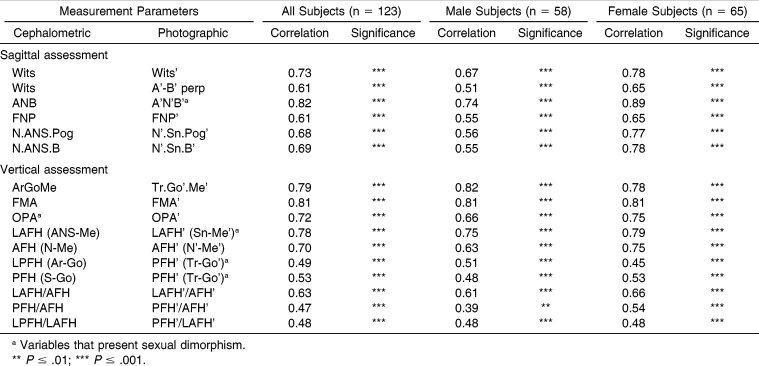
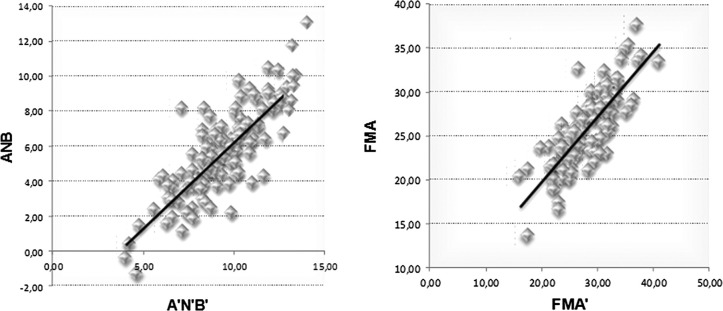
Highly significant correlations (P ≤ .001) were found for most sagittal and vertical diagnostic variables. Coefficients ranged from weak to strong. Given the entire sample, the highest coefficients were found between ANB vs A'N'B' (r = 0.82) and FMA vs FMA' (r = 0.81). The lowest coefficients were obtained for LPFH vs PFH' (r = 0.49) and PFH/AFH vs PFH'/AFH' (r = 0.47) (Table 3; Figure 8).
Table 3.
Correlation Coefficients Between Cephalometric and Photographic Measurements
Figure 8.
Scatterplots illustrating linear regression results between cephalometric and photographic measurements (n = 123). (A) ANB vs A'N'B'. (B) FMA vs FMA'. ' = Photographic landmark.
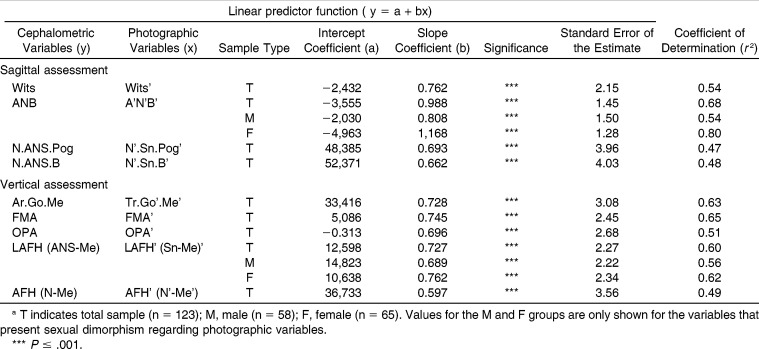
Linear regression results are listed in Table 4. Overall, the photographic variable that best explained the variability of its analogous cephalometric measurement was the A'N'B' angle (r2 = 0.68). Considering only female subjects, the A'N'B' presented an even higher coefficient of determination (r2 = 0.80). Among the photographic variables used for vertical diagnosis, FMA' showed the best results (r2 = 0.65).
Table 4.
Linear Regression Analysis Between Cephalometric and Photographic Measurements (n = 123)a
DISCUSSION
Cephalometric analysis constitutes the current gold standard for diagnosing skeletal craniofacial morphology in orthodontics clinical practice. However, the photographic assessment is a great diagnostic tool for epidemiologic studies as it is cost-effective and does not expose the patient to potentially harmful radiation.1 Through the repeatability test it was found that the linear and angular measurements useful for characterizing facial morphology can be reliably measured from facial photographs, which corroborates previous studies.3–5,10,11,15–18 This finding suggests that photography might be a feasible and practical alternative when radiography is considered too invasive or logistically impractical.10,17
Although direct anthropometry is another practical alternative for craniofacial morphology diagnosis, the standardized photographic technique has several advantages. Because the subjects do not move, it is easier to take measurements, there are no skin pressure–related errors, and the period of interaction with the subject is potentially shorter. Moreover, measurements can be performed repeatedly and data stored permanently, which makes longitudinal follow-up studies feasible.4,5 Conversely, the photographic technique has some shortcomings, such as the distortion from the distance between the lens and the subject4,15 which causes objects near the camera appear larger than those farther from it. However, this factor is only critical when attempting to compare structures located in different planes of space. Most landmarks obtained from lateral photographs in the current study are at the midline, so this issue should minimally affect the measurements.15 In addition, angular variables were most commonly used, which partially overcomes the problem of magnification.
Head posture is another source of error concerns, and must be the same during the radiographic and photographic recording protocol. Even a slight deviation of the NHP can greatly affect landmark locations and modify measurement results.11 Furthermore, jaw opening or lip straining by mentalis muscle constriction may increase error.2,11
A standardized photography protocol also includes accurate establishment of landmarks. Considering that most photographic measurements were performed based on anatomic points achieved by palpation, a reproducibility test was conducted to find the reliability in positioning the stickers, without the interference of other source of error. Hence, only one operator performed computerized analysis and picture taking. Results of our investigation showed that method reproducibility was also satisfactory.
Although the current sample had different skeletal facial patterns, in general, no significant gender differences were found for cephalometric measurements, which confirms the similar distribution into male and female subgroups. However, differences were found for A'N'B', LAFH', PFH', and PFH'/AFH' photographic variables, which were significantly higher in male subjects (P ≤ .05 to P ≤ .01). Previous authors have reported sexual dimorphism in most parameters of the labial, nasal, and chin areas when evaluating photographs. Male faces show, on average, greater heights and lengths as well as greater prominences of these areas.1,19
Fernandez-Riveiro et al.19 noticed that the Sn point was more prominent in male subjects, which may explain in part the A'N'B' angle dimorphism. Studies have also reported significantly larger values for LAFH' and PFH' in male subjects, which agrees with our findings.1,16,19,20 However, the LAFH'/AFH' and PFH'/LAFH' ratios showed no significant gender differences in our study. Therefore, although male subjects showed greater absolute measurements, the values maintain similar proportions for both male and female subjects.
The age group in the current study (7–12 years) was selected because it encompasses a period during which the interrelationship between hard and soft tissue shapes should be particularly close, without the added variability of aging effects in adults.2 Highly significant correlations (P ≤ .001) were found between analogous cephalometric and photographic measurements for most sagittal and vertical diagnostic variables. However, Pearson correlation coefficients ranged from weak to strong (0.39 ≤ r ≤ 0.89). This means that although there was a significant tendency for analogous photographic and cephalometric variables to vary together, this tendency was strong for some measurements and weak for others.
In a previous study, Zhang et al.10 reported only low to moderate correlations (0.36 ≤ r ≤ 0.64). Analogous photographic and cephalometric LAFH was the highest one observed (r = 0.64). When comparing FMA' with the cephalometric SN.GoMe, the authors found a weak correlation coefficient (r = 0.42).10 In contrast, strong correlations were observed between the cephalometric and photographic FMA analogous angles in the study by Bittner and Pancherz21 (r = 0.93) and in the current article (r = 0.81). Such difference might be related to the inclination of intracranial SN line, which has shown individual variations.22,23
Staudt and Kiliaridis11 observed that several soft tissue measurements gave a reliable description of the underlying sagittal jaw relationship. A correlation coefficient of r = 0.80 was reported when comparing analogous photographic and cephalometric ANB angles. Our results largely support these findings. Other authors have found moderate correlations regarding such variables (r = 0.63).21
Investigators evaluated the relationship between three-dimensional soft tissue measurements and well-established two-dimensional cephalometric variables that analyze anteroposterior discrepancy. They noticed that the soft tissue Wits was significantly correlated to the conventional Wits appraisal (r = 0.77),24 which corroborates our results through photographic analysis (r = 0.73). Camper Wits was also assessed to supply an entirely external method for quantitative evaluation of jaw discrepancies. However, only a moderate relationship was found with the conventional cephalometric Wits appraisal (r = 0.53). Our result regarding the Frankfurt plane (A'–B' perp) presented a slightly greater value (r = 0.61).
Linear regression analysis showed that the photographic variable that best explained the variability of its analogous cephalometric measurement in the current study was the A'N'B' angle (r2 = 0.68). This means that at least 68% of the variance of the cephalometric assessment can be explained by such photographic measurements given the total sample. This finding largely supports a previous report that found a coefficient of determination of r2 = 0.63 between analogous soft tissue and skeletal ANB angles.11 In the present sample, A'N'B' showed an even higher coefficient of determination (r2 = 0.80) among female subjects, which means that the soft tissue thickness variability exerts less influence in these patients. Regarding vertical assessment, FMA' showed the best results (r2 = 0.65).
This article provides regression models that may predict the cephalometric variable by means of analogous photographic measurements with a limited error of the estimate and a satisfactory predictive power. Further studies must be performed to establish the diagnostic accuracy of such models.
CONCLUSIONS
Highly significant correlations between analogous photographic and cephalometric measurements were found for most sagittal and vertical diagnostic variables.
The A'N'B' and FMA' angles were the photographic variables that best explained the variability of its analogous cephalometric measurement.
The photographic method was found to be a repeatable, reproducible, low-cost, and noninvasive diagnostic alternative for epidemiologic research provided that a standardized protocol is followed. Further studies are needed to test the diagnostic accuracy of the predictive models obtained.
ACKNOWLEDGMENTS
This study was supported by São Paulo Research Foundation (FAPESP, Brazil, Grant 2012/02933-1). The authors also gratefully acknowledge Radio Memory Ltda for generously providing the software Radiocef Studio version 2.0 for this research, and thank GESTOS and APCD academic institutions for the partnership.
REFERENCES
- 1.Ferrario VF, Sforza C, Miani A, Tartaglia G. Craniofacial morphometry by photographic evaluations. Am J Orthod Dentofacial Orthop. 1993;103:327–337. doi: 10.1016/0889-5406(93)70013-E. [DOI] [PubMed] [Google Scholar]
- 2.Halazonetis DJ. Morphometric correlation between facial soft-tissue profile shape and skeletal pattern in children and adolescents. Am J Orthod Dentofacial Orthop. 2007;132:450–457. doi: 10.1016/j.ajodo.2005.10.033. [DOI] [PubMed] [Google Scholar]
- 3.Dimaggio FR, Ciusa V, Sforza C, Ferrario VF. Photographic soft-tissue profile analysis in children at 6 years of age. Am J Orthod Dentofacial Orthop. 2007;132:475–480. doi: 10.1016/j.ajodo.2005.10.029. [DOI] [PubMed] [Google Scholar]
- 4.Han K, Kwon HJ, Choi TH, Kim JH, Son D. Comparison of anthropometry with photogrammetry based on a standardized clinical photographic technique using a cephalostat and chair. J Craniomaxillofac Surg. 2010;38:96–107. doi: 10.1016/j.jcms.2009.04.003. [DOI] [PubMed] [Google Scholar]
- 5.Ozdemir ST, Sigirli D, Ercan I, Cankur NS. Photographic facial soft tissue analysis of healthy Turkish young adults: anthropometric measurements. Aesthetic Plast Surg. 2009;33:175–184. doi: 10.1007/s00266-008-9274-z. [DOI] [PubMed] [Google Scholar]
- 6.Brezniak N, Turgeman R, Redlich M. Incisor inclination determined by the light reflection zone on the tooth's surface. Quintessence Int. 2010;41:27–34. [PubMed] [Google Scholar]
- 7.Saxby PJ, Freer TJ. Dentoskeletal determinants of soft tissue morphology. Angle Orthod. 1985;55:147–154. doi: 10.1043/0003-3219(1985)055<0147:DDOSTM>2.0.CO;2. [DOI] [PubMed] [Google Scholar]
- 8.Kasai K. Soft tissue adaptability to hard tissues in facial profiles. Am J Orthod Dentofacial Orthop. 1998;113:674–684. doi: 10.1016/s0889-5406(98)70228-8. [DOI] [PubMed] [Google Scholar]
- 9.Rose AD, Woods MG, Clement JG, Thomas CD. Lateral facial soft-tissue prediction model: analysis using Fourier shape descriptors and traditional cephalometric methods. Am J Phys Anthropol. 2003;121:172–180. doi: 10.1002/ajpa.10173. [DOI] [PubMed] [Google Scholar]
- 10.Zhang X, Hans MG, Graham G, Kirchner HL, Redline S. Correlations between cephalometric and facial photographic measurements of craniofacial form. Am J Orthod Dentofacial Orthop. 2007;131:67–71. doi: 10.1016/j.ajodo.2005.02.033. [DOI] [PubMed] [Google Scholar]
- 11.Staudt CB, Kiliaridis S. A nonradiographic approach to detect Class III skeletal discrepancies. Am J Orthod Dentofacial Orthop. 2009;136:52–58. doi: 10.1016/j.ajodo.2007.07.025. [DOI] [PubMed] [Google Scholar]
- 12.Molhave A. A biostatic investigation. The standing posture of man theoretically and statometrically illustrated. Acta Orthop Scand. 1960;29:291–300. [PubMed] [Google Scholar]
- 13.Solow B, Tallgren A. Natural head position in standing subjects. Acta Odontol Scand. 1971;29:591–607. doi: 10.3109/00016357109026337. [DOI] [PubMed] [Google Scholar]
- 14.Moate SJ, Geenty JP, Shen G, Darendeliler MA. A new craniofacial diagnostic technique: the Sydney diagnostic system. Am J Orthod Dentofacial Orthop. 2007;131:334–342. doi: 10.1016/j.ajodo.2005.04.047. [DOI] [PubMed] [Google Scholar]
- 15.Cummins DM, Bishara SE, Jakobsen JR. A computer assisted photogrammetric analysis of soft tissue changes after orthodontic treatment. Part II: results. Am J Orthod Dentofacial Orthop. 1995;108:38–47. doi: 10.1016/s0889-5406(95)70064-1. [DOI] [PubMed] [Google Scholar]
- 16.Bishara SE, Jorgensen GJ, Jakobsen JR. Changes in facial dimensions assessed from lateral and frontal photographs. Part I—methodology. Am J Orthod Dentofacial Orthop. 1995;108:389–393. doi: 10.1016/s0889-5406(95)70036-6. [DOI] [PubMed] [Google Scholar]
- 17.Kale-Varlk S. Angular photogrammetric analysis of the soft tissue facial profile of Anatolian Turkish adults. J Craniofac Surg. 2008;19:1481–1486. doi: 10.1097/SCS.0b013e318188a34d. [DOI] [PubMed] [Google Scholar]
- 18.Aksu M, Kaya D, Kocadereli I. Reliability of reference distances used in photogrammetry. Angle Orthod. 2010;80:482–489. doi: 10.2319/070309-372.1. [DOI] [PMC free article] [PubMed] [Google Scholar]
- 19.Fernandez-Riveiro P, Suarez-Quintanilla D, Smyth-Chamosa E, Suarez-Cunqueiro M. Linear photogrammetric analysis of the soft tissue facial profile. Am J Orthod Dentofacial Orthop. 2002;122:59–66. doi: 10.1067/mod.2002.125236. [DOI] [PubMed] [Google Scholar]
- 20.Bishara SE, Jorgensen GJ, Jakobsen JR. Changes in facial dimensions assessed from lateral and frontal photographs. Part II–Results and conclusions. Am J Orthod Dentofacial Orthop. 1995;108:489–499. doi: 10.1016/s0889-5406(95)70049-8. [DOI] [PubMed] [Google Scholar]
- 21.Bittner C, Pancherz H. Facial morphology and malocclusions. Am J Orthod Dentofacial Orthop. 1990;97:308–315. doi: 10.1016/0889-5406(90)70103-J. [DOI] [PubMed] [Google Scholar]
- 22.Bjork A. Some biological aspects of prognathism and occlusion of the teeth. Angle Orthod. 1951;21:3–27. doi: 10.1043/0003-3219(1951)021<0003:SBAOPA>2.0.CO;2. [DOI] [PubMed] [Google Scholar]
- 23.Moorrees CFA, Kean MR. Natural head position, a basic consideration in the interpretation of cephalometric radiographs. Am J Phys Anthropol. 1958;16:213–234. [Google Scholar]
- 24.Ferrario VF, Serrao G, Ciusa V, Morini M, Sforza C. Cephalometric and in vivo measurements of maxillomandibular anteroposterior discrepancies: a preliminary regression study. Angle Orthod. 2002;72:579–584. doi: 10.1043/0003-3219(2002)072<0579:CAIVMO>2.0.CO;2. [DOI] [PubMed] [Google Scholar]


