Abstract
Cardiovascular and cerebrovascular diseases are characterized by high rates of morbidity and mortality. Microbiota is closely associated with cardiovascular disease. We aimed to comprehensively analyze the microbiotas of 300 healthy controls, 300 patients with high blood pressure (HBP), and 300 patients with coronary heart disease (CHD). The results indicated no significant difference in microbiota diversity among the three groups (P > 0.05). However, differences in microbiota richness among the three groups were significant (P < 0.05). Bacteroidetes and Bacteroidia were the dominant bacteria in the CHD group, Enterobacteriales and Escherichia-shigella in the HBP group, and Acidaminococcaceae and Phascolarctobacterium in the healthy control group. The prediction results of the random forest model indicated that the population with CHD displayed prominent features with high sensitivity, indicating that microbiota detection might become a novel clinical indicator to predict and monitor the risk of cardiovascular events. The prediction of microbiota function suggested differences in oxygen supply and chronic inflammation between populations with HBP/CHD and healthy populations. Although there is no difference in gut microbiota diversity among the three groups, each group has its dominant microbiota in terms of richness.
1. Introduction
Human gut microbiota is believed to be directly or indirectly involved in cardio-cerebrovascular disease (CVD) [1]. Although cause-effect relationships have not been established, the reported associations between gut microbiota and CVD alterations are prominent [2]. Studies [3–7] have shown that gut microbiota is associated with obesity, diabetes, dyslipidemia, and hypertension, which are risk factors for coronary heart disease. Gut microbiota can induce atherosclerosis and coronary heart disease through metabolites involved in cholesterol metabolism, uric acid metabolism, oxidative stress, and inflammation [8–10].
For example, microbiota produced trimethylamine (TMA) through the metabolism of dietary choline, phosphatidylcholine, and L-carnitine, which was further metabolized to a proatherogenic species, trimethylamine-N-oxide (TMAO), thus promoting the occurrence of atherosclerosis (AS) [11–13]. Santisteban et al. [14] suggest that patients with high blood pressure (HBP) are associated with obvious gut microbiota disturbance and intestinal mucosal barrier dysfunction. Li et al. [15] adopted metagenomic and metabolomic approaches to analyze the gut microbiota characteristics in healthy controls, patients with prehypertension, and patients with primary HBP. The results showed that two patient groups exhibited significantly reduced microbial abundance and diversity. In addition, probiotics reduced the excessive growth of Prevotella and Klebsiella. Kim et al. [16] investigated the fecal samples from 22 patients with HBP and eighteen healthy controls with normal blood pressure. Their results suggested that the fecal flora composition and function in patients with HBP significantly changed, and the fecal content of butyrate significantly decreased. In terms of function prediction, it was discovered that the abundance of Streptococcus positively correlated with blood pressure, and that of Enterobacteriaceae positively correlated with the myocardial index.
Researchers have paid increasing attention to the relationship between gut microbiota and CVD. However, the limited clinical sample size may lack universality and persuasiveness of previous studies. Large-sample studies on the 16S RNA-based high-throughput sequencing of gut microbiota in HBP and CHD are deficient. Consequently, more clinical studies are needed to obtain more details about the changes in intestinal microbial compositions and their effects on HBP and CHD [17].
In this study, fecal microbiota from 300 healthy controls, 300 patients with HBP, and 300 patients with CHD was profiled by 16S ribosomal DNA. Metagenomic sequencing was performed on 900 samples. Bacterial community structures and metabolic function between the samples were assessed. Specifically, we aimed to explore the differences of gut microbiota among these populations to provide further a theoretical foundation for preventing HBP and CHD.
2. Materials and Methods
2.1. Objects
A total of 300 patients with HBP and 300 patients with CHD who were admitted to the First Affiliated Hospital of Zhejiang Chinese Medical University between 2017 and 2019 were enrolled in the present study. HBP was defined as blood pressure higher than 140/90 mmHg, and patients in the CHD group were confirmed to have coronary artery disease by coronary angiography. At the same time, 300 healthy volunteers were selected from the Physical Examination Center of our hospital as controls.
The criteria included participants who (1) did not take antacids, probiotics, antibiotics, or antibacterial agents within 30 days of the sample collection; (2) were aged 18–80 years old; (3) had a BMI of 18–35 kg/m2; (4) had no organic disease in the digestive system; (5) had not undergone gastrointestinal surgery; (6) had no history of diseases that might affect the gut microbiota, such as alcoholism, diabetes, tumor, heart failure, kidney failure, or stroke; (7) did not take high blood pressure drugs or coronary heart disease drugs; and (8) had signed informed consent documents. The characteristics of the three groups are listed in Table 1. The ethics committee of the First Affiliated Hospital of Zhejiang Chinese Medical University approved all study protocols (number: 2017-KL-041-01). Informed consent was obtained after written introductions were provided to all 900 volunteers from the Hangzhou in the Zhejiang Province of China.
Table 1.
Demographic and clinical data of patients and healthy controls (the chi-squared test (sex), one-way ANOVA (age, BMI)).
| Control | HBP | CHD | F | P value | |
|---|---|---|---|---|---|
| Number | 300 | 300 | 300 | — | — |
| Sex (M/F) | 165/135 | 143/157 | 154/146 | — | 0.199 |
| Age (Y) | 62.02 ± 11.79 | 61.60 ± 11.92 | 60.53 ± 10.48 | 1.367 | 0.255 |
| BMI (kg/m2) | 20.64 ± 1.85 | 20.47 ± 2.01 | 20.54 ± 1.95 | 0.626 | 0.535 |
2.2. Sample Collection and DNA Extraction
The fecal samples of patients were collected using a sterile swab into the sampling tube containing the preservation fluid. Afterward, DNA was extracted using the sodium dodecyl sulfonate (SDS) lysate freezing-thawing method. The genomic DNA was extracted using a PowerMax extraction kit (MoBio Laboratories, CA, USA) and preserved at −20°C. Then, the DNA quantity and quality were determined using a NanoDrop ND-1000 spectrophotometer (Thermo Fisher Scientific, MA, USA). Subsequently, agarose gel electrophoresis was performed. Incidentally, this extraction method has also obtained a Chinese national invention patent (ZL201511009389.7).
2.3. 16S RNA-Based Amplicon Pyrosequencing
The polymerase chain reaction (PCR) forward amplification primer in the V4 region of the bacterial 16S rRNA gene was 515F (5′-GTGCCAGCMGCCGCGGTAA-3′), and the reverse primer was 806R (5′-GGACTACHVGGGTWTCTAAT-3′). Later, the barcode was synthesized into the sequence by adopting the specific 7-bp sequence. The PCR reaction system was 50 μL, including 25 μL of high-fidelity enzyme Phusion High-Fidelity PCR Master Mix with HF buffer, 3 μL (10 μM) of respective forward and reversed primers, 10 μL of DNA template, 3 μL of DMSO, and 6 μL of ddH2O. We then used the prepared PCR system for PCR amplification under the following reaction conditions: initial denaturation at 98°C for 30 s, followed by denaturation at 98°C for 15 s, annealing at 58°C for 15 s, and extension at 72°C for 15 s for 25 cycles, and the final extension at 72°C for 1 min. The PCR products were then purified using AMPure XP Beads (Beckman Coulter, IN, USA) and quantified using a PicoGreen dsDNA Assay Kit (Invitrogen, CA, USA). After quantification, an Illumina Novaseq 6000 pair-end 2 × 150 bp platform was adopted for sequencing.
2.4. Sequence and Statistical Analyses
Data from each sample were divided from the raw data according to the barcode sequence and the primer sequence. After removing the barcode and primer sequences, the reads of each sample were spliced using the VSEARCH software (v2.4.4, 2017) to obtain raw data. At the same time, the sequence quality was controlled and filtered. The criteria for filtering the low-quality sequences were as follows: sequences of <140 bp, those with the average quality value of <20 bp, those containing unclear basic groups, and those containing single nucleotide repeats of >8 bp. The chimera sequences were eliminated to obtain ultimately useful data.
The operational taxonomic unit (OTU) was analyzed using the VSEARCH software (v2.4.4, 2017), including the removal of repeated sequences and elimination of chimera. Sequences with 97% similarity were clustered into OTUs by default. The representative sequences of OTUs were selected using the default parameters. The representative sequences were conducted using species annotations based on the SILVA database (v128, 2017) using VSEARCH to predefine the OTU list further. Afterward, we determined the intestinal flora composition of each sample at diverse classification levels, including kingdom, phylum, class, order, family, genus, and species. Moreover, the abundance and classification of all OTUs in each sample were recorded, and OTUs <0.001% complete sequences were removed from all samples.
We applied the R package (v3.2.0, 2015.04) to analyze the distribution of sequence length in all samples. We used OTU tables to record the abundance of each OTU of samples. We calculated taxon abundance at the levels of phylum, class, order, family, genus, and species and statistically compared the abundance among groups by Kruskal test from R stats package (metagenomeSeq packages). Based on the OTU table in the Quantitative Insights into Microbial Ecology (QIIME2, 2020.06), alpha diversities including Chao1, Simpson, and Shannon were calculated. The significant differences of alpha diversity metrics were performed using the R package “Vegan.” To investigate the structural variation of microbial communities, we performed and visualized beta diversity analysis using UniFrac distance metrics via principal component analysis (PCA), principal coordinate analysis (PCoA), and nonmetric multidimensional scaling (NMDS) from QIIME. We used the R package “vegan” and PERMANOVA (permutational multivariate analysis of variance) to evaluate differences in microbiota among groups. We conducted the linear discriminant analysis (LDA) effect size (LEfSe) method based on the Kruskal–Wallis test and linear discriminant analysis (LDA) to identify significant differentially abundant taxonomy between different groups. We performed random-forest classification for discriminating the samples from different groups using the R package “random forest,” with 1,000 trees and all default settings, and we then used the “pROC” package for receiver operating curve (ROC) analysis. The expected “baseline” error was also included, which was obtained by a classifier that simply predicts the most common category label. Based on 16S rRNA marker gene sequences, we predicted a microbial function using the BugBase (v.0.1.0, 2017).
3. Results and Discussion
3.1. Results
The sequence statistics in Table 2 are based on the intestinal flora genomes of 900 subjects sequenced by a Novaseq high-throughput sequencer. For example, the total number of sequences in the healthy control group was 12,403,888, the average number of sequences sample was 41,346, the maximum number of sequences was 60,761, the minimum number was 28,043, and the OTUs numbered 628.
Table 2.
Statistics of sequences.
| Group | Number_sample | Sum_tags | Average_tags | Max/Min | OTUs |
|---|---|---|---|---|---|
| Control | 300 | 12403888 | 41346 | 60761/28043 | 628 |
| HBP | 300 | 12797717 | 42659 | 60581/28001 | 647 |
| CHD | 300 | 25240725 | 84135 | 149768/28645 | 775 |
3.1.1. Alpha-Diversity Analysis
As shown in Figure 1, the rarefaction curve of OTUs tends to be flat, but with the increase of sequencing depth, there will be new OTUs. However, in the Shannon–Wiener curve, which can represent the diversity of intestinal flora; when the maximum sequencing amount is reached, the curve is completely stable, indicating that the bacterial diversity of samples in this study has been completely detected. With the increase of sequencing depth, there may be new species, but the discovery of these new species may have little impact on the study of intestinal flora diversity.
Figure 1.
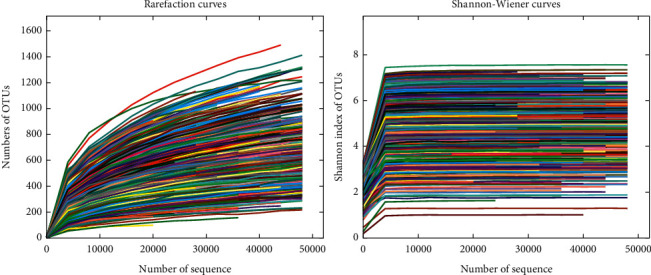
The rarefaction curve of OTUs.
Samples in the HBP, CHD, and healthy control groups were statistically analyzed by Kruskal–Wallis test and correlation analyses. The results suggested that the richness levels in samples from the HBP and CHD groups were significantly higher than those in the healthy control group (P=0.044), but with no significant difference in the diversity levels (P=0.8434 and P=0.1175) (Figure 2).
Figure 2.

Species richness and species diversity.
3.1.2. Beta-Diversity Analysis
We used the weighted UniFrac distance algorithm for principal coordinate analysis (PCoA). We tested the samples in the three groups using the Kruskal–Wallis test based on the PC1 and PC2 principal components. The results revealed statistically significant differences among the three groups (Figure 3).
Figure 3.
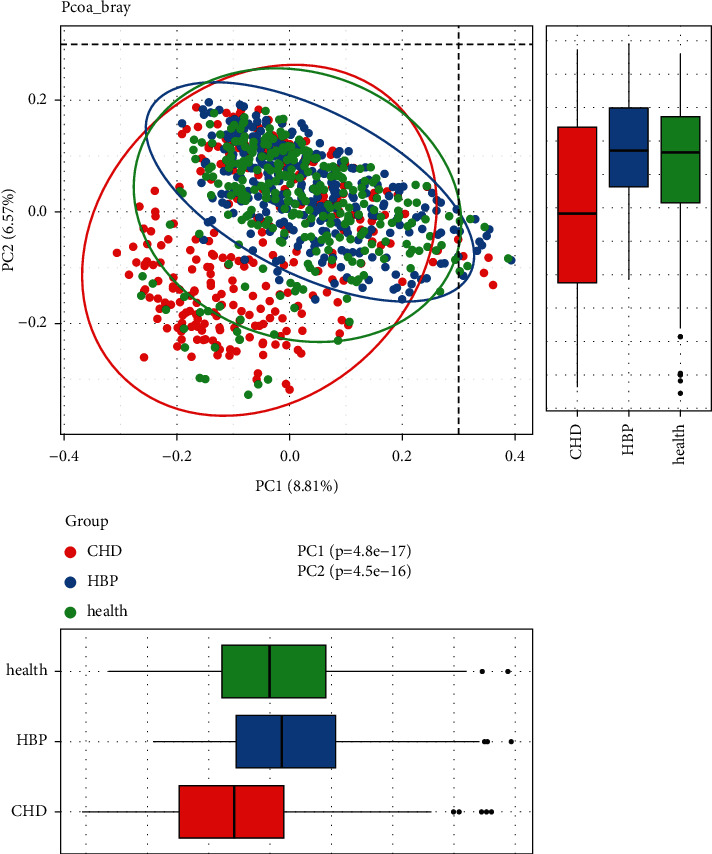
PCoA analysis (the analysis indicated the different community composition in OUT-level among the three groups, with variances of PC1 8.81% and PC2 6.57%).
3.1.3. Microbial Community Structure
According to the analysis of similarities (ANOSIM) (Figure 4), We can see that R = 0.054 and P=0.001, indicating that the difference between groups is significantly greater than that within groups.
Figure 4.
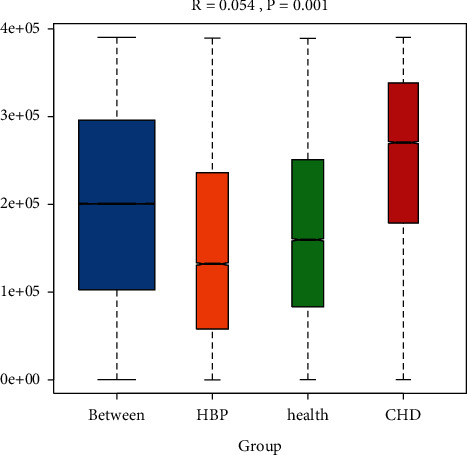
Analysis of similarities (ANOSIM) among the three groups (the range of R is [−1, 1]. R > 0 indicates that the difference between groups is greater than that within groups. P value can be obtained by the permutation test).
In Figure 5, we can see five circles of different sizes from the inside to the outside, representing five different classifications of phylum, class, order, family, and genus. In Figure 6, we can see the CHD group, Bacteroidetes and Bacteroidia were the dominant bacteria; in the HBP group, Enterobacteriales and Escherichia-shigella were predominant, and in the control group, Acidaminococcaceae and Phascolarctobacterium were the dominant bacteria.
Figure 5.
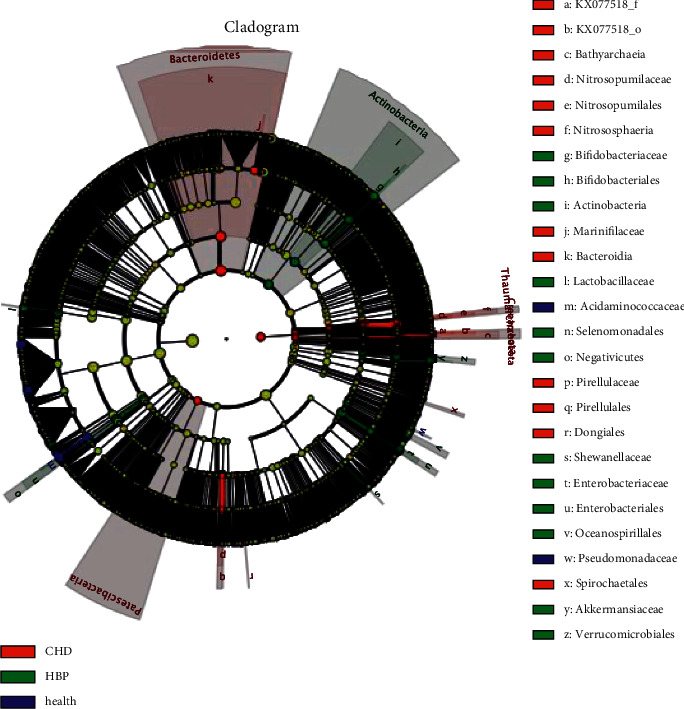
Cladogram shows the most differentially abundant taxa.
Figure 6.
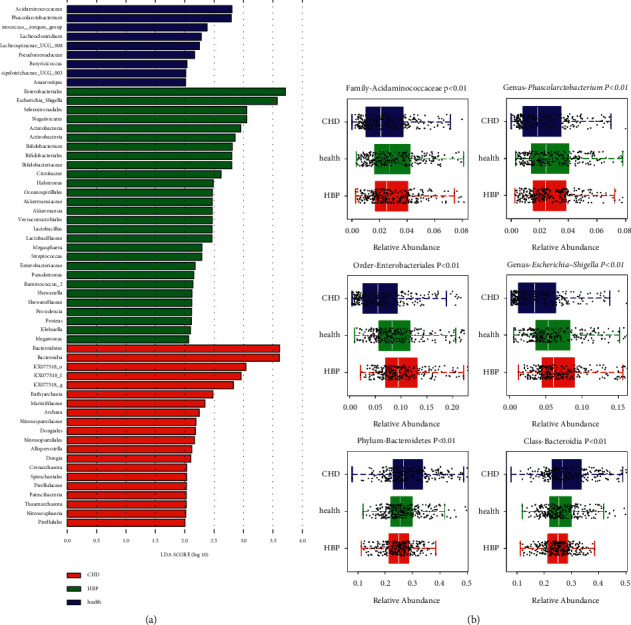
LEfSe analysis with LAD score >2.
3.1.4. Receiver Operating Characteristic (ROC) Curve
At the genus level, the results indicated that the value of the area under the curve (AUC) in the three groups was 0.75, 0.70, and 0.66, respectively (Figure 7(a)). Additionally, we combined patients with HBP with healthy controls to form a control group for differential detection against patients with CHD. The results showed that the AUC of the new model reached up to 0.75 (Figure 7(b)).
Figure 7.
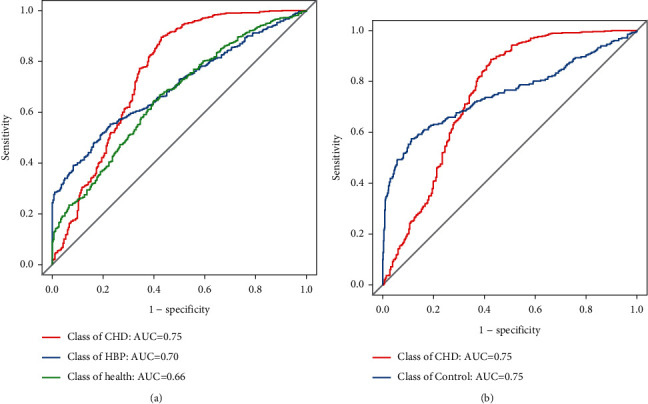
ROC curve among the control, HBP, and CHD groups.
3.1.5. Flora Metabolic Function Prediction
We applied the BugBase to predict the phenotypes of gut microbiota and conducted the intergroup statistical test. As a result, Aerobic, Anaerobic, Contains_Mobile_Elements, Facultatively_Anaerobic, Forms_Biofilms, and Stress_Tolerant were significantly different (P < 0.05), but we observed no significant difference in Gram-positive bacteria, Gram-negative bacteria, and pathogenicity (P > 0.05) (Table 3) (Attachment 1 (available here)).
Table 3.
Flora metabolic function prediction among the three groups.
| BugBase | KS_P value |
|---|---|
| Aerobic | 0.0161 |
| Anaerobic | <0.01 |
| Contains_Mobile_Elements | <0.01 |
| Facultatively_Anaerobic | <0.01 |
| Forms_Biofilms | <0.01 |
| Gram_Negative | 0.6225 |
| Gram_Positive | 0.6225 |
| Potentially_Pathogenic | 0.3747 |
| Stress_Tolerant | <0.01 |
3.2. Discussion
In recent years, the results of many clinical and animal studies have shown that microbiota disorders are closely related to the occurrence of diseases [18–25]. Previous studies by Chan et al. [26] showed that the changes of bacterial genus and the decrease of α-diversity were significantly correlated with the size of atherosclerotic plaque (P < 0.05). Other studies have also shown that the increase of Enterobacteriaceae is associated with the appearance of atherosclerotic plaque size and more severe coronary atherosclerosis (P < 0.05) [27, 28]. Our findings are consistent with the results of a study with a sample size of forty people by Gózd-Barszczewska et al. [29] suggesting that Bacteroides may play a role in patients with coronary heart disease. The results of our study suggest that there is no difference in microbiota diversity between patients with hypertension and patients with coronary heart disease (P > 0.05), which is inconsistent with Liu's study [30]. The inconsistency may be caused by the regional concentration or ethnic correlation of samples. The study by Cui et al. [31] showed that the significant decrease in the proportion of Bacteroidetes in the CHD group might be negatively correlated with the risk of coronary heart disease (P < 0.05). However, our study showed that the quantity of Bacteroidetes on the genus level in the CHD group was higher than that of the healthy control group, which may be because our study considers quantitative aspects. Finally, we expected more than 90% accuracy in ROC curve predictions, but achievements were not ideal, reaching only 75%. This discrepancy may be related to the age, weight, and dietary habits of the population [32, 33].
Our study was the first to use a large amount of clinical sample data. Such a large sample database can improve the accuracy of data analysis and model accuracy, and Chen et al. [34] and Brown and Hazen [35] suggested that differences in gut microbiota can be used to predict cardiovascular disease. The ultimate goal is to optimize and develop the whole process from sampling device to extraction to library building and sequencing analysis and to achieve rapid, low-cost detection of intestinal flora in a large population [36].
Our study also had several limitations. First, all the selected population came from the First Affiliated Hospital of Zhejiang Chinese Medicine University, which had obvious geographical limitations. Second, the inclusion and exclusion criteria of this study were strictly controlled, resulting in limited participation. Third, the heterogeneity of clinical samples leads to the decrease of repeatability of experimental result. Finally, to increase the sample size, the age span should be larger.
The implication of our study is that the microbiome may serve as a biomarker to predict cardiovascular disease, but this must be further revealed by the characterization or enrichment of the specific bacterial community that the microbiome diagnoses [37]. At the same time, the relationship between intestinal microbiota and different CHD subtypes and different cardiovascular risk levels of HBP needs to be further explored.
Acknowledgments
The authors would like to thank Gulei Jin from Guhe Information Technology Co., Ltd. (Hangzhou, Zhejiang 310006) for his help with the experiments. This work was supported by the Science and Technology Project of Zhejiang Province (Grant no. 2017C33071) and the Scientific Research Projects of Zhejiang Provincial Department of Education (Grant no. Y201942366)
Data Availability
The datasets used and/or analyzed during the current study are available from the corresponding author.
Disclosure
Chuanqi Wan and Chen Zhu are the co-first authors.
Conflicts of Interest
The authors declare that they have no conflicts of interest.
Supplementary Materials
Class.Groups.sig.boxplot.pdf. Family.Groups.sig.boxplot.pdf. Genus.Groups.sig.boxplot.pdf. Order. Groups.sig.boxplot.pdf. Phylum.Groups.sig.boxplot.pdf. Attachment 1: flora metabolic function prediction.
References
- 1.Yan Q., Gu Y., Li X., et al. Alterations of the gut microbiome in hypertension. Frontiers in Cellular and Infection Microbiology . 2017;7:p. 381. doi: 10.3389/fcimb.2017.00381. [DOI] [PMC free article] [PubMed] [Google Scholar]
- 2.Aryal S., Alimadadi A., Manandhar I., Joe B., Cheng X. Machine learning strategy for gut microbiome-based diagnostic screening of cardiovascular disease. Hypertension . 2020;76(5):1555–1562. doi: 10.1161/HYPERTENSIONAHA.120.15885. [DOI] [PMC free article] [PubMed] [Google Scholar]
- 3.Bäckhed F., Ding H., Wang T., et al. The gut microbiota as an environmental factor that regulates fat storage. Proceedings of the National Academy of Sciences of the United States of America . 2004;101(44):15718–15723. doi: 10.1073/pnas.0407076101. [DOI] [PMC free article] [PubMed] [Google Scholar]
- 4.Qin J., Li Y., Cai Z., et al. A metagenome-wide association study of gut microbiota in type 2 diabetes. Nature . 2012;490(7418):55–60. doi: 10.1038/nature11450. [DOI] [PubMed] [Google Scholar]
- 5.Wang Z., Tang W. H. W., Buffa J. A., et al. Prognostic value of choline and betaine depends on intestinal microbiota-generated metabolite trimethylamine-N-oxide. European Heart Journal . 2014;35(14):904–910. doi: 10.1093/eurheartj/ehu002. [DOI] [PMC free article] [PubMed] [Google Scholar]
- 6.Yang T., Santisteban M. M., Rodriguez V., et al. Gut dysbiosis is linked to hypertension. Hypertension . 2015;65(6):1331–1340. doi: 10.1161/HYPERTENSIONAHA.115.05315. [DOI] [PMC free article] [PubMed] [Google Scholar]
- 7.Yao H., Wan J.-Y., Wang C.-Z., et al. Bibliometric analysis of research on the role of intestinal microbiota in obesity. Peer Journal . 2018;6 doi: 10.7717/peerj.5091.e5091 [DOI] [PMC free article] [PubMed] [Google Scholar]
- 8.Fava F., Lovegrove J. A., Gitau R., Jackson K. G., Tuohy K. M. The gut microbiota and lipid metabolism: implications for human health and coronary heart disease. Current Medicinal Chemistry . 2006;13(25):3005–3021. doi: 10.2174/092986706778521814. [DOI] [PubMed] [Google Scholar]
- 9.Liu H., Zhuang J., Tang P., Li J., Xiong X., Deng H. The role of the gut microbiota in coronary heart disease. Current Atherosclerosis Reports . 2020;22(12):p. 77. doi: 10.1007/s11883-020-00892-2. [DOI] [PubMed] [Google Scholar]
- 10.Jie Z., Xia H., Zhong S.-L., et al. The gut microbiome in atherosclerotic cardiovascular disease. Nature Communications . 2017;8(1):p. 845. doi: 10.1038/s41467-017-00900-1. [DOI] [PMC free article] [PubMed] [Google Scholar]
- 11.Koeth R. A., Wang Z., Levison B. S., et al. Intestinal microbiota metabolism of L-carnitine, a nutrient in red meat, promotes atherosclerosis. Nature Medicine . 2013;19(5):576–585. doi: 10.1038/nm.3145. [DOI] [PMC free article] [PubMed] [Google Scholar]
- 12.Koeth R. A., Levison B. S., Culley M. K., et al. γ-Butyrobetaine is a proatherogenic intermediate in gut microbial metabolism of L-carnitine to TMAO. Cell Metabolism . 2014;20(5):799–812. doi: 10.1016/j.cmet.2014.10.006. [DOI] [PMC free article] [PubMed] [Google Scholar]
- 13.Liu G., Li J., Li Y., et al. Gut microbiota-derived metabolites and risk of coronary artery disease: a prospective study among US men and women. The American Journal of Clinical Nutrition . 2021;114(1):238–247. doi: 10.1093/ajcn/nqab053. [DOI] [PMC free article] [PubMed] [Google Scholar]
- 14.Santisteban M. M., Qi Y., Zubcevic J., et al. Hypertension-linked pathophysiological alterations in the gut. Circulation Research . 2017;120(2):312–323. doi: 10.1161/CIRCRESAHA.116.309006. [DOI] [PMC free article] [PubMed] [Google Scholar]
- 15.Li J., Zhao F., Wang Y., et al. Gut microbiota dysbiosis contributes to the development of hypertension. Microbiome . 2017;5(1):p. 14. doi: 10.1186/s40168-016-0222-x. [DOI] [PMC free article] [PubMed] [Google Scholar]
- 16.Kim S., Goel R., Kumar A., et al. Imbalance of gut microbiome and intestinal epithelial barrier dysfunction in patients with high blood pressure. Clinical Science . 2018;132(6):701–718. doi: 10.1042/CS20180087. [DOI] [PMC free article] [PubMed] [Google Scholar]
- 17.Collado M. C., Rautava S., Isolauri E., Salminen S. Gut microbiota: a source of novel tools to reduce the risk of human disease? Pediatric Research . 2015;77(1-2):182–188. doi: 10.1038/pr.2014.173. [DOI] [PubMed] [Google Scholar]
- 18.Yan X., Jin J., Su X., et al. Intestinal flora modulates blood pressure by regulating the synthesis of intestinal-derived corticosterone in high salt-induced hypertension. Circulation Research . 2020;126(7):839–853. doi: 10.1161/CIRCRESAHA.119.316394. [DOI] [PubMed] [Google Scholar]
- 19.Kåhrström C. T., Pariente N., Weiss U. Intestinal microbiota in health and disease. Nature . 2016;535(7610):p. 47. doi: 10.1038/535047a. [DOI] [PubMed] [Google Scholar]
- 20.Witkowski M., Weeks T. L., Hazen S. L. Gut microbiota and cardiovascular disease. Circulation Research . 2020;127(4):553–570. doi: 10.1161/CIRCRESAHA.120.316242. [DOI] [PMC free article] [PubMed] [Google Scholar]
- 21.Zhu W., Gregory J. C., Org E., et al. Gut microbial metabolite TMAO enhances platelet hyperreactivity and thrombosis risk. Cell . 2016;165(1):111–124. doi: 10.1016/j.cell.2016.02.011. [DOI] [PMC free article] [PubMed] [Google Scholar]
- 22.Lässiger-Herfurth A., Pontarollo G., Grill A., Reinhardt C. The gut microbiota in cardiovascular disease and arterial thrombosis. Microorganisms . 2019;7(12):p. 691. doi: 10.3390/microorganisms7120691. [DOI] [PMC free article] [PubMed] [Google Scholar]
- 23.Shen Y., Cheng Z.-D., Chen Y.-G., et al. Electroacupuncture inhibits atherosclerosis through regulating intestinal flora and host metabolites in rabbit. Evidence-Based Complementary and Alternative Medicine . 2020;2020:10. doi: 10.1155/2020/5790275.5790275 [DOI] [PMC free article] [PubMed] [Google Scholar]
- 24.Wu Y., Wang C.-Z., Wan J.-Y., Yao H., Yuan C.-S. Dissecting the interplay mechanism between epigenetics and gut microbiota: health maintenance and disease prevention. International Journal of Molecular Sciences . 2021;22(13):p. 6933. doi: 10.3390/ijms22136933. [DOI] [PMC free article] [PubMed] [Google Scholar]
- 25.Yao H., Wan J. Y., Zeng J., et al. Effects of compound K, an enteric microbiome metabolite of ginseng, in the treatment of inflammation associated colon cancer. Oncology Letters . 2018;15(6):8339–8348. doi: 10.3892/ol.2018.8414. [DOI] [PMC free article] [PubMed] [Google Scholar]
- 26.Chan Y. K., Brar M. S., Kirjavainen P. V., et al. High fat diet induced atherosclerosis is accompanied with low colonic bacterial diversity and altered abundances that correlates with plaque size, plasma A-FABP and cholesterol: a pilot study of high fat diet and its intervention with Lactobacillus rhamnosus GG (LGG) or telmisartan in ApoE−/− mice. BMC Microbiology . 2016;16(1):p. 264. doi: 10.1186/s12866-016-0883-4. [DOI] [PMC free article] [PubMed] [Google Scholar]
- 27.Tuomisto S., Huhtala H., Martiskainen M., Goebeler S., Lehtimäki T., Karhunen P. J. Age-dependent association of gut bacteria with coronary atherosclerosis: tampere sudden death study. PLoS One . 2019;14(8) doi: 10.1371/journal.pone.0221345.e0221345 [DOI] [PMC free article] [PubMed] [Google Scholar]
- 28.Liu H., Chen X., Hu X., et al. Alterations in the gut microbiome and metabolism with coronary artery disease severity. Microbiome . 2019;7(1):p. 68. doi: 10.1186/s40168-019-0683-9. [DOI] [PMC free article] [PubMed] [Google Scholar]
- 29.Gózd-Barszczewska A., Kozioł-Montewka M., Barszczewski P., Młodzińska A., Humińska K. Gut microbiome as a biomarker of cardiometabolic disorders. Annals of Agricultural and Environmental Medicine . 2017;24(3):416–422. doi: 10.26444/aaem/75456. [DOI] [PubMed] [Google Scholar]
- 30.Liu F., Fan C., Zhang L., et al. Alterations of gut microbiome in tibetan patients with coronary heart disease. Frontiers in Cellular and Infection Microbiology . 2020;10:p. 373. doi: 10.3389/fcimb.2020.00373. [DOI] [PMC free article] [PubMed] [Google Scholar]
- 31.Cui L., Zhao T., Hu H., Zhang W., Hua X. Association study of gut flora in coronary heart disease through high-throughput sequencing. BioMed Research International . 2017;2017:10. doi: 10.1155/2017/3796359.3796359 [DOI] [PMC free article] [PubMed] [Google Scholar]
- 32.David L. A., Maurice C. F., Carmody R. N., et al. Diet rapidly and reproducibly alters the human gut microbiome. Nature . 2014;505(7484):559–563. doi: 10.1038/nature12820. [DOI] [PMC free article] [PubMed] [Google Scholar]
- 33.Wan J.-Y., Wang C.-Z., Zhang Q.-H., et al. Significant difference in active metabolite levels of ginseng in humans consuming Asian or western diet: the link with enteric microbiota. Biomedical Chromatography . 2017;31(4) doi: 10.1002/bmc.3851.e3851 [DOI] [PMC free article] [PubMed] [Google Scholar]
- 34.Chen L., Ishigami T., Doi H., Arakawa K., Tamura K. The types and proportions of commensal microbiota have a predictive value in coronary heart disease. Journal of Clinical Medicine . 2021;10(14):p. 3120. doi: 10.3390/jcm10143120. [DOI] [PMC free article] [PubMed] [Google Scholar]
- 35.Brown J. M., Hazen S. L. The gut microbial endocrine organ: bacterially derived signals driving cardiometabolic diseases. Annual Review of Medicine . 2015;66(1):343–359. doi: 10.1146/annurev-med-060513-093205. [DOI] [PMC free article] [PubMed] [Google Scholar]
- 36.Zheng Y.-Y., Wu T.-T., Liu Z.-Q., et al. Gut microbiome-based diagnostic model to predict coronary artery disease. Journal of Agricultural and Food Chemistry . 2020;68(11):3548–3557. doi: 10.1021/acs.jafc.0c00225. [DOI] [PubMed] [Google Scholar]
- 37.Ott S. J., El Mokhtari N. E., Musfeldt M., et al. Detection of diverse bacterial signatures in atherosclerotic lesions of patients with coronary heart disease. Circulation . 2006;113(7):929–937. doi: 10.1161/circulationaha.105.579979. [DOI] [PubMed] [Google Scholar]
Associated Data
This section collects any data citations, data availability statements, or supplementary materials included in this article.
Supplementary Materials
Class.Groups.sig.boxplot.pdf. Family.Groups.sig.boxplot.pdf. Genus.Groups.sig.boxplot.pdf. Order. Groups.sig.boxplot.pdf. Phylum.Groups.sig.boxplot.pdf. Attachment 1: flora metabolic function prediction.
Data Availability Statement
The datasets used and/or analyzed during the current study are available from the corresponding author.


