PRACTICAL IMPLICATIONS
Brain atrophy related to malabsorption may be reversible after adequate treatment, and MRI may be a useful tool for evaluating brain changes related to malnutrition and chronic disease in children.
A great deal of the brain's ultimate structure and capacity is shaped early in life, before the age of 3 years.1 The influence of optimal nutrition during early life on brain development has been demonstrated by numerous studies.1–3 On the other hand, brain volume loss is accepted to be progressive with age and may be permanent. However, reversible brain atrophy has been demonstrated in adults with anorexia nervosa4 and reported in children suffering from kwashiorkor.5,6 We would like to report on a rare case of reversible brain atrophy in a child after the correction of malabsorption.
Case
A 2-month-old girl was referred for assessment of the syndromic form of biliary atresia including abdominal situs inversus, associated with biliary atresia, renal dysplasia, polysplenia, interventricular communication, congenital pulmonary stenosis, inferior vena cava agenesis, and intestinal malrotation. The infant was born at 38 weeks' gestation after a twin monochorionic biamniotic pregnancy with intrauterine death of the sibling. On admission, the child was jaundiced with abdominal wall collateral vasculature and a cardiac murmur. Neurologic examination was within normal limits for age. Her development to date has been remarkable for failure to thrive, something which was confirmed on the growth curves: 28th percentile at birth, 4th percentile for the weight, and 2nd percentile for the head circumference (measured at 35.5 cm), at week 7, when admitted in our hospital. She underwent an uneventful Kasai hepatoportoenterostomy (KHE) at 50 days of life. At 5 months of life, she underwent liver transplantation (LT) for end-stage, cholestatic liver disease, with a maximum bilirubin level reached between the KHE and LT, at 511 μmol/L. In the interim period, she benefited from standard nutritional management for cholestatic infants: fat-soluble vitamin supplementation and formula enriched in medium-chain triglycerides, with blood levels of triglycerides remaining within normal or slightly elevated values (2.10 mmol/L on admission, 1.68 on day 7 after LT, and 1.34 at 5 years after LT; normal values: <2 mmol/L). Fat-soluble vitamins levels were low on admission (1.3 μmol/L with normal range: 1.5–4 for vitamin A and 7 μmol/L with normal range: 10–50 for vitamin E), with the lowest level between the KHE and LT (0.7 μmol/L for vitamin A) and normal or slightly elevated values after supplementation (2.2 μmol/L and 28 μmol/L at 2 months after LT for vitamins A and E, respectively). Serum protein levels were within lower normal values (43 g/L on admission with normal range: 43–69 g/L), reaching the lowest values around LT (36 g/L), catching-up normal values thereafter. Her post-transplant course was mostly remarkable for ongoing kidney dysfunction (most recent glomerular filtration rate 40 mL/min/1.73m2) and chronic allograft changes with the most recent biopsy displaying cirrhosis. No genetic test was performed apart from negative test for nephronophthisis in gene nephronophthisis 1 (NPHP1). Nonetheless, the patient has displayed catch-up growth, followed by normal growth, as has been reported after pediatric LT. School performance is remarkable for 1-year delay and attention problems.
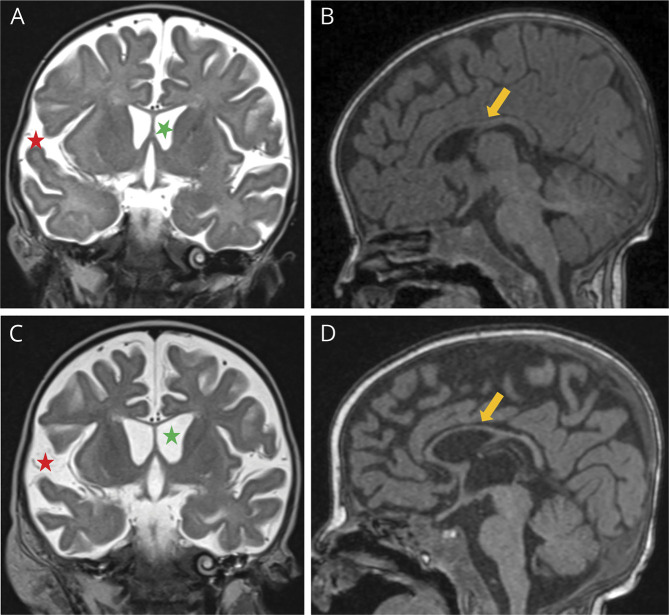
Brain MRI performed at 5 months of life as part of the pretransplant assessment revealed the enlargement of subarachnoid spaces and reduced thickness of the corpus callosum (Figure 1, A and B). Five weeks later (2 weeks after transplantation), the infant presented 2 episodes of staring spells, investigated by a second MRI, which suggested a slight progression of the previously described enlarged subarachnoid spaces and ventricular system, and progression of the corpus callosum atrophy (Figure 1, C and D). Her growing curve for weight was corresponding to less than 1st percentile at the moment when the second MRI was performed.
Figure 1. Brain MRI at 3 and 4 Months of Life, Respectively.
In the first row, images of the first MRI study (A and B), performed before liver transplantation, demonstrated enlarged ventricular system and subarachnoid spaces (green and red asterisks, respectively, in A) and reduced thickness of the corpus callosum (yellow arrow in B). In second MRI study in the second row (C and D), performed 2 weeks after liver transplantation, a progression of these findings was noted (asterisks in C and arrow in D).
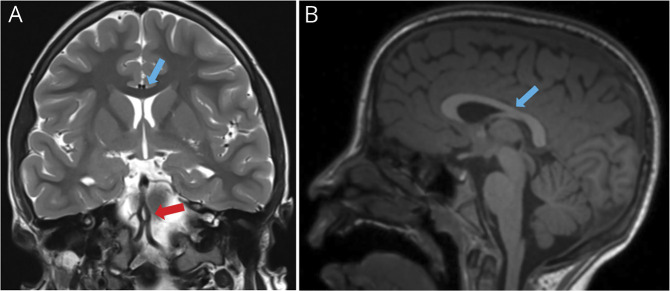
There were no additional neurologic symptoms or signs until a cluster of seizures associated with inflammatory status at 9 years of age, warranting a new MRI study. This last study excluded focal epileptogenic lesions. Importantly, it demonstrated a return to normal brain volume for age, including a normal thickness of the corpus callosum (Figure 2, A and B).
Figure 2. Brain MRI at 9 Years of Age.
Last MRI study (A and B) was performed 9 years later, after normalization of growing curves, and demonstrated a regression of brain atrophy and normal thickness of the corpus callosum (blue arrows in A and B comparing with yellow arrows in B and D of Figure 1). As an incidental finding, a basilar artery's fenestration (anatomic variant) was seen in (A) (red arrow).
Disussion
Our hypothesis is that brain atrophy in the first 2 MRI studies was related to malnutrition secondary to cholestasis-induced malabsorption because of biliary atresia. This condition is known to cause fat, protein, and fat-soluble vitamins malabsorption, as well as iron and zinc deficiency,7 resulting not only in reduced caloric imports but also in global malnutrition. This is consistent with the fact that both first MRIs were performed during the period of increased malabsorption, as indirectly indicated by the low bilirubin and protein levels in that period. Although calcineurin inhibitors and steroids used after LT have been singled out as potentially neurotoxic, it is our assessment that MRI findings in this infant were caused largely by malnutrition, akin to what has been reported in kwashiorkor,6 because they preceded LT (first MRI performed before LT and second MRI only 2 weeks after LT). Brain atrophy was reversible after LT by enabling normal metabolism and catch-up weight gain and growth. At the age of 9 years, when the last MRI study was performed, the child's height and weight had reached the 50th percentile. Our case though is slightly different from the brain atrophy caused in malnourished children. We hypothesize that the reversibility seen in our case is related to the specific improvement in lipid absorption after LT more than to the generalized caloric improvement, as reflected by the significant improvement of myelination and white matter's increased volume in the last MRI. The return to normal thickness of the corpus callosum in the last MRI (Figure 2) is a good indicator of the increase in white matter volume.
This case supports existing data in other chronic conditions and malnutrition about the reversibility of brain atrophy in children and demonstrates that successful treatment of the underlying cause of malnutrition may have a positive impact on brain volume, although the correlation with cognitive function remains to be determined. Brain MRI can be helpful for the evaluation of brain changes related to malnutrition and chronic disease. The reversibility of brain volume loss in infancy and its relationship to neurocognitive outcomes are an area ripe for further study.
Acknowledgment
The authors would like to thank Alexandros Karentzos, MD, MSc, for his contribution at text editing.
Appendix. Authors

Study Funding
No targeted funding reported.
Disclosure
The authors report no disclosures relevant to the manuscript. Full disclosure form information provided by the authors is available with the full text of this article at Neurology.org/cp.
References
- 1.Cusick SE, Georgieff MK. The role of nutrition in brain development: the golden opportunity of the “first1000 days”. J Pediatr. 2016;175:16–21. [DOI] [PMC free article] [PubMed] [Google Scholar]
- 2.Prado EL, Dewey KG. Nutrition and brain development in early life. Nutr Rev. 2014;72:267–284. [DOI] [PubMed] [Google Scholar]
- 3.Bhargava H, Singh J. Resonance imaging in severely malnourished children before and after treatment. Nutrition. 2020;74:110753. [DOI] [PubMed] [Google Scholar]
- 4.Bernardoni F, King JA, Geisler D, et al. Weight restoration therapy rapidly reverses cortical thinning in anorexia nervosa: a longitudinal study. Neuroimage. 2016;130:214–222. [DOI] [PubMed] [Google Scholar]
- 5.Kessel A, Tal Y, Jaffe M, Even L. Reversible brain atrophy and reversible developmental retardation in a malnourished infant. Isr J Med Sci. 1996;32:306–308. [PubMed] [Google Scholar]
- 6.Gunston GD, Burkimsher D, Malan H, Sive AA. Reversible cerebral shrinkage in kwarshiorkor: an MRI study. Arch Dis Child. 1992;67:1030–1032. [DOI] [PMC free article] [PubMed] [Google Scholar]
- 7.Sundaram SS, Mack CL, Feldman AG, Sokol RG. Biliary atresia: indications and timing for liver transplantation and optimization of pretransplant care. Liver Transpl. 2017;23:96–109. [DOI] [PMC free article] [PubMed] [Google Scholar]


