Abstract
Purpose of Review
To evaluate whether CSF and circulating neurofilament light chain (NfL), a marker of axonal damage, could discriminate Parkinson disease (PD) from atypical parkinsonian syndromes (APSs).
Recent Findings
MEDLINE and Scopus were systematically searched, and 15 studies were included (1,035 patients with PD and 930 patients with APS). CSF NfL levels were 1.26 SDs higher in the APS group compared to the PD group (g = 1.26 [95% confidence interval 0.99–1.53]), and circulating NfL levels were 1.53 SDs higher in the APS group compared to the PD group (g = 1.53 [95% confidence interval 1.15–1.91]); 4 studies, 307 patients with PD, 197 patients with APS. Pooled areas under the curve were 0.941 (0.916–0.965) and 0.874 (0.802–0.946) for CSF and circulating NfL, corresponding to average sensitivities of 86% (79%–90%) and 91% (86%–95%), and specificity of 88% (82%–92%) and 76% (62%–85%), respectively.
Summary
These results strongly support the high diagnostic accuracy of both CSF and circulating NfL in differentiating PD from APS, highlighting their usefulness as promising biomarkers.

Parkinsonism is defined as bradykinesia, combined with either rigidity or resting tremor.1 Parkinson disease (PD) is the most common cause of neurodegenerative asymmetrical parkinsonism, although a smaller but remarkable number of patients suffer from atypical parkinsonian syndromes (APS). APS mainly comprise (1) progressive supranuclear palsy (PSP) with supranuclear vertical gaze palsy and early postural instability, (2) corticobasal degeneration (CBD) markedly asymmetrical cortical and extrapyramidal symptoms, (3) multiple system atrophy (MSA) characterized by autonomic failure and pyramidal signs with or without cerebellar dysfunction, and (4) dementia with Lewy bodies (DLBs) with early cognitive impairment and visual hallucinations in the first year of parkinsonian symptoms.1 PD has considerable overlapping clinical features with APS; despite recent advances in the clinical diagnostic criteria, structural imaging, and functional imaging, misdiagnosis often occurs.1 In contrast to PD, APS are characterized by poorer response to levodopa and worse prognosis, emphasizing the importance of correct diagnosis for appropriate clinical management. In addition, given the increasing number of clinical trials investigating disease-modifying therapies, a reliable biomarker for differentiating PD from APS is highly needed.
Neurofilaments (NfLs) are intermediate neuronal-specific cytoplasmic proteins playing a crucial role in axonal growth and transmission.2,3 After axonal damage, because of inflammation, neurodegeneration, or traumatic injury, NfL are extracellularly detected in the CSF and blood4,5 as promising biomarkers for a wide range of neurological disorders, including parkinsonian syndromes.3 Compared with PD, APS exhibited high circulating and CSF NfL levels,6–13 which vary significantly among these studies. Despite the several meta-analyses of NfL in neurodegenerative diseases,3,14–16 we investigate the differences in both CSF and circulating NfL levels between APS and PD and quantify for first time the discriminative value of NfL in these disorders.
Methods
Search Strategy and Selection Criteria
A systematic literature search was carried out from January 1, 1970, to June 20, 2020, in the MEDLINE and Scopus databases, according to the Preferred Reporting Items for Systematic Reviews and Meta-Analyses (PRISMA) guidelines. The Medical Subject Headings terms are available in the eMaterial (links.lww.com/CPJ/A306).
Two authors (E.A., A.B.) screened the search results. Inclusion criteria were (1) studies written in the English language, (2) original peer-reviewed clinical studies involving observational (cross-sectional, case-control, and cohort studies) and clinical trials reporting on CSF or circulating (serum or plasma) levels of NfL in patients with PD and APS, including MSA (MSA-P and/or MSA-C), PSP, CBS or CBD, and DLB, (3) patients with PD and APS should be clinically diagnosed according to the established criteria—including UK Parkinson's Disease Society Brain Bank criteria and the National Institute of Neurological Disorders and Stroke diagnostic criteria for PD, and international consensus criteria for either possible or probable MSA, PSP, CBS or CBD and DLB,17–22 and (4) the method of NfL measurement should be clearly reported. Exclusion criteria include language other than English, animal studies, reviews, letters/commentaries, case-reports, and studies using the same sample as any other eligible included study. We ensured that all relevant studies were identified by screening the reference list for any related publications.
Data Extraction and Quality Assessment
After having examined the full texts of all identified relevant articles, we extracted the following variables by using a structured template: the author's surname, year of publication, country, study type, number of participants, baseline patient demographics [age, male/female ratio, disease duration, disease severity (Unified Parkinson's Disease Rating Scale III or Hoehn and Yahr Scale), cognitive function (Mini-Mental State Examination or Montreal Cognitive Assessment [MoCA]), NfL concentration in the CSF and/or blood (serum or plasma), and diagnostic accuracy of NfL (areas under the curve [AUC], sensitivity, specificity, and cutoff value). If more than one lumbar puncture was performed in cohort studies, data from the baseline lumbar puncture were used because of the larger number of participants in this case. If the study results were not explicitly reported or only presented graphically, we requested them from the corresponding authors.
Two authors (E.A. and A.B.) independently evaluated the methodological quality of each study. We used the Quality Assessment of Diagnostic Accuracy Studies (QUADAS)-2 for assessing risk of bias in studies reporting diagnostic accuracy23 (eMaterial, links.lww.com/CPJ/A306).
Statistical Analysis
For eligible studies, we extracted for each group of patients (PD, MSA, PSP, CBD, and DLB) the sample size, the mean CSF and circulating NfL levels, and their SDs. We transformed median interquartile range (IQR) or median range to mean (SD) using previously described formulae.24,25 We then calculated the mean (SD) values for the APS patient groups by merging the MSA, PSP, CBD, and DLB groups of each individual study.
We carried out 5 comparisons: APS vs PD, MSA vs PD, PSP vs PD, CBD vs PD, and DLB vs PD for CSF and circulating NfLs. Hedge g calculated standardized mean differences (SMDs) and their 95% confidence intervals (CIs) between the compared patient groups of each study because it provides a small-sample adjustment attenuating the artificial upward bias when sample sizes are small. We then performed random-effect meta-analyses of the derived SMDs using the method described by DerSimonian and Laird.26 Heterogeneity was assessed with the I2, which was derived using the Cochran Q statistic. We defined low, moderate, and high heterogeneity as an I2 of <25%, 25%–75%, and >75%, respectively (significance threshold at p < 0.10).27 To explore potential sources of heterogeneity, we carried out a sensitivity analysis restricted to studies of at least moderate quality, as assessed by the QUADAS-2 scale. Funnel plots presented the results of our analysis in a graphical manner. Publication bias was assessed by the Egger test (significance threshold at p < 0.10).28 We sought to examine the effect of publication year on the SMDs in NfL values between patients with APS and PD. We therefore carried out 2 meta-regression analyses (for CSF and circulating NfL) demonstrating the change of SMD values regarding the year of publication of each individual study (see eMaterial links.lww.com/CPJ/A306).
We explored the discriminatory performance of CSF and circulating NfL levels by random-effects meta-analysis of AUCs in a subset of studies presenting receiver operating characteristic (ROC) curve analyses. When individual studies presented specific cutoffs for CSF or circulating NfL levels, maximizing sensitivity, and specificity, we computed hierarchical summary ROC (HSROC) curves.
A 2-sided p value of <0.05 was assumed as significant. All analyses were performed using the STATA Software version 13.0 (Stata Corporation, College Station, TX).
Data Availability
Anonymized data not published within this article will be made available by request from any qualified investigator.
Results
Studies Included and Quality Assessment
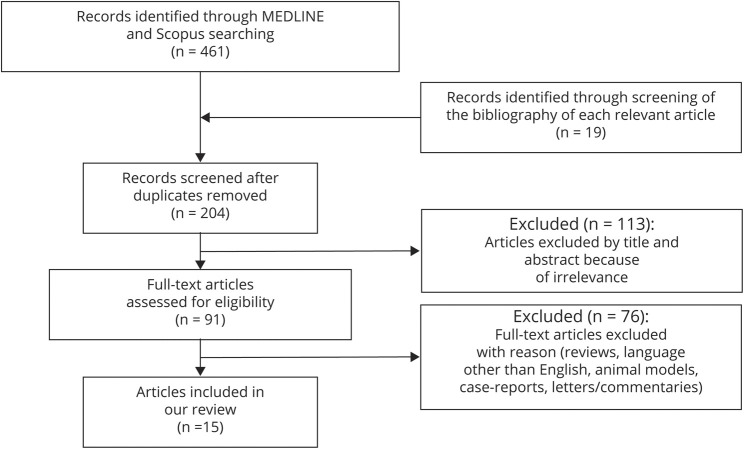
From a total of 204 identified articles after the removal of duplicates, 113 were excluded after screening of the title and abstract. After full-text screening, 76 articles were excluded because they did not meet the inclusion criteria. One study29 was excluded because the same sample was used in another included study.11 Finally, we included 15 eligible studies.2,6–13,30–35 Selection process is depicted in the PRISMA flowchart (Figure 1); 12 and 4 studies investigated CSF and circulating NfL levels, respectively.
Figure 1. PRISMA Flowchart for Study Selection.
PRISMA flowchart depicting the process for the selection of the included studies for the systematic review and for the data synthesis of the clinical studies investigating the NfL levels in patients with PD vs APS. APS = atypical parkinsonian syndrome; PD = Parkinson disease; PRISMA = Preferred Reporting Items for Systematic Reviews and Meta-Analyses.
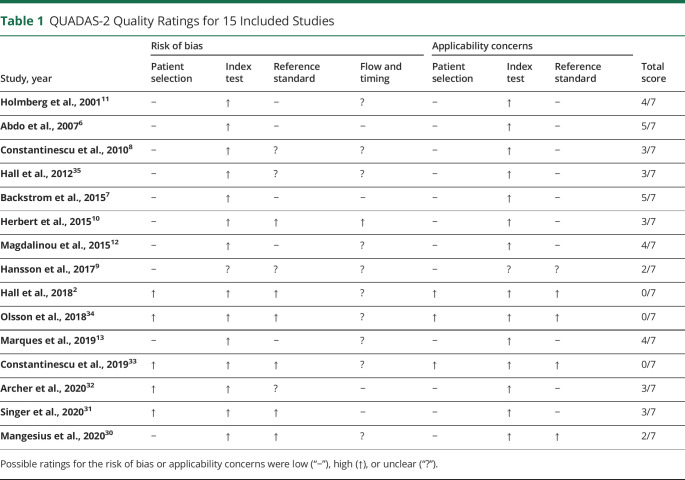
The quality of all eligible studies is presented in Table 1 (median score: 3 of 7, IQR 2–4) (for details see eMaterial, links.lww.com/CPJ/A306).
Table 1.
QUADAS-2 Quality Ratings for 15 Included Studies
Demographics and Clinical Characteristics of Patients With PD and APS
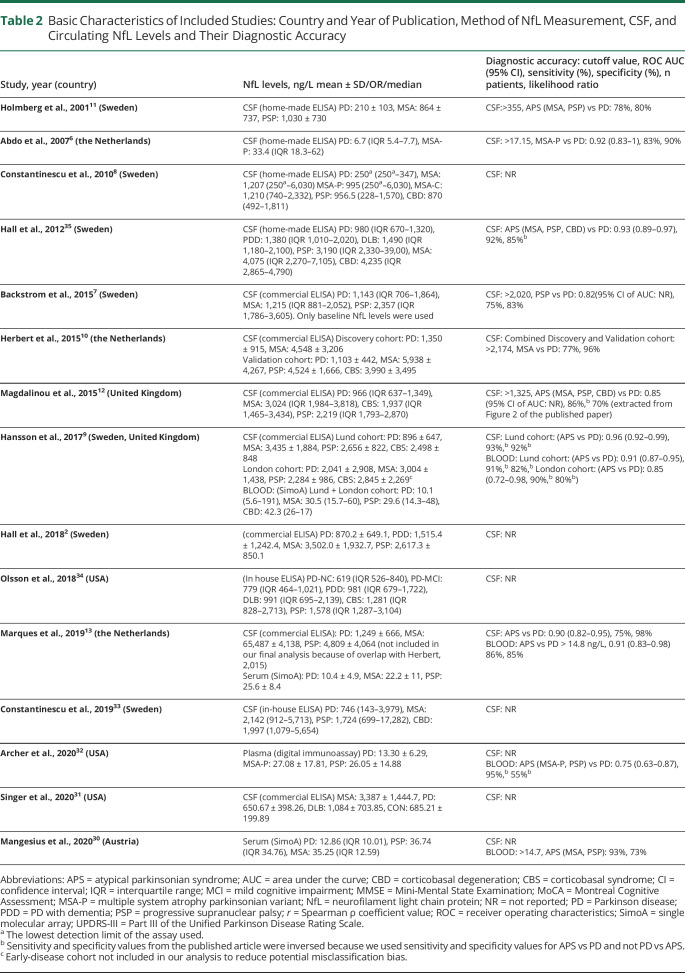
The main characteristics of studies and participants are presented in Table 2 and eTable 1 (links.lww.com/CPJ/A305). Totally, 1,035 patients with PD and 930 patients with APS (453 MSA, 283 PSP, 94 CBD and CBS, and 116 DLB) were included in our analyses. In particular, 880 patients with PD and 847 patients with APS (395 MSA, 242 PSP, 94 CBD and CBS, and 116 DLB), and 307 patients with PD and 197 patients with APS (115 MSA, 82 PSP) were included in our analyses for CSF and circulating NfL, respectively.
Table 2.
Basic Characteristics of Included Studies: Country and Year of Publication, Method of NfL Measurement, CSF, and Circulating NfL Levels and Their Diagnostic Accuracy
CSF and Circulating NfL Levels in Patients With PD and APS
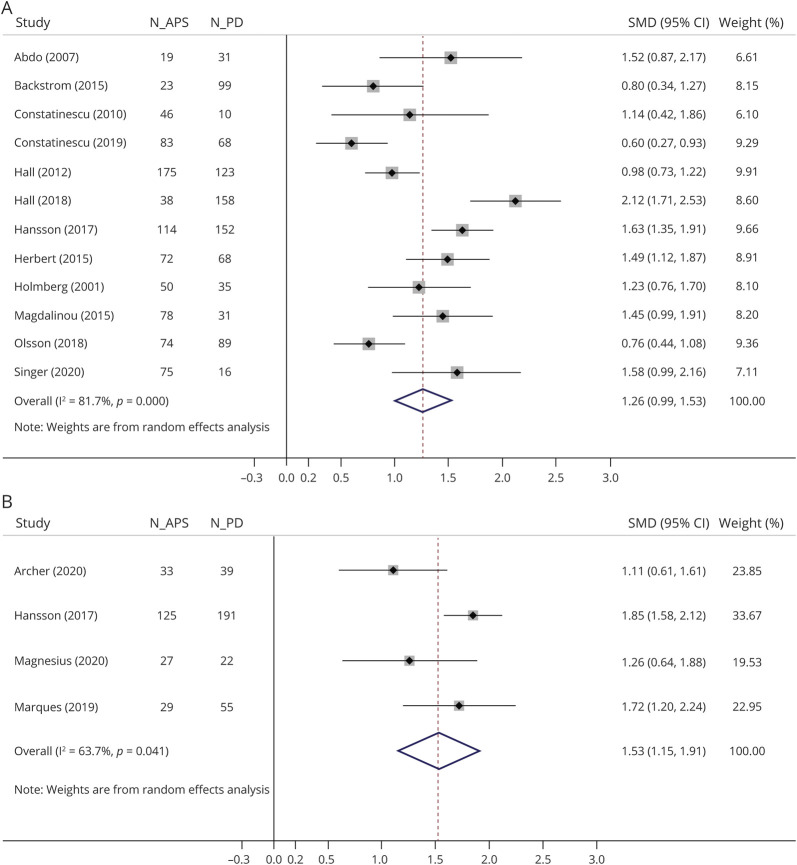
CSF and circulating NfL levels in patients with APS vs PD or in each APS subgroup vs PD are presented graphically in forest plots (Figure 2, eFigure 1, links.lww.com/CPJ/A302, and eFigure 2, links.lww.com/CPJ/A303).
Figure 2. Forest Plots of the Meta-analyses of (A) CSF and (B) Circulating NfL Levels in Patients with APS vs PD.
SMDs of each study are depicted as data markers; shaded boxes around the data markers indicate the statistical weight of the respective study; 95% CIs are indicated by the error bars; pooled-effect estimates are reflected as a diamond. APS = atypical parkinsonian syndrome; CI = confidence interval; NfL = neurofilament light chain; PD = Parkinson disease; SMD = standardized mean difference.
In the meta-analysis, CSF NfL levels were 1.26 SD higher in patients with APS compared with patients with PD (g = 1.26, 95% CI 0.99–1.53; 12 studies; 880 patients with PD; 847 patients with APS). Regarding separate APS subgroups, CSF NfL levels were 1.60 SD higher in MSA (g = 1.60, 95% CI 1.28–1.92; 11 studies; 791 patients with PD; 395 patients with MSA), 1.87 SD higher in PSP (g = 1.87, 95% CI 1.36–2.38; 10 studies; 833 patients with PD; 242 patients with PSP), 2.09 SD higher in CBD and CBS (g = 2.09, 95% CI 1.36–2.82; 7 studies; 541 patients with PD; 94 patients with CBD and CBS), and 0.70 SD higher in DLB (g = 0.70, 95% CI 0.47–0.93; 3 studies; 228 patients with PD; 116 patients with DLB) subgroup compared with PD group. Circulating NfL levels were 1.53 SD higher in patients with APS compared with patients with PD (g = 1.53, 95% CI 1.15–1.91; 4 studies; 307 patients with PD; 197 patients with APS). Regarding separate APS subgroups, circulating NfL levels were 1.90 SD higher in MSA (g = 1.90, 95% CI 1.35–2.45; 4 studies; 307 patients with PD; 115 patients with MSA) and 1.87 SD higher in PSP (g = 1.87, 95% CI 1.07–2.66; 4 studies; 307 patients with PD, 82 patients with PSP) subgroup compared with the PD group. High and moderate heterogeneity were detected among studies comparing CSF (I2 = 81.7%, p < 0.01) and circulating NfL levels (I2 = 63.7%, p = 0.04) between APS and PD groups, respectively. There was no evidence of small-study effects in any of the 2 main analyses for patients with APS vs patients with PD (p = 0.434 for CSF NfL levels and p = 0.214 for circulating NfL levels) (eFigure 3, links.lww.com/CPJ/A304).
CSF and Circulating NfL Levels as a Biomarker for Differentiating PD From APS
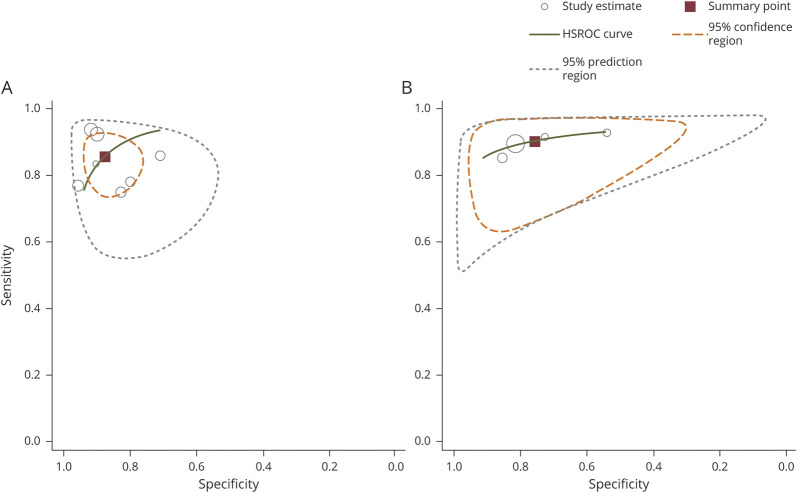
When pooling 5 studies (436 patients with PD and 409 patients with APS) performing diagnostic accuracy for CSF levels of NfL for differentiating APS from PD, the summary AUC was 0.941 (95% CI 0.916–0.965) with evidence of low heterogeneity (I2 = 0.0%, p = 0.413). In the HSROC analysis (7 studies: 501 patients with PD, 363 patients with APS patients), the average sensitivity and specificity of CSF levels were 86% (95% CI 79%–90%) and 88% (95% CI 82%–92%), respectively (Figure 3A). The mean positive and negative predictive values were 7.0 (95% CI 4.6–10.6) and 0.16 (95% CI 0.1–0.24), respectively, corresponding to a diagnostic odds ratio (OR) of 42.5 (95% CI 21.4–84.4).
Figure 3. HSROC Curves for the Discriminative Ability of (A) CSF and (B) Circulating NfL to Differentiate APS From PD.
Each study is depicted as a hollow circle; the diameter of each circle corresponds to the respective weight given to each study. CSF NfL analysis is based on 7 studies: 363 patients with APS and 501 patients with PD; circulating NfL analysis is based on 4 studies: 214 patients with APS and 307 patients with PD. APS = atypical parkinsonian syndrome; HSROC = hierarchical summary receiver operating characteristic; NfL = neurofilament light chain; PD = Parkinson disease.
For circulating NfL levels, 3 studies (285 patients with PD, 187 patients with APS) presented data about their diagnostic accuracy in discriminating APS from PD; pooled AUC was 0.874 (95% CI 0.802–0.946); there was evidence of moderate heterogeneity (I2 = 67.3%, p = 0.047). In the HSROC analysis (4 studies; 307 patients with PD, 214 patients with APS), we found an average sensitivity of 91% (95% CI 86%–95%) and an average specificity of 76% (95% CI 62–85%) (Figure 3B). With a positive predictive value of 3.8 (95% CI 2.4–6.0) and a negative predictive value of 0.12 (95% CI 0.07–0.19), the diagnostic OR was 32.3 (95% CI 16.5–63.4).
Discussion
This study demonstrates that CSF and circulating NfL levels are significantly higher in APS compared with PD, as well as in each APS subgroup compared with PD separately. In addition, CSF and circulating NfL represent potentially promising biomarkers for discriminating APS from PD.
One possible explanation for the higher NfL levels in APS compared with PD may be the more extensive and rapid neurodegeneration observed in APS.3 The degenerating myelinated axons have been hypothesized to release larger amounts of NfL compared with the degenerating nerve cell bodies5; high CSF NfL levels have been associated with pyramidal signs in PD, MSA, and PSP.29 Extensive region-specific white matter pathology also differs between PD and APS.36 Thus, the higher NfL levels in APS may reflect the more severe underlying neuronal loss and possibly the secondary more aggressive and widespread subcortical/axonal degeneration.
Given the shared clinicopathologic characteristics of PD dementia (PDD) and DLB, there is some controversy regarding the discrimination of these 2 clinical entities. Although DLB is widely accepted as an APS, PDD and DLB have been also considered to exist on a spectrum of Lewy body disease.37 For this reason, we also run a supplementary analysis between PD and APS excluding patients with DLB, which demonstrated that CSF NfL levels could also effectively discriminate PD from APS excluding DLB.
The results of the sensitivity analysis restricted to studies with at least 4 7 quality were similar to our main analysis, which further strengthens the robustness of our findings. Moreover, to eliminate interkit differences, we run a supplementary analysis showing that the year of publication does not significantly modify the SMD in NfL levels between patients with APS and PD.
Although CSF examination may accurately reflect the degree of ongoing neurodegeneration, blood sample collection is less invasive and time-consuming than lumbar puncture, allowing for the broader clinical application of NfL assessment. However, the presence of numerous proteins in the blood technically increases the complexity of their measurement.
Available evidence on the role of circulating NfL levels in distinguishing PD from APS is still limited because the sample sized of the studies are relatively small. Only 1 study has measured circulating NfL levels in patients with CBD, whereas the levels of circulating NfL in patients with DLB have not been investigated yet. Therefore, larger studies including these APS subgroups are also needed.
Optimal cutoff points for diagnosis vary considerably among the abovementioned studies. Different commercial assay methods used for NfL detection (commercial ELISA vs electrochemiluminescence-based method vs single-molecular array),38 lot-to-lot variation in assay performance, matrix effects (serum vs plasma),9 and intrinsic differences in age, disease duration, and severity among the study participants may contribute to this observed variability.39 Since NfL levels have been correlated with age in patients with PD,9 age-related stratifications of cutoff points of NfL levels should be considered in future studies and established before the use of NfL levels in daily routine.39
Currently, PD diagnosis is primarily clinical, whereas neuropathologic confirmation remains the gold standard diagnostic method. In the study by Magdalinou tl., patients with APS with pathologically validated diagnoses had significantly higher NfL levels in CSF compared with those with only clinical diagnoses.12 Although the number of pathologically confirmed APS cases was small (3 MSA, 2 CBD, 6 PSP), these data further support the significance of NfLs because NfLs are liable biomarker reflecting the underlying neuropathology.
Given the overlapping CIs of SMDs and AUCs of the discriminative ability of NfL in the blood and CSF, it could be indirectly stated that the discriminatory potential of CSF NfL levels may rather not be superior to that measured in the blood; however, a direct comparison between the 2 methods cannot be made because different studies were used for these separate analyses.
Despite the high correlation between CSF and blood NfL levels in individual studies, sensitivity and specificity values are quite different between studies. These differences introduce uncertainty in the pooled estimates especially from such a small set of studies, whereas the HSROC curves for CSF vs circulating NfLs are hardly comparable. The different assay methods used may also potentially contribute to the varying cutoff points of CSF, further limiting the comparability of NfLs in these different body fluids.
Our analysis shows that both CSF and circulating NfL levels represent a promising biomarker able to discriminate PD from APS with high accuracy. In addition to updating the analysis of differences in CSF NfL levels between patients with PD and APS with newer studies, our review contributes beyond previously published meta-analyses in several ways.3,14–16 First, additional studies allowed us to provide evidence for differences in circulating NfL levels on top of CSF levels between patients with PD and APS. Furthermore, we performed a meta-analysis of ROC curves, providing further data for the diagnostic accuracy and discriminatory effects of CSF and circulating NfL levels in differentiating PD from APS. As such, our meta-analysis offers novel insights regarding the use of CSF and circulating NfL over and beyond previous literature. Although a previous smaller meta-analysis (341 patients with PD and 396 patients with APS [PSP, MSA, CBD] vs 1,035 patients with PD and 930 patients with APS [PSP, MSA, CBD, DLB] in the current meta-analysis) had already shown a good discriminatory performance of CSF NfL,39 we highlight the high diagnostic accuracy of NfL for the discrimination of all APS subtypes—including DLB—from PD in the CSF, as well as additionally demonstrate the promising diagnostic utility of CSF and blood NFL levels. Although elevated NFLs are not specific for APS, their measurement may help in the differential diagnosis of atypical cases along with structural and functional neuroimaging.
This meta-analysis has several limitations. The databases searched were MEDLINE and Scopus. However, having extensively searched the reference list minimizes the probability that any eligible study could have been missed. All included studies were conducted only in countries located in Europe or in the United States. Despite the standardized values in our meta-analysis, the different assay methods may partially contribute to high heterogeneity of CSF NfL levels. In addition, there were only 4 studies investigating circulating NfL levels, which could affect the statistical power of this analysis. Hence, these results should be handled with caution.
Despite the acceptable quality of included studies, some limitations should be noticed. First, experimental protocols were incompatible regarding the type of assays used. Importantly, whether the reference standard and index test were blinded was dubious. Second, although PD and APS diagnosis was made by movement disorder specialists, postmortem neuropathologic confirmation was reported in 3 for very few participants,9,12,35 resulting in possible misclassification and subsequent underestimation of the results. Third, potential selection bias should be considered because patients with atypical symptoms or at younger age are more likely to be subjected to lumbar puncture. Fourth, APS subgroups included small sample,2,13,33 missing potential significant associations. Fifth, the retrospective design of the included studies.6,30,33 In addition, because higher NfL levels have been associated with PDD in PD, further studies including PD and PDD may be useful.7 Furthermore, because several studies have excluded patients with other neurologic disorders, specificity issues are raised for NfL as a discriminating biomarker between APS and PD with neurologic comorbidities. Low serum NfLs were not detected by home-made ELISAs, but with the novel commercial ELISA (Simoa) in 3 studies.9,13,30 In addition, circulating NfL levels in patients with DLB have not been investigated yet. Given the heterogeneous spectrum of CBS pathologies (CBD, PSP, AD among others),40 the discrimination between these 2 conditions may reduce misclassification bias. Future studies should present mean/SD values of plasma NfLs, sensitivity/specificity/ROC analysis, cutoff values, and ideally histopathologic examination.
Conclusions
This meta-analysis suggests that CSF and circulating NfL levels represent promising biomarkers for the discrimination between PD from APS. However, studies on circulating NfL levels including patients with CBD and DLB are needed before their use in clinical practice. In addition, the combination of clinical, neuroimaging, and biochemical biomarkers including NfL in the differential diagnosis of parkinsonian syndromes may be proven a more appropriate diagnostic approach compared with each method separately, and this hypothesis should be further explored.
Appendix. Authors

Study Funding
No targeted funding reported.
Disclosure
The authors report no disclosures relevant to the manuscript. Full disclosure form information provided by the authors is available with the full text of this article at Neurology.org/cp.
References
- 1.Levin J, Kurz A, Arzberger T, Giese A, Hoglinger GU. The differential diagnosis and treatment of atypical parkinsonism. Dtsch Arztebl Int. 2016;113(5):61-69. [DOI] [PMC free article] [PubMed] [Google Scholar]
- 2.Hall S, Janelidze S, Surova Y, Widner H, Zetterberg H, Hansson O. Cerebrospinal fluid concentrations of inflammatory markers in Parkinson's disease and atypical parkinsonian disorders. Sci Rep. 2018;8(1):13276. [DOI] [PMC free article] [PubMed] [Google Scholar]
- 3.Wang SY, Chen W, Xu W, et al. Neurofilament light chain in cerebrospinal fluid and blood as a biomarker for neurodegenerative diseases: a systematic review and meta-analysis. J Alzheimers Dis. 2019;72(4):1353-1361. [DOI] [PubMed] [Google Scholar]
- 4.Gaetani L, Blennow K, Calabresi P, Di Filippo M, Parnetti L, Zetterberg H. Neurofilament light chain as a biomarker in neurological disorders. J Neurol Neurosurg Psychiatry. 2019;90(8):870-881. [DOI] [PubMed] [Google Scholar]
- 5.Rosengren LE, Karlsson JE, Sjogren M, Blennow K, Wallin A. Neurofilament protein levels in CSF are increased in dementia. Neurology. 1999;52(5):1090-1093. [DOI] [PubMed] [Google Scholar]
- 6.Abdo WF, Bloem BR, Van Geel WJ, Esselink RA, Verbeek MM. CSF neurofilament light chain and tau differentiate multiple system atrophy from Parkinson's disease. Neurobiol Aging. 2007;28(5):742-747. [DOI] [PubMed] [Google Scholar]
- 7.Backstrom DC, Eriksson Domellof M, Linder J, et al. Cerebrospinal fluid patterns and the risk of future dementia in early, incident Parkinson disease. JAMA Neurol. 2015;72(10):1175-1182. [DOI] [PubMed] [Google Scholar]
- 8.Constantinescu R, Rosengren L, Johnels B, Zetterberg H, Holmberg B. Consecutive analyses of cerebrospinal fluid axonal and glial markers in Parkinson's disease and atypical Parkinsonian disorders. Parkinsonism Relat Disord. 2010;16(2):142-145. [DOI] [PubMed] [Google Scholar]
- 9.Hansson O, Janelidze S, Hall S, et al. Blood-based NfL: a biomarker for differential diagnosis of parkinsonian disorder. Neurology. 2017;88(10):930-937. [DOI] [PMC free article] [PubMed] [Google Scholar]
- 10.Herbert MK, Aerts MB, Beenes M, et al. CSF neurofilament light chain but not FLT3 ligand discriminates parkinsonian disorders. Front Neurol. 2015;6:91. [DOI] [PMC free article] [PubMed] [Google Scholar]
- 11.Holmberg B, Johnels B, Ingvarsson P, Eriksson B, Rosengren L. CSF-neurofilament and levodopa tests combined with discriminant analysis may contribute to the differential diagnosis of Parkinsonian syndromes. Parkinsonism Relat Disord. 2001;8(1):23-31. [DOI] [PubMed] [Google Scholar]
- 12.Magdalinou NK, Paterson RW, Schott JM, et al. A panel of nine cerebrospinal fluid biomarkers may identify patients with atypical parkinsonian syndromes. J Neurol Neurosurg Psychiatry. 2015;86(11):1240-1247. [DOI] [PMC free article] [PubMed] [Google Scholar]
- 13.Marques TM, van Rumund A, Oeckl P, et al. Serum NFL discriminates Parkinson disease from atypical parkinsonisms. Neurology. 2019;92(13):e1479-e1486. [DOI] [PubMed] [Google Scholar]
- 14.Bridel C, van Wieringen WN, Zetterberg H, et al. Diagnostic value of cerebrospinal fluid neurofilament light protein in neurology: a systematic review and meta-analysis. JAMA Neurol. 2019;76(9):1035-1048. [DOI] [PMC free article] [PubMed] [Google Scholar]
- 15.Cong S, Xiang C, Wang H, Cong S. Diagnostic utility of fluid biomarkers in multiple system atrophy: a systematic review and meta-analysis. J Neurol. Epub 2020 Mar 11. [DOI] [PubMed]
- 16.Sako W, Murakami N, Izumi Y, Kaji R. Neurofilament light chain level in cerebrospinal fluid can differentiate Parkinson's disease from atypical parkinsonism: evidence from a meta-analysis. J Neurol Sci. 2015;352(1-2):84-87. [DOI] [PubMed] [Google Scholar]
- 17.Gilman S, Wenning GK, Low PA, et al. Second consensus statement on the diagnosis of multiple system atrophy. Neurology. 2008;71(9):670-676. [DOI] [PMC free article] [PubMed] [Google Scholar]
- 18.Litvan I, Agid Y, Calne D, et al. Clinical research criteria for the diagnosis of progressive supranuclear palsy (Steele-Richardson-Olszewski syndrome): report of the NINDS-SPSP international workshop. Neurology. 1996;47(1):1-9. [DOI] [PubMed] [Google Scholar]
- 19.Marsili L, Rizzo G, Colosimo C. Diagnostic criteria for Parkinson's disease: from James Parkinson to the concept of prodromal disease. Front Neurol. 2018;9:156. [DOI] [PMC free article] [PubMed] [Google Scholar]
- 20.Litvan I, Bhatia KP, Burn DJ, et al. Movement Disorders Society Scientific Issues Committee report: SIC Task Force appraisal of clinical diagnostic criteria for parkinsonian disorders. Mov Disord. 2003;18(5):467-486. [DOI] [PubMed] [Google Scholar]
- 21.McKeith IG, Dickson DW, Lowe J, et al. Diagnosis and management of dementia with Lewy bodies: third report of the DLB Consortium. Neurology. 2005;65(12):1863-1872. [DOI] [PubMed] [Google Scholar]
- 22.Gelb DJ, Oliver E, Gilman S. Diagnostic criteria for Parkinson disease. Arch Neurol. 1999;56(1):33-39. [DOI] [PubMed] [Google Scholar]
- 23.Whiting PF, Rutjes AW, Westwood ME, et al. QUADAS-2: a revised tool for the quality assessment of diagnostic accuracy studies. Ann Intern Med. 2011;155(8):529-536. [DOI] [PubMed] [Google Scholar]
- 24.Wan X, Wang W, Liu J, Tong T. Estimating the sample mean and standard deviation from the sample size, median, range and/or interquartile range. BMC Med Res Methodol. 2014;14:135. [DOI] [PMC free article] [PubMed] [Google Scholar]
- 25.Hozo SP, Djulbegovic B, Hozo I. Estimating the mean and variance from the median, range, and the size of a sample. BMC Med Res Methodol. 2005;5:13. [DOI] [PMC free article] [PubMed] [Google Scholar]
- 26.DerSimonian R, Laird N. Meta-analysis in clinical trials. Control Clin Trials. 1986;7(3):177-188. [DOI] [PubMed] [Google Scholar]
- 27.Higgins JP, Thompson SG, Deeks JJ, Altman DG. Measuring inconsistency in meta-analyses. BMJ. 2003;327(7414):557-560. [DOI] [PMC free article] [PubMed] [Google Scholar]
- 28.Egger M, Davey Smith G, Schneider M, Minder C. Bias in meta-analysis detected by a simple, graphical test. BMJ. 1997;315(7109):629-634. [DOI] [PMC free article] [PubMed] [Google Scholar]
- 29.Holmberg B, Rosengren L, Karlsson JE, Johnels B. Increased cerebrospinal fluid levels of neurofilament protein in progressive supranuclear palsy and multiple-system atrophy compared with Parkinson's disease. Mov Disord. 1998;13(1):70-77. [DOI] [PubMed] [Google Scholar]
- 30.Mangesius S, Mariotto S, Ferrari S, et al. Novel decision algorithm to discriminate parkinsonism with combined blood and imaging biomarkers. Parkinsonism Relat Disord. 2020;77:57-63. [DOI] [PubMed] [Google Scholar]
- 31.Singer W, Schmeichel AM, Shahnawaz M, et al. Alpha-synuclein oligomers and neurofilament light chain in spinal fluid differentiate multiple system atrophy from Lewy body synucleinopathies. Ann Neurol. 2020;88(3):503-512. [DOI] [PMC free article] [PubMed] [Google Scholar]
- 32.Archer DB, Mitchell T, Burciu RG, et al. Magnetic resonance imaging and neurofilament light in the differentiation of parkinsonism. Mov Disord. 2020;35(8):1388-1395. [DOI] [PMC free article] [PubMed] [Google Scholar]
- 33.Constantinescu R, Rosengren L, Eriksson B, Blennow K, Axelsson M. Cerebrospinal fluid neurofilament light and tau protein as mortality biomarkers in parkinsonism. Acta Neurol Scand. 2019;140(2):147-156. [DOI] [PubMed] [Google Scholar]
- 34.Olsson B, Portelius E, Cullen NC, et al. Association of cerebrospinal fluid neurofilament light protein levels with cognition in patients with dementia, motor neuron disease, and movement disorders. JAMA Neurology. 2019;76(3):318-325. [DOI] [PMC free article] [PubMed] [Google Scholar]
- 35.Hall S, Ohrfelt A, Constantinescu R, et al. Accuracy of a panel of 5 cerebrospinal fluid biomarkers in the differential diagnosis of patients with dementia and/or parkinsonian disorders. Arch Neurol. 2012;69(11):1445-1452. [DOI] [PubMed] [Google Scholar]
- 36.Tsukamoto K, Matsusue E, Kanasaki Y, et al. Significance of apparent diffusion coefficient measurement for the differential diagnosis of multiple system atrophy, progressive supranuclear palsy, and Parkinson's disease: evaluation by 3.0-T MR imaging. Neuroradiology. 2012;54(9):947-955. [DOI] [PubMed] [Google Scholar]
- 37.Gomperts SN. Lewy body dementias: dementia with Lewy bodies and Parkinson disease dementia. Continuum (Minneap Minn). 2016;22(2 Dementia):435-463. [DOI] [PMC free article] [PubMed] [Google Scholar]
- 38.Kuhle J, Barro C, Andreasson U, et al. Comparison of three analytical platforms for quantification of the neurofilament light chain in blood samples: ELISA, electrochemiluminescence immunoassay and Simoa. Clin Chem Lab Med. 2016;54(10):1655-1661. [DOI] [PubMed] [Google Scholar]
- 39.Ge F, Ding J, Liu Y, Lin H, Chang T. Cerebrospinal fluid NFL in the differential diagnosis of parkinsonian disorders: a meta-analysis. Neurosci Lett. 2018;685:35-41. [DOI] [PubMed] [Google Scholar]
- 40.Parmera JB, Rodriguez RD, Studart Neto A, Nitrini R, Brucki SMD. Corticobasal syndrome: a diagnostic conundrum. Demen Neuropsychol. 2016;10(4):267-275. [DOI] [PMC free article] [PubMed] [Google Scholar]
Associated Data
This section collects any data citations, data availability statements, or supplementary materials included in this article.
Data Availability Statement
Anonymized data not published within this article will be made available by request from any qualified investigator.


