

Abstract
Acoustic cavitation (or the formation of bubbles using acoustic or ultrasound-based devices) has been extensively exploited for biological applications in the form of bioprocessing and drug delivery/uptake. However, the governing parameters behind the several physical effects induced by cavitation are generally lacking in quantity in terms of suitable operating parameters of ultrasonic units. This review elaborates the current gaps in this realm and summarizes suitable investigative tools to explore the shear generated during cavitation. The underlying physics behind these events are also discussed. Furthermore, current advances of acoustic shear on biological specimens as well as future prospects of this cavitation-induced shear are also described.
Keywords: Microstreaming, Acoustics, Shear
Introduction
Acoustic cavitation takes place when liquid is irradiated with ultrasound (frequency > 20 kHz) of sufficient intensity to enable the growth of pre-existing gas nuclei into bubbles that oscillate and subsequently collapse (Leighton 2012). The resulting features of the adjacent flow field have been discussed in terms of micro-mixing in food/dairy industries (Krasulya et al. 2016; Chávez-Martínez et al. 2020), cell/tissue permeabilization in biomedicine/biotechnology (Coussios and Roy 2008), and nanotechnology (Anandan and Ashokkumar 2014) among others.
Cavitation bubbles (name derived from the Latin word cavus meaning void) are often accompanied by the formation of several physical and chemical effects. These include high-pressure bubble collapses (Obreschkow et al. 2013), powerful shockwaves (Pecha and Gompf 2000), high-speed concentrated liquid jets (Chen and Lin 2008), and even nanosecond flashes of light bearing intense temperatures (Young 2004). Some of these can occur periodically, during the bubble lifetime. It is these physical and chemical effects (Kentish and Ashokkumar 2011) which ultimately form the backbone of multiple novel manufacturing processes (Manickam and Ashokkumar 2014). Bubble-induced physical effects help concentrate mechanical energy on small areas, stimulating shear forces leading to material erosion (Franc and Michel 2006). Each of the aforementioned cavitation-based phenomena depend on some distinct group of parameters. These parameters are indirectly related to the input configurations of the ultrasonic units, i.e. sonoreactors. Understanding their physics would ensure better control of the outcome.
Both experimentally and numerically, it is cumbersome to investigate the numerous phenomena triggered by several acoustic bubbles. Notwithstanding these hurdles, chemical effects have been well understood due to several studies related to sonochemistry (Brotchie et al. 2009; Bhangu and Ashokkumar 2016). However, understanding physical effects and predicting the respective shear forces have been a challenge due to lack of controlled experiments and suitable computational models.
The aim of this review is to present the current state of knowledge related to acoustic cavitation-induced shear. This is done by reviewing existing literature on the erosive potential of (i) shockwaves due to bubble collapse, (ii) microjets occurring due to asymmetric collapse, and (iii) fluid streaming—three behaviours that are all possible in sonoreactors. The typical investigative tools for this purpose are also summarized. In addition, the recent advances and future applications are enumerated. In this process, the challenge(s) with practical implementation is further clarified.
Bubble lifetime—an overview
In order to understand acoustic cavitation, it is necessary to know its origin and the events occurring during the bubble lifetime. Figure 1 illustrates the general lifetime of a bubble over several oscillation cycles. It starts from its nucleation as it expands gradually to a maximum radius, Rmax, during its growth stage and then retracts back to its original size during its collapse stage (Leighton 2012). These growth and collapse stages together constitute the oscillation time, Tosc, of the same bubble. For acoustically generated bubbles, the latter is generally subjected to a continuous sound wave, thereby facilitating this growth and collapse to continue over several cycles till the bubble disintegrates completely to daughter bubbles. Here, Tosc becomes equivalent to the time period of the applied sound wave, which generally sees the bubble grow in size with each subsequent cycle.
Fig. 1.
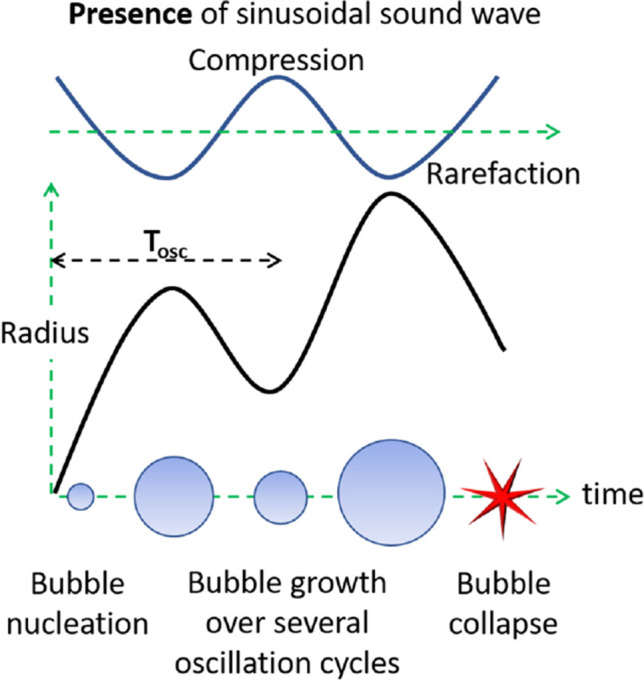
Bubble lifetime: nucleation, growth and collapse
Bubbles can be created by various means or sources of energy, e.g. acoustic, hydrodynamic, spark/laser or even by a sparger (see Fig. 2) (Podbevšek et al. 2021). This energy might be in the form of heat caused by laser or an electric spark that provides the latent heat for vaporization within a certain region of liquid volume. The nucleated bubble would have a corresponding Rmax and Tosc.. Likewise, for the case of an acoustic bubble, the bubble is generated by tensile forces provided by rarefaction regions of the sound wave. Again, bubbles can be introduced by injecting gas into liquid using a sparger. Hydrodynamic cavitation makes use of a venturi device to generate bubbles due to reduction in pressure in the downstream flow. Among these methods of bubble nucleation, acoustic bubbles form our topic of interest. It is worthwhile to note that this mode of cavitation is unlike other modes of bubble inception. This is because acoustic cavitation can have sustained stable oscillation of bubble unlike transient oscillation for hydrodynamic cavitation or even one/few oscillation cycles for laser-generated bubble. Hence, the oscillatory effect of acoustic bubbles is more pronounced. It is also interesting to note that cavitation can be homogeneous; i.e. bubble content and solvent have largely the same species (laser/spark-induced in pure liquid) or heterogeneous, i.e. bubble content and solvent molecules are different (via sparger/acoustic devices) (Brennen 2013).
Fig. 2.

Flowchart enumerating different modes of nucleation, growth, and collapse. The highlighted physical effects are discussed in subsequent sections with temporal, spatial and intensity scales
Based on the amplitude of the supporting sound wave, oscillations can be linear (same degree of expansion and contraction of bubble at very low transmit energy of insonication), non-linear (at higher amplitude of insonication, expansion exceeds compression), and stable (bubbles oscillate at a resonance size over several cycles) (Albrecht and Hohmann 2004; Young 2004). These oscillations interact with and affect the immediately adjacent liquid field. As the bubble resumes oscillation, it buffets the ambient liquid causing an agitating motion around it. This also causes a fluctuation of velocity and pressure, leading to a steady streaming motion (Tho et al. 2007). The consequent features when limited to the boundary layer around the bubble are termed as microstreaming and should not be confused with acoustic streaming which is defined as the liquid agitation caused by ultrasound in the bulk solvent (Lighthill 1978).
After the bubbles reach a critical size, they collapse violently. During this collapse stage, the gases inside the bubble are adiabatically compressed to very small volumes over a very short time span. As a result, the inside gases heat up to very high temperatures and pressures. The associated energy can easily dissociate molecules—thereby leading to chemical reactions inside the bubble and on the bubble/solution interface as well as in the bulk liquid, collectively referred to as sonochemistry (Bhangu and Ashokkumar 2016). The nanosecond flash of light accompanied by this process due to conversion of kinetic and potential energy is called sonoluminescence (Young 2004). Simultaneously, the high-pressure collapse generates an instantaneous shockwave into the liquid (Young 2004). Conversely, if the bubble is brought near a surface (free, solid, etc.), asymmetric collapse takes place with the development of a fast liquid jet (Franc and Michel 2006). These are highly potent for material damage and are instrumental for acoustic cavitation-induced shear. Hence, these are individually discussed in subsequent sections.
At the end of the collapse stage, the bubble may either display rebound (re-growth of bubble and continuation of oscillation cycle) or disintegrate into several bubbles.
Applications employing acoustic cavitation
As elucidated in the previous section, acoustic cavitation can offer conditions of nucleation, oscillation and collapse, which can be sustained over several cycles. Figure 3 summarizes the typical magnitudes of these cavitation-induced effects.
Fig. 3.

Overview of applications (in orange) employing acoustic bubbles with typical magnitudes (blue) and the associated effect (green). Inset shows schematic of acoustic shear with more detailed characteristics
Despite having a very small volume (~ mm3), bubble collapse pressures can measure few tens of gigapascal (Obreschkow et al. 2013). This can result in powerful shockwaves through the surrounding liquid with shock velocities as high as 4000 m/s (Pecha and Gompf 2000). Concentrated liquid jets from asymmetric bubble collapse also bear high speeds (~ 100 m/s) (Chen and Lin 2008). Furthermore, the nanosecond flashes of light at the end of bubble collapse can create local temperatures as high as 10,000 K (Young 2004).
These unique features of acoustic bubble formation are central to its use in different applications. For instance, gene/drug transfection depends on powerful micro-jetting (Han et al. 2015), sonochemical reactions would rely on intense bubble collapse (Mondal et al. 2021), transport of species can be enhanced via microstreaming (Tho et al. 2007), etc. Some of these applications are illustrated in Fig. 3. Additionally, the inset in Fig. 3 describes the strong bubble-induced shear forces that are capable of damage. This damage might be in the form of reparable cell sonoporation (Sankin et al. 2010) or even cell/tissue damage (Yatipanthalawa et al. 2021) due to micro-jetting and bubble-collapse. Even streaming can permeabilize tissues (Cleve et al. 2019). In fact, ultrasonic cleaning (fruits/vegetables/jewellery/electronic chips) and emulsification of phases (food and dairy industries) etc. very much exploit the shear and turbulence generated by cavitation bubbles.
It is hence clear from the discussion above that most of these applications utilize acoustic cavitation-induced shear for their operation. In order to precisely control each of these applications, there is a need to understand the physics behind each of these individual effects.
Cavitation-induced physical effects
Mason et al. (2011) found evidence of strong erosion caused by acoustic bubbles at lower ranges of ultrasound (< 100 kHz) frequency, which decreased steadily with higher values (~ MHz). Schematic trends like that shown in Fig. 4 helped to understand how physical effects change with input parameters such as frequency without any additional quantification. The horizontal scale in Fig. 4 indicates the major part of the power ultrasound regime (i.e. from 40 kHz to 1 MHz) useful for acoustic cavitation. It is however to be noted that the wear induced by acoustic cavitation can be a combination of one or more of these effects (collapse shockwave, micro-jetting or streaming). But which effect dominates and under what conditions are largely unclear. Hence, these are individually examined in the following subsections.
Fig. 4.

Frequency dependence of physical effects of acoustic cavitation (McKenzie et al. 2019)
Collapse shockwaves
As mentioned earlier, bubble collapse creates shockwaves. When the pressure difference between the inside and outside of a bubble is significantly large, it forces the bubble wall to expand radially outwards very quickly, pushing the adjacent fluid. Consequently, an evolving shock wave front develops. Patella and Reboud (1998) experimentally and numerically tested the effect of cavity collapse on a number of materials and inferred that high-pressure wave emission was largely responsible for causing material damage (Sarkar et al. 2021). The radiated pressure wave can take up to 50% of the kinetic energy generated from the bubble collapse (Pecha and Gompf 2000). The intensity of this shock has been measured directly using Mie scattering and hydrophone methods or indirectly inferred through measurement of collapse intensity (Young 2004).
Figure 5 shows the bubble collapse temperatures (T) obtained numerically for different operating frequencies and power of the ultrasonic unit. It shows collapse temperatures higher than 10,000 K (Kanthale et al. 2008) on sonicating water, which are largely overestimations when compared to experimental measurements under the same conditions.
| 1 |
Fig. 5.
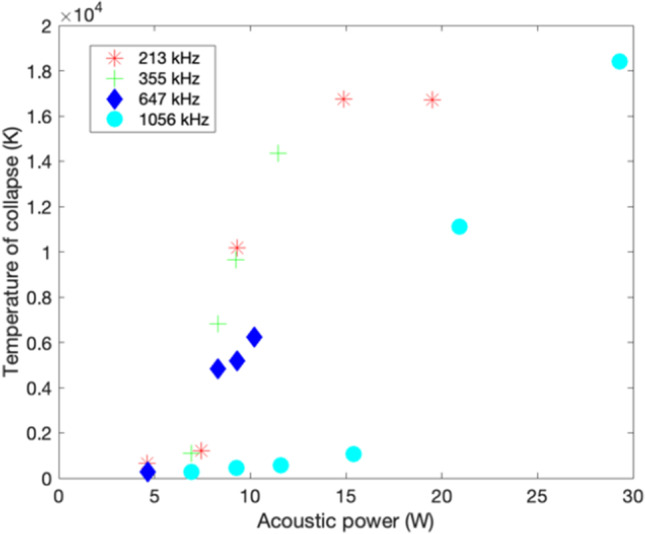
Effect of power and frequency on the collapse temperature for sonicated water obtained through numerical calculations (Kanthale et al. 2008)
By assuming the adiabatic compression of the bubble, collapse pressures (P) can be roughly estimated using Eq. 1, n being the adiabatic index (for an air bubble, n = 1.4). The collapse temperature and pressure for a bubble oscillating at a frequency of 23.5 kHz and input driving pressure of 1.2–1.5 bar are roughly around 104 K and 10 GPa, respectively (Young 2004). Matula et al. (1998) measured a pulse rise time of 5.2 ns and pressure amplitude of 1.7 bar using a hydrophone, placed 1 mm from the bubble. In fact, values of shockwave velocities are measured in the range of 950–2000 m/s. The higher this value, the more likely the resulting damage.
Microjets
It is already mentioned that micron-sized jets develop due to asymmetric bubble collapse (Fig. 6). This collapse is generally triggered by the presence of a foreign body, as briefly indicated in Fig. 2. The body may be a free surface, a solid surface (inset Fig. 6(a)) or even another bubble. The strength of this jet, measured by its velocity and shape, is largely dependent on a number of factors. Primarily, with increasing acoustic power of the ultrasonic unit, the jet velocity onto a wall was also found to increase as shown in Fig. 6(a).
Fig. 6.

(a) Effect of ultrasonic power on microjet velocities. Inset shows asymmetric collapse of bubble on a wall, subjected to ultrasound (Wu et al. 2019); (b) phase plot showing different regimes of micro-jetting for , side schematic illustrates jet-towards (Fong et al. 2009); (c) schematic of twin bubble-pair near solid wall where bubble 2 is incepted first, allowed to grow and after time-delay, bubble 1 is created. 1 and 2 are used to name bubbles based on their ascending normal distance from the wall
Likewise, jet velocity also relies on the surface geometry (Tomita et al. 2002) and its stiffness, i.e. whether the surface is rigid/soft/gelatinous (Hopfes et al. 2019). In fact, as a bubble moves closer to the wall, the shockwave energy reduces, and the jet hammer caused by asymmetric bubble collapse dominates (Supponen et al. 2017). Hence, the distance of the bubble from the wall is one of the predominant factors governing wear caused by bubble-induced microjets (Lechner et al. 2019, 2020).
| 2 |
Here, refers to the normal distance of the bubble centre from the wall. is the maximum bubble radius. is largely used for bubble interaction with a solid surface. When the other surface is another bubble, bubble-pair interaction takes place (Fong et al. 2009; Chew et al. 2011; Han et al. 2015).
| 3 |
| 4 |
| 5 |
As shown in Fig. 6(c), the symbol refers to the centre-to-centre distance between 2 bubbles of a bubble pair, while is the time interval between their creation. is the time of oscillation of the bubble. indicates the size ratio between smaller () and larger () bubbles. For simple cases, when similar-sized bubbles are used, equals 1.
Based on these above dimensionless parameters (Eqs. 2–5), the development of different types of directional jets can be defined along the centre line joining a bubble pair (Fong et al. 2009; Chew et al. 2011). Figure 6(b) illustrates 3 different types of liquid jets occurring for such a tandem bubble pair, based on the inter-bubble distance and time delay of inception. These include jetting towards (shown in inset in Fig. 6(b)), jetting away and catapult jetting (bubble shapes resemble a catapult during jet development). The parameters are also explained schematically in Fig. 6(c). For complex cases when , and are chosen based on one of the reference bubbles.
It is interesting to note that bubble-induced microjet velocities () can go up to 100 m/s. Such values often exceed the material threshold velocities (velocities above which pitting can occur on the surface). For instance, the threshold velocity of water on Cu at 300 K is 50 m/s. Another analysis is obtained from the water hammer (Sankin et al. 2010) effect used to explain cell sonoporation via micro-jetting. Typical magnitudes from jet impact of cavities can foster a 200-MPa impact pressure over 0.05–0.5-ns duration (Preece and Brunton 1980). Equation 6 shows the dependence of water-hammer pressures () on the density () and sound velocity () of the liquid, through which the jet traverses.
| 6 |
Based on the pitting caused (when impact pressures exceed surface yield stress), the corresponding stress can also be calculated. Likewise, the wall shear stress can also be calculated using a calibrated flush-mounted sensor placed on the wall to record the shear stress post jet impact (Dijkink and Ohl 2008).
It is interesting to note that most of these single bubble–induced jets are made using a laser or by spark generation as it is very experimentally cumbersome to control acoustic bubble interaction with another surface.
Streaming
As mentioned earlier, streaming or more specifically microstreaming constitutes fluctuations in velocity and pressure amplitudes (Collis et al. 2010) caused by the oscillating bubble wall. As a result, primary and secondary flow vortices can also occur. During acoustic cavitation, where a bubble is subjected to ultrasound, soundwaves are reflected from all directions, thereby distorting the shape of the bubble. This is known as shape-mode oscillation (Poulichet et al. 2017).
Elder (1959) categorized streaming into a few stable regimes based on a parameter space of streaming velocity () and kinematic viscosity (), depending on the sound amplitude. He observed some flow patterns in low-viscosity liquids, e.g. pure water ( = 0.01 cm2/s). Figure 7(a) illustrates typical streaming patterns around a bubble attached to a solid boundary. Initially, the bubble registers volumetric oscillation ( = 11 cm/s), with the overall shape remaining spherical. But beyond a certain pressure amplitude, shape oscillations (non-uniform dilation of the bubble wall (Poulichet et al. 2017)) appear and increases significantly with little change in driving pressure amplitude. In fact, Elder (1959) found that the addition of a surfactant creates a no-slip boundary condition around the bubble. This boundary layer was eventually broken up by bubble pulsations and flow directions also reverse significantly. Kolb and Nyborg (1956) performed experiments on anchored bubbles to explore the adjacent flow field.
Fig. 7.

(a) Effect of driving pressure amplitude on an ambient flow-field around an air bubble attached to a solid boundary in water (kinematic viscosity, .01 cm2/s); the incident sound pressure was varied from 4.4 mbar to mbar; (b) schematic of flow-around free bubble with change in driving pressure amplitude. Used with permission from Elder (1959) and Wu and Du (1997)
Jalal and Leong (2018) described a parameter space where streaming motion is classified according to the Reynolds number, Re, and the composite parameter ε (defined in Eqs. 7 and 8). Below, is the diameter of the spherical bubble, is the kinematic viscosity, is the velocity amplitude, and is the frequency. refers to Stanton number which is defined as Eq. 9.
| 7 |
| 8 |
| 9 |
Furthermore, analytical studies have led to interesting conclusions about how the presence of a solid wall enhances streaming velocity (Nyborg 1958). Wu and Du (1997) developed a theory to predict the streaming velocity inside and outside a bubble subjected to an ultrasound field in an infinite liquid. In fact, Eq. 10 describes the streaming, more precisely the first-order tangential velocity outside a single bubble () in the absence of a solid boundary (Fig. 7(b)).
| 10 |
Here, r and q are part of the spherical coordinates with the origin at the centre of the bubble. is the velocity amplitude of the incident wave; , the angular frequency; ρ, the density; , the shear viscosity; and du = , the viscous penetration depth (thickness of the viscous boundary layer) in the liquid. The tilde sign refers to the same quantities but for gases inside the bubble with R0 referring to the equilibrium radius of the bubble. Doinikov and Bouakaz (2010) further modified these calculations to accommodate all sizes of the bubble with respect to sound, viscous and thermal wavelengths and deduced the radial and tangential stresses generated by acoustic streaming for a range of frequencies with specific R0 and acoustic pressure amplitude. In fact, 2 predominant modes of bubble oscillation are observed. These are described as monopole and dipole (Fig. 7(b)).
Tho et al. (2007) and Collis et al. (2010) observed some flow patterns through streak photography imaging. Figure 8 shows how the patterns change with little change in operating frequency. However, these provide limited information on the flow-field surrounding free levitated bubbles, which are commonly used. In fact, whether the same features will appear for free bubbles under the same operating conditions is also unsure. Leong et al. (2011) have reported that streaming can help augment mass transfer across the bubble interface, a function that has been largely beneficial for micro-mixing in chemical and process industries. In such applications, freely moving bubbles are widely used. Hence, closer investigation of microstreaming around levitated bubbles could be beneficial.
Fig. 8.

Different microstreaming flow-patterns for single bubble with change in frequency for fixed input power, 30 Vpp. Arrows indicate flow-direction. Used with permission from (Collis et al. 2010)
Investigative tools
Experimental
Bubble-related experimental investigations have looked at certain aspects of this cavitation phenomena. These aspects include measurement of cavitation efficiency (i.e. the intensity of bubble collapse) of the bubble system or mapping the flow structures induced by the bubble in its surroundings. As mentioned earlier, controlled physical experiments are by and large difficult due to the spatial and temporal scales of the bubble-related event. Despite this, there remains a large number of experimental methods which help investigate such related phenomena. Some of these are summarized in Table 1.
Table 1.
Experimental methods for investigating bubble-induced phenomena
| Method | Major features | Merits | Demerits | References |
|---|---|---|---|---|
| Holography | Uses light source (laser), mirrors and photographic plate | Records an interference pattern using diffraction to provide even 3D imagery | Generally costly and offers low resolution; not suitable for very fast phenomena | (Withrington 1970; Shao and Hong 2019) |
| Schlieren photography | Light from single collimated source is impinged on a target object and spatial variation of intensity is captured using shadowgraph system | Variation in refractive index caused by density gradients in the fluid distorts the collimated light beam; simple | Sensitive to non-uniformity in background lighting; limited depth of field (DoF) | (Kim et al. 2020) |
| Laser Doppler velocimetry (LDV) | Uses the Doppler shift in laser beam to measure the velocity in transparent/semi-transparent fluid | Flow unaffected as equipment is outside; pre-calibration not needed generally | LDV sensors are range dependen | (Durst et al. 1986; So et al. 2002) |
| Particle image velocimetry (PIV) | Images the flow field using high-speed camera and by tracking tracer particles illuminated by laser | Good resolution and DoF; convenient for us | Equipment is costly | (Liu et al. 2005; Adrian et al. 2011) |
| Sonochemiluminescence (SCL) | Identifies the cavitation-active regions in flow by measuring the intensity borne by cavitation-induced chemical reaction | Quick, dynamic measurement; simple and cost-effective | Lacks absolute quantification | (Sutkar and Gogate 2009) |
| Polymer degradation | Cavitation activity is measured by measuring the change in mol wt. of polymer mixture | Degree of breakage depends on collapse intensity | Reaction mixtures to be placed strategically at different locations in the reactor | (Sutkar and Gogate 2009) |
| Aluminum foil method | Interprets the erosion pattern on Al sheet created due to cavitation using high-resolution (digital) camera | Simple and convenient | Used only for low-frequency operation | (Sutkar and Gogate 2009) |
| Electrochemical method based on mass transfer | Based on calculation of solid–liquid mass transfer coefficient triggered by cavitation-induced H2O2 | A fast quasi-reversible electron transfer method | High sensitivity and poor reproducibility; test is confined to water solvent | (Sutkar and Gogate 2009) |
| Particle tracking velocimetry | Tracks motion of individual tracer particles to provide flow-field information | Improved spatial resolution and low computational costs | Techniques are not as robust as PIV | (Bolaños-Jiménez et al. 2017) |
| Optical ray tracing (combination of experiment and computational work) | To extract the cavitation-bubble shapes from experiment | Consists of digitizing complete experimental arrangement with its optically relevant elements and objects | Requires both numerical and experimental data of the same phenomena for the result | (Koch et al. 2021) |
Most of these experimental methods register the effect of a bubble-induced physical event. They do not directly measure the shear stress. Some of the methods, say PIV or even PTV, provide flow-field data; i.e. for the bubble-induced flow, u and v are the velocity components that can be directly measured in a 2-dimensional (x, y) plane. Based on this, strain-rate magnitude and vorticity can be calculated (defined in Eqs. 11 and 12).
| 11 |
| 12 |
Based on the strain calculation and the orientation of the surface, the stress can be estimated. Generally, this shear stress is responsible for the force that is applied leading to permanent deformation or damage of the target specimen.
Theoretical/numerical
Bubble-related theoretical investigations have been conducted to examine bubble dynamics. Rayleigh formulated an equation to describe the oscillatory behaviour of a single bubble with reference to fluid properties. This work has progressed from inclusion of viscosity effects (in the Gilmore equation) to equations that considered bubble response to large pressure oscillations (Keller-Miksis equation) (Pandit et al. 2021). Below is shown the modified Rayleigh-Plesset (RP) equation (Eq. 13) that accounts for bubble subjected to ultrasonic field []. Here again, R is the radius; p, pressure; ρ, density; , liquid viscosity; σ, surface tension; and , pressure of gas whose time (t) derivative is considered. is background static pressure (1 atm), stands for acoustic pressure amplitude, is angular frequency of oscillation, = is velocity of bubble wall, and = is acceleration of bubble wall.
| 13 |
These calculations formed the cornerstone of numerical simulations by providing initial conditions to understand cavitation-related phenomena. Some of these equations have been employed to understand sonochemistry. This has been conducted by Yasui et al. (2007, 2008). The same set of equations have also contributed to the fluid-dynamics community who have combined this along with the Navier–Stokes eq. to examine the physical effects induced by cavitation dynamics in a time-resolved manner.
As mentioned previously, the diffusion of vapour molecules in and out of the bubble affects the bubble growth. This goes on to influence the collapse dynamics of the bubble and should likely be included. Moss et al. (1999), Storey and Szeri (2000), and Toegel et al. (2000) have contributed to developing these mass transfer models. All of them assumed bubble contents to be homogeneous. Formulations were provided for the time rate of particle change across the interface, (i refers to each species), as well as for thickness of the diffusion layer, . These are respectively shown in Eqs. 14 and 15.
| 14 |
| 15 |
Here, is the diffusion coefficient; , concentration of species; and , concentration at equilibrium on the wall. Heat transfer across the bubble interface has been modelled by Toegel et al. (2000) based on the molecular theory of gases. Here, a diffusion length for heat transfer () is defined based on the temperature (T) variation in radial direction (r).
| 16 |
| 17 |
Here, again is the temperature of unbounded liquid; , the temperature of the bubble contents; and , thermal diffusivity. Since the objective of this paper is to review bubble-induced shear, the salient numerical models dealing with physical effects due to fluid motion have been tabulated as follows in Table 2.
Table 2.
Numerical methods for investigating physical effects due to fluid motion
| Method | Major features | Merits | Demerits | References |
|---|---|---|---|---|
| Marker-and-cell (MAC) method | The fluid is identified by marker particles distributed throughout the fluid region | Successfully solve the Navier–Stokes eq. using primitive variable (velocity and pressure). The staggered grid is a novelty | Assumes a free surface, hence can deal with single fluid problems | (Welch et al. 1965) |
| Front tracking | Track fluid interfaces on stationary grids, using a marker point that is moved with the imposed velocity instead of reconstruction | Thickness of the interface few cells more than VOF; uses triangulated unstructured grids to represent interface | Inconvenient if the interface stretches and deforms, or if it interacts with underlying grid; not suitable for topology changes when the fluid blob merges and breaks | (Unverdi and Tryggvason 1992) |
| Level-set method | Track fluid interfaces on stationary grids, using a continuous level-set function | The level-set marker function is given a smooth transition zone from one fluid to the next, thereby increasing regularity of the interface | Does not conserve mass very well; mapping from level-set function to marker function requires the level-set function to maintain the same shape near interface | (Osher and Sethian 1988; Sussman and Puckett 2000) |
| Volume of fluid (algebraic) | Calculates the volume of one of the fluids transported across the mesh faces during a time-step; applicable to unstructured mesh | Change of topology and compressibility easy; the interface advection step in interfacial flow solvers offer: (a) More advanced advection scheme for momentum eq. (b) Better solvers for pressure eq. (c) Use of sub-cells to keep interface as sharp as possible | Founded on more heuristic considerations and are not as accurate as the geometric VOF | (Chen et al. 1997; Rudman 1997) |
| Volume of fluid (geometric) | Involves an explicit reconstruction of the interface from the volume-fraction data | Involves complex geometric operation making implementation cumbersome and execution slow | (Hirt and Nichols 1981) | |
| Phase-field (PF) method | Reproduces interfacial dynamics by integrating PDEs, avoiding any explicit treatment of boundary conditions | Numerically inexpensive (CPU time) and scalable | Very rarely applied to industrial problems | (Anderson et al. 2000; Ding et al. 2007) |
| Constrained interpolated propagation (CIP) | Tracks fluid interfaces on stationary grids where the transition from one fluid to another is described by cubic polynomial | Simulates two-fluid problems, complex applications, such as those involving floating solids | Very data intensive leading to storage problems | (Takewaki and Yabe 1987; Yabe et al. 2001) |
| Lattice Boltzmann method (LBM) | Simulates fluid density on a lattice through collision and relaxation step formulation | Better accuracy; can simulate complex boundaries and microscopic interactions | Being developed; not clearly faster or simpler than other methods | (Cheng et al. 2010) |
Recent advances in applications
The current section investigates two major fields where the use of acoustic-cavitation-induced shear is quite indispensable.
Drug delivery and sonodynamic therapy–related applications
It is already known that bubbles can contain fluid and carry the same through miniscule channels over certain distances. This makes it a very prospective carrier of life-saving drugs. These drugs are packed as payload within coated bubbles (for stability) and transmitted in vivo to a target location. Pulsed ultrasound of suitable intensity is often used to guide these bubbles (Ohl et al. 2015). As the bubble approaches the target, its oscillatory movement triggers microstreaming which can be controlled by the applied acoustic power and frequency. In fact, a bubble subjected to high acoustic power can exhibit certain modes of shape oscillation thereby manipulating the liquid motion around it. All these stimulate shear forces that can help permeabilize cells and tissues (Cleve et al. 2019). Besides microstreaming, the bubble can interact with the target creating a liquid jet that creates a lesion on the target cell (sonoporation), thereby facilitating delivery of its payload. This entire process (known as targeted drug delivery) is an intricate one requiring precise manoeuvering of the bubble and proper permeation of the target (Dijkmans et al. 2004).
Laser-induced cavitation (LIC) has been applied for cell sonoporation (Sankin et al. 2010) via jetting but mostly confined to lab-based experiments. This is largely because the physics of jetting is sensitive to the type of surface (Hopfes et al. 2019), its stiffness, geometry (Tomita et al. 2002), etc. as earlier discussed. Even a small variation of these properties can alter jet directions and may lead to undesirable damage at wrong locations. Also, the type or shape of the damage due to cavitation-induced shear needs to be assessed.
Another emerging topic in the last decade is sonodynamic therapy (SDT), which involves elimination of a solid tumour by sensitizing the target tissue with a non-toxic chemical agent and then exposing it to low-intensity ultrasound (McHale et al. 2016; Wang et al. 2020). In fact, the irradiated ultrasound helps activate the chemical agent, thereby unlocking cytotoxic effects (Wang et al. 2020). An operation of this scale again necessitates precise control of acoustic cavitation and targeted application of the resulting shear forces. Also, several bubbles may be subjected to ultrasound enabling their collapse on or near the tumour target. The effectiveness of this method depends not only on the physics of microjets and streaming or but also on the properties of the medium (Tho et al. 2007; Collis et al. 2010) and the solid target (mechanical properties) (Hopfes et al. 2019; Sarkar et al. 2021) that is to be disintegrated. For this purpose, computational models (concepts described in Table 2) are continuously being developed that could simulate the actual liquid medium and target tissue (mechanical properties assigned similar to that of real biological tissues).
Also, simulating several bubbles is computationally expensive; hence, the foundational concepts are generally extracted from studies of a single bubble performing such therapeutic applications. Even for cases where microscopic interaction forces are involved, it is compulsory to understand which numerical model can most realistically simulate this case. So proper selection of a numerical model is a pre-requisite for numerical evaluation of acoustic cavitation-induced shear.
Biotechnological and bioprocessing-related applications
The strong shear forces generated by acoustic bubbles are also uniquely useful on biomolecules. On diatom cells (Navicula sp.), the application of low-power ultrasound was found to induce cell rupture leading to the release of its oil-rich payload (step-wise process schematic shown in Fig. 9) (Yatipanthalawa et al. 2021). It was found that acoustic cavitation played a different role in each step—at first, it caused gentle removal of the extracellular polymeric substance (EPS) on the diatom cells. This helped expose their bare surface. Afterwards, sustained acoustic shear (high intensity, low frequency ~ 0.5 W/ml, 20 kHz) generated sufficient shear stresses to break down the outer bare shell. This helped release the lipid molecules whose accumulation and extraction were further aided by the ultrasound.
Fig. 9.

Acoustic shear effect on Navicula sp. for different durations. EPS is extracellular polymeric substance. Used with permission from Yatipanthalawa et al. (2021)
Similarly, another unique application of acoustic (20 kHz) shear on nano-sized algae called Nannochloropsis sp. is rupture of its thick shell (force required stronger than that for sonoporation). This helped release the incorporated lipids using ultrasonication which can facilitate production of biofuels (Yao et al. 2018). It is to be noted that throughout the above-described processes, the shear applied is a combination of bubble collapse, jetting, and streaming. These can lead to a turbulent and shear-intensive environment (Li and Ashokkumar 2018); however, the cumulative physics involved becomes more complicated. The above specimens had been subjected to high shear rates using an Ultra-Turrax (UT) but failed to achieve comparable yields. This shows that acoustic cavitation–induced shear is able to perform delicate micro-scale operations, which otherwise is not possible. In fact, these operations particularly for biomolecules include cell division, cell disruption, etc., whose mechanisms are yet to be clearly understood. This would largely require dynamically monitoring the biomolecules (subjected to acoustic shear) at minute time and space resolutions to observe any morphological/structural changes. With the current advancement in experimental technology (refer to Table 1), these gaps are being closely examined.
Likewise, low-intensity ultrasound (< 0.1 W/cm2) has been found to activate enzymes (Huang et al. 2017; Nadar and Rathod 2017; Khan et al. 2021). In fact, acoustic cavitation and acoustic streaming can potentially change the structural conformation of the activation site and improve the stability of enzymes (Nadar and Rathod 2017). In addition, solution transportation is enhanced, and unwanted protein aggregation is avoided. Ultrasonic frequency, power intensity, pH, treatment time, and duty cycle were further identified as the controlling parameters (Khan et al. 2021). However, the direct mechanism of acoustic cavitation/streaming leading to enzyme activation is yet to be understood.
The present state of understanding relies on speculative mechanisms and commenting on the physics based on a possible dominant effect. It is to be noted that biomolecules will not be largely destroyed by acoustic cavitation. In fact, the effect of bubble-collapse temperatures and pressures has been investigated on dairy proteins (Shanmugam and Ashokkumar 2014). It has been found that that a very small proportion (< 1–20%) of whey proteins get partially denatured due to mechanical, cavitational, and cavitation after effects of US. Hence, it is envisaged that acoustic shear will be largely involved in valorising biomolecules and, if properly controlled, can further benefit related processing industries.
Futuristic application: cryogenic fragmentation
Single-bubble studies have demonstrated the role played by fluid properties, e.g. compressibility, surface tension, and viscosity (Tho et al. 2007) on the physical effects induced by oscillating bubbles. Interestingly, at very low or cryogenic temperatures (< 123 K), the fluid and solid properties vary significantly (see Table 3 for fluid properties) compared to room temperature, rendering a lesser-known domain where bubble interaction has been scarcely tested. Recent studies (Mondal et al. 2018) for 77 K have shown that the shear generated by bubble collapse may be sufficient to dent certain metal (particularly bcc metal which has low impact resistance at 77 K). In fact, microstreaming can induce flow circulations fostering different orders of magnitude of shear forces. This can be extended to gently remove cryogenically frozen tumours (e.g. cryosurgery (Onik et al. 1993)). Additionally, it offers promise for cleaner, greener disintegration of materials (tissues to metals) and warrants further investigation.
Table 3.
Typical magnitude of fluid properties for water and liquid nitrogen (LN2)
| Ambient liquid environment | Dynamic viscosity (Pa-s) | Surface tension (N/m) | Bulk modulus (GPa) |
|---|---|---|---|
| 300 K, 0.1 MPa (water) | 853.74 | 0.0725 | 2.1 |
| 77 K, 0.296 MPa (LN2) | 163.47 | 0.0066 | 0.593 |
Challenges and technological gaps
General challenges during implementation
However, the impediment in understanding the physics behind acoustic bubbles is short time duration (~ ms) and small spatial scale (~ mm) of the bubble-related event (Han et al. 2015). This has restricted the understanding of the fundamental aspects of bubble interactions, mentioned before. The fact that bubbles can have a damaging effect has been explored hitherto through the study of bubble collapse, shockwaves (Kennedy 2005), high temperature ‘hot-spots’ (Suslick et al. 1999), etc. But phenomena like jetting or microstreaming with acoustic bubbles are more whimsical and difficult to quantify as they require exhaustive flow-field analysis, using highly controlled experiments. Use of substrate-attached bubbles (Tho et al. 2007; Collis et al. 2010; Leong et al. 2011) near a target object is not a solution, as the contact-line dynamics of the substrate interferes with the bubble-target interaction (Cleve et al. 2019). Again, numerical simulation models describing such multi-physics are based on assumptions with limited validity making the investigation of acoustic cavitation-induced shear quite challenging. In addition, the presence of several bubbles makes it a statistical challenge to clearly interpolate the effect due to one single bubble.
Technological gaps
Though a lot of work has been carried out to examine some or most of these physical features, there is lack of connection of these flow features with common input parameters. This has led to speculations of many bubble-induced mechanisms as mentioned earlier, without knowing the original cause of the phenomena. Even after rigorous calculations, there is lack of quantification, thereby restricting the design and development of these acoustic techniques. Figure 10 illustrates the contribution of ultrasonics in generating several effects via cavitation bubbles, with overlapped regions largely indicating the regions where knowledge is lacking. The consequent effect on target specimen exhibits the technological innovation, where this knowledge can benefit. All these studies not only contribute to improve current applications but also pave the way for futuristic technologies.
Fig. 10.

Technological gaps shown by the overlapped regions where better understanding is needed
Conclusion
Bubbles generated by ultrasound are well known for their therapeutic effect on tissues due to a number of physical effects triggered during their lifetime. But lately, the same bubbles are found prospective around unique biological specimen, e.g. diatom cells, enzymes, etc. This has motivated us to explore the physics behind the strong shear forces generated by bubbles in an acoustic field through our current review.
Herein, we have attempted to summarize a variety of physical effects (shockwave, microjet, microstreaming), their governing parameters (mainly power and frequency), and the typical magnitudes that can be triggered by acoustic bubbles. In addition, we have outlined the several investigative tools (both numerical and experimental) associated with these physical effects along with suitable references. Our work also briefly describes the current advances of this shear effect on biological samples, with a strong potential for large-scale industrial application. In fact, this study could benefit the ultrasound-based community, biological industries dedicated to green cultures, and creative enterprises involved with clean fragmentation.
Acknowledgements
J.M. acknowledges the University of Melbourne for offering the Melbourne Research Scholarship (MRS) under the Melbourne India Postgraduate Academy (MIPA). RL acknowledges MATRICS-SERB, Department of Science and Technology and BRNS-BARC, Department of Atomic Energy, Government of India for their generous research grants to promote multiphase research in India.
Declarations
Conflict of interest
The authors declare no competing interests.
Footnotes
Publisher's Note
Springer Nature remains neutral with regard to jurisdictional claims in published maps and institutional affiliations.
Contributor Information
Joydip Mondal, Email: joydmondal@gmail.com.
Muthupandian Ashokkumar, Email: masho@unimelb.edu.au.
References
- Adrian L, Adrian RJ, Westerweel J (2011) Particle image velocimetry. Cambridge university press https://www.cambridge.org/in/academic/subjects/engineering/thermal-fluids-engineering/particle-image-velocimetry
- Albrecht T, Hohmann J. Contrast Agents in Sonography Toshiba VISIONS. 2004;6:3–25. doi: 10.1007/s00117-003-0953-0. [DOI] [Google Scholar]
- Anandan S, Ashokkumar M. Sonochemical Synthesis of Noble Monometallic and Bimetallic Nanoparticles for Catalytic Applications. 2014 doi: 10.1201/b15669-4. [DOI] [Google Scholar]
- Anderson DM, McFadden GB, Wheeler AA. A phase-field model of solidification with convection. Phys D Nonlinear Phenom. 2000;135:175–194. doi: 10.1016/S0167-2789(99)00109-8. [DOI] [Google Scholar]
- Bhangu SK, Ashokkumar M (2016) Theory of sonochemistry. Top Curr Chem 374. 10.1007/s41061-016-0054-y [DOI] [PubMed]
- Bolaños-Jiménez R, Rossi M, Rivas DF, et al. Streaming flow by oscillating bubbles: quantitative diagnostics via particle tracking velocimetry. J Fluid Mech. 2017;820:529–548. doi: 10.1017/jfm.2017.229. [DOI] [Google Scholar]
- Brennen CE. Cavitation and Bubble Dynamics. 2013 doi: 10.1017/CBO9781107338760. [DOI] [Google Scholar]
- Brotchie A, Grieser F, Ashokkumar M. Effect of power and frequency on bubble-size distributions in acoustic cavitation. Phys Rev Lett. 2009;102:84302. doi: 10.1103/PhysRevLett.102.084302. [DOI] [PubMed] [Google Scholar]
- Chávez-Martínez A, Reyes-Villagrana RA, Rentería-Monterrubio AL, et al. Low and high-intensity ultrasound in dairy products: applications and effects on physicochemical and microbiological quality. Foods. 2020;9:1688. doi: 10.3390/foods9111688. [DOI] [PMC free article] [PubMed] [Google Scholar]
- Chen S, Johnson DB, Raad PE, Fadda D. The surface marker and micro cell method. Int J Numer Methods Fluids. 1997;25:749–778. doi: 10.1002/(SICI)1097-0363(19971015)25:7<749::AID-FLD584>3.0.CO;2-O. [DOI] [Google Scholar]
- Chen Y, Lin I (2008) Dynamics of impacting a bubble by another pulsed-laser-induced bubble : Jetting , fragmentation , and entanglement. 1–12. 10.1103/PhysRevE.77.026304 [DOI] [PubMed]
- Cheng M, Hua J, Lou J. Simulation of bubble–bubble interaction using a lattice Boltzmann method. Comput Fluids. 2010;39:260–270. doi: 10.1016/j.compfluid.2009.09.003. [DOI] [Google Scholar]
- Chew LW, Klaseboer E, Ohl SW, Khoo BC. Interaction of two differently sized oscillating bubbles in a free field. Phys Rev E - Stat Nonlinear, Soft Matter Phys. 2011;84:1–11. doi: 10.1103/PhysRevE.84.066307. [DOI] [PubMed] [Google Scholar]
- Cleve S, Guédra M, Mauger C, et al. Microstreaming induced by acoustically trapped, non-spherically oscillating microbubbles. J Fluid Mech. 2019;875:597–621. doi: 10.1017/jfm.2019.511. [DOI] [Google Scholar]
- Collis J, Manasseh R, Liovic P, et al. Cavitation microstreaming and stress fields created by microbubbles. Ultrasonics. 2010;50:273–279. doi: 10.1016/j.ultras.2009.10.002. [DOI] [PubMed] [Google Scholar]
- Coussios CC, Roy RA. Applications of acoustics and cavitation to noninvasive therapy and drug delivery. Annu Rev Fluid Mech. 2008;40:395–420. doi: 10.1146/annurev.fluid.40.111406.102116. [DOI] [Google Scholar]
- Dijkink R, Ohl C-D. Measurement of cavitation induced wall shear stress. Appl Phys Lett. 2008;93:254107. doi: 10.1063/1.3046735. [DOI] [Google Scholar]
- Dijkmans PA, Juffermans LJM, Musters RJP, et al. Microbubbles and ultrasound: from diagnosis to therapy. Eur J Echocardiogr. 2004;5:245–256. doi: 10.1016/j.euje.2004.02.001. [DOI] [PubMed] [Google Scholar]
- Ding H, Spelt PDM, Shu C. Diffuse interface model for incompressible two-phase flows with large density ratios. J Comput Phys. 2007;226:2078–2095. doi: 10.1016/j.jcp.2007.06.028. [DOI] [Google Scholar]
- Doinikov AA, Bouakaz A. Acoustic microstreaming around a gas bubble. J Acoust Soc Am. 2010;127:703–4966. doi: 10.1121/1.3279793. [DOI] [PubMed] [Google Scholar]
- Durst F, Schönung B, Selanger K, Winter M. Bubble-driven liquid flows. J Fluid Mech. 1986;170:53–82. doi: 10.1017/S0022112086000800. [DOI] [Google Scholar]
- Elder SA. Cavitation microstreaming. J Acoust Soc Am. 1959;31:54–64. doi: 10.1121/1.1907611. [DOI] [Google Scholar]
- Fong SW, Adhikari D, Klaseboer E, Khoo BC. Interactions of multiple spark-generated bubbles with phase differences. Exp Fluids. 2009;46:705–724. doi: 10.1007/s00348-008-0603-4. [DOI] [Google Scholar]
- Franc J-P, Michel J-M. Fundamentals of cavitation. Springer Science & Business Media. 2006 doi: 10.1007/1-4020-2233-6. [DOI] [Google Scholar]
- Han B, Köhler K, Jungnickel K, et al. Dynamics of laser-induced bubble pairs. J Fluid Mech. 2015;771:706–742. doi: 10.1017/jfm.2015.183. [DOI] [Google Scholar]
- Hirt CW, Nichols BD. Volume of fluid (VOF) method for the dynamics of free boundaries. J Comput Phys. 1981;39:201–225. doi: 10.1016/0021-9991(81)90145-5. [DOI] [Google Scholar]
- Hopfes T, Wang Z, Giglmaier M, Adams NA. Collapse dynamics of bubble pairs in gelatinous fluids. Exp Therm Fluid Sci. 2019;108:104–114. doi: 10.1016/j.expthermflusci.2019.05.023. [DOI] [Google Scholar]
- Huang G, Chen S, Dai C, et al. Effects of ultrasound on microbial growth and enzyme activity. Ultrason Sonochem. 2017;37:144–149. doi: 10.1016/j.ultsonch.2016.12.018. [DOI] [PubMed] [Google Scholar]
- Jalal J, Leong TSH. Microstreaming and its role in applications: a mini-review. Fluids. 2018;3:93. doi: 10.3390/fluids3040093. [DOI] [Google Scholar]
- Kanthale P, Ashokkumar M, Grieser F. Sonoluminescence, sonochemistry (H2O2 yield) and bubble dynamics: frequency and power effects. Ultrason Sonochem. 2008;15:143–150. doi: 10.1016/j.ultsonch.2007.03.003. [DOI] [PubMed] [Google Scholar]
- Kennedy JE. High-intensity focused ultrasound in the treatment of solid tumours. Nat Rev Cancer. 2005;5:321–327. doi: 10.1038/nrc1591. [DOI] [PubMed] [Google Scholar]
- Kentish S, Ashokkumar M. The Physical and Chemical Effects of Ultrasound. 2011 doi: 10.1007/978-1-4419-7472-3_1. [DOI] [Google Scholar]
- Khan A, Beg MR, Waghmare P. Intensification of biokinetics of enzymes using ultrasound-assisted methods: a critical review. Biophys Rev. 2021;13:417–423. doi: 10.1007/s12551-021-00806-9. [DOI] [PMC free article] [PubMed] [Google Scholar]
- Kim J, Lee S, Joung YS. Schlieren imaging for the visualization of particles entrapped in bubble films. J Colloid Interface Sci. 2020;570:52–60. doi: 10.1016/j.jcis.2020.02.085. [DOI] [PubMed] [Google Scholar]
- Koch M, Rosselló JM, Lechner C, et al. Theory-assisted optical ray tracing to extract cavitation-bubble shapes from experiment. Exp Fluids. 2021;62:1–19. doi: 10.1007/s00348-020-03075-6. [DOI] [Google Scholar]
- Kolb J, Nyborg WL. Small-scale acoustic streaming in liquids. J Acoust Soc Am. 1956;28:1237–1242. doi: 10.1121/1.1908603. [DOI] [Google Scholar]
- Krasulya O, Bogush V, Trishina V, et al. Impact of acoustic cavitation on food emulsions. Ultrason Sonochem. 2016;30:98–102. doi: 10.1016/j.ultsonch.2015.11.013. [DOI] [PubMed] [Google Scholar]
- Lechner C, Lauterborn W, Koch M, Mettin R. Jet formation from bubbles near a solid boundary in a compressible liquid: numerical study of distance dependence. Phys Rev Fluids. 2020;5:1–32. doi: 10.1103/PhysRevFluids.5.093604. [DOI] [Google Scholar]
- Lechner C, Lauterborn W, Koch M, Mettin R (2019) Fast, thin jets from bubbles expanding and collapsing in extreme vicinity to a solid boundary: a numerical study. Phys Rev Fluids 4. 10.1103/PhysRevFluids.4.021601
- Leighton T. The acoustic bubble. Academic Press. 2012 doi: 10.1016/B978-0-12-441920-9.X5001-9. [DOI] [Google Scholar]
- Leong T, Collis J, Manasseh R, et al. The role of surfactant headgroup, chain length, and cavitation microstreaming on the growth of bubbles by rectified diffusion. J Phys Chem C. 2011;115:24310–24316. doi: 10.1021/jp208862p. [DOI] [Google Scholar]
- Li W, Ashokkumar M. Introduction to ultrasound and sonochemistry. Electrochem Soc Interface. 2018;27:43–46. doi: 10.1149/2.F04183if. [DOI] [Google Scholar]
- Lighthill J. Acoustic Streaming J ofSound Vib. 1978;61:391–418. doi: 10.1016/0022-460X(78)90388-7. [DOI] [Google Scholar]
- Liu Z, Zheng Y, Jia L, Zhang Q. Study of bubble induced flow structure using PIV. Chem Eng Sci. 2005;60:2509–3537. doi: 10.1016/j.ces.2004.03.049. [DOI] [Google Scholar]
- Manickam S, Ashokkumar M. Cavitation: a novel energy-efficient technique for the generation of nanomaterials. CRC Press. 2014 doi: 10.1201/b15669. [DOI] [Google Scholar]
- Mason TJ, Cobley AJ, Graves JE, Morgan D. New evidence for the inverse dependence of mechanical and chemical effects on the frequency of ultrasound. Ultrason Sonochem. 2011;18:226–230. doi: 10.1016/j.ultsonch.2010.05.008. [DOI] [PubMed] [Google Scholar]
- Matula TJ, Hallaj IM, Cleveland RO, et al. The acoustic emissions from single-bubble sonoluminescence. J Acoust Soc Am. 1998;103:1377–1382. doi: 10.1121/1.421279. [DOI] [Google Scholar]
- McHale AP, Callan JF, Nomikou N et al (2016) Sonodynamic therapy: concept, mechanism and application to cancer treatment. Ther Ultrasound 429–450. 10.1007/978-3-319-22536-4_22 [DOI] [PubMed]
- McKenzie TG, Karimi F, Ashokkumar M, Qiao GG. Ultrasound and sonochemistry for radical polymerization: sound synthesis. Chem Eur J. 2019;25:5372–5388. doi: 10.1002/chem.201803771. [DOI] [PubMed] [Google Scholar]
- Mondal J, Li W, Rezk AR et al (2021) Acoustic cavitation at low gas pressures in PZT-based ultrasonic systems. Ultrason Sonochem 73. 10.1016/j.ultsonch.2021.105493 [DOI] [PMC free article] [PubMed]
- Mondal J, Mishra A, Lakkaraju R, Ghosh P (2018) Numerical examination of jets induced by multi-bubble interactions. In: Proceedings of ASME 2018, IMECE2018. pp 1–8 10.1115/IMECE2018-87606
- Moss WC, Young DA, Harte JA, et al. Computed optical emissions from a sonoluminescing bubble. Phys Rev E. 1999;59:2986. doi: 10.1103/PhysRevE.59.2986. [DOI] [Google Scholar]
- Nadar SS, Rathod VK (2017) Ultrasound assisted intensification of enzyme activity and its properties: a mini-review. World J Microbiol Biotechnol 33. 10.1007/s11274-017-2322-6 [DOI] [PubMed]
- Nyborg WL. Acoustic streaming near a boundary. J Acoust Soc Am. 1958;30:329–339. doi: 10.1121/1.1909587. [DOI] [Google Scholar]
- Obreschkow D, Tinguely M, Dorsaz N et al (2013) The quest for the most spherical bubble: experimental setup and data overview. Exp Fluids 54. 10.1007/s00348-013-1503-9
- Ohl SW, Klaseboer E, Khoo BC. Bubbles with shock waves and ultrasound: a review. Interface Focus. 2015;5:1–15. doi: 10.1098/rsfs.2015.0019. [DOI] [PMC free article] [PubMed] [Google Scholar]
- Onik GM, Cohen JK, Reyes GD, et al. Transrectal ultrasound-guided percutaneous radical cryosurgical ablation of the prostate. Cancer. 1993;72:1291–1299. doi: 10.1002/1097-0142(19930815)72:4<1291::AID-CNCR2820720423>3.0.CO;2-I. [DOI] [PubMed] [Google Scholar]
- Osher S, Sethian JA. Fronts propagating with curvature-dependent speed: algorithms based on Hamilton-Jacobi formulations. J Comput Phys. 1988;79:12–49. doi: 10.1016/0021-9991(88)90002-2. [DOI] [Google Scholar]
- Pandit AV, Sarvothaman VP, Ranade VV. Estimation of chemical and physical effects of cavitation by analysis of cavitating single bubble dynamics. Ultrason Sonochem. 2021;77:105677. doi: 10.1016/j.ultsonch.2021.105677. [DOI] [PMC free article] [PubMed] [Google Scholar]
- Pecha R, Gompf B. Microimplosions: cavitation collapse and shock wave emission on a nanosecond time scale. Phys Rev Lett. 2000;84:1328. doi: 10.1103/PhysRevLett.84.1328. [DOI] [PubMed] [Google Scholar]
- Podbevšek D, Lokar Ž, Podobnikar J et al (2021) Experimental evaluation of methodologies for single transient cavitation bubble generation in liquids. Exp Fluids 62. 10.1007/s00348-021-03260-1
- Poulichet V, Huerre A, Garbin V. Shape oscillations of particle-coated bubbles and directional particle expulsion. Soft Matter. 2017;13:125–133. doi: 10.1039/C6SM01603K. [DOI] [PMC free article] [PubMed] [Google Scholar]
- Preece, Brunton (1980) A comparison of liquid impact erosion and cavitation erosion
- Rudman M. Volume-tracking methods for interfacial flow calculations. Int J Numer Methods Fluids. 1997;24:671–691. doi: 10.1002/(SICI)1097-0363(19970415)24:7<671::AID-FLD508>3.0.CO;2-9. [DOI] [Google Scholar]
- Sankin GN, Yuan F, Zhong P. Pulsating Tandem Microbubble for Localized and Directional Single-Cell Membrane Poration. 2010;078101:1–4. doi: 10.1103/PhysRevLett.105.078101. [DOI] [PMC free article] [PubMed] [Google Scholar]
- Sarkar P, Ghigliotti G, Franc JP, Fivel M. Mechanism of material deformation during cavitation bubble collapse. J Fluids Struct. 2021;105:103327. doi: 10.1016/j.jfluidstructs.2021.103327. [DOI] [Google Scholar]
- Shanmugam A, Ashokkumar M. Ultrasonic preparation of stable flax seed oil emulsions in dairy systems - physicochemical characterization. Food Hydrocoll. 2014;39:151–162. doi: 10.1016/j.foodhyd.2014.01.006. [DOI] [Google Scholar]
- Shao S, Hong J (2019) Measurement of 3D bubble distribution using digital inline holography. arXiv Prepr arXiv190410894 https://arxiv.org/pdf/1904.10894.pdf
- So S, Morikita H, Takagi S, Matsumoto Y. Laser Doppler velocimetry measurement of turbulent bubbly channel flow. Exp Fluids. 2002;33:135–142. doi: 10.1007/s00348-002-0459-y. [DOI] [Google Scholar]
- Storey BD, Szeri AJ. Water vapour, sonoluminescence and sonochemistry. Proc R Soc London Ser A Math Phys Eng Sci. 2000;456:1685–1709. doi: 10.1098/rspa.2000.0582. [DOI] [Google Scholar]
- Supponen O, Obreschkow D, Kobel P, et al. Shock waves from nonspherical cavitation bubbles. Phys Rev Fluids. 2017;2:93601. doi: 10.1103/PhysRevFluids.2.093601. [DOI] [PubMed] [Google Scholar]
- Suslick KS, Didenko Y, Fang MM, et al. Acoustic cavitation and its consequences. Philos Trans R Soc A. 1999;357:335–353. doi: 10.1098/rsta.1999.0330. [DOI] [Google Scholar]
- Sussman M, Puckett EG. A coupled level set and volume-of-fluid method for computing 3D and axisymmetric incompressible two-phase flows. J Comput Phys. 2000;162:301–337. doi: 10.1006/jcph.2000.6537. [DOI] [Google Scholar]
- Sutkar VS, Gogate PR. Design aspects of sonochemical reactors: techniques for understanding cavitational activity distribution and effect of operating parameters. Chem Eng J. 2009;155:26–36. doi: 10.1016/j.cej.2009.07.021. [DOI] [Google Scholar]
- Takewaki H, Yabe T. The cubic-interpolated pseudo particle (CIP) method: application to nonlinear and multi-dimensional hyperbolic equations. J Comput Phys. 1987;70:355–372. doi: 10.1016/0021-9991(87)90187-2. [DOI] [Google Scholar]
- Tho P, Manasseh R, Ooi A. Cavitation microstreaming patterns in single and multiple bubble systems. J Fluid Mech. 2007;576:191. doi: 10.1017/S0022112006004393. [DOI] [Google Scholar]
- Toegel R, Gompf B, Pecha R, Lohse D. Does water vapor prevent upscaling sonoluminescence? Phys Rev Lett. 2000;85:3165. doi: 10.1103/PhysRevLett.85.3165. [DOI] [PubMed] [Google Scholar]
- Tomita Y, Robinson PB, Tong RP, Blake JR. Growth and Collapse of Cavitation Bubbles near a Curved Rigid Boundary. 2002;466:259–283. doi: 10.1017/S0022112002001209. [DOI] [Google Scholar]
- Unverdi SO, Tryggvason G. A front-tracking method for viscous, incompressible, multi-fluid flows. J Comput Phys. 1992;100:25–37. doi: 10.1016/0021-9991(92)90307-K. [DOI] [Google Scholar]
- Wang X, Zhong X, Gong F, et al. Newly developed strategies for improving sonodynamic therapy. Mater Horizons. 2020;7:2028–2046. doi: 10.1039/d0mh00613k. [DOI] [Google Scholar]
- Welch JE, Harlow FH, Shannon J, Daly B (1965) The MAC method-a computing technique for solving viscous, incompressible, transient fluid-flow problems involving free surfaces 10.2172/4563173
- Withrington RJ. Application of holography to bubble chambers-a review. Opt Technol. 1970;2:132–138. doi: 10.1016/0374-3926(70)90036-0. [DOI] [Google Scholar]
- Wu H, Zhou C, Pu Z, et al. Effect of low-frequency ultrasonic field at different power on the dynamics of a single bubble near a rigid wall. Ultrason Sonochem. 2019;58:104704. doi: 10.1016/j.ultsonch.2019.104704. [DOI] [PubMed] [Google Scholar]
- Wu J, Du G. Streaming generated by a bubble in an ultrasound field. J Acoust Soc Am. 1997;101:1899–1907. doi: 10.1121/1.418223. [DOI] [Google Scholar]
- Yabe T, Xiao F, Utsumi T. The constrained interpolation profile method for multiphase analysis. J Comput Phys. 2001;169:556–593. doi: 10.1006/jcph.2000.6625. [DOI] [Google Scholar]
- Yao SY, Mettu S, Law SQK, et al. The effect of high-intensity ultrasound on cell disruption and lipid extraction from high-solids viscous slurries of Nannochloropsis sp biomass. Algal Res Biofuels Bioprod. 2018;35:341–348. doi: 10.1016/j.algal.2018.09.004. [DOI] [Google Scholar]
- Yasui K, Tuziuti T, Kozuka T, et al. Relationship between the bubble temperature and main oxidant created inside an air bubble under ultrasound. J Chem Phys. 2007;127:154502. doi: 10.1063/1.2790420. [DOI] [PubMed] [Google Scholar]
- Yasui K, Tuziuti T, Lee J, et al. The range of ambient radius for an active bubble in sonoluminescence and sonochemical reactions. J Chem Phys. 2008;128:184705. doi: 10.1063/1.2919119. [DOI] [PubMed] [Google Scholar]
- Yatipanthalawa B, Li W, Hill DRA, et al. Interplay between interfacial behaviour, cell structure and shear enables biphasic lipid extraction from whole diatom cells (Navicula sp.) J Colloid Interface Sci. 2021;589:65–76. doi: 10.1016/j.jcis.2020.12.056. [DOI] [PubMed] [Google Scholar]
- Young FR. Sonoluminescence. CRC Press. 2004 doi: 10.1201/9780203491959. [DOI] [Google Scholar]