

Abstract
Primary cilia are antenna‐like organelles required for signalling transduction. How cilia structure is mechanistically maintained at steady‐state to promote signalling is largely unknown. Here, we define that mammalian primary cilia axonemes are formed by proximal segment (PS) and distal segment (DS) delineated by tubulin polyglutamylation‐rich and ‐poor regions, respectively. The analysis of proximal/distal segmentation indicated that perturbations leading to cilia over‐elongation influenced PS or DS length with a different impact on cilia behaviour. We identified septins as novel repressors of DS growth. We show that septins control the localisation of MKS3 and CEP290 required for a functional transition zone (TZ), and the cilia tip accumulation of the microtubule‐capping kinesin KIF7, a cilia‐growth inhibitor. Live‐cell imaging and analysis of sonic‐hedgehog (SHH) signalling activation established that DS over‐extension increased cilia ectocytosis events and decreased SHH activation. Our data underlines the importance of understanding cilia segmentation for length control and cilia‐dependent signalling.
Keywords: cilia length/segmentation, KIF7, septins, sonic hedgehog signalling, transition zone
Subject Categories: Cell Adhesion, Polarity & Cytoskeleton; Membranes & Trafficking
Over‐elongation in the absence of septins affects relative lengths of cilia proximal and distal segments defined by differential tubulin polyglutamylation, and disturbs sonic hedgehog signaling.

Introduction
Primary cilia are conserved, specialised antenna‐like organelles that protrude from the cell surface where they perceive signals from the extracellular milieu and, as a consequence, activate downstream responses to the cell interior (Ishikawa & Marshall, 2011; Lee et al, 2015; Wheway et al, 2018). As such, the primary cilium plays essential roles during animal development and tissue homeostasis through regulation of important signalling pathways such as Wnt, Hedgehog (HH) and TGF1‐β (Echelard et al, 1993; May‐Simera et al, 2018; Mönnich et al, 2018; Wheway et al, 2018). Therefore, it is not surprising that defective cilia can lead to multi‐organ dysfunction due to signalling failure, which is the aetiology of genetic disorders named ciliopathies (Waters & Beales, 2011; Leightner et al, 2013; Guen et al, 2016; Slaats et al, 2016; Reiter & Leroux, 2017).
The cilium is built from the basal body, through a cascade of events that lead to transition zone (TZ) establishment, cilia membrane formation and axoneme microtubule (axoMTs) extension (Ishikawa & Marshall, 2011; Kim & Dynlacht, 2013; Sánchez & Dynlacht, 2016). Once formed, cilia are maintained at a specific length that varies between cell types (Besschetnova et al, 2010; Qiu et al, 2012; Wann & Knight, 2012; Ghossoub et al, 2013; He et al, 2014; Miyoshi et al, 2014). For instance, relatively long cilia are reported in neurons (8–10 µm), whilst much shorter cilia are present in chondrocytes (2 µm) (Wann & Knight, 2012; Miyoshi et al, 2014). Variations in the physiological length of cilia causing shortening or over‐elongation are reported in ciliopathies, indicated that keeping proper cilia length in each tissue is vital for their signalling function (Leightner et al, 2013; Guen et al, 2016; Reiter & Leroux, 2017; Kim et al, 2018; May‐Simera et al, 2018; Ramsbottom et al, 2018).
Evidence indicates that ciliary organisation as well as identity is not uniform. The structure of the axoneme has been studied in Caenorhabditis elegans sensory cilia where it has been sub‐divided into two domains, named the middle and distal segments (DS) (Inglis et al, 2007; Hao et al, 2011). The middle segment is defined by the doublet MTs, which extend from the basal body and are enriched in several post‐translational modifications that stabilise axoMTs, such as polyglutamylation and polyglycylation (Snow et al, 2004; Inglis et al, 2007; O'Hagan et al, 2011; Alford et al, 2017). The DS defines the domain in which doublet MTs converge into singlets, which extend from the A‐tubule of axoMTs towards the cilia tip (Inglis et al, 2007; Mukhopadhyay et al, 2008; Hao et al, 2011; Doroquez et al, 2014; van der Burght et al, 2020). The DS is proposed to act as a chemical and osmotic sensor (Bargmann, 2006; Inglis et al, 2007; Alford et al, 2017). Previous electron microscopy and more recent electron tomography data show that the doublet‐singlet MT transition also occurs in mouse and canine epithelial primary cilia (Flood & Totland, 1977; Sun et al, 2019; Kiesel et al, 2020) and signalling pathway‐related proteins are enriched at the ciliary tip, reinforcing the importance of the DS in signalling (Haycraft et al, 2005; Cherry et al, 2013; Pedersen & Akhmanova, 2014; Wheway et al, 2018). However, it is still unclear whether middle‐distal segmentation as described in C. elegans is a structurally conserved feature in mammalian cilia (Sun et al, 2019; Kiesel et al, 2020).
Here, we analysed human and mouse primary cilia based on enrichment of polyglutamylated tubulin, a marker previously used to define the middle segment of sensory cilia (Warburton‐Pitt et al, 2014). We show that primary cilia of human retina epithelial cells and murine fibroblasts have polyglutamylated rich and poor‐regions, which we refer to as proximal segment (PS) and distal segment (DS), respectively. Interestingly, factors that led to cilia over‐extension impact the size of the PS‐DS differently. We identify septin as a novel factor that specifically represses DS extension, without changing the PS. Septin controls localisation of TZ components MKS3 and CEP290 as well as the axonemal‐capping kinesin KIF7 to the ciliary distal tip for DS growth. Moreover, DS hyper‐elongation induces cilia ectocytosis due to structural instability and causes defective SHH signalling activation. We propose that the control of the DS by septin is key for the maintenance of primary cilia signalling function. Our data underlies the importance of understanding how cilia sub‐domains are maintained and regulated.
Results
Observation of cilia segmentation in human and mouse cells
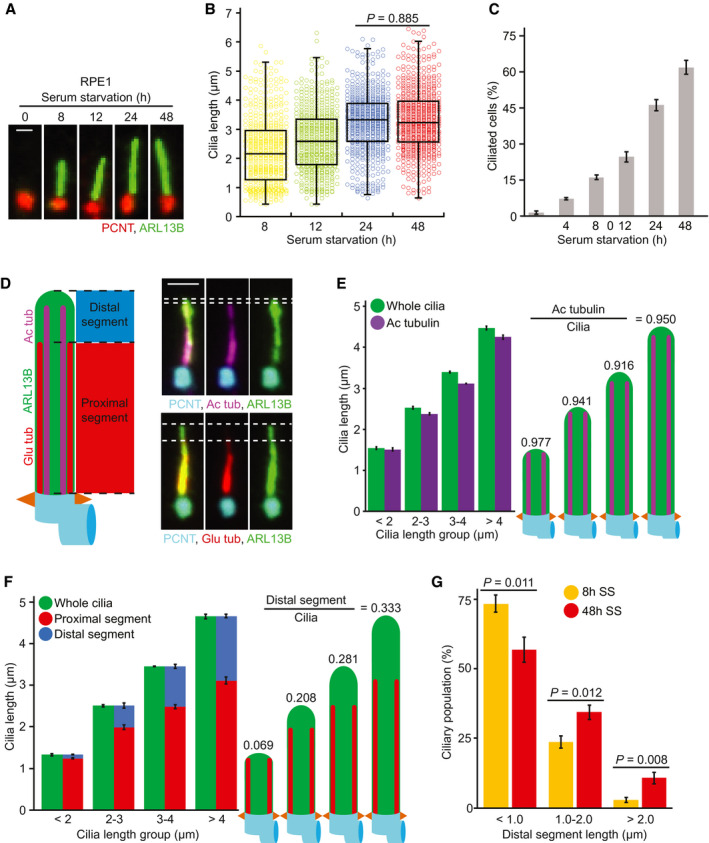
To understand the mechanisms controlling cilia length, we characterised the dynamics of cilia elongation in human retinal pigment epithelial (RPE1) and mouse fibroblast (NIH3T3) cells after serum‐starvation, a condition that induces cilia biogenesis in a timely manner (Fig 1A–C, Appendix Fig S1A–C). In both cell types, cilia reached maximum length after 24–48 h of serum‐starvation (Fig 1B, Appendix Fig S1B). To better characterise which part of the axoneme contributed to cilia growth, we determined the middle‐DS in mammalian cells, as reported for C. elegans (Lechtreck & Geimer, 2000; Snow et al, 2004; Bargmann, 2006; Hao et al, 2011). For this, we stained for axoMT markers, acetylated and polyglutamylated‐tubulin (He et al, 2020; Janke & Magiera, 2020), and the membrane marker ARL13B (Fig 1D). The stained regions of cilia were similar when comparing ARL13B and acetylated tubulin staining using conventional or stimulated emission depleted (STED) microscopy in RPE1 cells (Fig 1E, Appendix Fig S1D and E). This pattern was, however, different for glutamylated tubulin, which strongly decorated the middle part of the cilium (Fig 1D, Appendix Fig S1D). Based on these data, we defined the PS as the polyglutamylated‐tubulin rich region, whilst the length of the DS was calculated as the difference between the full cilium (ARL13B‐stained region) and the PS (Fig 1D). Interestingly, shorter cilia (< 2 µm) had a very short DS, but in longer cilia (> 4 µm) the DS represented more than 30% of the cilium in human and mouse cells (Fig 1F, Appendix Fig S1F). In both cell types, longer DS were more predominant after 48 h of serum‐starvation (Fig 1G, Appendix Fig S1G). Together, these data imply that cilia growth involves timely elongation of the PS followed by the DS.
Figure 1. Characterisation of proximal/distal cilia segmentation in RPE1 cells.
-
A, BRepresentative images of cilia (A) and dot plots (B) showing primary cilia length variation at different time points after serum‐starvation (SS). Markers in (A) show ARL13B (cilia) and PCNT (Basal body). The graph shows individual length of cilia from three biological replicates (n > 150 cilia per sample and experiment). Scale bar: 1 µm.
-
CPercentage of ciliated RPE1 cells after SS from (A). Three biological replicates, n > 100 cells per sample and experiment repetition.
-
DRepresentative images show cilia segmentation based on acetylated tubulin (Ac tub), polyglutamylated tubulin (Glu tub), ARL13B and PCNT. The cartoon on the left indicates proximal segments (PS, Glu tub rich‐region) and distal segments (DS). DS were determined by calculating the difference between PS and total cilia length based on ARL13B staining as depicted by the dashed lines on the images. Scale bar: 1.5 µm.
-
EQuantification of (D). Comparative analysis of average cilia length based on Ac tubulin and ARL13B (cilia) staining shown for specified cilia length groups (2 <, 2–3, 3–4 and > 4 µm). Three biological replicates, n = 400 cilia per sample and repetition. The numbers above the cartoons show the ratio of the calculated Ac tub/whole cilia length.
-
FAverage length of PS and DS for the cilia length groups depicted. Representative images (D) and quantifications of PS (Glu tub) and whole cilia (ARL13B) length are shown. The numbers above the cartoons show the ratio of the calculated DS/whole cilia length. Three biological replicates, n > 650 cilia per sample and repetition.
-
GPercentage of cilia with depicted DS length after 8 and 48 h SS. Three biological replicates, n > 150 cilia per sample and repetition.
Source data are available online for this figure.
Microtubules and septins affect DS growth
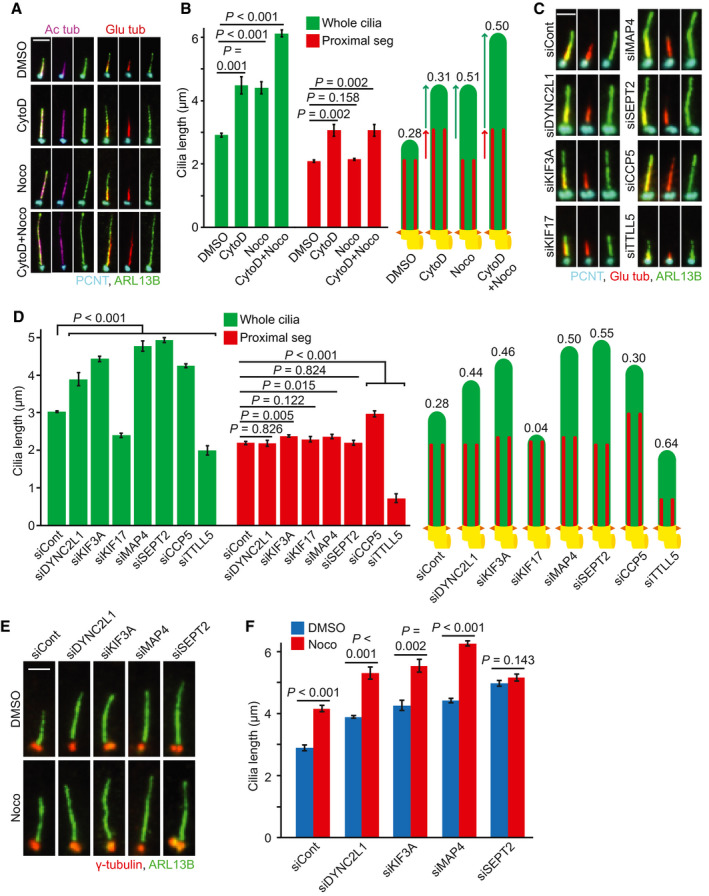
We next evaluated how the PS and DS change their length when using low‐doses of nocodazole or cytochalasin D (CytoD), which were reported to elongate cilia without collapsing the MT and actin cytoskeleton, respectively (Kim et al, 2010; Sharma et al, 2011). Treatment of RPE1 and NIH3T3 cells with nocodazole or CytoD led to a significant increase in cilia extension analysed by acetylated tubulin and/or ARL13B (Fig 2A and B, Appendix Fig S2A–C). CytoD elongated both PS and DS length without changing the segment ratio, whereas nocodazole increased only the DS (Fig 2A and B, Appendix Fig S2A–C). Dual nocodazole and CytoD treatment additionally extended DS length in comparison to CytoD alone in RPE1 cells (Fig 2A and B). Together, MT and actin perturbations increase cilia length by affecting different segments.
Figure 2. Microtubule perturbators and SEPT2 depletion change only the distal segment length in RPE1 cells.
-
ARepresentative images of 48 h serum‐starved RPE1 cells treated with solvent control (DMSO), cytochalasin D (CytoD) and/or nocodazole (Noco) for 3 h before immunostaining with the indicated antibodies. Scale bar: 3 µm.
-
BQuantification of (A) showing average length of proximal segment (PS, Glu tub) and whole cilia (ARL13B). The numbers above the cartoons show the ratio of the calculated distal segment (DS)/whole cilia length. Three biological replicates, n = 100 cilia per sample and repetition.
-
C, DRPE1 cells were treated with the indicated siRNAs before serum‐starvation for 48 h. Representative immunostained images with indicated antibodies (C) and quantifications of PS (Glu tub) and whole cilia (ARL13B) length (D) are shown. The numbers above the cartoons in (D) show the ratio of the calculated DS/whole cilia length. Scale bar: 2 µm. Three biological replicates, n = 100 cilia per sample and repetition.
-
E, FCells were treated with the indicated siRNAs before serum‐starvation for 48 h and treatment with DMSO or Noco for 3 h before immunostaining with the indicated antibodies. Representative images (E) and quantification of cilia length based on ARL13B (F) are shown. Scale bar: 2 µm. Three biological replicates, n = 100 cilia per sample and repetition.
Data information: Data shown in (B, D and F) include mean ± s.d.; P values are calculated by two‐tailed unpaired student t‐test.
Source data are available online for this figure.
We next became interested in identifying proteins that control DS elongation. We reasoned that depletion of these proteins should lead to elongated cilia by causing only DS and not PS extension. Additionally, depletion of these candidates should not further increase cilia length upon nocodazole treatment. Using these criteria, we tested several candidate genes in an siRNA‐based screen. The encoded proteins were reported to interact with MTs and/or affect cilia length and included the IFT dynein‐2 light‐chain DYNC2L1 (Taylor et al, 2015), IFT kinesin‐subunits KIF3A (Qiu et al, 2012) and KIF17 (Insinna et al, 2008), MT‐interacting proteins MAP4 and SEPT2 (Hu et al, 2010; Ghossoub et al, 2013), tubulin de‐glutaminase CCP5 (He et al, 2018) and glutaminase TTLL5 (Sun et al, 2016; Wloga et al, 2017). Although cilia formation was significantly reduced in case of DYNC2L1, KIF3A and TTLL5 depletion (Appendix Fig S2D), ciliated cells were still observed and quantified. The knockdown (KD) of the candidate genes, excluding KIF17 and TTLL5, increased ciliary length in comparison to the control (Fig 2C and D). CCP5‐KD extended both segments, keeping segment proportion as the control (Fig 2D). Similar to nocodazole treatment, DS length was raised upon DYNC2L1, KIF3A, MAP4 and SEPT2‐KD (Fig 2D). Of those, nocodazole treatment further extended cilia length in DYNC2L1, KIF3A and MAP4 but not SEPT2‐KD cells (Fig 2E and F). We thus hypothesised that SEPT2 and MTs might be involved in the same pathway regulating DS elongation and decided to investigate this function of septins in more detail.
Septins are enriched along the cilia but not at the TZ
SEPT2 is one of the building blocks of the septin family, which is sub‐divided into four sub‐groups represented by SEPT2, SEPT6, SEPT7 and SEPT9 (Neubauer & Zieger, 2017). Septins support cell division and act as membrane diffusion barriers in different contexts and organisms (Sandrock et al, 2011; Ghossoub et al, 2013; Palander et al, 2017; Valadares et al, 2017). In RPE1 cells, septins were reported to form filamentous structures in the cytoplasm and cilium (Ghossoub et al, 2013). Indeed, specific antibodies against SEPT2 and SEPT7 confirmed this localisation (Fig 3A). STED microscopy indicated that SEPT2 and SEPT7 decorated the region between the cilia membrane (stained with ARL13B, Fig 3B and C), indicating that septins reside inside the cilium. We then asked whether septins decorate the entire cilium including the TZ. For this, we used a functional EGFP‐SEPT2 fusion protein for co‐localisation with MKS3 or CEP290 as TZ markers (Garcia‐Gonzalo & Reiter, 2017; Shi et al, 2017) alongside ARL13B and γ‐tubulin (Fig 3D). The lengthwise comparison of the signal intensities showed that EGFP‐SEPT2 signal was very low at MKS3 or CEP290 regions but increased along the cilia and then slightly diminished towards the tip (Fig 3E). This indicates that septins accumulate along the cilium but not at the TZ.
Figure 3. Endogenous Septin localises inside the cilium and upper part of the TZ in a microtubule‐dependent manner.
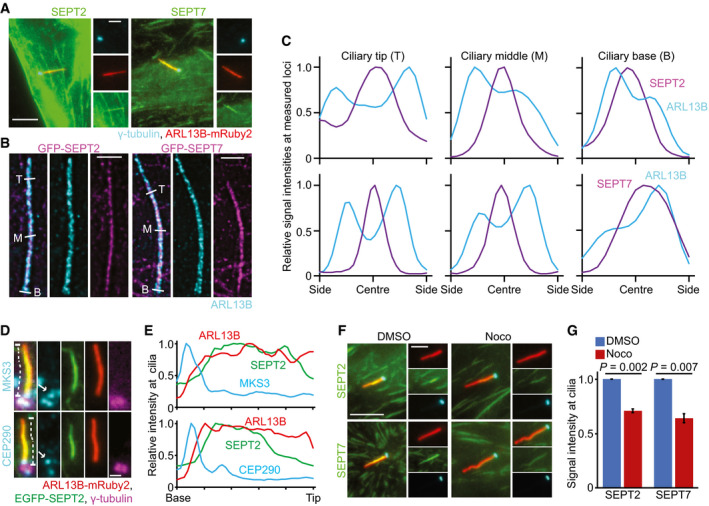
- Images show the localisation of endogeneous SEPT2 and SEPT7 in RPE1 ARLB13B‐mRuby2 cells with basal body staining. The insets to the right show enlargements of the cilium. Scale bar: 4 µm (large) and 2 µm (small).
- STED microscopy images showing ciliated RPE1 cells expressing EGFP‐SEPT2 or SEPT7‐EGFP and stained for ARL13B. Scale bar: 1 µm.
- Relative signal intensities were determined along the cilium for the indicated proteins at the ciliary tip (T), middle (M) and base (B) regions as specified in (B) (white lines).
- Representative images showing co‐localisation of MKS3 or CEP290 in ciliated RPE1 ARLB13B‐mRuby2 and GFP‐SEPT2 cells. The white arrows point to the specific MKS3 or CEP290 signals. Scale bar: 1 µm.
- Line scan measurements show the normalised signal intensities along the cilium for the indicated proteins as specified in (D) (dashed lines).
- Effect of nocodazole (Noco) treatment (3 h) on the localisation of endogenous SEPT2 and SEPT7 at cilia in RPE1 cells. The insets show magnifications of the cilium. Scale bar: 5 µm (large) and 2.5 µm (small).
- Relative signal intensity of endogenous SEPT2 or SEPT7 along the cilium from (F). SEPT2 or SEPT7 signals at cilia were normalised to the total cilia length. Three biological replicates, n > 90 cilia per sample and repetition.
Data information: Data show in (G) includes mean ± s.d.; P values are calculated by two‐tailed unpaired student t‐test.
Source data are available online for this figure.
As nocodazole treatment increased DS extension similar to SEPT2‐KD, we asked whether septin cilia localisation could be influenced by nocodazole. Interestingly, nocodazole treatment significantly reduced endogenous SEPT2 and 7 levels at the cilium in RPE1‐WT cells (Fig 3F and G), indicating that septin cilia localisation is partly influenced by the MT cytoskeleton.
Septins suppress DS extension
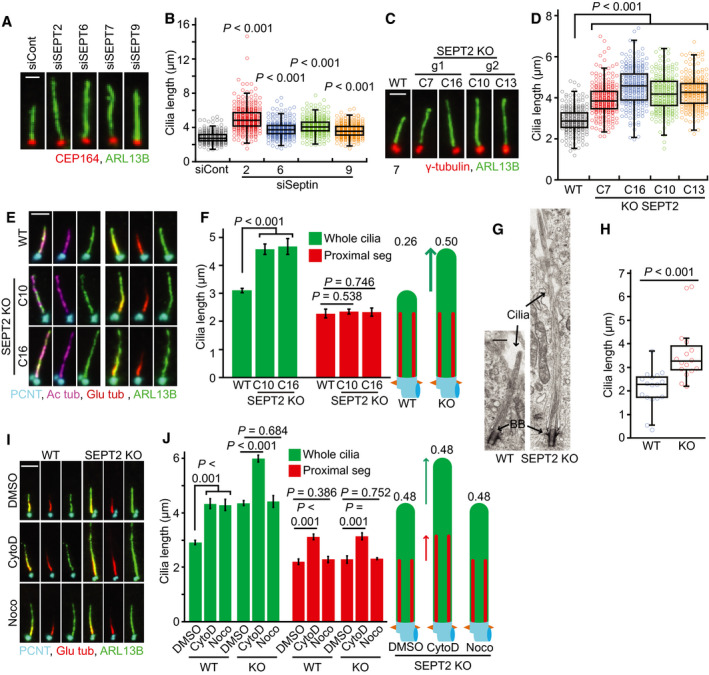
To test whether the effect on cilia elongation was limited to SEPT2, we compared cilia length upon depletion of SEPT2, SEPT6, SEPT7 and SEPT9 in RPE1 cells and in all cases, cilia were longer (Fig 4A and B, Appendix Fig S3A). In contrast to a previous study (Ghossoub et al, 2013), septin‐depleted cells were able to ciliate more efficiently than control‐depleted cells (Appendix Fig S3B). To exclude off‐target effects, we generated doxycycline (DOX) inducible constructs carrying siRNA‐resistant EGFP‐SEPT2, EGFP‐SEPT6 and SEPT7‐EGFP. EGFP‐SEPT6 localised along cilia similarly to SEPT2 and SEPT7 (Appendix Fig S3C). The rescue constructs reverted cilia length in SEPT2, 6 and 7 depleted cells (Appendix Fig S3D), excluding off‐target effects.
Figure 4. Septin negatively controls distal segment elongation in RPE1 cells.
-
A, BCilia length changes in RPE1 cells treated with the indicated siRNAs and 48 h SS stained with indicated antibodies. Representative images of cilia (A) and quantifications (B) are shown. Dot plots in (B) represent individual cilia. Scale bar: 1.5 µm. Three biological replicates, n = 100 cilia per sample and repetition.
-
C, DCilia length changes in RPE1 SEPT2‐KO single clones after 48 h SS stained with indicated antibodies. Representative images of cilia (C) and quantifications (D) are shown. Dot plots in (D) represent individual cilia. The parental cells (WT) and four KO clones (C7, C16, C10, C13) derived from two independent gRNAs (g1 and g2, as depicted in Appendix Fig 3E) were analysed. Three biological replicates, n > 80 cilia per sample and repetition. Scale bar: 2 µm.
-
E, FCilia segmentation in SEPT2‐KO‐ciliated cells serum‐starved for 48 h. Cells were immunostained with the indicated antibodies. Representative images (E) and quantifications of proximal segment (PS, Glu tub) and whole cilia (ARL13B) length (F) are shown. The numbers above the cartoons in (F) show the ratio of the calculated distal segment (DS)/whole cilia length. Scale bar: 2 µm. Three biological replicates, n = 100 cilia per sample and repetition.
-
GElectron microscopy of RPE1 WT and SEPT2‐KO cilia. Black arrows point to the axoneme and basal body (BB). Scale bar: 400 nm.
-
HQuantification of (G). Only cilia detected from bottom (BB) to tip in serial sections were quantified. N > 15 cilia from two independent experiments.
-
I, JRPE1 WT and SEPT2‐KO cells after 48 h SS were treated with solvent control (DMSO), cytochalasin D (CytoD) and/or nocodazole (Noco) for 3 h before immunostaining with the indicated antibodies. Representative images (I) and quantifications of PS (Glu tub) and whole cilia (ARL13B) length (J) are shown. The numbers above the cartoons in (J) show the ratio of the calculated DS/whole cilia length. Scale bar: 3 µm. Three biological replicates, n = 100 cilia per sample and repetition.
Data information: Data show in (B, D, F, H, J) include mean ± s.d.; P values are calculated by two‐tailed unpaired student t‐test (in F, J) or by unpaired Wilcoxon‐Mann–Whitney Rank Sum Test (in B, D, H).
Source data are available online for this figure.
Next, we constructed RPE1 SEPT2 knockout (KO) cells using a CRISPR/Cas9 approach. Using two different guide‐RNAs (gRNA), we obtained four distinct SEPT2‐KO clones (clones 7, 10, 13 and 16) that have completely lost endogenous SEPT2 (Appendix Fig S3E and F). All SEPT2‐KO cells produced longer cilia and showed higher ciliation rates compared with WT cells (Fig 4C and D, Appendix Fig S3G). Importantly, the cilia over‐elongation phenotype was rescued by EGFP‐SEPT2 expression (Appendix Fig S3H). Similar to siRNA depletion, only the DS was elongated in SEPT2‐KO cells (Fig 4E and F, Appendix Fig S3I). Longer cilia in SEPT2‐KO cells were also observed by electron microscopy (Fig 4G and H). Additionally, the treatment of SEPT2‐KO cells with nocodazole had no further effect on DS extension, whereas CytoD treatment elongated the DS and PS (Fig 4I and J). Similar to RPE1 cells, SEPT2 and SEPT7‐KD in NIH3T3 cells formed longer DS without any effect on ciliogenesis (Appendix Fig S3J–M). Nocodazole treatment in NIH3T3 SEPT2‐KD cells did not promote further DS elongation in comparison to the control (Appendix Fig S3N and O). Together, these data strongly indicate that septins are involved in length control of the ciliary DS in human RPE1 and mouse NIH3T3 cells.
Localisation of the ciliary‐capping protein KIF7 at cilia tip requires septin
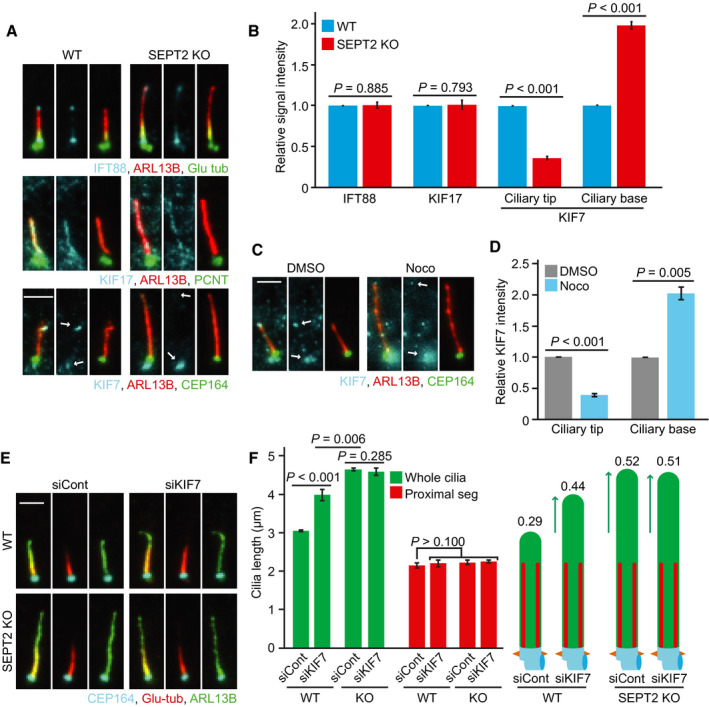
We reasoned that the elongated DS phenotype in septin loss could be a consequence of imbalanced localisation of promoters or inhibitors of cilia growth. One key factor is the IFT complex machinery, which works to bi‐directional transport components in and out of cilia (Snow et al, 2004; Prevo et al, 2017). We thus compared the amount of two IFT components, IFT88 and KIF17, at the cilium. The signal intensity of IFT88 and KIF17 along the axoneme showed no significant difference between RPE1‐WT and SEPT2‐KO cells (Fig 5A and B), suggesting that septins do not affect the localisation of IFT complexes along cilia.
Figure 5. Septin is required for the KIF7 accumulation at the cilia tip to suppress distal segment growth.
-
A, BRepresentative images show the localisation of IFT88, KIF17 and KIF7 in RPE1 WT and SEPT2‐KO cells after 48 h serum‐starvation (SS) stained with indicated antibodies (A) and quantification of the relative signal intensities for the indicated proteins (B). White arrows point to the base and tip localisation of KIF7. Scale bar: 3 µm. IFT88 and KIF17 signal intensities were normalised to the whole cilia length. KIF7 signal intensity was quantified at ciliary tip or base as indicated in (A) (white arrows). Three biological replicates, n > 80 cilia per sample and repetition.
-
C, DKIF7 localisation at the tip and base of cilia (indicated by arrows) in RPE1 cells after 48 h SS treated for 3 h with solvent control (DMSO) or nocodazole (Noco) and quantification of the relative signal intensities for the ciliary base and tip of KIF7 (D). Scale bar: 2 µm. KIF7 signal intensity was quantified at the ciliary tip or base as indicated in (C) (white arrows). Three biological replicates, at least 80 cilia per sample and repetition.
-
E, FRPE1 WT and SEPT2‐KO cells were treated with control or KIF7 siRNA after 48 h SS and immunostained with the indicated antibodies. Representative images (E) and quantifications of proximal segment (Glu tub) and whole cilia (ARL13B) length (F) are shown. The numbers above the cartoons in (F) show the ratio of the calculated distal segments /whole cilia length. Three biological replicates, n = 100 cilia per sample and repetition. Scale bar: 2 µm.
Data information: Data shown in (B, D, F) include mean ± s.d. and P values are calculated by two‐tailed unpaired student t‐test.
Source data are available online for this figure.
Next, we investigated the axoMT‐capping kinesin KIF7. KIF7 is a repressor of cilia elongation that binds to the distal end of axoMTs to stop their growth (He et al, 2014; Pedersen & Akhmanova, 2014; Lewis et al, 2017). KIF7 was also reported to influence the levels of axonemal poly‐glutamylated tubulin (He et al, 2014; Pedersen & Akhmanova, 2014; Lewis et al, 2017). KIF7 localised at the ciliary base and tip in RPE1 cells (Fig 5A). In SEPT2‐KO cells, KIF7 levels significantly decreased at the ciliary tip, whilst it accumulated at the ciliary base (Fig 5A and B). EGFP‐SEPT2 expression in SEPT2‐KO cells recovered KIF7 localisation at the ciliary tip (Appendix Fig S4A and B). The specificity of KIF7 localisation at cilia in RPE1 cells was proven using KIF7‐KD (Appendix Fig S4C and D). KIF7 at the ciliary tip was also reduced in NIH3T3 cells upon KIF7, SEPT2 and SEPT7‐depletion (Appendix Fig S4E and F). However, unlike RPE1 cells, KIF7 did not accumulate at the cilia base in NIH3T3 SEPT2 and SEPT7‐depleted cells (Appendix Fig S4E). Furthermore, KIF7 mis‐localisation was phenocopied in nocodazole‐treated RPE1 and NIH3T3 cells (Fig 5C and D, Appendix Fig S4G and H), suggesting that KIF7 might be the underlying mechanism for DS over‐elongation. To test this, we analysed KIF7‐KD in RPE1 and NIH3T3 cells. KIF7‐depletion did not alter ciliogenesis but extended the DS (Fig 5E and F, Appendix Fig S4I–L). Remarkably, KIF7 depletion in RPE1 SEPT2‐KO cells or SEPT2/KIF7 or SEPT7/KIF7 co‐depletion in NIH3T3 cells did not cause further DS elongation (Fig 5E and F, Appendix Fig S4K and L). Together, these data strongly indicate that septins are required for KIF7 cilia tip localisation, where KIF7 controls DS length. It also implies that septins, MTs and KIF7 most likely are part of the same pathway controlling DS elongation, with KIF7 functioning downstream of septins.
MKS3 and CEP290 require SEPT2 for their proper localisation at the TZ in RPE1 cells
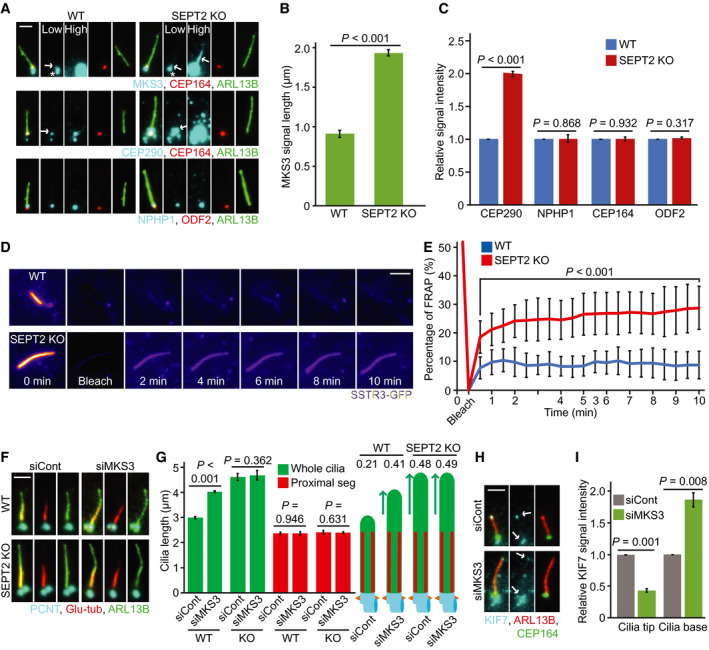
Considering that the TZ acts as a gate‐keeper to selectively control entry of ciliary components into the cilium (Lee et al, 2015; Garcia‐Gonzalo & Reiter, 2017), we asked whether it could be impaired in cells lacking septins. We investigated the localisation of TZ components MKS3, CEP290 and NPHP1 (Garcia‐Gonzalo & Reiter, 2017). In RPE1 cells, the specific MKS3 signal co‐localised with CEP164 at the ciliary base (Fig 6A, arrow), whilst a non‐specific signal was detected close to the basal body (Fig 6A, asterisk), as this signal did not disappear upon MKS3 depletion (Appendix Fig S5A and B). In SEPT2‐KO cells, the specific MKS3 signal dramatically extended from the base into cilia (Fig 6A and B). STED microscopy confirmed MKS3 mis‐localisation along the cilium in SEPT2‐KO cells (Appendix Fig S5C). CEP290 or NPHP1 did not extend along cilia (Fig 6A); however, the levels of CEP290 at the TZ significantly increased in SEPT2‐KO cells (Fig 6A and C). MKS3 and CEP290 mis‐localisation were recovered by EGFP‐SEPT2 expression in SEPT2‐KO cells (Appendix Fig S5D–F). CEP164 and ODF2 levels remained unaltered in SEPT2‐KO cells, suggesting that SEPT2‐KO does not affect basal body formation (Fig 6C). Furthermore, nocodazole treatment phenocopied SEPT2‐KO cells in mis‐localising MKS3 and CEP290 (Appendix Fig S5G–I). Strikingly, the analysis of NIH3T3 SEPT2 or SEPT7‐depleted cells revealed no defect in MKS3 or CEP290 localisation at the TZ (Appendix Fig S5J and K). Together, these data suggest that septins are required for proper TZ localisation of MKS3 and CEP290 in human RPE1 but not in mouse NIH3T3 cells.
Figure 6. Functional transition zone (TZ) allows to transfer KIF7 to the ciliary tip in RPE1 cells.
-
ALocalisation of MKS3, CEP290 and NPHP1 in RPE1 WT and SEPT2‐KO after 48 h serum‐starvation (SS) and immunostained with CEP164 (distal appendages), ODF2 (sub‐distal appendages), and ARL13B (cilia) antibodies. White arrows point to the specific signals for MKS3 or CEP290. The white star points to the unspecific MKS3 signal around the centrosome. Low and high exposure times for MKS3, CEP290 and NPHP1 are shown as indicated in the upper panel. Scale bar: 1 µm.
-
B, CQuantification of (A). The length obtained for MKS3 along the cilia (B) and the relative signal intensity of the indicated proteins at the ciliary base (C) are shown. Three biological replicates, n = 100 cilia per sample and repetition.
- D
-
EPercentage of normalised SSTR3‐GFP signal recovery at whole cilia after photobleaching from (D). n = 20 cilia are quantified from three biological replicates.
-
F, GInfluence of MKS3 depletion on cilia length of RPE WT and SEPT2‐KO cells. Cells were treated with the indicated siRNA and serum‐starved (SS) for 48 h before immunostaining with the indicated antibodies. Representative images (F) and quantifications of proximal segment (Glu tub) and whole cilia (ARL13B) length (G) are shown. The numbers above the cartoons in (G) show the ratio of the calculated distal segments/whole cilia length. Scale bar: 2 µm. Three biological replicates, n = 100 cilia per sample and repetition.
-
H, IA functional TZ is required for KIF7 cilia tip localisation in RPE1 cells. KIF7 signal intensities were measured in ciliated RPE1 cells treated with control or MKS3 siRNA and 48 h SS. Representative images (H) and quantification of KIF7 signal intensity at the base and tip of cilia (H) are shown. Scale bar: 2 µm. Three biological replicates, at least 60 cilia per sample and repetition.
Data information: Data shown in (B, C, E, G, I) include mean ± s.d. and P values are calculated by two‐tailed unpaired student t‐test.
Source data are available online for this figure.
Next, we used fluorescence recovery after photobleaching (FRAP) analysis to determine the integrity of the TZ. The depletion of SEPT2 in IMCD3 cells was shown to increase the turnover of the membrane protein SSTR3‐GFP at the cilium (Hu et al, 2010). FRAP analysis using RPE1 and RPE1 SEPT2‐KO cells stably expressing SSTR3‐GFP showed a higher recovery rate for SSTR3‐GFP at cilia in SEPT2‐KO cells (Fig 6D and E, Movies EV1 and EV2), indicating that the lack of SEPT2 impairs the function of the TZ in RPE1 cells.
Depletion of MKS3 causes DS over‐elongation and loss of KIF7 at the ciliary tip
We next asked whether TZ impairment by MKS3 depletion would phenocopy SEPT2 deletion but not exacerbate the phenotype in SEPT2‐KO cells. MKS3‐depleted RPE1 cells dropped MKS3 signals at the TZ without decreasing the ciliation rate (Appendix Fig S5A, B and L). MKS3‐KD significantly extended only the DS in WT but not SEPT2‐KO cells (Fig 6F and G), implying that a functional TZ might contribute to DS hyper‐elongation observed in SEPT2‐KO cells. In agreement with this assumption, MKS3‐KD diminished KIF7 levels at the ciliary tip and increased KIF7 levels at the ciliary base in RPE1 cells (Fig 6H and I).
We next tested whether MKS3 depletion influences KIF7 localisation in NIH3T3 cells. MKS3‐KD in NIH3T3 cells was efficient and did not influence ciliogenesis compared with control cells (Appendix Fig S5M–O). MKS3 depletion led to comparable DS extension in WT and SEPT2‐KD cells (Appendix Fig S5P and Q). Additionally, KIF7 at the ciliary tip was markedly decreased in cells lacking MKS3 (Appendix Fig S5R and S).
Together, our data indicates that septins and MKS3 are required for proper KIF7 cilia localisation and control of DS length.
Overgrown cilia dynamically change their length and lose stability in the absence of septins
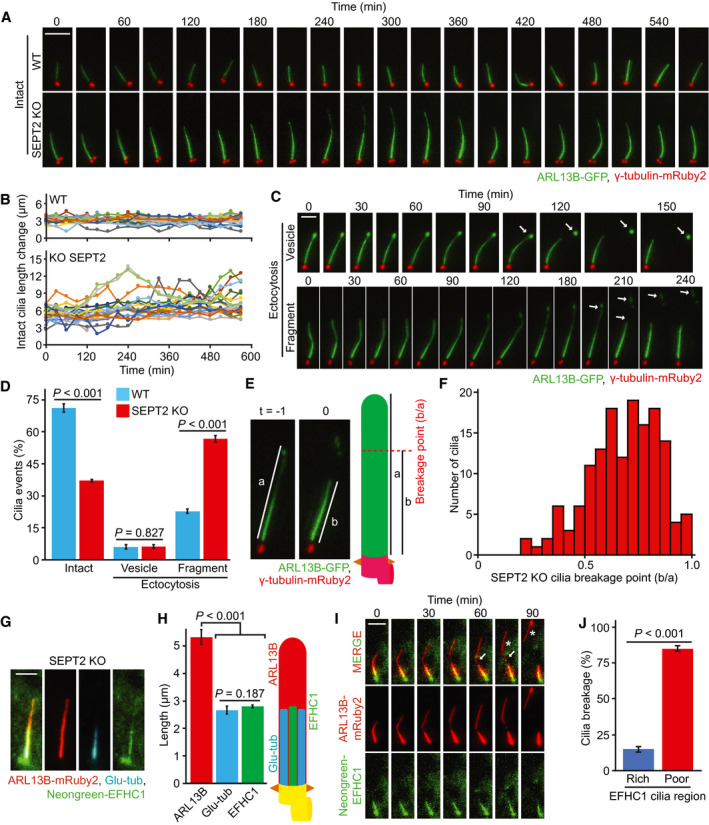
To gain insight into DS behaviour, we generated RPE1‐WT and SEPT2‐KO cells co‐expressing ARL13B‐GFP and γ‐tubulin‐mRuby2 to label the cilium and basal body, respectively. Cells were first allowed to ciliate before being subjected to live‐cell imaging (Fig 7A, Movies EV3 and EV4). WT cilia maintained an average length around 3 µm and the speed of cilia growth and shortening was nearly balanced (Fig 7A and B, Appendix Fig S6A). In contrast, SEPT2‐KO cilia showed high length variations (Fig 7A and B, Appendix Fig S6A), which returned back to WT dynamics upon EGFP‐SEPT2 expression (Appendix Fig S6B–D, Movies [Link], [Link], [Link], [Link]). During the time of inspection, we also observed the release of vesicles or larger cilia fragments from the cilia tip through a process known as ectocytosis (Wood et al, 2013; Nager et al, 2017) (Fig 7C, Movies [Link], [Link] and [Link], [Link]). The release of vesicles, hereafter referred to as vesicle (v)‐ectocytosis was equally frequent in WT and SEPT2‐KO cells (Fig 7D, Movie EV9). In cells with longer cilia, we observed breakage of larger cilia fragments, hereafter referred to as fragment (f)‐ectocytosis (Fig 7C and D and Movie EV10). The percentage of (f)‐ectocytosis events was significantly increased in SEPT2‐KO compared with WT cells (Fig 7D) and complementation analysis confirmed that they were related to EGFP‐SEPT2 expression (Appendix Fig S6E). Fluctuations in cilia length and high incidence of (f)‐ectocytosis events were also observed when using SEPT2‐KO cells stably expressing SSTR3‐GFP as an alternative cilia marker (Appendix Fig S6F–I and Movies EV11 and EV12), indicating that the observed phenotypes were not a consequence of ARL13B‐GFP expression.
Figure 7. Over‐extended distal segments are more prone to undergo ectocytosis.
- A
-
BQuantification of (A) showing changes in cilia length during time‐lapse imaging. Three biological replicates, 10 cilia per sample and repetition.
- C
-
DPercentage of cilia that remained intact or underwent ectocytosis during live‐cell imaging from (A) and (C). Three biological replicates, n > 100 cilia per sample and repetition.
-
E, FDetermination of the cilia breakage point during live‐cell imaging of RPE1 SEPT2‐KO‐ciliated cells. The ectocytosis point was calculated by dividing the cilia length at the time of breakage (b, t0) by the length of the cilium one time‐point prior to t0 (a, t‐1), as depicted in (E). The graph in (F) shows that breaking points (b/a) higher than 0.5 (i.e. breakage towards the cilia tip) are more frequent. Three biological replicates, n = 50 cilia per sample and repetition.
-
G, HRPE1 SEPT2‐KO cells expressing ARL13B‐mRuby2 and Neongreen‐EFHC1 after 48 h SS and immunostained with Glu‐tub antibody. Representative images (G) and quantifications of proximal segment (Glu tub), EFHC1 and whole cilia (ARL13B) length (H) are shown. Three biological replicates, n = 100 cilia per sample and repetition. Scale bar: 2 µm.
-
ITime‐lapse images of RPE1 SEPT2‐KO cells stably expressing ARL13B‐mRuby2 and Neongreen‐EFHC1. Cells were serum‐starved for 32 h before the beginning of inspection and imaged every 15 min for 9.5 h. The point of ectocytosis and the fragmented cilia are indicated by the white arrow and star, respectively. Scale bar: 5 µm. For videos, see Movie EV13.
-
JQuantification of (I) showing that (f)‐ectocytosis mainly occurs at EFHC1‐poor region of cilia during time‐lapse imaging. Three biological replicates, 50 cilia per sample and repetition.
Data information: Data shown in (D, H, J) include mean ± s.d. and P values are calculated by two‐tailed unpaired student t‐test.
Source data are available online for this figure.
Next, we analysed the cilia (f)‐ectocytosis phenotype in detail. We hypothesised that the higher rate of cilia (f)‐ectocytosis in SEPT2‐KO cells could be linked to DS over‐extension. Previous studies reported that the DS is structurally weaker than the PS due to its lower number of axoMTs and fewer structure‐strengthening tubulin modifications (Gadadhar et al, 2017; Sun et al, 2019; He et al, 2020). To determine the breakage point, we made use of live‐cell images to calculate the (f)‐ectocytosis point (t = 0) in respect to the total cilia length shortly before breakage (t = −1; Fig 7E). The quantifications show that (f)‐ectocytosis happened closer to the cilia distal end (Fig 7F), indicating that increased (f)‐ectocytosis events in SEPT2‐KO cells might be a consequence of a higher number of cilia with over‐extended DS.
To confirm the breakage point of (f)‐ectocytosis in SEPT2‐KO cells, we thought of establishing a marker for the proximal region of the primary cilium that is compatible with live‐cell imaging. For this, we first investigated the localisation of the EF‐hand domain containing protein EFHC1 in RPE1 cells, as GFP‐EFHC1 was shown to be enriched at the PS of mammalian olfactory sensory neurons (Williams et al, 2014). The co‐localisation of ARL13B, EFHC1 and polyglutamylated tubulin in RPE1 SEPT2‐KO cells stably expressing ARL13B‐mRuby2 and Neongreen‐EFHC1 indicated that EFHC1 was indeed enriched at the polyglutamylated‐tubulin rich PS (Fig 7G and H). The live‐cell imaging inspection of RPE1 SEPT2‐KO ARL13B‐mRuby2 and Neongreen‐EFHC1 cells revealed that the cilia breakage point was outside the EFHC1 enriched region (Fig 7I and J, Movie EV13), confirming that (f)‐ectocytosis takes place at the DS.
In agreement with the conclusion that cilia with abnormal longer DS are more prone to breakage, we also observed a significant increase in (f)‐ectocytosis events when DS over‐extension was induced by nocodazole treatment or upon MAP4, KIF7 or MKS3 depletion (Appendix Fig S6J and K). No increase in (f)‐ectocytosis events was obtained upon CytoD treatment or upon depletion of KIF17 or CCP5, in which the DS was either decreased (KIF17‐KD) or the 30% ratio was maintained (CCP5‐KD, see Fig 2C and D; Appendix Fig S6J and K).
Together, our data indicate that septins are required for cilia length maintenance and prevention of DS instability. It also highlights the importance of keeping a proper DS ratio for cilia stability.
Balancing DS length by septins is crucial for SHH activation
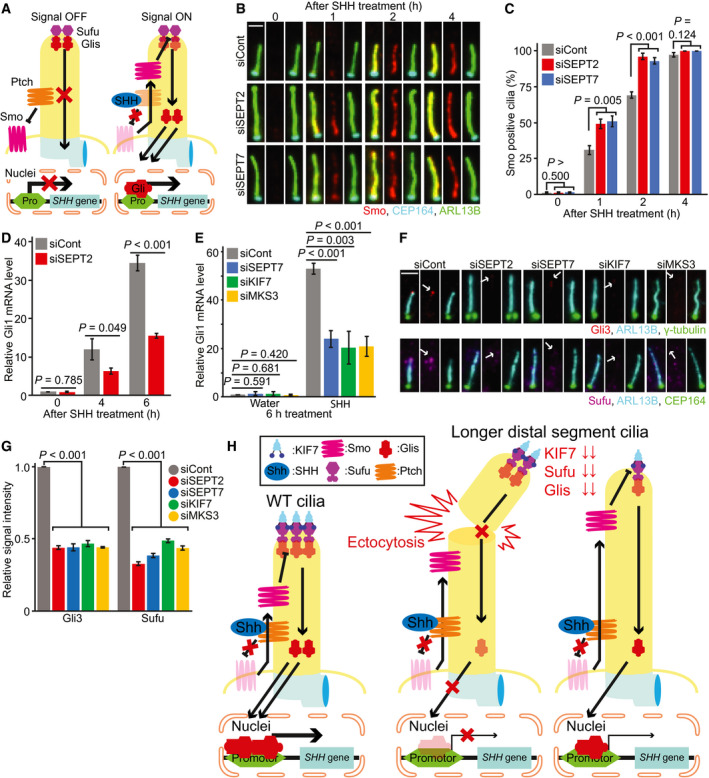
Sonic‐hedgehog is an established signalling pathway that requires primary cilia for signal transduction in mammalian cells (Ishikawa & Marshall, 2011; Nachury, 2014) (Fig 8A). We therefore asked whether septins and DS ratio perturbators, including KIF7 and MKS3, influenced SHH signalling. These studies were done in NIH3T3 cells, which promptly respond to SHH pathway activation after addition of recombinant SHH‐ligand (He et al, 2014; Guo et al, 2018). One of the first events that occurs after binding of SHH‐ligands to the receptor Patched‐1 (Ptch) is the translocation of the SHH activator Smoothened (Smo) to the cilium (Nachury, 2014; Pedersen et al, 2016). In control‐depleted cells, cilia accumulation of Smo started shortly after SHH‐ligand stimulation and reached a maximum after 4 h (Fig 8B and C). In SEPT2 and SEPT7‐depleted cells, the number of Smo‐positive cilia was higher compared with control cells at early time points (1–2 h, Fig 8B and C). Percentages of Smo‐positive cilia were also increased in MKS3 but not KIF7‐KD cells after 2 h of SHH‐ligand stimulation (Appendix Fig S7A and B). Thus, Smo entrance to the cilium is accelerated in SEPT2 and MKS3 lacking cells bearing cilia with longer DS.
Figure 8. Balancing distal segment length is vital for sonic hedgehog signal transduction.
-
ASchematic representation showing the localisation of SHH components at the cilium in the OFF and ON state (Wheway et al, 2018). See text for details.
-
B, CSmo translocation to the cilium changes in the presence or absence of septins. NIH3T3 cells with control, SEPT2 or SEPT7 siRNAs and 48 h serum‐starvation (SS) were treated with SHH‐ligands for 0, 1, 2 and 4 h. Smo translocation into the cilium was followed over time using the indicated antibodies. Representative images (B) and quantifications (C) are shown. Scale bar: 2 µm. Three biological replicates, n > 100 cilia per sample and repetition.
-
DRelative Gli1 mRNA level changes in control and SEPT2 siRNA‐treated NIH3T3 cells. Changes in mRNA level were determined by RT‐PCR after 0, 4 and 6 h of SHH‐ligand addition to ciliated NIH3T3 cells. Three biological replicates.
-
ERelative Gli1 mRNA level changes in indicated siRNA‐treated NIH3T3 cells. Changes in mRNA level were determined by RT‐PCR after 6 h of SHH‐ligand or water addition to ciliated NIH3T3 cells Three biological replicates.
-
F, GEffect of septins, KIF7 or MKS3 depletion on the localisation of Gli3 and Sufu at the cilia tip. NIH3T3 cells were treated with the indicated siRNAs and 48 h SS. Representative images (F) and quantifications of Gli3 and Sufu at the cilia tip (G) are shown. White arrows in (F) point to the specific signal of the indicated proteins at the cilia tip. Scale bar: 2 µm. Three biological replicates, n = 100 cilia per sample and repetition.
-
HModel depicting the role of longer distal segments on cilia stability and signalling. See text for details.
Data information: Data shown in (C, D, E, G) include mean ± s.d. and P values are calculated by two‐tailed unpaired student t‐test.
Source data are available online for this figure.
We asked whether SHH activation downstream of Smo was also faster in SEPT2 absence. For this, we analysed Gli1 transcription factor mRNA levels using real‐time quantitative (RT)‐qPCR. It is well established that Gli1 mRNA levels rapidly increase upon SHH activation (Haycraft et al, 2005; Shi et al, 2015; Taylor et al, 2015). An increase in Gli1 mRNA levels was observed for control and SEPT2‐depleted cells after SHH‐ligand stimulation in comparison to non‐stimulated cells (0 h, Fig 8D). However, Gli1 mRNA levels were significantly lower in cells lacking SEPT2 compared with the control after SHH application (4–6 h, Fig 8D). Similar results were obtained for SEPT7, MKS3 and KIF7 depletion (Fig 8E), suggesting that SHH activation is less effective without these components.
To understand the reason for weaker SHH transcriptional activation, we checked the intermediate SHH components: the suppressor of fused (Sufu) and transcription factor Gli3, which are recruited to the cilium and accumulate at the cilia tip (Fig 8A) (Haycraft et al, 2005; Tukachinsky et al, 2010; Cherry et al, 2013; He et al, 2014; Nachury, 2014; Pedersen et al, 2016). We measured the levels of Sufu and Gli3 at the ciliary tip in cells lacking SEPT2, SEPT7, KIF7 and MKS3 (Fig 8F). In comparison to control cells, Gli3 and Sufu levels dramatically decreased at the ciliary tip in all conditions (Fig 8F and G). Interestingly, similar results were obtained in cells treated with nocodazole but not CytoD (Appendix Fig S7C and D), implying that like the other components tested, MT perturbation interferes with Sufu and Gli3 localisation at the ciliary tip.
Together, our data suggest the control of DS length might be required for Sufu and Gli3 cilia localisation and effective SHH activation.
Discussion
The primary cilium has emerged as an important organelle that controls signal transduction during development and tissue homeostasis. Both short or abnormally elongated cilia have been reported in patients with ciliopathies and contribute to dysfunctional signalling, highlighting the importance of understanding cilia length regulation (Baala et al, 2007; Aguilar et al, 2012; Oh & Katsanis, 2013; Kim et al, 2018; Ramsbottom et al, 2018). Whereas the majority of studies were so far dedicated to the analysis of cilia assembly and disassembly, still little is known about how cilia length is maintained at steady‐state (Keeling et al, 2016; Wang & Dynlacht, 2018; Wang et al, 2021). Here, we characterised cilia behaviour based on different cilia markers and established septins as important regulators of cilia length, in particular in the stability of the DS in human and mouse cells.
Analysis of cilia segmentation based on cilia membrane localisation and tubulin glutamylation indicated that RPE1 and NIH3T3‐ciliated cells contain polyglutamylated‐rich and ‐poor regions, referred to as the PS and DS, respectively. Our data suggest that the DS is formed after PS elongation, implying a time‐dependent maturation of the cilium. At steady‐state, the DS of RPE1 and NIH3T3 cilia reached approximately 30% of the entire cilia length, whilst the remaining 70% were formed by the PS. Intriguingly, treatments leading to cilia over‐elongation disturbed this ratio in different ways. For instance, low doses of nocodazole or depletion of cilia proteins DYNC2L1, KIF3A, MAP4, SEPT2 or MKS3 led to DS elongation without affecting PS length. As a consequence, the DS:PS ratio was shifted to 50:50 under these conditions. On the other hand, actin depolymerisation by CytoD or CCP5 depletion also increased PS length; however, the DS:PS ratio remained at 30:70. Although the cilium was overall longer under all these conditions, the main difference was a change in the DS:PS ratio. Our data suggest that keeping a balanced DS:PS ratio might be key for determining cilia stability and behaviour. In all conditions analysed here in which the DS exceeded 30% of cilia length, we observed an increase in ectocytosis events releasing larger cilia fragments. We did not observe increased ectocytosis in CytoD‐treated and CCP5‐KD cells, in which the cilium was hyper‐elongated yet the DS:PS ratio of 30:70 was preserved. This indicates that cilia have a built‐in ruler that measures and adjusts the relative length of ciliary subdomains to maintain its stability. The abnormal hyper‐elongation of the DS might create fragile axonemal regions which are more prone to be ectocytosed. Interestingly, the suppression of ectocytosis was shown to be important for the biogenesis of photoreceptor cilia, which contains a long specialised axoneme outer segment with many membrane‐forming discs (Salinas et al, 2017; Spencer et al, 2020). This implies that mechanisms influencing ectocytosis might be in place to promote cilia function in different cell‐type‐specific contexts.
Septins were reported as positive regulators of cilia formation acting at the ciliary base in IMCD3 cells or along the axoneme in RPE1 cells. In both cases, septins were proposed to control ciliary composition and MT behaviour by either functioning as a diffusion barrier at the base of the cilium or competing with MAP4 for axoneme binding (Ghossoub et al, 2013). Our study revises these models and now reveals that septins are involved in controlling DS stability. Several lines of evidence support this conclusion. The depletion of multiple septins in RPE1 and NIH3T3 cells led to cilia DS over‐extension. This phenotype was recapitulated using distinct RPE1 SEPT2‐KO cell lines. In all cases, cilia over‐extension was rescued by exogenous septin‐carrying constructs, implying that the effect on cilia length control was specific to septins. Moreover, electron microscopy confirmed the presence of hyper‐elongated cilia in SEPT2‐KO cells. Live‐cell imaging revealed an increased rate of cilia elongation and of ectocytosis of larger DS parts, leading to rapid cilia shortening. These data contrast from the previous conclusion that septin depletion generally leads to assembly of shorter cilia. One possibility is that septins might play different roles depending on cell type. Alternatively, as previous studies mainly used end‐point analysis of fixed samples, we envisage that experimental conditions during sample handling could exacerbate cilia breakage in septin‐less cells, masking the initial DS hyper‐elongation phenotype. Nevertheless, these data agree with the fact that septins play an important role in cilia maintenance by keeping the proper cilia length at steady‐state.
Our data support the model that septins restrict DS elongation by promoting localisation of KIF7 (Fig 8H). KIF7 was shown to bind to the plus‐end of MTs at the ciliary tip, forming a cap structure that restricts axoMTs extension (He et al, 2014). Loss of KIF7 at the ciliary tip in cells lacking septins most likely accounts for DS de‐regulation. In human cells, KIF7 accumulated at the ciliary base, implying a TZ defect. The mis‐localisation of MKS3, CEP290 (this study) and TMEM231 (Chih et al, 2012) as well as the faster cilia recovery rate for the membrane protein SSTR3 in RPE1 SEPT2‐KO cells argues in favour of our hypothesis. Furthermore, MKS3‐KD in RPE1 and NIH3T3 cells caused DS over‐elongation and KIF7 loss from the ciliary tip, emphasising that a functional TZ is essential for proper control of KIF7 localisation and cilia growth.
How do septins contribute to TZ assembly and KIF7 localisation? Septins localise along the cilia in RPE1 cells, but not equally. The co‐localisation analysis of SEPT2 and TZ components showed that SEPT2 levels were lower at the TZ in comparison to other segments. One possibility is that septins create a membrane diffusion barrier at the cilia to confine TZ components in place. This function would be in line with the fact that membrane‐bound TZ components, MKS3, CEP290 and TMEM231, failed to be retained at the ciliary base and extended along the cilia (this study) (Chih et al, 2012). However, as mis‐localisation of KIF7 but not TZ components was observed in NIH3T3 cells, it is possible that septins contribute to KIF7 cilia localisation independently of its function in TZ organisation. Septins are widespread in the cytoplasm of RPE1 cells (Ghossoub et al, 2013). As integral components of the cytoskeleton, septins were shown to associate with actin and microtubules, and regulate different aspects of cytoskeleton dynamics (Spiliotis & Nakos, 2021). It is thus feasible that septins fulfil functions outside the cilium that could influence KIF7 protein transport to the basal body. Alternatively, loss of KIF7 at the cilia tip could be a consequence of increased ectocytosis in the absence of septins. In this case, septins would help to maintain KIF7 at the cilia tip by suppressing ectocytosis.
By analysing components of the SHH signalling pathway, we observed different behaviour of SHH components in response to longer‐DS‐forming cells. Shortly after SHH activation, SMO entered the cilium in both control and septins‐, KIF7‐ and MKS3‐depleted conditions, showing responsiveness to SHH activation. However, the Gli and Sufu levels at the ciliary tip were drastically decreased in the absence of those genes, most likely explaining the impairment in the downstream activation of SHH when using Gli1 mRNA levels as a read‐out. KIF7 physically interacts with Glis, Sufu and Smo to modulate their function in signalling transduction (Cheung et al, 2009; Endoh‐Yamagami et al, 2009; Chih et al, 2012; Li et al, 2012). The lack of KIF7 at the cilium in cells lacking septins could explain the reduction in the downstream SHH signalling response.
Analysis of cilia derived from patients carrying ciliopathies, such as Meckel and Joubert syndrome, show that inactivating mutations of MKS3 and CEP290, respectively, form abnormally elongated cilia (Tammachote et al, 2009; Srivastava et al, 2017; Ramsbottom et al, 2018) and severe defects in Shh pathway activity (Aguilar et al, 2012). Our live‐cell images indicate that cells with abnormally elongated cilia cannot stabilise the cilia, leading to increased distal breakage, where most of the signalling receptors accumulate (Haycraft et al, 2005; Nager et al, 2017; Wheway et al, 2018). It is thus tempting to speculate that abnormally long cilia might impair signalling through increased ectocytosis events and loss of signalling receptors from the cilium.
Cilia length was shown to vary depending on the cell type (Besschetnova et al, 2010; Qiu et al, 2012; Wann & Knight, 2012; Miyoshi et al, 2014). It will be interesting to determine whether the 30:70 DS:PS ratio also applies to various types of primary cilia and whether mutations that perturb this ratio lead to cilia instability and signalling activation impairment, similar to the phenotypes described here for human and murine epithelial cells.
Materials and Methods
Plasmids and reagents
Plasmids used in this study are listed in Appendix Table S1. Human SEPT2 (BC014455), SEPT6 (BC009291) and EFHC1 (BC020210) cDNA were obtained from DKFZ (Clone 121547190, 121516346 and 175964374, respectively). Human SEPT7 (BC093642.1) was purchased from Dharmacon (Cat. MHS6278‐211688440). For siRNA rescue experiments in RPE1 cells, siRNA‐resistant SEPT2, SEPT6 and SEPT7 GFP‐fusion constructs were generated by introducing three silent point‐mutations at the siRNA targeting sites by site‐directed PCR mutagenesis (Appendix Tables S1 and S2). All reagents and media were purchased from Sigma‐Aldrich unless specified otherwise. Recombinant Human SHH Protein for SHH pathway activation was purchased from R&D systems.
Cell culture and treatments
Tet3G integrated human telomerase (hTERT)‐immortalised retinal pigment epithelial cells (RPE1‐Tet3G) (Hata et al, 2019) (kind gift from Elmar Schiebel, University of Heidelberg, Germany) were cultured in DMEM/F12 supplemented with 10% foetal bovine serum (FBS, Biochrom), 2 mM l‐glutamine (Thermo Fischer Scientific) and 0.348% sodium bicarbonate. Mouse immortalised fibroblast NIH3T3 cells (ATCC, CRL‐1658) were grown in DMEM high glucose supplemented with 10% new‐born calf serum (NCS, PAN‐Biotech). HEK293T (ATCC CRL‐3216) and GP2‐293 cells (Takara Bio, Cat. 631458) were maintained in DMEM high glucose supplemented with 10% FBS. All cell lines were grown at 37°C with 5% CO2. siRNA‐based gene knockdown was performed with Lipofectamine RNAiMAX transfection reagent (Thermo Fischer Scientific) and 20 nM (final concentration) of corresponding siRNAs accordingly to the manufacture protocol. The list of siRNAs used in this study can be found in Appendix Table S2.
For induction of ciliogenesis, cells were seeded in 24‐well plates (30.000 cells/well) in serum‐rich media. Twenty‐four hours after seeding, the medium was exchanged to medium lacking FBS (RPE1) or containing 0.5% NCS (NIH3T3). Cultures were inspected up to 48 h after serum‐starvation. For cilia analysis after gene knockdown, treatment of cells with siRNA was done 24 h prior to serum‐starvation. For chemical treatments, cells were serum‐starved for 48 h following treatment with DMSO (solvent control), Cytochalasin D (final concentration: 200 nM) and/or nocodazole (final concentration: 100 nM) for 3 h before inspection. For Shh pathway activation, NIH3T3 cells were serum‐starved for 48 h and treated with 50 pM Shh‐ligand (final concentration) for the indicated time points.
Generation of stable cell lines
Stable RPE1‐Tet3G cell lines were generated by virus‐based gene integration. HEK293T or GP2‐293 cells were used for lentivirus or retrovirus production using polyethyleneimine (PEI 25000, Polysciences). Supernatants containing lentiviral and/or retroviral particles were applied to RPE1‐Tet3G‐derived host cells for 24 h. The following cell lines were generated: RPE1‐Tet3G constitutively expressing ARL13B‐GFP and γ‐Tubulin‐mRuby2; RPE1‐Tet3G constitutively expressing SSTR3‐GFP and γ‐Tubulin‐mRuby2; RPE1‐Tet3G constitutively expressing ARL13B‐mRuby2; RPE1‐Tet3G constitutively expressing ARL13B‐mRuby2 and Neongreen‐EFHC1; RPE1‐Tet3G expressing siRNA‐resistant EGFP‐SEPT2, EGFP‐SEPT6 or SEPT7‐EGFP under control of the inducible Tet‐promoter; RPE1‐Tet3G ARL13B‐mRuby2 with siRNA‐resistant EGFP‐SEPT2 under control of the inducible Tet‐promoter. Low levels of fluorescence positive cells were sorted by fluorescence activated cell sorting (FACS; BD FACS Aria III, Becton Dickinson). For cell lines expressing constructs under the Tet‐promoter, cells were sorted for low GFP expression levels 24 h after treating the cells with 10 ng/ml doxycycline.
Generation of knockout cell lines by CRISPR/Cas9 system
CRISPR/Cas9‐mediated chromosomal deletion was used for generating knockout human SEPT2 cells in RPE1 Tet3G cells. Two gRNAs targeting human SEPT2 exon 4 (5′‐ggggttcgagttcactctgatgg‐3′) and 6 (5′‐ccggctacggggatgccatcaac‐3′) were cloned into Cas9 system expression plasmid pX458 to generate pTK58 and pTK60 (Appendix Table S1). RPE1 Tet3G cells were transfected with pTK58 or pTK60 by electroporation (Neon® Transfection System) according to the manufacture's protocol. One day after electroporation, GFP positive cells were FACS‐sorted and subjected to single cell dilutions. Single clones were allowed to expand for 10–14 days before they were subjected to immunoblotting to check SEPT2 protein levels as well as genomic amplification followed by cloning into pJET vector (Thermo Fischer Scientific). The plasmids were then sequenced to identify clones containing two SEPT2‐mutated alleles with premature stop codons (Individual clone information is shown in Appendix Fig S3E). Two independent clones were selected per gRNA for further analysis.
Antibodies
Primary antibodies used in this study can be found in Appendix Table S3. Secondary antibodies used for wide‐field microscopy were purchased from Thermo‐Fisher Scientific and included: goat anti‐rabbit, anti‐mouse or anti‐guinea pig conjugated to Alexa Fluor 350, 488, 594 or 647 (1:500 dilution); donkey anti‐rabbit, anti‐mouse or anti‐goat conjugated to Alexa 488, 555 and 594 (1:500 final dilution). For STED microscopy, anti‐rabbit Atto594 (1:100 dilution) and anti‐mouse Star635p (1:100 dilution) were purchased from Sigma and Abberior, respectively. Secondary antibodies for immunoblotting were horseradish peroxidase conjugated goat anti‐rabbit or anti‐mouse antibodies (1:1,000 dilution; purchased from Jackson ImmunoResearch).
Immunofluorescence microscopy
Cells were cultured on coverslips (No. 1.5, Thermo Fischer Scientific) and fixed for immunofluorescence (IF) as following: cells carrying EGFP‐tagged septins, ARL13B‐mRuby2, ARL13B‐GFP, SSTR3‐GFP and Neongreen‐EFHC1 were fixed in 3% paraformaldehyde (PFA) at room temperature for 5 min and cold methanol at −20°C for 5 min; in all other experiments, cells were only fixed in cold methanol at −20°C for 5 min. After fixation, cells were treated with phosphate buffer (PBS) containing 3% BSA (Jackson Immuno Research) and 0.1% Triton X‐100 (blocking solution) for 30 min at room temperature in a wet‐chamber. Blocked samples were incubated with diluted primary antibodies for 1 h at room temperature. After washing with PBS, samples were incubated with secondary antibodies for 30 min at room temperature. For DNA stainings, DAPI (4′, 6‐diamidino‐2‐phenylindole) at a final concentration of 1 µg/ml was added to the secondary antibody dilution. All antibodies were diluted in blocking solution. Coverslips were mounted with Mowiol (EMD Millipore).
Wide‐field fluorescence microscopy images were acquired as Z‐stacks using these microscopes; Nikon Eclipse Ti2 Inverted Microscope Systems with Plan Apo 40×/0.95 and 60×/0.45 Oil objectives and an IRIS9 Scientific CMOS camera operating Nikon NIS‐Elements Imaging Software; Zeiss Axiophot with 63× NA 1.4 Plan‐Fluor oil immersion objective, and Cascade:1K EMCCD camera operating MetaMorph software; Zeiss Axio Observer Z1 with 63× NA 1.4 Plan‐Apochromat oil immersion objective, and AxioCam MRm CCD camera operating ZEN software. For cilia length measurements and the number of ciliated cells, quantifications were done using Z‐stacked max‐signal intensity projected images. For determination of PS length, strong and weak polyglutamylated tubulin‐stained regions (stained with GT335 antibody) were considered. Relative fluorescence intensities of targeted proteins were quantified using Fiji ImageJ software (Schindelin et al, 2012). Signal intensities were normalised by dividing to control average intensities of each experiment.
STED images were acquired on Leica TCS SP8 STED 3X super‐resolution microscope platform mounted on Leica DMi8, inverted microscope with HC PL APO 100×/1.40 STED White Oil objective, 2 Hybrid GaAsp detectors (HyD) and 2 PMTs. The imaging software was controlled by Leica Application Suite 3 (LAS) and image processing was performed by Huygens deconvolution pro and Fiji.
Images were adjusted for contrast or brightness in Fiji. Figures were assembled in Adobe Photoshop and Illustrator CS3 (Adobe).
Electron microscopy
RPE1‐Tet3G and RPE1‐Tet3G SEPT2‐KO cells were serum‐starved for 48 h to induce ciliogenesis. Cells were rinsed with 100 mM PBS three times and then fixed with a mixture of 2.5% glutaraldehyde, 1% PFA and 2% sucrose in 50 mM cacodylate buffer for 30 min at room temperature. The fixative was washed out with 50 mM cacodylate buffer. After post‐fixation with 2% OsO4 for 1 h at 4°C in darkness, cells were rinsed four times with water and incubated overnight at 4°C in aqueous 0.5% uranyl acetate solution. On the following day, coverslips were washed four times with water and dehydrated with consecutive incubations in ethanol solutions (40, 50, 70, 80, 90, 95, 100%). Coverslips were immediately placed on EM‐capsules filled with Spurr resin and allowed to polymerise at 60°C for 24–48 h. Embedded cells were sectioned using a Reichert Ultracut S Microtome (Leica Instruments, Vienna, Austria) to a thickness of 80 nm. Post‐staining was performed with 3% uranyl acetate and lead citrate. Serial‐sections were imaged at a Jeol JE‐1400 (Jeol Ltd., Tokyo, Japan), operating at 80 kV, equipped with a 4k × 4k digital camera (F416, TVIPS, Gauting, Germany). Micrographs were adjusted in brightness and contrast using Fiji.
Immunoblotting
For immunoblot analysis, whole cell lysates were obtained by incubating the cell pellets with 8 M Urea containing benzonase (1:1,000 dilution) at room temperature for 1 h. The protein concentration was measured using Bradford reagent accordingly to manufacturer's instructions. Equal amount of protein was loaded on SDS–PAGE. Separated proteins were transferred onto PVDF membranes, then blocked for 30 min in PBS containing 5% milk and 0.1% Tween‐20. Membranes were incubated with primary (4°C overnight) and secondary antibodies (1 h, room temperature) dilutions and proteins were visualised with enhanced chemiluminescence (ECL; Pierce; Thermo Fisher Scientific). For loading control, detection of actin was performed on stripped membranes (Stripping solution: 1% SDS, 0.2 M Glycine pH 2.5 in water).
Live‐cell imaging
For live‐cell imaging, cells were cultured in HEPES‐buffered DMEM/F12 supplemented with 10% FBS, 1% l‐glutamine and 1% penicillin–streptomycin without phenol red (ThermoFischer) in glass‐bottom CELLview culture dishes (Greiner Bio‐One) for 24 h and serum‐starved for 32 h. Dishes were mounted in a pre‐heated microscope chamber and live cell imaging was performed over a period of 15 h at 37°C with 5% CO2. 3D‐Images (8 z‐stacks of 6 µm spacing) were acquired by the Nikon/Andor TuCam system mounted with the Andor Neo sCMOS camera and a Nikon Plan Apo VC 60× NA 1.4 oil immersion objective every 15 min. For chemical treatment, 200 nM Cytochalasin D or 100 nM nocodazole was added 30 min before imaging. For rescue experiments, 10 nM of doxycycline was added to induce EGFP‐SEPT2 protein expression when cells were initially seeded on CELLview culture dishes. Images were processed in Nikon NIS‐Elements Imaging Software using maximum intensity projections. The cilia length in each time‐point was manually measured using Fiji. For analysis of live cell imaging shown in Fig 7I and J, images were applied subtract background (rolling ball radius: 15 pixels) using Fiji to reduce background signal noise of Neongreen‐EFHC1.
FRAP assay
For FRAP experiments, RPE1‐Tet3G cells constitutively expressing SSTR3‐GFP and γ‐Tubulin‐mRuby2 were cultured in HEPES‐buffered DMEM/F12 supplemented with 10% FBS, 1% l‐glutamine and 1% penicillin–streptomycin without phenol red (ThermoFischer) in glass‐bottom CELLview culture dishes (Greiner Bio‐One) for 24 h and serum‐starved for 32 h. Dishes were mounted in a pre‐heated microscope chamber and live cell imaging was performed over a period of 10 min at 37°C with 5% CO2. Images were acquired by the Nikon TIRF/FRAP microscope system mounted with the Hamamatsu Orca AG camera and a Nikon Plan Apo λ 100× NA 1.45 oil immersion objective every 30 s. Image acquisition was processed in Nikon NIS‐Elements Imaging Software. Acquired images were analysed using Fiji. Cilia length (µm) and the integrated density of cilia area (IntDenCilia) were measured each time point. The IntDenCilia was normalised by the cilia length and subtracted IntDenCilia after bleach. Percentage of FRAP = normalised IntDenCilia at each time point/normalised IntDenCilia before bleach.
Real‐time quantitative PCR
mRNA was isolated using NucleoSpin® RNA Plus (Macherey‐Nagel) and 1 µg of total mRNA was reverse‐transcribed into cDNA using SensiFAST™ cDNA Synthesis Kit (Bioline) according to the manufacture's protocol. The cDNA (100 ng) was analysed by quantitative PCR using SensiFAST™ SYBR Lo‐ROX Kit (Bioline) in the 7500 Fast Real‐Time PCR System (Applied Biosystems). PCR products were amplified using following primer sets: mGli1 Fw: 5′‐GAGAAGCCACACAAGTGCACGT‐3′, mGli1 Rv: 5′‐AGGCCTTGCTGCAACCTTCTTG‐3′, mGapdh Fw: 5′‐CATCACTGCCACCCAGAAGACTG‐3′, mGapdh Rv: 5′‐ATGCCAGTGAGCTTCCCGTTCAG‐3′. qPCR data were analysed using the ∆∆CT methods and normalised against the house‐keeping gene GAPDH (Shi et al, 2015). The RQ value (fold change) was calculated using the formula .
Statistics and reproducibility
Statistical analyses were done using Wilcoxon or two‐tailed Student's t‐tests. Significance probability values were P < 0.05. Statistical tests were performed in Excel (Microsoft) and KaleidaGraph (Synergy Software). Statistical analysis and mean ± standard deviation (s.d.) were performed on at least three independent biological replicates done in similar conditions. The measurement of cilia length by electron microscopy and data shown in Appendix Fig S6C and D were performed two times independently. The number of biological replicates and sampling sizes are indicated in figure legends and source data.
Author contributions
GP conceived and supervised the project. TK designed, performed the experiments and analysed the data. AN performed experiments related to electron microscopy. BK designed and supported the experiments. GP and TK wrote the manuscript. All authors contributed to manuscript preparation and discussion.
Conflict of interest
The authors declare that they have no conflict of interest.
Supporting information
Appendix
Movie EV1
Movie EV2
Movie EV3
Movie EV4
Movie EV5
Movie EV6
Movie EV7
Movie EV8
Movie EV9
Movie EV10
Movie EV11
Movie EV12
Movie EV13
Source Data for Appendix
Source Data for Figure 1
Source Data for Figure 2
Source Data for Figure 3
Source Data for Figure 4
Source Data for Figure 5
Source Data for Figure 6
Source Data for Figure 7
Source Data for Figure 8
Acknowledgements
The authors thank E. Schiebel (ZMBH, Heidelberg University, Germany) for sharing cell lines, antibodies and plasmids, K. Anderson (Memorial Sloan‐Kettering Cancer Centre, USA) for sharing KIF7 antibody, A. Hofmann (member of the Pereira lab) for technical support, H. Lorenz (ZMBH Imaging facility, Heidelberg University, Germany) for helping with STED microscopy, U. Engel (Nikon Imaging Centre, Heidelberg University) for sharing the Nikon/Andor TuCam microscope for live‐cell imaging, T. Holstein (COS, Heidelberg University, Germany) for access to the qPCR machine and M. Langlotz (ZMBH FACS facility, Heidelberg University, Germany) for cell sorting. We thank E. Schiebel and H. Lee (member of the Pereira lab) for critically reading the manuscript, all members of the Pereira lab and, especially, S. Hata (University Tokyo, Japan) for helpful discussions. TK received financial support from the Heidelberg Biosciences International Graduate School (HBIGS). Funding was obtained from the collaborative research grant of the Deutsche Forschungsgemeinschaft (DFG) (SFB873, Project A14) granted to GP. Core funding for microscopy and FACS was provided by the SFB873 Projects Z03 and Z02, respectively. The work of GP was supported by the Deutsche Forschungsgemeinschaft Heisenberg Professorship (PE1883/3, PE1883/4). BK was supported by the Cluster of Excellence 3DMM2O (EXC‐2082/1‐390761711). Open Access funding enabled and organized by Projekt DEAL.
The EMBO Journal (2022) 41: e108843
Data availability
This study includes no data deposited in external repositories.
References
- Aguilar A, Meunier A, Strehl L, Martinovic J, Bonniere M, Attie‐Bitach T, Encha‐Razavi F, Spassky N (2012) Analysis of human samples reveals impaired SHH‐dependent cerebellar development in Joubert syndrome/Meckel syndrome. Proc Natl Acad Sci USA 109: 16951–16956 [DOI] [PMC free article] [PubMed] [Google Scholar]
- Alford LM, Stoddard D, Li JH, Hunter EL, Tritschler D, Bower R, Nicastro D, Porter ME, Sale WS, Street M (2017) The nexin link and B‐tubule glutamylation maintain the alignment of outer doublets in the ciliary axoneme. Cytoskeleton 73: 331–340 [DOI] [PMC free article] [PubMed] [Google Scholar]
- Baala L, Romano S, Khaddour R, Saunier S, Smith UM, Audollent S, Ozilou C, Faivre L, Laurent N, Foliguet B et al (2007) The Meckel‐Gruber Syndrome gene, MKS3, is mutated in joubert syndrome. Am J Hum Genet 80: 186–194 [DOI] [PMC free article] [PubMed] [Google Scholar]
- Bargmann CI (2006) Chemosensation in C. elegans . WormBook 25: 1–29 [DOI] [PMC free article] [PubMed] [Google Scholar]
- Besschetnova TY, Kolpakova‐Hart E, Guan Y, Zhou J, Olsen BR, Shah JV (2010) Identification of signaling pathways regulating primary cilium length and flow‐mediated adaptation. Curr Biol 20: 182–187 [DOI] [PMC free article] [PubMed] [Google Scholar]
- van der Burght SN, Rademakers S, Johnson JL, Li C, Kremers GJ, Houtsmuller AB, Leroux MR, Jansen G (2020) Ciliary tip signaling compartment is formed and maintained by intraflagellar transport. Curr Biol 30: 4299–4306.e5 [DOI] [PubMed] [Google Scholar]
- Cherry AL, Finta C, Karlström M, Jin Q, Schwend T, Astorga‐Wells J, Zubarev RA, Del Campo M, Criswell AR, de Sanctis D et al (2013) Structural basis of SUFU‐GLI interaction in human Hedgehog signalling regulation. Acta Crystallogr Sect D Biol Crystallogr 69: 2563–2579 [DOI] [PMC free article] [PubMed] [Google Scholar]
- Cheung HOL, Zhang X, Ribeiro A, Mo R, Makino S, Puviindran V, Lo Law KK, Briscoe J, Hui CC (2009) The kinesin protein Kif7 is a critical regulator of Gli transcription factors in mammalian Hedgehog signaling. Sci Signal 2: ra29 [DOI] [PubMed] [Google Scholar]
- Chih B, Liu P, Chinn Y, Chalouni C, Komuves LG, Hass PE, Sandoval W, Peterson AS (2012) A ciliopathy complex at the transition zone protects the cilia as a privileged membrane domain. Nat Cell Biol 14: 61–72 [DOI] [PubMed] [Google Scholar]
- Doroquez D, Berciu C, Anderson J, Sengupta P, Nicastro D (2014) A high‐resolution morphological and ultrastructural map of anterior sensory cilia and glia in Caenorhabditis elegans . Elife 3: e01948 [DOI] [PMC free article] [PubMed] [Google Scholar]
- Echelard Y, Epstein DJ, St‐Jacques B, Shen L, Mohler J, McMahon JA, McMahon AP (1993) Sonic hedgehog, a member of a family of putative signaling molecules, is implicated in the regulation of CNS polarity. Cell 75: 1417–1430 [DOI] [PubMed] [Google Scholar]
- Endoh‐Yamagami S, Evangelista M, Wilson D, Wen X, Theunissen J‐W, Phamluong K, Davis M, Scales SJ, Solloway MJ, de Sauvage FJ et al (2009) The mammalian Cos2 homolog Kif7 plays an essential role in modulating hh signal transduction during development. Curr Biol 19: 1320–1326 [DOI] [PubMed] [Google Scholar]
- Flood PR, Totland GK (1977) Substructure of solitary cilia in mouse kidney. Cell Tissue Res 183: 281–290 [DOI] [PubMed] [Google Scholar]
- Gadadhar S, Dadi H, Bodakuntla S, Schnitzler A, Bièche I, Rusconi F, Janke C (2017) Tubulin glycylation controls primary cilia length. J Cell Biol 216: 2701–2713 [DOI] [PMC free article] [PubMed] [Google Scholar]
- Garcia‐Gonzalo FR, Reiter JF (2017) Open sesame: how transition fibers and the transition zone control ciliary composition. Cold Spring Harb Perspect Biol 9: a028134 [DOI] [PMC free article] [PubMed] [Google Scholar]
- Ghossoub R, Hu Q, Failler M, Rouyez M‐C, Spitzbarth B, Mostowy S, Wolfrum U, Saunier S, Cossart P, James Nelson W et al (2013) Septins 2, 7 and 9 and MAP4 colocalize along the axoneme in the primary cilium and control ciliary length. J Cell Sci 126: 2583–2594 [DOI] [PMC free article] [PubMed] [Google Scholar]
- Guen VJ, Gamble C, Perez DE, Bourassa S, Zappel H, Gärtner J, Lees JA, Colas P (2016) STAR syndrome‐associated CDK10/Cyclin M regulates actin network architecture and ciliogenesis. Cell Cycle 15: 678–688 [DOI] [PMC free article] [PubMed] [Google Scholar]
- Guo S, Liao H, Liu J, Liu J, Tang F, He Z, Li Y, Yang Q (2018) Resveratrol activated sonic hedgehog signaling to enhance viability of NIH3T3 cells in vitro via regulation of Sirt1. Cell Physiol Biochem 50: 1346–1360 [DOI] [PubMed] [Google Scholar]
- Hao L, Thein M, Brust‐Mascher I, Civelekoglu‐Scholey G, Lu Y, Acar S, Prevo B, Shaham S, Scholey JM (2011) Intraflagellar transport delivers tubulin isotypes to sensory cilium middle and distal segments. Nat Cell Biol 13: 790–798 [DOI] [PMC free article] [PubMed] [Google Scholar]
- Hata S, Pastor Peidro A, Panic M, Liu P, Atorino E, Funaya C, Jäkle U, Pereira G, Schiebel E (2019) The balance between KIFC3 and EG5 tetrameric kinesins controls the onset of mitotic spindle assembly. Nat Cell Biol 21: 1138–1151 [DOI] [PubMed] [Google Scholar]
- Haycraft CJ, Banizs B, Aydin‐Son Y, Zhang Q, Michaud EJ, Yoder BK (2005) Gli2 and Gli3 localize to cilia and require the intraflagellar transport protein polaris for processing and function. PLoS Genet 1: 0480–0488 [DOI] [PMC free article] [PubMed] [Google Scholar]
- He M, Subramanian R, Bangs F, Omelchenko T, Liem KF, Kapoor TM, Anderson KV (2014) The kinesin‐4 protein Kif7 regulates mammalian Hedgehog signalling by organizing the cilium tip compartment. Nat Cell Biol 16: 663–672 [DOI] [PMC free article] [PubMed] [Google Scholar]
- He K, Ma X, Xu T, Li Y, Hodge A, Zhang Q, Torline J, Huang Y, Zhao J, Ling K et al (2018) Axoneme polyglutamylation regulated by Joubert syndrome protein ARL13B controls ciliary targeting of signaling molecules. Nat Commun 9: 3310 [DOI] [PMC free article] [PubMed] [Google Scholar]
- He K, Ling K, Hu J (2020) The emerging role of tubulin posttranslational modifications in cilia and ciliopathies. Biophys Rep 6: 89–104 [Google Scholar]
- Hu Q, Milenkovic L, Jin H, Scott MP, Nachury MV, Spiliotis ET, Nelson WJ (2010) A septin diffusion barrier at the base membrane protein distribution. Science 329: 436–439 [DOI] [PMC free article] [PubMed] [Google Scholar]
- Inglis P, Ou G, Leroux M, Scholey J (2007) The sensory cilia of Caenorhabditis elegans . WormBook 8: 1–22 [DOI] [PMC free article] [PubMed] [Google Scholar]
- Insinna C, Pathak N, Perkins B, Drummond I, Besharse JC (2008) The homodimeric kinesin, Kif17, is essential for vertebrate photoreceptor sensory outer segment development. Dev Biol 316: 160–170 [DOI] [PMC free article] [PubMed] [Google Scholar]
- Ishikawa H, Marshall WF (2011) Ciliogenesis: building the cell’s antenna. Nat Rev Mol Cell Biol 12: 222–234 [DOI] [PubMed] [Google Scholar]
- Janke C, Magiera MM (2020) The tubulin code and its role in controlling microtubule properties and functions. Nat Rev Mol Cell Biol 21: 307–326 [DOI] [PubMed] [Google Scholar]
- Keeling J, Tsiokas L, Maskey D (2016) Cellular mechanisms of ciliary length control. Cells 5: 6 [DOI] [PMC free article] [PubMed] [Google Scholar]
- Kiesel P, Alvarez Viar G, Tsoy N, Maraspini R, Gorilak P, Varga V, Honigmann A, Pigino G (2020) The molecular structure of mammalian primary cilia revealed by cryo‐electron tomography. Nat Struct Mol Biol 27: 1115–1124 [DOI] [PMC free article] [PubMed] [Google Scholar]
- Kim J, Lee JE, Heynen‐Genel S, Suyama E, Ono K, Lee K, Ideker T, Aza‐Blanc P, Gleeson JG (2010) Functional genomic screen for modulators of ciliogenesis and cilium length. Nature 464: 1048–1051 [DOI] [PMC free article] [PubMed] [Google Scholar]
- Kim S, Dynlacht BD (2013) Assembling a primary cilium. Curr Opin Cell Biol 25: 506–511 [DOI] [PMC free article] [PubMed] [Google Scholar]
- Kim Y‐J, Osborn DPS, Lee J‐Y, Araki M, Araki K, Mohun T, Känsäkoski J, Brandstack N, Kim H‐T, Miralles F et al (2018) WDR11‐mediated Hedgehog signalling defects underlie a new ciliopathy related to Kallmann syndrome. EMBO Rep 19: 269–289 [DOI] [PMC free article] [PubMed] [Google Scholar]
- Lechtreck KF, Geimer S (2000) Distribution of polyglutamylated tubulin in the flagellar apparatus of green flagellates. Cell Motil Cytoskeleton 47: 219–235 [DOI] [PubMed] [Google Scholar]
- Lee J, Chung YD, Doo Chung Y (2015) Ciliary subcompartments: how are they established and what are their functions? BMB Rep 48: 380–387 [DOI] [PMC free article] [PubMed] [Google Scholar]
- Leightner AC, Hommerding CJ, Peng Y, Salisbury JL, Gainullin VG, Czarnecki PG, Sussman CR, Harris PC (2013) The Meckel syndrome protein meckelin (TMEM67) is a key regulator of cilia function but is not required for tissue planar polarity. Hum Mol Genet 22: 2024–2040 [DOI] [PMC free article] [PubMed] [Google Scholar]
- Lewis TR, Kundinger SR, Pavlovich AL, Bostrom JR, Link BA, Besharse JC (2017) Cos2/Kif7 and Osm‐3/Kif17 regulate onset of outer segment development in zebrafish photoreceptors through distinct mechanisms. Dev Biol 425: 176–190 [DOI] [PMC free article] [PubMed] [Google Scholar]
- Li ZJ, Nieuwenhuis E, Nien W, Zhang X, Zhang J, Puviindran V, Wainwright BJ, Kim PCW, Hui C‐C (2012) Kif7 regulates Gli2 through Sufu‐dependent and ‐independent functions during skin development and tumorigenesis. Development 139: 4152–4161 [DOI] [PubMed] [Google Scholar]
- May‐Simera HL, Wan Q, Jha BS, Hartford J, Khristov V, Dejene R, Chang J, Patnaik S, Lu Q, Banerjee P et al (2018) Primary cilium‐mediated retinal pigment epithelium maturation is disrupted in ciliopathy patient cells. Cell Rep 22: 189–205 [DOI] [PMC free article] [PubMed] [Google Scholar]
- Miyoshi KO, Kasahara K, Murakami S, Takeshima M, Kumamoto N, Sato A, Miyazaki I, Matsuzaki S, Sasaoka T, Katayama T et al (2014) Lack of dopaminergic inputs elongates the primary cilia of striatal neurons. PLoS One 9: e97918 [DOI] [PMC free article] [PubMed] [Google Scholar]
- Mönnich M, Borgeskov L, Breslin L, Jakobsen L, Rogowski M, Doganli C, Schrøder JM, Mogensen JB, Blinkenkjær L, Harder LM et al (2018) CEP128 localizes to the subdistal appendages of the mother centriole and regulates TGF‐β/BMP signaling at the primary cilium. Cell Rep 22: 2584–2592 [DOI] [PubMed] [Google Scholar]
- Mukhopadhyay S, Lu Y, Shaham S, Sengupta P (2008) Sensory signaling‐dependent remodeling of olfactory cilia architecture in C. elegans . Dev Cell 14: 762–774 [DOI] [PMC free article] [PubMed] [Google Scholar]
- Nachury MV (2014) How do cilia organize signalling cascades? Philos Trans R Soc B Biol Sci 369: 20130465 [DOI] [PMC free article] [PubMed] [Google Scholar]
- Nager AR, Goldstein JS, Herranz‐Pérez V, Portran D, Ye F, Garcia‐Verdugo JM, Nachury MV (2017) An actin network dispatches ciliary GPCRs into extracellular vesicles to modulate signaling. Cell 168: 252–263.e14 [DOI] [PMC free article] [PubMed] [Google Scholar]
- Neubauer K, Zieger B (2017) The mammalian septin interactome. Front Cell Dev Biol 5: 1–9 [DOI] [PMC free article] [PubMed] [Google Scholar]
- O’Hagan R, Piasecki BP, Silva M, Phirke P, Nguyen KCQ, Hall DH, Swoboda P, Barr MM (2011) The tubulin deglutamylase CCPP‐1 regulates the function and stability of sensory cilia in C. elegans . Curr Biol 21: 1685–1694 [DOI] [PMC free article] [PubMed] [Google Scholar]
- Oh EC, Katsanis N (2013) Context‐dependent regulation of Wnt signaling through the primary cilium. J Am Soc Nephrol 24: 10–18 [DOI] [PubMed] [Google Scholar]
- Palander O, El‐Zeiry M, Trimble WS (2017) Uncovering the roles of septins in cilia. Front Cell Dev Biol 5: 1–7 [DOI] [PMC free article] [PubMed] [Google Scholar]
- Pedersen LB, Akhmanova A (2014) Kif7 keeps cilia tips in shape. Nat Cell Biol 16: 623–625 [DOI] [PubMed] [Google Scholar]
- Pedersen LB, Mogensen JB, Christensen ST (2016) Endocytic control of cellular signaling at the primary cilium. Trends Biochem Sci 41: 784–797 [DOI] [PubMed] [Google Scholar]
- Prevo B, Scholey JM, Peterman EJG (2017) Intraflagellar transport: mechanisms of motor action, cooperation and cargo delivery. FEBS J 284: 2905–2931 [DOI] [PMC free article] [PubMed] [Google Scholar]
- Qiu N, Xiao Z, Cao L, Buechel MM, David V, Roan E, Quarles LD (2012) Disruption of Kif3a in osteoblasts results in defective bone formation and osteopenia. J Cell Sci 125: 1945–1957 [DOI] [PMC free article] [PubMed] [Google Scholar]
- Ramsbottom SA, Molinari E, Srivastava S, Silberman F, Henry C, Alkanderi S, Devlin LA, White K, Steel DH, Saunier S et al (2018) Targeted exon skipping of a CEP290 mutation rescues Joubert syndrome phenotypes in vitro and in a murine model. Proc Natl Acad Sci USA 115: 12489–12494 [DOI] [PMC free article] [PubMed] [Google Scholar]
- Reiter JF, Leroux MR (2017) Genes and molecular pathways underpinning ciliopathies. Nat Rev Mol Cell Biol 18: 533–547 [DOI] [PMC free article] [PubMed] [Google Scholar]
- Salinas RY, Pearring JN, Ding JD, Spencer WJ, Hao Y, Arshavsky VY (2017) Photoreceptor discs form through peripherin‐dependent suppression of ciliary ectosome release. J Cell Biol 216: 1489–1499 [DOI] [PMC free article] [PubMed] [Google Scholar]
- Sánchez I, Dynlacht BD (2016) Cilium assembly and disassembly. Nat Cell Biol 18: 711–717 [DOI] [PMC free article] [PubMed] [Google Scholar]
- Sandrock K, Bartsch I, Bläser S, Busse A, Busse E, Zieger B (2011) Characterization of human septin interactions. Biol Chem 392: 751–761 [DOI] [PubMed] [Google Scholar]
- Schindelin J, Arganda‐Carreras I, Frise E, Kaynig V, Longair M, Pietzsch T, Preibisch S, Rueden C, Saalfeld S, Schmid B et al (2012) Fiji: an open‐source platform for biological‐image analysis. Nat Methods 9: 676–682 [DOI] [PMC free article] [PubMed] [Google Scholar]
- Sharma N, Kosan ZA, Stallworth JE, Berbari NF, Yoder BK (2011) Soluble levels of cytosolic tubulin regulate ciliary length control. Mol Bio Cell 22: 806–816 [DOI] [PMC free article] [PubMed] [Google Scholar]
- Shi X, Zhan X, Wu J (2015) A positive feedback loop between Gli1 and tyrosine kinase Hck amplifies shh signaling activities in medulloblastoma. Oncogenesis 4: e176 [DOI] [PMC free article] [PubMed] [Google Scholar]
- Shi X, Garcia G, Van De Weghe JC, McGorty R, Pazour GJ, Doherty D, Huang B, Reiter JF (2017) Super‐resolution microscopy reveals that disruption of ciliary transition‐zone architecture causes Joubert syndrome. Nat Cell Biol 19: 1178–1188 [DOI] [PMC free article] [PubMed] [Google Scholar]
- Slaats GG, Isabella CR, Kroes HY, Dempsey JC, Gremmels H, Monroe GR, Phelps IG, Duran KJ, Adkins J, Kumar SA et al (2016) MKS1 regulates ciliary INPP5E levels in Joubert syndrome. J Med Genet 53: 62–72 [DOI] [PMC free article] [PubMed] [Google Scholar]
- Snow JJ, Ou G, Gunnarson AL, Walker MRS, Zhou HM, Brust‐Mascher I, Scholey JM (2004) Two anterograde intraflagellar transport motors cooperate to build sensory cilia on C. elegans neurons. Nat Cell Biol 6: 1109–1113 [DOI] [PubMed] [Google Scholar]
- Spencer WJ, Lewis TR, Pearring JN, Arshavsky VY (2020) Photoreceptor discs: built like ectosomes. Trends Cell Biol 30: 904–915 [DOI] [PMC free article] [PubMed] [Google Scholar]
- Spiliotis ET, Nakos K (2021) Cellular functions of actin‐ and microtubule‐associated septins. Curr Biol 31: R651–R666 [DOI] [PMC free article] [PubMed] [Google Scholar]
- Srivastava S, Ramsbottom SA, Molinari E, Alkanderi S, Filby A, White K, Henry C, Saunier S, Miles CG, Sayer JA (2017) A human patient‐derived cellular model of Joubert syndrome reveals ciliary defects which can be rescued with targeted therapies. Hum Mol Genet 26: 4657–4667 [DOI] [PMC free article] [PubMed] [Google Scholar]
- Sun X, Park JH, Gumerson J, Wu Z, Swaroop A, Qian H, Roll‐Mecak A, Li T (2016) Loss of RPGR glutamylation underlies the pathogenic mechanism of retinal dystrophy caused by TTLL5 mutations. Proc Natl Acad Sci USA 113: E2925–E2934 [DOI] [PMC free article] [PubMed] [Google Scholar]
- Sun S, Fisher RL, Bowser SS, Pentecost BT, Sui H (2019) Three‐dimensional architecture of epithelial primary cilia. Proc Natl Acad Sci USA 116: 9370–9379 [DOI] [PMC free article] [PubMed] [Google Scholar]
- Tammachote R, Hommerding CJ, Sinders RM, Miller CA, Czarnecki PG, Leightner AC, Salisbury JL, Ward CJ, Torres VE, Gattone VH et al (2009) Ciliary and centrosomal defects associated with mutation and depletion of the Meckel syndrome genes MKS1 and MKS3. Hum Mol Genet 18: 3311–3323 [DOI] [PMC free article] [PubMed] [Google Scholar]
- Taylor SP, Dantas TJ, Duran I, Wu S, Lachman RS, Nelson SF, Cohn DH, Vallee RB, Krakow D, Nelson SF et al (2015) Mutations in DYNC2LI1 disrupt cilia function and cause short rib polydactyly syndrome. Nat Commun 6: 7092 [DOI] [PMC free article] [PubMed] [Google Scholar]
- Tukachinsky H, Lopez LV, Salic A (2010) A mechanism for vertebrate Hedgehog signaling: recruitment to cilia and dissociation of SuFu‐Gli protein complexes. J Cell Biol 191: 415–428 [DOI] [PMC free article] [PubMed] [Google Scholar]
- Valadares NF, d’Muniz Pereira H, Ulian Araujo AP, Garratt RC (2017) Septin structure and filament assembly. Biophys Rev 9: 481–500 [DOI] [PMC free article] [PubMed] [Google Scholar]
- Wang L, Dynlacht BD (2018) The regulation of cilium assembly and disassembly in development and disease. Development 145: dev151407 [DOI] [PMC free article] [PubMed] [Google Scholar]
- Wang W, Jack BM, Wang HH, Kavanaugh MA, Maser RL, Tran PV (2021) Intraflagellar transport proteins as regulators of primary cilia length. Front Cell Dev Biol 9: 661350 [DOI] [PMC free article] [PubMed] [Google Scholar]
- Wann AKT, Knight MM (2012) Primary cilia elongation in response to interleukin‐1 mediates the inflammatory response. Cell Mol Life Sci 69: 2967–2977 [DOI] [PMC free article] [PubMed] [Google Scholar]
- Warburton‐Pitt SRF, Silva M, Nguyen KCQ, Hall DH, Barr MM (2014) The nphp‐2 and arl‐13 genetic modules interact to regulate ciliogenesis and ciliary microtubule patterning in C. elegans . PLoS Genet 10: e1004866 [DOI] [PMC free article] [PubMed] [Google Scholar]
- Waters AM, Beales PL (2011) Ciliopathies: an expanding disease spectrum. Pediatr Nephrol 26: 1039–1056 [DOI] [PMC free article] [PubMed] [Google Scholar]
- Wheway G, Nazlamova L, Hancock JT (2018) Signaling through the primary cilium. Front Cell Dev Biol 6: 8 [DOI] [PMC free article] [PubMed] [Google Scholar]
- Williams CL, McIntyre JC, Norris SR, Jenkins PM, Zhang L, Pei Q, Verhey K, Martens JR (2014) Direct evidence for BBSome‐associated intraflagellar transport reveals distinct properties of native mammalian cilia. Nat Commun 5: 1–13 [DOI] [PMC free article] [PubMed] [Google Scholar]
- Wloga D, Joachimiak E, Louka P, Gaertig J (2017) Posttranslational modifications of tubulin and cilia. Cold Spring Harb Perspect Biol 9: a028159 [DOI] [PMC free article] [PubMed] [Google Scholar]
- Wood CR, Huang K, Diener DR, Rosenbaum JL (2013) The cilium secretes bioactive ectosomes. Curr Biol 23: 906–911 [DOI] [PMC free article] [PubMed] [Google Scholar]