Abstract
Excitatory amino acid transporters (EAATs) maintain glutamate gradients in the brain essential for neurotransmission and to prevent neuronal death. They use ionic gradients as energy source and co‐transport transmitter into the cytoplasm with Na+ and H+, while counter‐transporting K+ to re‐initiate the transport cycle. However, the molecular mechanisms underlying ion‐coupled transport remain incompletely understood. Here, we present 3D X‐ray crystallographic and cryo‐EM structures, as well as thermodynamic analysis of human EAAT1 in different ion bound conformations, including elusive counter‐transport ion bound states. Binding energies of Na+ and H+, and unexpectedly Ca2+, are coupled to neurotransmitter binding. Ca2+ competes for a conserved Na+ site, suggesting a regulatory role for Ca2+ in glutamate transport at the synapse, while H+ binds to a conserved glutamate residue stabilizing substrate occlusion. The counter‐transported ion binding site overlaps with that of glutamate, revealing the K+‐based mechanism to exclude the transmitter during the transport cycle and to prevent its neurotoxic release on the extracellular side.
Keywords: cryo‐EM, neurotransmitter transport, permeation and transport, solute carrier, X‐ray crystallography
Subject Categories: Membranes & Trafficking, Neuroscience, Structural Biology
Comprehensive structural and thermodynamic analyses of the synaptic glutamate transporter EAAT1 highlights overlapping binding sites and unexpected competition by Ca2+.

Introduction
Human excitatory amino acid transporters (EAATs) belong to the solute carrier 1 (SLC1) family and catalyze active transport of excitatory transmitters using energy stored in ionic transmembrane gradients (Kanner & Sharon, 1978; Erecinska et al, 1983; Nelson et al, 1983). In each transport cycle, EAATs stoichiometrically co‐transport one molecule of the transmitter with 3 Na+ and 1 H+, while counter‐transport 1 K+ to re‐orient the transmitter binding site to the extracellular side, and re‐initiate the cycle (Barbour et al, 1988; Zerangue & Kavanaugh, 1996). EAAT1‐2 are highly expressed on the plasma membrane of astrocytic glia (Lehre & Danbolt, 1998), where they are essential components of tripartite synapses and contribute to clear the transmitter from the cleft and to regulate extracellular glutamate concentration in the brain (Zhou & Danbolt, 2014). Consistently, their dysfunctions are linked to several neurodegenerative disorders (Pajarillo et al, 2019).
SLC1 proteins are homo‐trimers (Yernool et al, 2003, 2004; Canul‐Tec et al, 2017; Garaeva et al, 2018), and their individual subunits catalyze transport independently (Grewer et al, 2005; Koch & Larsson, 2005; Leary et al, 2007; Ruan et al, 2017). Each subunit contains two structural and functional domains (Reyes et al, 2009): a relatively rigid (Groeneveld & Slotboom, 2007) scaffold domain (scaD) that forms the inter‐subunit interfaces and a highly dynamic (Akyuz et al, 2013; Erkens et al, 2013; Matin et al, 2020) transport domain (tranD) that binds substrate and thermodynamically coupled ions (Seal & Amara, 1998; Zhang et al, 1998; Boudker et al, 2007; Larsson et al, 2010; Tao et al, 2010; Guskov et al, 2016), and shuttles across the membrane in an “elevator‐like” manner to translocate the cargo (Crisman et al, 2009; Reyes et al, 2009).
Biophysical analyses of Na+‐dependent EAAT archaeal homologs, GltPh (Boudker et al, 2007) and GltTK (Guskov et al, 2016), showed that co‐transported sodium ions bind three conserved sites in the tranD (Na1‐3) and that binding energy of the three co‐transported Na+ ions is coupled to substrate binding and occlusion, rather than directly driving its translocation (Reyes et al, 2013). In the absence of substrate, two Na+ bind cooperatively to Na1 and Na3, and contribute to form the substrate binding site, while subsequent binding of substrate and Na+ to Na2 leads to substrate occlusion under helical‐hairpin 2 (HP2) (Ewers et al, 2013; Reyes et al, 2013; Verdon et al, 2014; Guskov et al, 2016; Alleva et al, 2020). Helical‐hairpin 2 dynamics controls substrate access to its binding site on opposite sides of the membrane, and HP2 closure enables elevator‐like movements of the tranD and isomerization between outward‐ and inward‐facing states (Boudker et al, 2007; Reyes et al, 2009; Garaeva et al, 2019; Alleva et al, 2020). However, archaeal homologs are limited molecular models, as they are H+‐ and K+‐independent transporters (Ryan et al, 2009). Moreover, archaeal Na+‐coupling mechanism has not been confirmed experimentally in EAATs. In addition, the folding instability of purified mammalian EAAT orthologs has precluded so far similar crystallographic and thermodynamic analyses of human transporters, and recent cryo‐electron microscopy (cryo‐EM) structures of EAAT3 fell short of revealing the complete ion‐coupled mechanism (Qiu et al, 2021).
In this work, we set out to study EAAT ion‐coupled transport mechanism using thermostabilized human EAAT1 mutants, namely EAAT1CRYST and EAAT1CRYST‐II (Canul‐Tec et al, 2017; Cirri et al, 2018) and wild‐type EAAT1 (EAAT1WT). EAAT1CRYST constructs are nearly identical to EAAT1WT at the core of the tranD, where the transmitter and coupled ions bind. Consistently, they retain intact Na+‐, H+‐, and K+‐coupled transport mechanism after purification in detergent solutions and reconstitution in synthetic liposomes. Importantly, detergent‐purified EAAT1CRYST proteins are stable under different substrate and ionic conditions and enable both thermodynamic and X‐ray crystallographic analyses of the neurotransmitter transport cycle, while EAAT1WT was amenable to structural analysis by cryo‐EM.
Results
Conserved SLC1 sodium‐coupling mechanism
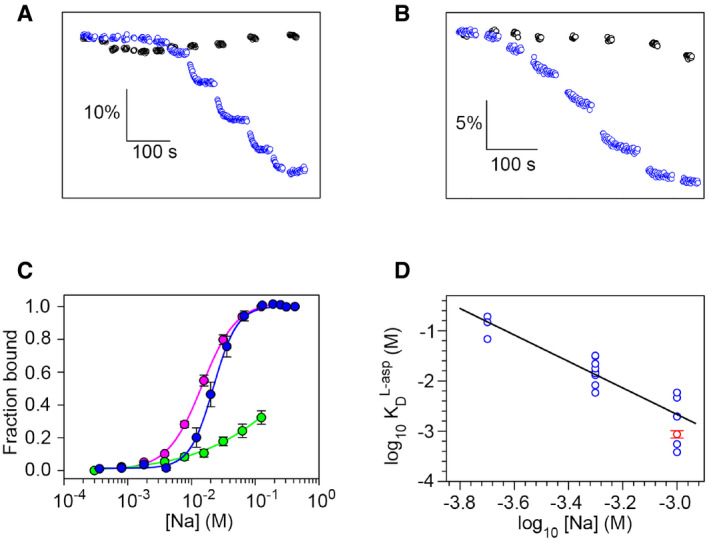
L‐glutamate uptake by purified EAAT1CRYST is strictly dependent on opposite transmembrane gradients of sodium and potassium (Canul‐Tec et al, 2017). To quantify binding and ion–substrate thermodynamic coupling, we measured changes in intrinsic tryptophan fluorescence of purified EAAT1CRYST in detergent solutions. Both Na+ and transmitter binding, but not K+, induced robust tryptophan‐fluorescence changes (> 15%) that enable titration of ligands (Fig 1A and B). EAAT1CRYST contains two tryptophan residues, W287267 in the scaD and W473453 in the tranD (herein, amino acid number refers to EAAT1WT sequence, and the corresponding number in EAAT1CRYST is in subscript). Individual phenylalanine mutants W287267F and W473453F decreased (~ 5%) and abolished, respectively, Na+/transmitter‐induced fluorescence signal (Appendix Fig S1A). Although the structural details underlying tryptophan fluorescence changes in EAAT1CRYST are unclear, these experiments show that the two tryptophan residues are required to probe Na+ binding and that changes in tranD dynamics induced by Na+ and K+ binding are significantly different.
Figure 1. Na+ and transmitter binding.
-
ATryptophan‐fluorescence time course associated to Na+ (blue) and K+ (black) binding, respectively, to detergent‐purified apo EAAT1CRYST at pH 7.4. Horizontal and vertical scale bars represent time and ΔF/F 0, respectively.
-
BTryptophan‐fluorescence time course associated to L‐asp binding in presence of 1 mM (blue) and absence (black) of Na+, respectively, at pH 9.
-
CNa+ binding isotherms of EAAT1CRYST at pH 7.4 in the presence (pink) and absence (blue) of UPCH101. Mutation D400380N at Na3 strongly impairs Na+ binding (green). Solid lines represent fits of Hill equation.
-
DLog‐log plot of L‐asp KD as a function of Na+ concentration. Empty circles are KD values (n = 20) at pH = 9.0 in the absence of UCPH101 (blue), and solid line is the fit of a straight line. For comparison, average L‐asp KD at 1 mM Na+ in the presence pf of UPCH101 is also shown (n = 3; red).
Data information: In (C) symbols represent average and s.e.m. values of at least three independent titrations. In (D), blue symbols represent individual KD values from n number of independent titrations, and red symbol represents average and s.e.m. values from three experiments.
In the absence of substrate, sodium ions bind EAAT1CRYST in a cooperative manner with an apparent dissociation constant (KD) of 21.6 ± 0.4 mM, and a hill coefficient (nH) of 2.2 ± 0.1 (Fig 1C), consistent with binding of two sodium ions to the apo tranD at Na1 and Na3. In agreement with this, asparagine mutation of strictly conserved D400380 in Na3 greatly impaired sodium binding (KD >100 mM). Moreover, in the presence of allosteric inhibitor UCPH101 (Jensen et al, 2009), which traps the transporters in outward‐facing states (Canul‐Tec et al, 2017), Na+ titrations of EAAT1CRYST yielded similar binding parameters (KD = 14.6 ± 0.3 mM; nH = 1.6 ± 0.1). These results indicate that tryptophan‐fluorescence changes report on conformational changes associated to binding, rather than membrane translocation of the tranD, and further that Na+ binds outward‐ and inward‐facing states with comparable affinities.
Substrate binding to EAAT1CRYST was strongly sodium‐dependent, and the logarithmic plot of the substrate KD versus sodium concentration yielded a straight line with a slope, or coupling efficiency (CE) value of −2.6 ± 0.3 (Fig 1D). CE is the apparent number of ions thermodynamically coupled to binding of one substrate molecule, and our results show that in EAAT1CRYST the binding energy of the three co‐transported sodium ions is coupled to neurotransmitter binding. Moreover, at 1 mM Na+, transmitter KD values in the presence (0.9 ± 0.1 mM) and absence of UCPH101 (2.8 ± 0.8 mM) were comparable.
Indeed, similarities in Na+‐ and Na+ transmitter–coupled binding properties between archaeal homologs (Reyes et al, 2013) and EAAT1CRYST strongly suggest conservation of the Na+‐coupling mechanism.
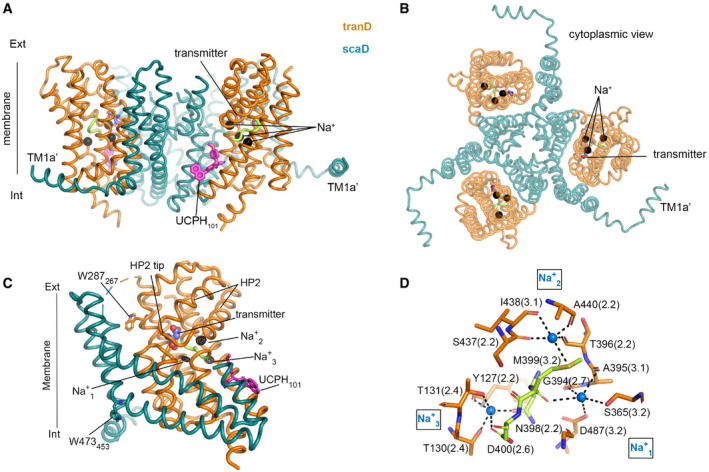
To gain structural insight on the location of the sodium‐binding sites, we extended the reported crystallographic atomic model of Na+/transmitter bound EAAT1CRYST (Canul‐Tec et al, 2017) in complex with UCPH101 (see methods). Notably, the extended model includes an N‐terminal helix that lies nearly parallel to the membrane plane (TM1a’) and has not been noted before in structures of SLC1 proteins (Fig 2A and B). Interestingly, amino acid deletions in this region slow down substrate uptake by EAAT1WT expressed in cells (Appendix Fig S1B), suggesting a modulatory role of TM1a’ on transport kinetics. Notably, EAAT1CRYST Fo‐Fc electron density map omitting sodium ions shows three distinct density peaks (> 4σ) within the tranD (Fig 2C). Several lines of structural and functional evidence indicate that the observed peaks correspond to three co‐transported Na+ bound to the tranD: the peaks accurately localize to the three conserved sodium‐binding sites (Na1‐Na3) previously observed in X‐ray structures of archaeal homologs (Boudker et al, 2007; Guskov et al, 2016; Alleva et al, 2020). Accordingly, three sodium ions modeled in EAAT1CRYST structure reveal nearly identical coordination compared to the homologs (Fig 2D); ion coordination in EAAT1CRYST at the three sites is exclusively done by oxygen atoms, as expected for a weak acid such as Na+, while water coordination is expected to have additional contributions by nitrogen atoms, reflecting its H‐bonding capacity (Nayal & Di Cera, 1996). Finally, reported mutagenesis of residues that contribute side chains to Na1 and Na3, including D400380N (Fig 1C), impaired Na+‐dependent function in both EAATs and prokaryotic homologs (Boudker et al, 2007; Tao et al, 2010; Bastug et al, 2012).
Figure 2. EAAT1CRYST Na+/transmitter bound structure.
-
A, BViews of EAAT1CRYST trimer in outward‐facing Na+/transmitter bound state, including N‐term helix TM1a’.
-
CEAAT1CRYST protomer viewed from the membrane with tranD orange, scaD teel (TM4a,b omitted), and 398NMDG motif green. Fo‐Fc Na+‐omit map contoured at 3.5σ (black mesh) around the tranD core.
-
DCoordination details of three Na+ bound (blue sphere) to EAAT1CRYST. Residue numbering corresponds to EAAT1WT, and the coordination distance (angstrom) is in parenthesis.
Overall, the above structural and thermodynamic results are in excellent agreement with the sodium‐coupling mechanism of archaeal transporters (Ewers et al, 2013; Reyes et al, 2013; Verdon et al, 2014; Guskov et al, 2016; Alleva et al, 2020) and confirm its conservation in human SLC1 proteins. In this mechanism, cooperative Na+ binding to apo transporters leads to occupancy of Na1 and Na3 sites and contributes to the formation of the substrate binding site, while subsequent binding of substrate and Na+ to Na2 leads to substrate occlusion under HP2 and enables transmembrane movements of the tranD. Na+‐ and Na+ transmitter–coupled binding affinities to outward‐ and inward‐facing states are similar.
Proton coupling
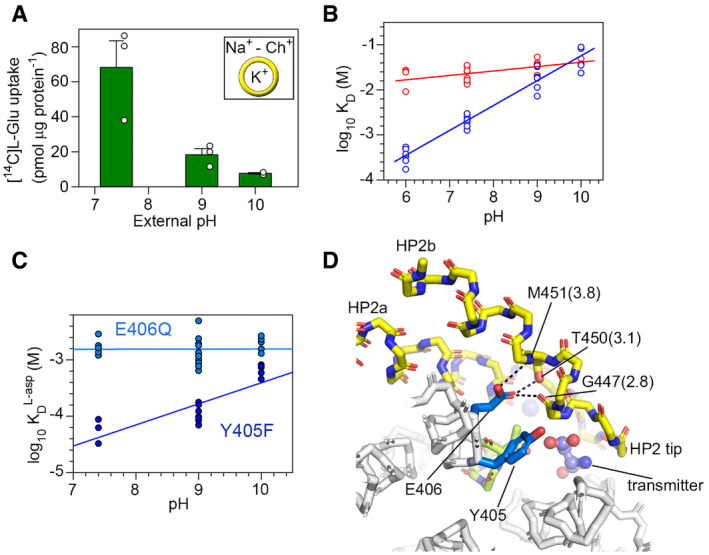
L‐glutamate uptake by purified EAAT1CRYST decreases steeply at basic pH values (Fig 3A), resembling transport pH dependence observed in EAAT mammalian orthologs expressed in cells (Zerangue & Kavanaugh, 1996; Watzke et al, 2000) and demonstrating that the proton‐coupled transport mechanism of the thermostable mutant is intact.
Figure 3. H+ and transmitter binding.
-
ANa+‐induced L‐glutamate uptake by purified EAAT1CRYST reconstituted in liposomes loaded with K+. Choline (Ch+) condition was subtracted to the Na+ condition.
-
BLog‐log plots of Na+ (red, n = 19) and L‐asp (blue, n = 27) KD, as a function of pH at [Na+] = 0.5 mM. Na+ (n = 10) and L‐asp (n = 7) titration data at pH 7.4 and 9.0, respectively, are also reported in Fig 1. Solid lines are fits of straight lines.
-
CLog‐log plots of L‐asp KD for EAAT1CRYST‐E406386Q (light blue, n = 24) and EAAT1CRYST‐Y405385F (dark blue, n = 18), as a function of pH at [Na+] = 0.5 mM.
-
DPotential H+‐bond network between protonated E406386 (TM7b) and residues in HP2b in EAAT1CRYST transmitter bound structure. HP2 is depicted in yellow and the 398NMDG motif in green. Residue numbering corresponds to EAAT1WT, and the interatomic distance (angstrom) is parenthesis.
Data information: In (A) bar plots depict averages and s.e.m. values of three independent experiments (empty circles) performed in triplicate. In (B and C) symbols represent individual KD values from n number of independent titrations.
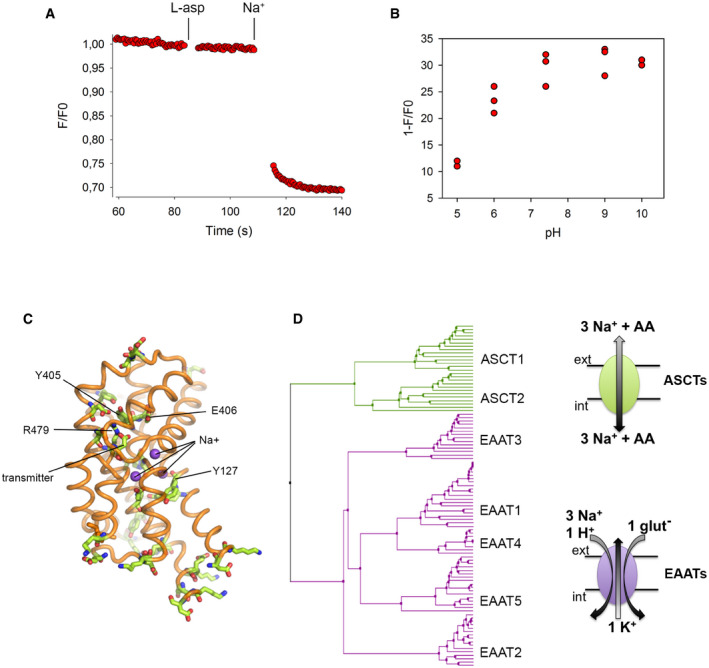
To gain thermodynamic insight on this mechanism, we measured Na+ and Na+/transmitter‐coupled binding to apo transporters as a function of pH using the tryptophan‐fluorescence assay. There was no significant change in Na+ apparent KD in a pH range from 6 to 10 (CE = 0.09 ± 0.03), while substrate KD significantly increased with pH (CE = 0.55 ± 0.02) at constant [Na+] (Fig 3B). These results demonstrate that neurotransmitter binding is thermodynamically coupled to binding of one H+ and argue that cooperative Na+ binding to apo transporters, at Na1 and Na3, is H+‐uncoupled. We next asked if the apo transporters are able to bind protons. Indeed, total tryptophan‐fluorescence changes associated to saturating Na+/ transmitter‐coupled binding significantly decreased at pH values below neutral (Fig EV1A and B), indicating that protons change tryptophan fluorescence of the apo transporter upon binding.
Figure EV1. Proton binding to conserved ionizable sidechain in EAAT1CRYST .
-
AEAAT1CRYST tryptophan‐fluorescence time course at pH 10 upon addition of saturating concentrations of L‐asp and Na+.
-
BPercentage of L‐asp/Na+‐induced total fluorescence change (1−F/F 0) decreases at pH values below neutral.
-
COut of > 30 ionizable sidechains (green sticks) in the tranD of EAAT1CRYST only four (labelled with residue number) are strictly conserved in EAATs, and not in ASCTs.
-
DPhylogenetic tree from 101 tranD sequences of representative vertebrate species (Gesemann et al, 2010) calculated with Jalview (BLOSUM62 average distance). Transport stoichiometry of EAATs and ASCTs vertebrate proteins is depicted in cartoon representation.
To find ionizable side chains that could act as proton acceptors in the tranD, we compared amino acid sequences from representative vertebrate species of two divergent branches of SLC1 transporters (Gesemann et al, 2010): pH‐dependent EAATs, and pH‐independent neutral amino acid exchangers (the so‐called alanine‐serine‐cysteine transporters, ASCTs) (Fig EV1C and D). The tranD of EAAT1CRYST contains over 30 ionizable side chains, but only Y127127 (TM3), Y405385 (TM7b), E406386 (TM7b), and R479459 (TM8b) are strictly conserved among EAAT orthologs, and not among ASCT ones. R479459 is in close proximity to conserved acidic residues (E406386, D472452, and D476456), while the Y127127 backbone is part of Na3, where Na+ arguably binds in a pH‐independent fashion. Hence, it is highly unlikely that those two residues exchange protons with the bulk during the transport cycle, and we focused our analysis on Y405385 and E406386. Indeed, conservative single mutations bearing non‐ionizable sidechains had minor effects on pH dependence of substrate binding in Y405385F (CE = 0.37 ± 0.06), but abolished this dependence in E406386Q (CE = 0.00 ± 0.04) (Fig 3C). Our results agree well with early studies of rodent ortholog EAAC1 showing that equivalent mutation to E406386Q (E373Q) impairs pH dependence of apparent glutamate binding (Grewer et al, 2003), as well as with molecular dynamic simulations of transmitter binding (Heinzelmann & Kuyucak, 2014), and support the role of E406 carboxylate as the main proton acceptor in the transport cycle.
From a structural viewpoint, E406386 sidechain is occluded within the tranD core at hydrogen‐bond distance of G447427 backbone‐carbonyl oxygen, T450430 sidechain hydroxyl, and M451431 backbone amide in HP2b in the Na+/transmitter bound EAAT1CRYST structure (Fig 3D). Consistent with its proton acceptor role, protonation of the E406386 carboxylate group would expand its H‐bonding capacity and enable formation of a H‐bond network with HP2b, contributing to maintain HP2 in a close position with substrate occluded underneath, and explaining at least partly the thermodynamic coupling between H+ and transmitter binding. Because it is not possible to determine the protonation state of amino acid sidechains in the EAAT1CRYST crystal structure, we determined the structure of EAAT1CRYST‐E406386Q mutant, mimicking the protonated state of E406386. Indeed, the position of E406386Q side chain is identical within experimental error to that of E406386 (Appendix Fig S2A and B), consistent with E406386 being protonated in the Na+/transmitter bound state.
All functional and structural results converge to show that Na+/transmitter bound structure represents the transmitter translocation complex of the tranD with 3 Na+, 1 H+, and 1 neurotransmitter molecule bound.
Counter‐transported ion–binding site
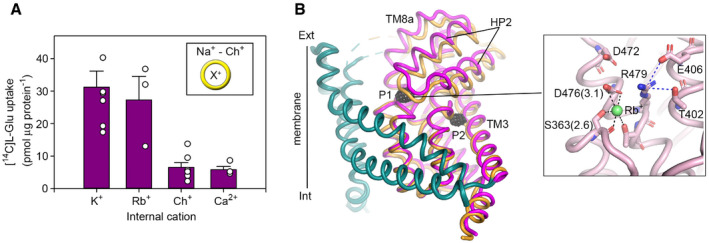
To understand the structural basis underlying ion counter‐transport in EAATs, we solved the crystal structure of transporters purified in Rb+‐based buffer, in the absence of Na+ and transmitter, and in complex with UCPH101. Rb+ is a K+ analog, and the advantage for crystallographic experiments is that Rb+ yields robust anomalous X‐ray scattering signals to unambiguously determine the position of bound ion(s) to the transporter, at the resolution of our structure (~ 3.9 Å). Importantly, liposome uptake experiments show that Rb+ is counter‐transported by EAAT1CRYST, demonstrating that it is a functional K+ analog for EAAT1 structural studies (Fig 4A).
Figure 4. Counter‐transported ion binding site.
-
APurified EAAT1CRYST takes up L‐glutamate in liposomes loaded with K+ or Rb+, but not with choline (Ch+), or with Ch+ and Ca2+. Plots depict data as in Fig 3A.
-
BSuperimposition of Na+/transmitter and Rb+ bound EAAT1CRYST structures, respectively, with tranD depicted in orange (Na+/transmitter) and pink (Rb+). TM4 and UCPH101 are omitted for clarity. Black mesh depicts the anomalous‐difference map contoured at 3.5σ around the tranD. Rb+ coordination is shown in the inset. Residue numbering corresponds to EAAT1WT, and the coordination distance (angstrom) is parenthesis.
Data information: In (A) bar plots depict averages and s.e.m. values of three independent experiments (empty circles) performed in triplicate.
Rb+ and UCPH101 bound EAAT1CRYST structure adopts an outward‐facing open state, and the anomalous difference map with the X‐ray beam tuned at a Rb+ absorption maximum (0.815 Å) shows two anomalous‐difference peaks (> 5σ), namely P1 and P2. P1 localizes to the substrate‐binding site near conserved D476456, and P2 to Na3 (Fig 4B). As negative control, we collected diffraction data from a similar crystal, but with the X‐ray beam tuned off the Rb+‐absorption maximum (0.998 Å), and observed P2 (> 5σ), but not P1 in the anomalous difference map (Fig EV2). These results demonstrate that Rb+, a functional counter‐transported ion by EAAT1, is bound to the transporter at the substrate‐binding site. Notably, this counter‐transported ion binding site, namely KCT, overlaps with the position of the substrate amide‐nitrogen atom in the Na+/transmitter bound structure, and it is coordinated by the carboxylate side chain of D476456 (TM8b), backbone carbonyl oxygen of S363343 (HP1), and possibly its sidechain, as well as that of T480460 (TM8b) and water molecules (Fig 4B). The striking overlap with the transmitter binding site makes KCT an optimal site for the counter‐transported ion to exclude the transmitter during the transport cycle. Consistently, early computational (Holley & Kavanaugh, 2009), functional (Wang et al, 2013), and crystallographic (Verdon et al, 2014) studies of EAAT homologs predicted mutually exclusive transmitter and K+‐binding sites at similar positions.
Figure EV2. Anomalous difference maps of Rb+/Ba2+ bound structure.
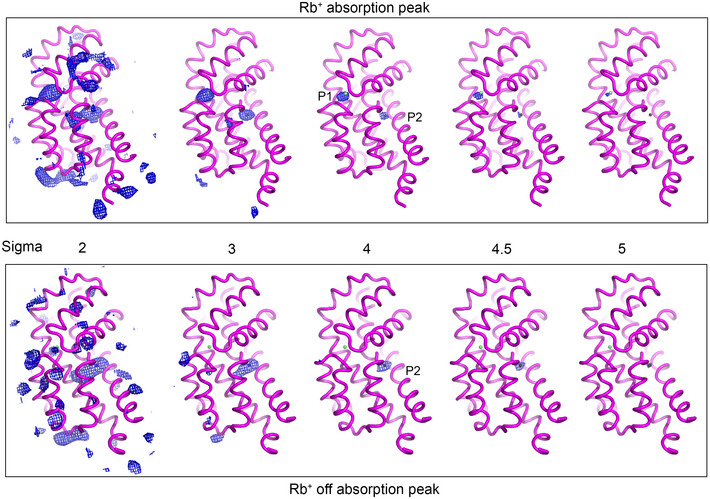
Comparison of anomalous difference maps of Rb+/Ba2+ bound EAATCRYST structure at the Rb+ absorption maximum (0.815 Å) and that of EAATCRYST‐II off the Rb+ absorption maximum (0.998 Å). Maps are contoured at increasing sigma levels around the tranD. Rb+ (green sphere) and Ba2+ (black sphere) bound to the transporters are depicted.
Calcium binding to the Na3 site
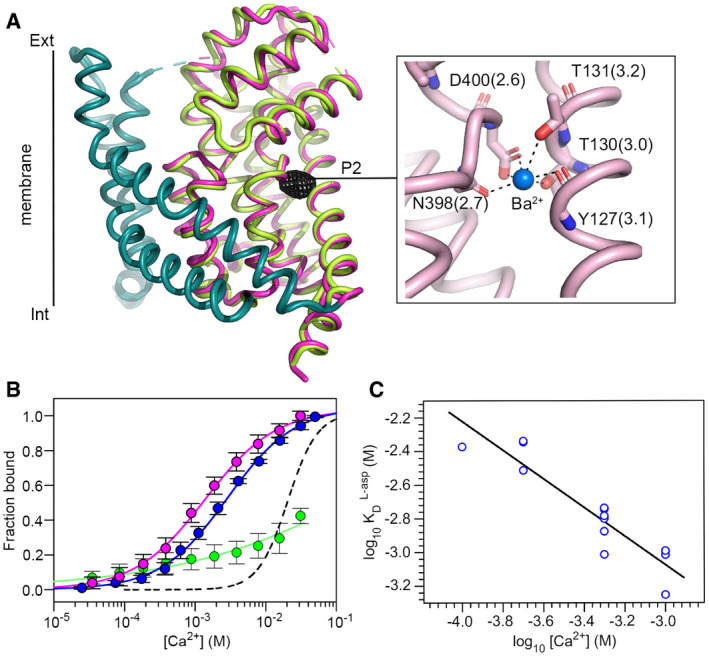
Our anomalous scattering analysis reveals a second ion bound to Na3 in the Rb+ bound EAAT1CRYST structure. In addition to Rb+ (at ~ 100 mM), crystallization conditions contain Ba2+ and Ca2+ (at ~ 25 mM), and only the former could generate significant anomalous peaks off the Rb+ absorption maximum (0.998 Å). To shed light on this problem, we solved the structure of transporters purified in the absence of substrate, Na+, and Rb+, and using choline as a substitute for monovalent cations, but otherwise under similar crystallization conditions containing Ba2+ and Ca2+. In these crystals, we found a single anomalous difference peak that corresponds to P2 (> 8σ) at Na3 (Fig 5A), consistent with Ba2+ binding at this sodium site. From a structural point of view, Ba2+ binding to Na3 would be possible through conformational changes around the 398NMDG motif, particularly at the level of N398378 that moves away from the center of the site compared to the transmitter bound structure, enabling occupancy by a larger cation than Na+ (Fig EV3).
Figure 5. Divalent cation binding.
-
ASuperimposition of Rb+/Ba2+‐and Ba2+ bound EAAT1CRYST structures with tranD is depicted in pink and green, respectively, and TM4 removed for clarity. Black mesh depicts anomalous‐difference map in the absence of Rb+ contoured at 4σ around the tranD, and inset shows details of Ba2+ coordination at Na3. Residue numbering corresponds to EAAT1WT, and the coordination distance (angstrom) is parenthesis.
-
BCa2+ binding isotherms of EAAT1CRYST at pH = 7.4 in the presence (pink) and absence (blue) of UPCH101. Mutation D400380N at Na3 strongly impairs Ca2+ binding (green). Symbols represent average and s.e.m. values of at least three independent experiments. Solid lines represent fits of Hill equation and dashed line is the fit in Fig 1C (blue line) corresponding to Na+ binding.
-
CLog‐log plot of L‐asp KD as a function of Ca2+ (n = 13).
Data information: in (B) symbols represent average and s.e.m. values of at least three independent titrations. In (C), blue symbols represent individual KD values from n number of independent titrations.
Figure EV3. Transmitter and sodium binding sites in Na+/transmitter‐ and Rb+ bound structures.
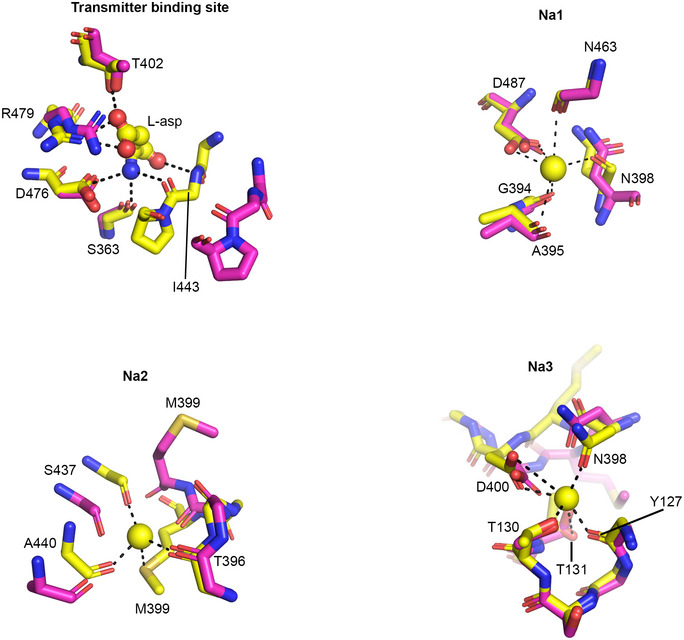
Conformational re‐arrangements around the transmitter and three Na+ binding sites in Na+/transmitter‐ (yellow) and Rb+ bound (pink) EAATCRYST structures.
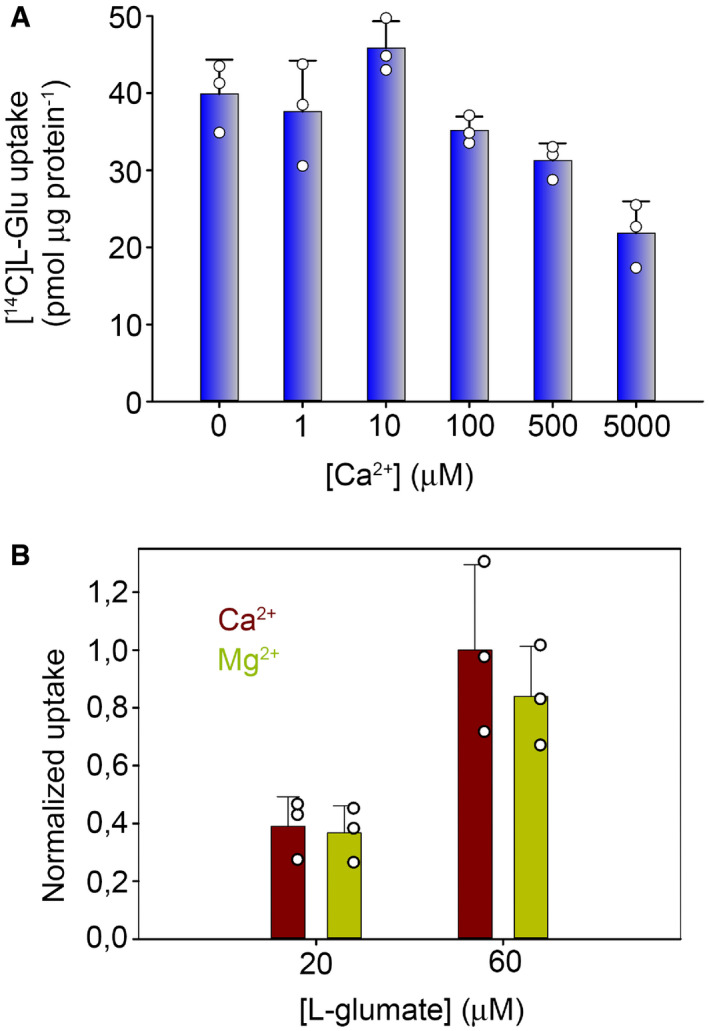
From a functional perspective, Ba2+ binding to a conserved Na+‐binding site in EAATs raises the interesting possibility that physiologically‐relevant analog Ca2+ would also bind there. Ca2+ and Ba2+ binding to EAAT1CRYST transporters was confirmed by changes in intrinsic‐tryptophan fluorescence and showed several important features: Ca2+ binds apo transporters with KD = 2.9 ± 0.4 mM in a non‐cooperative manner (nH = 0.9 ± 0.1), and mutation D400380N increased its KD by at least an order of magnitude (Fig 5B), consistent with binding of one calcium ion to Na3; Ca2+ binding parameters were not significantly affected by the allosteric inhibitor UCPH101 (KD = 1.4 ± 0.1 mM; nH = 0.9 ± 0.03), implying that Ca2+ affinities to outward‐ and inward‐facing states are comparable; Ca2+ (and Ba2+), but not K+, significantly increased Na+ apparent KD (Fig EV4), indicating competitive binding between Ca2+ (or Ba2+) and Na+, as well as lack of K+ affinity for Na1 and Na3; binding of the substrate was thermodynamically coupled to one Ca2+ (CE = −0.8 ± 0.1) (Fig 5C), as expected for a cation that binds to Na3. In addition, reconstituted transmitter uptake in liposomes demonstrates that Ca2+ is not counter‐transported (Fig 4A), at least not at rates comparable to K+ or Rb+, suggesting that a cation bound to Na3 is not able to form a translocation complex to relocate the substrate binding site. However, Ca2+ weakly inhibited transport with half‐maximal inhibitory concentrations (IC50) ~ 5 mM, when added to K+‐containing intraliposomal side, but it lacked effect when added to the Na+/transmitter‐containing extracellular solution in cells (Fig EV5A and B). Lack of extracellular Ca2+ effect on steady‐state transport is likely due to competition to much stronger Na+/H+/transmitter coupled binding, while intra‐liposomal Ca2+ inhibition could be due to facilitation of transmitter re‐binding inside the liposome, as Ca2+ and transmitter binding are thermodynamically coupled.
Figure EV4. Na+ titrations in different ionic conditions.
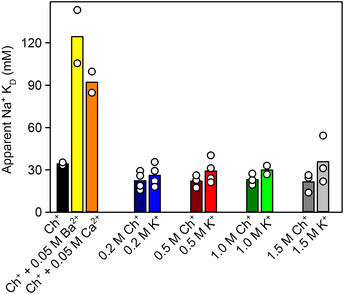
EAAT1CRYST apparent Na+ KD significantly increased upon addition of 50 mM Ba2+ or Ca2+ to a choline (Ch+)‐based cuvette buffer, but were not modified when Ch+ in the buffer was substituted for K+ at concentrations up to 1.5 M. Bar plots present average of at least two independent experiments (empty circles).
Figure EV5. Ca2+ effect on steady‐state transmitter transport.
-
AEffect of intra‐liposomal Ca2+ on L‐glutamate transport in the presence of opposite gradients of Na+ and K+.
-
BEffect of 5 mM extracellular Ca2+ on L‐glutamate transport in cells expressing EAAT1CRYST. There was not significant change in Na+‐induced L‐glutamate uptake upon substitution of extracellular Ca2+ for Mg2+, a divalent cation that does not induce changes in Trp fluorescence or compete for Na+ (not shown).
From a physiological perspective, Ca2+/transmitter coupling could play a regulatory role of Ca2+ in glutamate transport at tripartite synapses. Fine astrocytic processes at the synapse undergo transient increases in intracellular [Ca2+] ([Ca2+]i) and modulate neuronal activity by increasing the amount of extracellular neurotransmitter available (Bazargani & Attwell, 2016). One potential mechanism linking these two phenomena is that at physiological glutamate intracellular concentrations in astrocytes (mM), [Ca2+]i transients could promote re‐binding of the transmitter to EAATs, slowing down glutamate transport and increasing the amount of transmitter available at the synapse. Testing that and other hypotheses regarding the effect of extracellular and/or intracellular Ca2+ on transmitter transport will require further experimentation, including time‐resolved techniques.
Conformational changes associated to ion counter transport
Rb+/Ba2+ bound EAAT1CRYST structure shows extensive and concerted conformational changes on the extracellular half of the tranD compared to the Na+/transmitter bound state (Fig 4B). The helical arms of HP2 and TM8a, and to a lesser extent the extracellular part of TM3, TM6, and TM7, move outward and towards the scaD, while the tip of HP2 is in an open position stabilized by a ~ 90‐degree rotation of M399379 sidechain towards the extracellular side and separated from the tip of HP1 by as much as ~ 11 Å. These movements expose the tranD core to the bulk and enable hydration of the transmitter, Na+, and H+ binding sites, as well as distort sodium and transmitter coordination (Fig EV3): backbone and sidechain movements of N398378 and M399379, at the conserved 398NMDG motif, break Na+ coordination at Na1‐3, while those of HP2, T402382, and R479459 disrupt transmitter’s binding site.
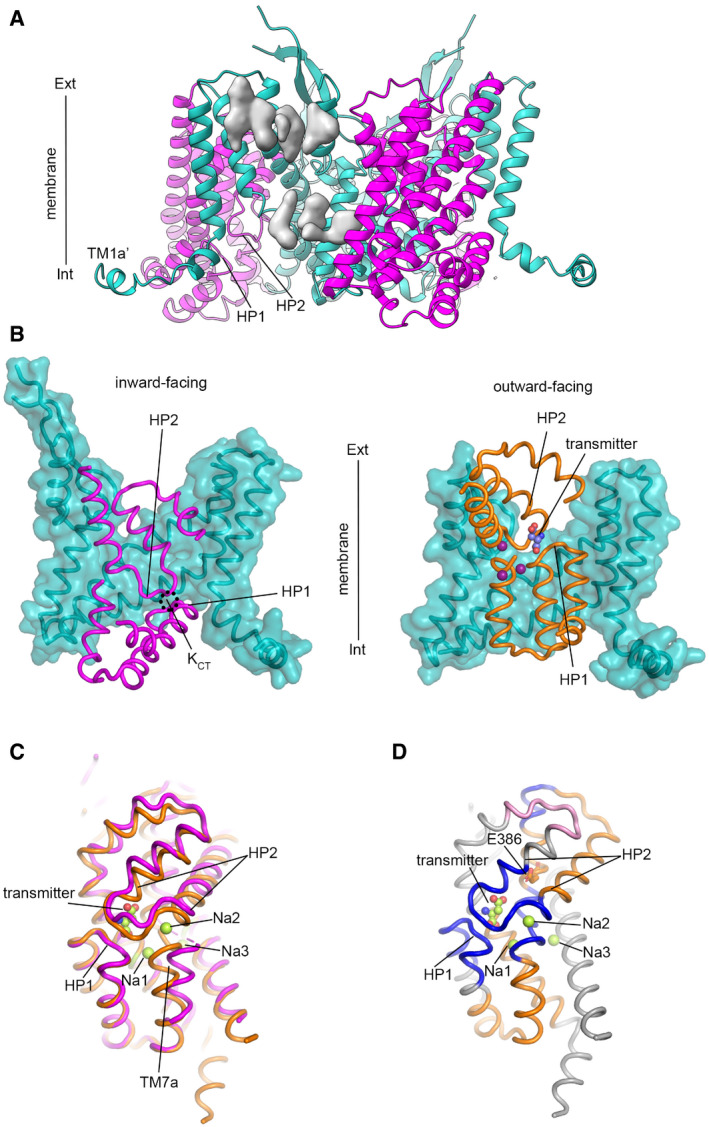
The outward‐facing open states seen in the structures of apo transporters (Rb+/Ba2+ and Ba2+ bound, respectively) are nearly identical (Fig 5A), suggesting that the presence of divalent cations in the crystallization buffer and/or crystal contacts might restrict conformational changes of the tranD. Moreover, the open position of HP2 should preclude transmembrane movements of the tranD and therefore, these structures likely represent intermediates of the transport cycle that do not correspond to the K+ translocation complex. To overcome these limitations, we determined the cryo‐EM structure of EAAT1WT purified in a K+‐based buffer (in the absence of other monovalent and divalent coupled cations, as well as transmitter and UCPH101) at an overall ~ 4.0 Å resolution (Fig 6A and Appendix Fig S3). The quality of the cryo‐EM map was better in the scaD than in tranD, likely reflecting the dynamic nature of the latter (Appendix Fig S4), and we observed non‐protein density for lipid or detergent molecules at the scaD‐tranD, as well as at intersubunit interfaces suggesting a regulatory role of lipids in tranD dynamics and trimer stability, respectively.
Figure 6. CryoEM structure and HDX‐MS changes in K+ buffer.
-
ACryoEM structure of EAAT1WT trimer with tranDs and scaDs depicted in magenta and teal, respectively. Non‐protein extra density corresponding to lipid/detergent molecules is depicted in grey.
-
BComparison of EAAT1WT (left) and EAAT1CRYST (right) structures in inward‐ and outward‐facing states, respectively. Several TMs were removed for clarity.
-
CTranDs from EAAT1WT (magenta) and EAAT1CRYST (orange) structures are overlapped using HP1 as reference.
-
DK+‐induced HDX increase (blue) and decrease (pink) in EAAT1CRYST is mapped on Na+/transmitter bound tranD structure. Unchanged regions (orange) and those outside HDX‐MS sequence coverage (grey) are also shown.
The cryo‐EM structure shows a symmetric EAAT1WT trimer in an inward‐facing state with TM1a and TM1a’ laying nearly parallel to the membrane, as well as two long beta‐strands between TM4b‐c in the scaD protruding outside the membrane plane, resembling the ones observed in human ASCT2 (Garaeva et al, 2018). Consistent with an elevator‐like mechanism, the entire tranD undergoes a large movement that translocates ligand‐binding sites across the membrane, moving them by as much as 18 Å into the cytoplasmic side (Fig 6B). Notably, the tranD backbone adopts a different conformation compared to that in Na+/transmitter and Rb+/Ba2+ bound crystal structures, respectively (Fig 6C). The extracellular half of the tranD, including HP2 and TM8a, moves outward and towards the scaD expanding the tranD core compared to the Na+/transmitter bound state, but to a lesser extent than in the Rb+/Ba2+ bound state. In the cytoplasmic part of the tranD, TM7a moves away from HP1b at the level of Na1. Yet, the tip of HP2 remains in contact with that of HP1 in a close position. The concerted backbone movements of the tranD have several important mechanistic implications: separation of HP2a, HP1b, and TM7a away from each other disrupts backbone‐atom coordination at Na1, Na2, and transmitter binding sites; concomitantly, close proximity of HP1 and HP2 tips suggests that backbone carbonyl oxygen atoms of I423403 and/or P424404 (HP2 tip) could contribute to counter‐transported ion coordination and occlusion at KCT and, therefore, that the tranD adopts an occluded state competent for K+ translocation.
To gain further insight into K+‐induced conformational changes outside the context of the crystal lattice, we compared hydrogen–deuterium exchange linked to mass spectrometry (HDX‐MS) profiles of transporters at 25°C in the Na+/transmitter and K+ buffers, respectively (Fig 6D and Appendix Figs S5 and S6). EAAT1WT was not amenable to HDX‐MS analysis due rapid and irreversible unfolding at 25°C (Cirri et al, 2018). Hence, we probed thermostabilized EAAT1CRYST using short deuterium‐labeling time (1 min) to avoid unfolding events and in the presence of UCPH101 to restrict the conformational sampling to outward‐facing states. Indeed, transporters in K+ compared to Na+/transmitter buffers showed a significant increase in HDX that localizes to the tip of HP1 and HP2, as well as the NMDG motif. These regions lack secondary structure, in both transmitter and counter‐transported ion bound states, and contain key residues for Na+ and transmitter coordination. Therefore, the observed changes in HDX imply that K+ induces a significant increase in backbone hydration around the ligand binding sites, which is in excellent agreement with the conformational expansion of the tranD core observed in both crystal and cryoEM structures of apo transporters. Importantly, K+‐induced HDX changes reverted fully upon adding back Na+/transmitter (Appendix Fig S6, control condition), demonstrating that transporters remain folded and respond to addition of ligands and that observed HDX changes were not due to unfolding events of purified protein assayed at 25°C.
Discussion
Based on our structural and thermodynamic analyses, we propose a complete Na+, H+, and K+ coupled neurotransmitter transport mechanism that unifies a wealth of structural and biophysical data on SLC1 proteins (Fig 7). In this mechanism, Na+ binding to Na1‐Na3 and protonation of E406386 are thermodynamically coupled to transmitter binding and occlusion and lead to the formation of the transmitter translocation complex, represented by EAAT1CRYST Na+/transmitter bound crystal structure (Fig 2A–D). In turn, K+ binding to KCT promotes self‐occlusion and formation of a K+ translocation complex that excludes the transmitter, and it is represented by EAAT1WT cryo‐EM structure (Fig 6A and B).
Figure 7. EAAT1 3Na+/1H+/1K+ coupled transport mechanism.
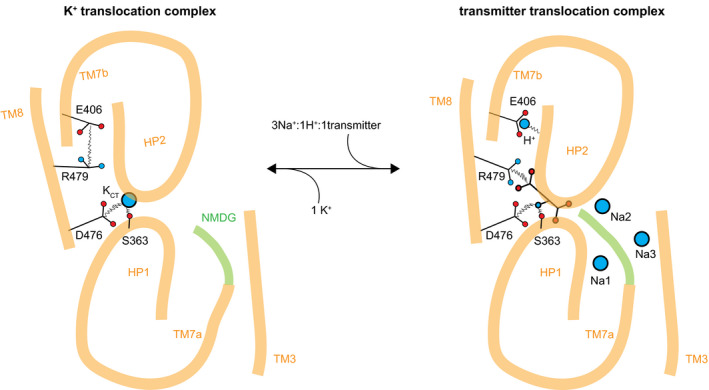
Cartoon representation of Na+/H+/transmitter, and K+ translocation complexes, respectively.
Cooperative Na+ binding to Na1 and Na3 in apo EAAT1CRYST enables substrate binding through re‐arrangements of the NMDG signature motif that resemble those observed in SLC1 archaeal homologs (Verdon et al, 2014; Guskov et al, 2016), and this process is independent of both H+ and K+. Sodium‐saturated apo‐transporters undergo three key thermodynamically coupled events that lead to substrate occlusion under HP2 and the formation of transmitter translocation complex: Na+ binding to Na2 stabilizes HP2a against TM7a; protonation of E406386 in TM7b enables hydrogen‐bonding with HP2b; and transmitter binding secures closure of HP2 tip through direct coordination.
What are then the events that lead to formation of the K+ translocation complex? Our results demonstrate counter‐transported ion binding to KCT, as well as hydration of the tranD core associated to K+, strongly suggesting that these are key events to form the translocation complex. Importantly, KCT fulfills two essential requirements as counter‐transported ion–binding site, first it precludes transmitter binding preventing futile transport cycles and potentially‐cytotoxic release of glutamate and second, it promotes formation of a competent occluded state that enables elevator‐like movements of the tranD, as suggested by the closed position of HP2 in EAAT1WT cryo‐EM structure. Early reports predicted counter‐transported ion–binding sites similar to KCT and mutually‐exclusive transmitter and K+ binding mechanisms (Holley & Kavanaugh, 2009; Wang et al, 2013; Verdon et al, 2014), in excellent agreement with our results. However, this view has been challenged by computational and functional studies that highlighted the role of Na1, as a likely counter‐transported ion–binding site (Kortzak et al, 2019; Wang et al, 2020). Several lines of experimental evidence presented here argue against that proposal: first, crystals grown in ~100 mM counter‐transported ion (Rb+) do not show anomalous‐scattering peaks at Na1, revealing lack of ion occupancy at this site (Figs 4B and EV2); second, K+ concentrations up to 1.5 M have no significant effect on cooperative Na+ binding to apo transporters, arguably at Na1 and Na3, consistent with lack of K+ affinity for these sites. Moreover, Ca2+ binds to Na3 with a KD value in the low mM range and induces a large increase in Na+ apparent KD (Fig EV4). This supports the intuitive idea that significant occupancy of sodium sites by other cations impacts the apparent Na+‐binding parameter. Finally, in EAAT1WT cryo‐EM structure, solved in the presence of 100 mM K+ and absence of divalent cations, backbone movements of TM7a away from HP1 distort Na1 geometry, and it is not consistent with ion coordination at this site (Fig 6C).
The close proximity of conserved R479459 to KCT argues that electrostatic shielding of its sidechain is required for K+ occlusion and translocation, as suggested by reported apo EAAT3 structure (Qiu et al, 2021) and MD simulations (Kortzak et al, 2019), and hydration of the tranD core is likely key to this process. Both our crystal and cryo‐EM structures of apo transporters show expansions of the tranD core around the ligand binding sites, and HDX‐MS experiments confirmed increased hydration in this region. Water penetration in the tranD core should directly contribute to shield R479459 charge and more importantly induce deprotonation of E406386, enabling ionic interactions between the two residues. Hydrogen‐bonding between R479459 and T402382 could also contribute to electrostatic shielding (Fig 4B). Consistently, E406386 and T402382 are highly conserved in EAAT orthologs, but are glutamine and alanine, respectively, in ASCT ones. Therefore, we propose a dual role of E406386 and R479459 in transport: in the transmitter translocation complex, protonated E406386 contributes to transmitter occlusion through hydrogen bonding with HP2, while R479459 coordinates the gamma carboxylate group of the substrate. In the K+ translocation complex, deprotonated E406386 engages in ionic interactions with R479459, enabling K+ occlusion at KCT. Equivalent mutations to E406Q in mammalian orthologs impair both H+‐ and K+‐coupled transmitter transport (Kavanaugh et al, 1997; Grewer et al, 2003), further supporting the dual role of E406 in H+ and K+ coupling. Moreover, the cryo‐EM structure of inwardly‐open EAAT3 in apo conditions shows equivalent residues to E406 and R479 forming a salt bridge, although their roles in substrate occlusion seem different (Qiu et al, 2021), likely reflecting evolutionary differences among EAAT isoforms.
Our findings shed light on controversial and important aspects of EAATs transport cycle and suggest novel mechanisms to regulate glutamate levels at tripartite synapses.
Materials and Methods
Protein expression and purification
Genes encoding EAAT1 and thermostabilized EAAT1CRYST constructs were cloned into the pcDNA3.1(+) plasmid (Invitrogen) as previously described with N‐terminal Strep‐tag II affinity tag, eGFP and PreScission site(Canul‐Tec et al, 2017). Protein was expressed in HEK293F cells (Thermo Fisher Scientific) grown in Freestyle293 medium (Invitrogen) at 37°C to densities of 2.5 × 10⁶ cells/ml. Cells were transiently transfected using 7.5 mg/ml polyethylenimine (PEI) (Polysciences) and 2.5 mg/ml of DNA. Transfected cells were diluted with an equivalent volume of Freestyle293 medium 8 h post‐transfection and treated with 10 mM of sodium butyrate (Sigma) 12 h after dilution. Cells were harvested by centrifugation 48 h after transfection, resuspended at 1:4 (w/v) ratio in cold buffer containing 50 mM HEPES/Tris‐base, pH 7.4, 50 mM NaCl, 1 mM L‐asp, 1 mM EDTA, 1 mM Tris(2‐carboxyethyl) phosphine (TCEP), 1 mM Phenylmethylsulfonyl fluoride (PMSF), and 1:200 (v/v) dilution of mammalian protease inhibitor cocktail (Sigma) and flash‐frozen in liquid nitrogen for storage at −80°C.
Cell suspension was thawed and diluted 1:2 volumes in buffer complemented with 350 mM NaCl, 10% glycerol, 1% dodecanoyl sucrose (DDS, Anatrace), and 0.2% cholesteryl hemisuccinate Tris salt (CHS, Anatrace). After 1 h detergent extraction, cell debris was removed (4,500 g, 0.5 h), and the supernatant cleared (186,000 g for 1 h). Clear lysate was incubated with Strep‐Tactin Sepharose High Performance resin (GE Healthcare) previously equilibrated with buffer containing 50 mM HEPES/Tris‐base, pH 7.4, 200 mM NaCl, 1 mM L‐asp, 1 mM TCEP, 5% glycerol, 0.05% DDS, and 0.01% CHS, for 2 h. In crystallization experiments of apo transporters in Rb+ or choline buffers (see below) resin incubation was preceded by an ultracentrifugation membrane‐wash step, as described before (Canul‐Tec et al, 2017). Resin was washed with 20 column volumes (CV) of equilibration buffer supplemented with 1:1:1 lipid mixture of 1‐palmitoyl‐2‐oleoyl‐sn‐glycero‐3‐phosphocholine (POPC), 1‐palmitoyl‐2‐oleoyl‐sn‐glycero‐3‐phosphoethanolamine (POPE) and 1‐palmitoyl‐2‐oleoyl‐sn‐glycero‐3‐phosphoglycerol (POPG) (Avanti Polar Lipids) at total concentration of 25 μM. Protein was eluted with buffer supplemented with 2.5 mM D‐desthiobiotin (Sigma) and subjected to N‐term PreScission cleavage during 2 h. The sample was concentrated with 100‐kDa cutoff Amicon centrifugal filter unit (Millipore) and injected into a size‐exclusion chromatography (SEC) column Superose 6 10/300 (GE Healthcare), equilibrated in different buffers (see below). All purification steps were carried out at 4°C.
Intrinsic‐tryptophan fluorescence binding assay
PreScission‐treated EAAT1CRYST and mutant transporters were further purified by SEC in buffer containing: HEPES/Tris‐base, pH 7.4, 200 mM NaCl, 1 mM L‐asp, 1 mM TCEP, 5% glycerol, 0.05% DDS, 0.01% CHS and 25 μM lipid mix. Peak fractions were concentrated using a 100‐kDa cutoff Amicon centrifugal filter and then diluted 10‐fold in buffer: 50 mM HEPES/Tris‐base, pH 7.4, 200 mM ChCl, 1 mM TCEP, 0.05% DDS and 0.01% CHS. This procedure was repeated three times to ensure buffer exchange. Binding experiments started by further diluting transporters ~ 100‐fold in a 1‐ml quartz cuvette filled with the aforementioned Ch+‐based buffer to reach 2–4 μM final protomer concentration. In L‐asp titrations, final NaCl or CaCl2 concentrations were added to the cuvette as indicated in the Figures. To assay binding of ligands in the presence of UCPH101, 20 μM final concentration was added to both protein sample and cuvette and allowed for ~30 min equilibration time. Binding experiments at different pH values were done by substituting HEPES/Tris‐base with MES/Tris‐base (pH 5 and 6), or Tris/HCl (pH 9 and 10) in the cuvette buffer.
Experiments were done at 25°C under stirring. Intrinsic tryptophan fluorescence was excited at 280 nm, and emission was recorded at 325 nm using a QuantaMaster 40 spectrofluorometer (Horiba). Protein samples were equilibrated for 2 min in the cuvette, before ligand addition at different concentrations, and fluorescence emission was averaged over the last 10 s after equilibration. Fractional fluorescence changes were fitted to the Hill equation. Data analysis, fitting, and figures were done with SigmaPlot 12 (Systat Software, Inc).
Crystallization and structure determination
PreScission‐treated transporters were supplemented with 100 µM UCPH101 (Abcam) for 30 min at 4°C and further purified by SEC in buffers at pH 7.4 (HEPES/Tris‐base), containing 1 mM TCEP, 5% glycerol, 100 µM UCPH101, 0.25% decanoyl sucrose (DS, Merck Millipore), 0.05% CHS, 25 μM lipid mix, and one of the following: 200 mM Na and 1 mM L‐asp (Na+/asp bound state); 200 mM RbCl (Rb+/Ba2+ bound state); or 200 mM ChCl (Ba2+ bound state). Peak fractions were concentrated to 4 mg/ml, supplemented with 0.2% n‐Octyl‐b‐D‐glucopyranoside (BOG, Anatrace) and 0.04% CHS, and used immediately for crystallization. Vapor‐diffusion hanging‐drop crystallization and cryogenic conditions were as previously described (Canul‐Tec et al, 2017), using equal volumes of sample and a reservoir solution containing 100 mM Tris, pH 8.2, 28–32% (v/v) PEG 400, 50 mM CaCl2 and 50 mM BaCl2.
Complete and highly‐redundant X‐ray diffraction datasets were collected at tunable beamlines PROXIMA‐1 (SOLEIL synchrotron, St. Aubin, France), as well as ID29 and ID30B (European Synchrotron Radiation Facility, Grenoble, France). EAAT1CRSYT and EAAT1CRYST‐II crystals purified in Rb+‐ or Ch+‐based buffers were smaller and typically diffracted at significant lower resolutions (> 6 Å) than those purified in Na+/asp based buffers (< 4 Å), and they required larger crystal‐screening efforts to collect datasets at the reported resolutions.
Diffraction datasets were processed as described before (Canul‐Tec et al, 2017) using XDS package (Kabsch, 2010) and AIMLESS (Evans & Murshudov, 2013). All crystals belonged to the same space group (P63) and diffracted anisotropically. Anisotropy correction was made with STARANISO (Global Phasing Lim.). Appendix Tables S1 and S2 include comparison of reflection statistics before and after anisotropic correction reflecting complete sampling of reciprocal space, as well as refinement statistics of reflections along crystallographic axes. Corrected anisotropic amplitudes were used for molecular replacement in PHASER (McCoy et al, 2007), using TranD and ScaD of EAAT1CRYST or EAAT1CRYST‐II (PDB codes 5LLM and 5LM4, respectively) as independent search models. Final electron density maps were obtained through rounds of manual building in COOT (Emsley et al, 2010) and refinement in Buster (Blanc et al, 2004), until reaching good crystallographic statistics and stereochemistry (Appendix Tables S1 and S2). Anomalous difference maps were calculated with SHELX and ANODE (Thorn & Sheldrick, 2011) using diffraction data with high‐resolution cutoff of 6 Å and without anisotropic correction.
In the Na+/asp bound EAAT1CRYST structure, we modelled extra electron density in the tranD (TM7‐HP2 loop, residues 397–403) and in the scaD N‐terminus (TM1a’ helix, residues 26–36). Rounds of refinement with extended transporter models incrementally improved the quality of 2Fo‐Fc maps and yielded three peaks in the Fo‐Fc omit maps that localize to conserved Na1‐Na3. We modelled 3 Na+ bound to the transporter at these peaks. We also calculated anomalous differences maps and observed a single anomalous peak on the surface of the ScaD, nearby residue Q245 (TM5), that we modeled as a bound barium ion with low occupancy (0.35). Our functional and structural data do not support functional roles of this ion on the transport mechanism.
Rb+/Ba2+ and Ba2+ bound electron density maps of apo transporters, respectively, were lower resolution than Na+/asp bound. This is likely due to the observed conformational re‐arrangements of the tranD that break or weaken crystal‐lattice contacts between TM1a’ and extracellular tranD surface of a crystallographic‐symmetry mate. Consistently, in Rb+/Ba2+ and Ba2+ bound structures, respectively, TM7‐HP2 loop and TM1a’ were not modeled due to lack of density in these regions. Rb+ at KCT, as well as Ba2+ at Na3 were modeled based on anomalous difference maps from datasets at maximum and off‐maximum Rb+ absorption wavelengths, respectively.
Atomic model validation was performed with Molprobity (Chen et al, 2010). Structural figures were prepared with PyMOL Molecular Graphics System (Schrodinger, LLC).
Cryo‐EM sample preparation, data collection, and processing
EAAT1WT (Uniprot P43003) sequence was mutated at predicted N‐glycosylation sites (N206T, and N216T), expressed, and purified as mentioned above, with SEC buffer containing 50 mM HEPES/Tris‐base, pH 7.4, 100 mM KCl, 1 mM TCEP, 0.0084% glycol‐diosgenin (GDN), and 0.0017% CHS. Peak fractions were concentrated at 4–5 mg/ml and spotted immediately on glow‐discharged Quantifoil R1.2/1.3 Au grids (Quantifoil Micro Tools GmbH) and plunge frozen using a Vitrobot Mark IV (FEI) at 4°C under 100% humidity. Grids were stored in liquid nitrogen.
Cryo‐EM micrographs were recorded on a Titan Krios electron microscope (Thermo Fisher Scientific) operated at 300 kV, equipped with GatanK2 direct electron detector (Appendix Table S3). Movies were collected on counting mode automatically using SerialEM (Mastronarde, 2005) with a pixel size of 0.814 Å. The defocus range was −0.8 to −2.0 μm, and each movie contained 40 frames with a dose per frame of 1.03 electrons/Å2 and total exposure time 8 s.
Single‐particle data processing was done in cryoSPARCv3.1.0 (Punjani et al, 2017) (Appendix Fig S3). Beam‐induced patch‐motion correction and patch contrast transfer function estimation were done with in‐built cryoSPARC routines, respectively. During then, 2,298,481 auto‐picked particles were 2× binned and extracted from 13,607 manually selected movies. Initially, 517,319 selected from 2D‐classification were subjected to several rounds of ab initio classification. This yielded a 3D reconstruction from 71,296 particles in which the transmembrane helices of the transporter were evident, but refined at > 6 Å using unbinned particles for nonuniform refinement (Punjani et al, 2020). We then input those ab initio volumes to re‐classify the original set of 2,298,481 2×‐binned particles using several rounds of heterogenous refinement. In the first round of heterogenous refinement, two unrelated cryo‐EM maps were included as templates to aid discarding bad particles. From this, 433,972 particles were selected and unbinned for further rounds of heterogenous refinement and ab initio classification. An ab initio 3D reconstruction from a final set of 34,433 particles yielded a map at an overall ~ 4.0 Å, after nonuniform refinement with C3 symmetry imposed. The map quality was significantly better in the region corresponding to the scaD than that of the tranD. This is somehow expected, since the three tranDs undergo independent conformational changes both relative to the three scaDs, as well as locally.
For model building, the scaD and tranD of Rb+/Ba2+ bound X‐ray structure were fitted into the EM map as separate rigid bodies using Chimera. This initial model was then adjusted manually in COOT preserving the secondary structure observed in the crystal. We also used the cryoEM structure of ASCT2 (PDB 6GCT) (Garaeva et al, 2018) as a reference for regions of the tranD that were not modeled in the crystal structure and for which we had density in the cryo‐EM map. We omitted conserved residues 398NMD400 in the final cryo‐EM model due to lack of density in this region. The final model was refined in PHENIX (Adams et al, 2010), and figures made with UCSF Chimera (Pettersen et al, 2004), UCSF ChimeraX (Goddard et al, 2018), and PYMOL.
Radioactive substrate transport assays
Liposomes were formed at 5:1 molar ratio of POPC and cholesteryl hemisuccinate (Avanti Polar Lipids) and resuspended at 8 mg/ml in buffer containing 50 mM HEPES/Tris, pH 7.4 and 200 mM NaCl, and pre‐treated with 1.3% DDS and 0.26% CHS for 1 h. eGFP‐EAAT1CRYST fusion construct was purified by SEC in buffer containing HEPES/Tris‐base, pH 7.4, 200 mM NaCl, 1 mM L‐asp, 1 mM TCEP, 5% glycerol, 0.05% DDS, 0.01% CHS, and 25 μM lipid mix. Purified eGFP‐EAAT1Cryst was mixed with destabilized liposomes at a 1:40 (w/w, protein/lipid ratio) for 1 h. Detergent removal was repeated three times with Biobeads SM‐2 (BioRad) at 100 mg/ml and at 4°C. Proteoliposomes were loaded with internal buffer (50 mM HEPES/Tris‐base, pH 7.4 buffer, 200 mM KCl and 1.25% glycerol) through 10 freeze–thaw cycles followed by 10 extrusion cycles through 400‐nm polycarbonate membranes (Avanti Polar Lipids). Proteoliposomes were centrifuged (164,300 g, 30 min at 4°C) and resuspended at 100 mg of lipids per ml in buffer containing 50 mM HEPES/Tris‐base, pH 7.4, 200 mM choline chloride (ChCl) and 1.25% glycerol for immediate use.
Substrate uptake was performed at 37°C for 30 min and initiated by diluting proteoliposomes 10‐fold into buffer containing 50 mM HEPES/Tris‐base, pH 7.4, 200 mM NaCl, 1.25% glycerol, 50 µM L‐glutamate, and 10 µM L‐[14C(U)]‐glutamate (PerkingElmer). Uptake was stopped with a 5‐fold dilution of proteo‐liposome mix into ice‐cold buffer (50 mM HEPES/Tris‐base, pH 7.4, 200 mM ChCl and 1.25% glycerol) followed by immediate filtration and wash on nitrocellulose 0.22‐µm filters (Merck Millipore). Background radioactivity was estimated on each sample using proteoliposomes diluted in buffer containing 200 mM ChCl, instead of NaCl, and subtracted during analysis. Filter membranes were transferred to scintillation cocktail Ultima Gold (PerkinElmer), and radioactivity quantified using Tri‐Carb 3110TR counter (PerkinElmer). This setup was used to calibrate different batches of radioactive L‐glutamate source. Protein quantification was done in an Infinite M1000Pro microplate reader (Tecan) using calibrated eGFP fluorescence intensity.
Uptake experiments at different pH values were done with modified external buffers containing 50 mM MES/Tris‐base pH 6.0, HEPES/Tris‐base pH 7.4 or 50 mM Tris/HCl pH 9.0 or 10.0. Counter‐transported ions were probed by exchanging KCl in the intraliposomal buffer for equal concentrations of RbCl, or ChCl, or 125 mM ChCl and 50 mM CaCl2 through freezing‐thawing cycles. Reported values are means of at least three independent experiments, each one measured at least in triplicates.
In HEK293‐cells uptake experiments, cells were collected 36–44 h after transfection, washed two times, and resuspended at a density of 50 × 106 cells per ml in buffer 11 mM HEPES/Tris‐base, pH 7.4, 140 mM ChCl, 4.7 mM KCl, 2.5 mM CaCl2, 1.2 mM MgCl2, and 10 mM D‐glucose, for immediate use. Substrate uptake was performed as described in liposomes with some variations. For experiments shown in Appendix Fig S1, reaction time was 1 min in buffer containing 11 mM HEPES/Tris‐base, pH 7.4, 140 mM NaCl, 4.7 mM KCl, 2.5 mM CaCl2, 1.2 mM MgCl2, 10 mM D‐glucose, 50 μM L‐glutamate, and 5 μM [14C] L‐glutamate. For experiments shown in Fig EV5, reaction time was 15 min in buffer containing 11 mM HEPES/Tris‐base, pH 7.4, 140 mM NaCl, 4.7 mM KCl, 5 mM CaCl2, 10 mM D‐glucose, and either 50 μM L‐glutamate/10 μM [14C] L‐glutamate, or 15 μM L‐glutamate/5 μM [14C] L‐glutamate. In Mg2+‐containing conditions, all Ca2+ was substituted for Mg2+.
Cells were filtered using 0.8‐μm nitrocellulose filters, and background radioactivity was estimated from cells transfected with empty vector in NaCl reaction buffer and subtracted from the uptake data. Reported values are means of three independent experiments measured in duplicates.
Hydrogen–deuterium exchange mass spectrometry (HDX‐MS)
PreScission‐treated EAAT1CRYST was further purified by SEC in buffer containing: HEPES/Tris‐base, pH 7.4, 200 mM NaCl, 1 mM L‐asp, 1 mM TCEP, 5% glycerol, 0.05% DDS, 0.01% CHS, 25 μM lipid mix, and 100 µM UCPH101. This sample constitutes reference Na+/L‐asp bound state. K+ bound state was obtained by two cycles of 10‐fold dilution concentration of reference samples in buffer: 50 mM HEPES/Tris‐base, pH 7.4, 200 mM KCl, 1 mM TCEP, 100 µM UCPH101, 0.05% DDS and 0.01% CHS. To probe reversibility of K+‐induced HDX changes, a Na+/L‐asp bound control state was generated by addition of 200 mM NaCl and 1 mM L‐asp to the K+ bound state. Final concentration of all samples for HDX‐MS analysis was ~0.8 mg/ml.
The peptide map was generated using nanoLC‐MS/MS. 20 pmol of reference transporters were digested for 2 min in 0.75% formic acid using an immobilized pepsin column (2.1 × 20 mm, Affipro). Peptic peptides were collected and purified onto C18 Stage‐Tips before nanoLC‐MS/MS analysis using an EASY‐nLC™ 1200 system (Thermo‐Scientific) coupled to the nanoelectrospray ion source of an Orbitrap Q‐Exactive Plus mass spectrometer (Thermo‐Scientific). Peptides were loaded on an in‐house packed nano‐HPLC column (75 µm × 25 cm) with C18 resin (Aeris PEPTIDE XB‐C18, 1.7 μm particles, 100 Å pore size, Phenomenex) and separated by reverse‐phase chromatography at 250 nl/min using a gradient of acetonitrile with 0.1% formic acid. The Orbitrap mass spectrometer was set up in the data‐dependent acquisition mode. After a survey scan in the Orbitrap (resolution 60,000 at m/z 400), the 10 most intense precursor ions were selected for HCD fragmentation with a normalized collision energy set up to 28 (resolution 30,000). Only charge states between 1 and 10 were selected and a dynamic exclusion of 20 s was set. NanoLC‐MS/MS data were processed automatically using Mass Spec Studio v1.3.2 (Rey et al, 2014) to identify peptides with the following parameters: 4–40 amino acid length, charge states between 1 and 5, mass accuracy of 7 ppm for both MS and MS/MS, and a false discovery rate (FDR) of 5%.
Deuterium exchange was initiated by diluting 64 pmol of purified transporter with the appropriate labeling buffers at 25°C. These buffers reached final level of 80% D2O and otherwise were as described above for reference, K+ bound and control states, respectively. 30 pmol transporter aliquots were removed at 60s, and immediately quenched with a cold acidic solution (1.25% formic acid) to decrease the pH to 2.5. Samples were then snap‐frozen in liquid nitrogen and stored at −80°C until LC‐MS analysis.
Quenched samples were rapidly thawed and injected into a cooled ACQUITY UPLC M‐Class HDX system (Waters) maintained at 4°C. Then, 15 pmol of transporter were online digested for 3 min at 20°C and 80 µl/min of solvent A (0.15% formic acid (v/v) in water) using an immobilized pepsin column (2.1 × 20 mm, Affipro). Peptic peptides were desalted onto a C18 trap column (Kinetex® EVO C18, 2.6 µm, 100 Å, 2.1 × 20 mm, Phenomenex) at a flow rate of 80µl/min of solvent A and then separated at 70 µl/min by a linear gradient from 10 to 60% of solvent B (0.15% formic acid (v/v) in acetonitrile) in 11 min using a C18 analytical column (Kinetex® EVO C18, 1.7 µm, 100 Å, 1 × 100 mm, Phenomenex). The pepsin column was washed with 1.5 M guanidinium chloride/5% acetonitrile/1% formic acid. Blank injections were performed between each run to ensure the absence of carry‐over. The LC flow was directed to a Synapt™ G2‐Si HDMS™ mass spectrometer (Waters) equipped with an electrospray ionization (ESI) source. Mass spectra were acquired in the positive and resolution mode over the m/z range of 300–1,500 with 0.5 s scan time.
Data analysis was performed on biological triplicates using at least five replicates per transporter state. Deuterium uptake values were calculated for each peptide using Mass Spec Studio v1.3.2, and no adjustment was made for back‐exchange. Student t‐tests and Woods plots were performed for each transporter state using the embedded statistical module in Mass Spec Studio v1.3.2 with the following parameters: standard deviation cutoff = 2 and 1‐p cutoff = 0.99.
Data availability
Atomic coordinates of crystal structures were deposited in the RCSB Protein Data Bank (PDB) under the following accession numbers: Na+/transmitter bound EAAT1CRYST (7AWM; https://doi.org/10.2210/pdb7AWM/pdb); Na+/transmitter bound EAAT1CRYST‐E386Q (7AWQ; https://doi.org/10.2210/pdb7AWQ/pdb); Rb+/Ba2+ bound EAAT1CRYST (7AWN; https://doi.org/10.2210/pdb7AWN/pdb); Rb+/Ba2+ bound EAAT1CRYST‐II (7AWP; https://doi.org/10.2210/pdb7AWP/pdb); and Ba2+ bound EAAT1CRYST‐II (7AWL; https://doi.org/10.2210/pdb7AWL/pdb). Atomic coordinates and cryo‐EM map of EAAT1WT structure were deposited in the PDB (7NPW; https://doi.org/10.2210/pdb7NPW/pdb) and Electron Microscopy Data Bank (EMD‐12524; https://www.emdataresource.org/EMD‐12524). In‐house script to facilitate reflection processing with STARANISO (P.L.) is available at (https://raw.githubusercontent.com/legrandp/xdsme/master/bin/noarch/run_xds2staraniso.sh).
Author contributions
JCC‐T optimized and performed protein expression, purification, and crystallization, as well as binding and transport assays; AK prepared and optimized cryo‐EM grids and collected cryo‐EM data. AK and NR analyzed cryo‐EM data and built the structure. RA performed molecular biology and uptake experiments in cells; JCC‐T and NR designed binding and uptake experiments, and analyzed those data; JD performed and analyzed HDX‐MS experiments; MR and JC‐R designed and analyzed HDX‐MS experiments; JCC‐T collected crystallographic data; JCC‐T, PL, and NR analyzed diffraction data; JCC‐T and NR analyzed structures and prepared the manuscript, with contributions and edits related to HDX from JD, MR, and JC‐R, and those related to X‐ray crystallography from PL; NR conceived and supervised the project.
Conflict of interest
The authors declare that they have no conflict of interest.
Supporting information
Appendix
Expanded View Figures PDF
Acknowledgements
The authors thank Ahmed Haouz and the staff at the crystallogenesis core facility of the Institut Pasteur for assistance with crystallization screens and staff at Synchrotron Soleil and the European Synchrotron Radiation Facility for assistance with data collection. The IECB cryoEM imaging facility is acknowledged for support in cryo‐EM sample screening and initial data acquisition; the EMBL‐Heildelberg Cryo‐Electron Microscopy Service Platform for support in cryoEM data collection. The work was funded by the European Research Council (ERC grant 309657 to NR). JCC‐T was partly supported by a Pasteur‐Roux Postdoctoral Fellowship. Further support from Institut Pasteur, INCA 2017‐44 Grant, CACSICE grant (ANR‐11‐EQPX‐008), and CNRS UMR3528 to NR and JC‐R is acknowledged.
The EMBO Journal (2022) 41: e108341
References
- Adams PD, Afonine PV, Bunkoczi G, Chen VB, Davis IW, Echols N, Headd JJ, Hung LW, Kapral GJ, Grosse‐Kunstleve RW et al (2010) PHENIX: a comprehensive Python‐based system for macromolecular structure solution. Acta Crystallogr D Biol Crystallogr 66: 213–221 [DOI] [PMC free article] [PubMed] [Google Scholar]
- Akyuz N, Altman RB, Blanchard SC, Boudker O (2013) Transport dynamics in a glutamate transporter homologue. Nature 502: 114–118 [DOI] [PMC free article] [PubMed] [Google Scholar]
- Alleva C, Kovalev K, Astashkin R, Berndt MI, Baeken C, Balandin T, Gordeliy V, Fahlke C, Machtens JP (2020) Na(+)‐dependent gate dynamics and electrostatic attraction ensure substrate coupling in glutamate transporters. Sci Adv 6: eaba9854 [DOI] [PMC free article] [PubMed] [Google Scholar]
- Barbour B, Brew H, Attwell D (1988) Electrogenic glutamate uptake in glial cells is activated by intracellular potassium. Nature 335: 433–435 [DOI] [PubMed] [Google Scholar]
- Bastug T, Heinzelmann G, Kuyucak S, Salim M, Vandenberg RJ, Ryan RM (2012) Position of the third Na+ site in the aspartate transporter GltPh and the human glutamate transporter, EAAT1. PLoS One 7: e33058 [DOI] [PMC free article] [PubMed] [Google Scholar]
- Bazargani N, Attwell D (2016) Astrocyte calcium signaling: the third wave. Nat Neurosci 19: 182–189 [DOI] [PubMed] [Google Scholar]
- Blanc E, Roversi P, Vonrhein C, Flensburg C, Lea SM, Bricogne G (2004) Refinement of severely incomplete structures with maximum likelihood in BUSTER‐TNT. Acta Crystallogr D Biol Crystallogr 60: 2210–2221 [DOI] [PubMed] [Google Scholar]
- Boudker O, Ryan RM, Yernool D, Shimamoto K, Gouaux E (2007) Coupling substrate and ion binding to extracellular gate of a sodium‐dependent aspartate transporter. Nature 445: 387–393 [DOI] [PubMed] [Google Scholar]
- Canul‐Tec JC, Assal R, Cirri E, Legrand P, Brier S, Chamot‐Rooke J, Reyes N (2017) Structure and allosteric inhibition of excitatory amino acid transporter 1. Nature 544: 446–451 [DOI] [PMC free article] [PubMed] [Google Scholar]
- Chen VB, Arendall WB 3rd, Headd JJ, Keedy DA, Immormino RM, Kapral GJ, Murray LW, Richardson JS, Richardson DC (2010) MolProbity: all‐atom structure validation for macromolecular crystallography. Acta Crystallogr D Biol Crystallogr 66: 12–21 [DOI] [PMC free article] [PubMed] [Google Scholar]
- Cirri E, Brier S, Assal R, Canul‐Tec JC, Chamot‐Rooke J, Reyes N (2018) Consensus designs and thermal stability determinants of a human glutamate transporter. eLife 7: e40110 [DOI] [PMC free article] [PubMed] [Google Scholar]
- Crisman TJ, Qu S, Kanner BI, Forrest LR (2009) Inward‐facing conformation of glutamate transporters as revealed by their inverted‐topology structural repeats. Proc Natl Acad Sci USA 106: 20752–20757 [DOI] [PMC free article] [PubMed] [Google Scholar]
- Emsley P, Lohkamp B, Scott WG, Cowtan K (2010) Features and development of Coot. Acta Crystallogr D Biol Crystallogr 66: 486–501 [DOI] [PMC free article] [PubMed] [Google Scholar]
- Erecinska M, Wantorsky D, Wilson DF (1983) Aspartate transport in synaptosomes from rat brain. J Biol Chem 258: 9069–9077 [PubMed] [Google Scholar]
- Erkens GB, Hanelt I, Goudsmits JM, Slotboom DJ, van Oijen AM (2013) Unsynchronised subunit motion in single trimeric sodium‐coupled aspartate transporters. Nature 502: 119–123 [DOI] [PubMed] [Google Scholar]
- Evans PR, Murshudov GN (2013) How good are my data and what is the resolution? Acta Crystallogr D Biol Crystallogr 69: 1204–1214 [DOI] [PMC free article] [PubMed] [Google Scholar]
- Ewers D, Becher T, Machtens JP, Weyand I, Fahlke C (2013) Induced fit substrate binding to an archeal glutamate transporter homologue. Proc Natl Acad Sci USA 110: 12486–12491 [DOI] [PMC free article] [PubMed] [Google Scholar]
- Garaeva AA, Oostergetel GT, Gati C, Guskov A, Paulino C, Slotboom DJ (2018) Cryo‐EM structure of the human neutral amino acid transporter ASCT2. Nat Struct Mol Biol 25: 515–521 [DOI] [PubMed] [Google Scholar]
- Garaeva AA, Guskov A, Slotboom DJ, Paulino C (2019) A one‐gate elevator mechanism for the human neutral amino acid transporter ASCT2. Nat Commun 10: 3427 [DOI] [PMC free article] [PubMed] [Google Scholar]
- Gesemann M, Lesslauer A, Maurer CM, Schonthaler HB, Neuhauss SC (2010) Phylogenetic analysis of the vertebrate excitatory/neutral amino acid transporter (SLC1/EAAT) family reveals lineage specific subfamilies. BMC Evol Biol 10: 117 [DOI] [PMC free article] [PubMed] [Google Scholar]
- Goddard TD, Huang CC, Meng EC, Pettersen EF, Couch GS, Morris JH, Ferrin TE (2018) UCSF ChimeraX: Meeting modern challenges in visualization and analysis. Protein Sci 27: 14–25 [DOI] [PMC free article] [PubMed] [Google Scholar]
- Grewer C, Watzke N, Rauen T, Bicho A (2003) Is the glutamate residue Glu‐373 the proton acceptor of the excitatory amino acid carrier 1? J Biol Chem 278: 2585–2592 [DOI] [PubMed] [Google Scholar]
- Grewer C, Balani P, Weidenfeller C, Bartusel T, Tao Z, Rauen T (2005) Individual subunits of the glutamate transporter EAAC1 homotrimer function independently of each other. Biochemistry 44: 11913–11923 [DOI] [PMC free article] [PubMed] [Google Scholar]
- Groeneveld M, Slotboom DJ (2007) Rigidity of the subunit interfaces of the trimeric glutamate transporter GltT during translocation. J Mol Biol 372: 565–570 [DOI] [PubMed] [Google Scholar]
- Guskov A, Jensen S, Faustino I, Marrink SJ, Slotboom DJ (2016) Coupled binding mechanism of three sodium ions and aspartate in the glutamate transporter homologue GltTk. Nat Commun 7: 13420 [DOI] [PMC free article] [PubMed] [Google Scholar]
- Heinzelmann G, Kuyucak S (2014) Molecular dynamics simulations of the mammalian glutamate transporter EAAT3. PLoS One 9: e92089 [DOI] [PMC free article] [PubMed] [Google Scholar]
- Holley DC, Kavanaugh MP (2009) Interactions of alkali cations with glutamate transporters. Philos Trans R Soc Lond B Biol Sci 364: 155–161 [DOI] [PMC free article] [PubMed] [Google Scholar]
- Jensen AA, Erichsen MN, Nielsen CW, Stensbol TB, Kehler J, Bunch L (2009) Discovery of the first selective inhibitor of excitatory amino acid transporter subtype 1. J Med Chem 52: 912–915 [DOI] [PubMed] [Google Scholar]
- Kabsch W (2010) XDS. Acta Crystallogr D Biol Crystallogr 66: 125–132 [DOI] [PMC free article] [PubMed] [Google Scholar]
- Kanner BI, Sharon I (1978) Active transport of L‐glutamate by membrane vesicles isolated from rat brain. Biochemistry 17: 3949–3953 [DOI] [PubMed] [Google Scholar]
- Kavanaugh MP, Bendahan A, Zerangue N, Zhang Y, Kanner BI (1997) Mutation of an amino acid residue influencing potassium coupling in the glutamate transporter GLT‐1 induces obligate exchange. J Biol Chem 272: 1703–1708 [DOI] [PubMed] [Google Scholar]
- Koch HP, Larsson HP (2005) Small‐scale molecular motions accomplish glutamate uptake in human glutamate transporters. J Neurosci 25: 1730–1736 [DOI] [PMC free article] [PubMed] [Google Scholar]
- Kortzak D, Alleva C, Weyand I, Ewers D, Zimmermann MI, Franzen A, Machtens JP, Fahlke C (2019) Allosteric gate modulation confers K(+) coupling in glutamate transporters. EMBO J 38: e101468 [DOI] [PMC free article] [PubMed] [Google Scholar]
- Larsson HP, Wang X, Lev B, Baconguis I, Caplan DA, Vyleta NP, Koch HP, Diez‐Sampedro A, Noskov SY (2010) Evidence for a third sodium‐binding site in glutamate transporters suggests an ion/substrate coupling model. Proc Natl Acad Sci USA 107: 13912–13917 [DOI] [PMC free article] [PubMed] [Google Scholar]
- Leary GP, Stone EF, Holley DC, Kavanaugh MP (2007) The glutamate and chloride permeation pathways are colocalized in individual neuronal glutamate transporter subunits. J Neurosci 27: 2938–2942 [DOI] [PMC free article] [PubMed] [Google Scholar]
- Lehre KP, Danbolt NC (1998) The number of glutamate transporter subtype molecules at glutamatergic synapses: chemical and stereological quantification in young adult rat brain. J Neurosci 18: 8751–8757 [DOI] [PMC free article] [PubMed] [Google Scholar]
- Mastronarde DN (2005) Automated electron microscope tomography using robust prediction of specimen movements. J Struct Biol 152: 36–51 [DOI] [PubMed] [Google Scholar]
- Matin TR, Heath GR, Huysmans GHM, Boudker O, Scheuring S (2020) Millisecond dynamics of an unlabeled amino acid transporter. Nat Commun 11: 5016 [DOI] [PMC free article] [PubMed] [Google Scholar]
- McCoy AJ, Grosse‐Kunstleve RW, Adams PD, Winn MD, Storoni LC, Read RJ (2007) Phaser crystallographic software. J Appl Crystallogr 40: 658–674 [DOI] [PMC free article] [PubMed] [Google Scholar]
- Nayal M, Di Cera E (1996) Valence screening of water in protein crystals reveals potential Na+ binding sites. J Mol Biol 256: 228–234 [DOI] [PubMed] [Google Scholar]
- Nelson PJ, Dean GE, Aronson PS, Rudnick G (1983) Hydrogen ion cotransport by the renal brush border glutamate transporter. Biochemistry 22: 5459–5463 [DOI] [PubMed] [Google Scholar]
- Pajarillo E, Rizor A, Lee J, Aschner M, Lee E (2019) The role of astrocytic glutamate transporters GLT‐1 and GLAST in neurological disorders: potential targets for neurotherapeutics. Neuropharmacology 161: 107559 [DOI] [PMC free article] [PubMed] [Google Scholar]
- Pettersen EF, Goddard TD, Huang CC, Couch GS, Greenblatt DM, Meng EC, Ferrin TE (2004) UCSF Chimera–a visualization system for exploratory research and analysis. J Comput Chem 25: 1605–1612 [DOI] [PubMed] [Google Scholar]
- Punjani A, Rubinstein JL, Fleet DJ, Brubaker MA (2017) cryoSPARC: algorithms for rapid unsupervised cryo‐EM structure determination. Nat Methods 14: 290–296 [DOI] [PubMed] [Google Scholar]
- Punjani A, Zhang H, Fleet DJ (2020) Non‐uniform refinement: adaptive regularization improves single‐particle cryo‐EM reconstruction. Nat Methods 17: 1214–1221 [DOI] [PubMed] [Google Scholar]
- Qiu B, Matthies D, Fortea E, Yu Z, Boudker O (2021) Cryo‐EM structures of excitatory amino acid transporter 3 visualize coupled substrate, sodium, and proton binding and transport. Sci Adv 7 [DOI] [PMC free article] [PubMed] [Google Scholar]
- Rey M, Sarpe V, Burns KM, Buse J, Baker CA, van Dijk M, Wordeman L, Bonvin AM, Schriemer DC (2014) Mass spec studio for integrative structural biology. Structure 22: 1538–1548 [DOI] [PMC free article] [PubMed] [Google Scholar]
- Reyes N, Ginter C, Boudker O (2009) Transport mechanism of a bacterial homologue of glutamate transporters. Nature 462: 880–885 [DOI] [PMC free article] [PubMed] [Google Scholar]
- Reyes N, Oh S, Boudker O (2013) Binding thermodynamics of a glutamate transporter homolog. Nat Struct Mol Biol 20: 634–640 [DOI] [PMC free article] [PubMed] [Google Scholar]
- Ruan Y, Miyagi A, Wang X, Chami M, Boudker O, Scheuring S (2017) Direct visualization of glutamate transporter elevator mechanism by high‐speed AFM. Proc Natl Acad Sci USA 114: 1584–1588 [DOI] [PMC free article] [PubMed] [Google Scholar]
- Ryan RM, Compton EL, Mindell JA (2009) Functional characterization of a Na+‐dependent aspartate transporter from Pyrococcus horikoshii . J Biol Chem 284: 17540–17548 [DOI] [PMC free article] [PubMed] [Google Scholar]
- Seal RP, Amara SG (1998) A reentrant loop domain in the glutamate carrier EAAT1 participates in substrate binding and translocation. Neuron 21: 1487–1498 [DOI] [PubMed] [Google Scholar]
- Tao Z, Rosental N, Kanner BI, Gameiro A, Mwaura J, Grewer C (2010) Mechanism of cation binding to the glutamate transporter EAAC1 probed with mutation of the conserved amino acid residue Thr101. J Biol Chem 285: 17725–17733 [DOI] [PMC free article] [PubMed] [Google Scholar]
- Thorn A, Sheldrick GM (2011) ANODE: anomalous and heavy‐atom density calculation. J Appl Crystallogr 44: 1285–1287 [DOI] [PMC free article] [PubMed] [Google Scholar]
- Verdon G, Oh S, Serio RN, Boudker O (2014) Coupled ion binding and structural transitions along the transport cycle of glutamate transporters. eLife 3: e02283 [DOI] [PMC free article] [PubMed] [Google Scholar]
- Wang H, Rascoe AM, Holley DC, Gouaux E, Kavanaugh MP (2013) Novel dicarboxylate selectivity in an insect glutamate transporter homolog. PLoS One 8: e70947 [DOI] [PMC free article] [PubMed] [Google Scholar]
- Wang J, Zhang K, Goyal P, Grewer C (2020) Mechanism and potential sites of potassium interaction with glutamate transporters. J Gen Physiol 152: 1–12 [DOI] [PMC free article] [PubMed] [Google Scholar]
- Watzke N, Rauen T, Bamberg E, Grewer C (2000) On the mechanism of proton transport by the neuronal excitatory amino acid carrier 1. J Gen Physiol 116: 609–622 [DOI] [PMC free article] [PubMed] [Google Scholar]
- Yernool D, Boudker O, Folta‐Stogniew E, Gouaux E (2003) Trimeric subunit stoichiometry of the glutamate transporters from Bacillus caldotenax and Bacillus stearothermophilus . Biochemistry 42: 12981–12988 [DOI] [PubMed] [Google Scholar]
- Yernool D, Boudker O, Jin Y, Gouaux E (2004) Structure of a glutamate transporter homologue from Pyrococcus horikoshii . Nature 431: 811–818 [DOI] [PubMed] [Google Scholar]
- Zerangue N, Kavanaugh MP (1996) Flux coupling in a neuronal glutamate transporter. Nature 383: 634–637 [DOI] [PubMed] [Google Scholar]
- Zhang Y, Bendahan A, Zarbiv R, Kavanaugh MP, Kanner BI (1998) Molecular determinant of ion selectivity of a (Na+ + K+)‐coupled rat brain glutamate transporter. Proc Natl Acad Sci USA 95: 751–755 [DOI] [PMC free article] [PubMed] [Google Scholar]
- Zhou Y, Danbolt NC (2014) Glutamate as a neurotransmitter in the healthy brain. J Neural Transm (Vienna) 121: 799–817 [DOI] [PMC free article] [PubMed] [Google Scholar]


